Download to read offline

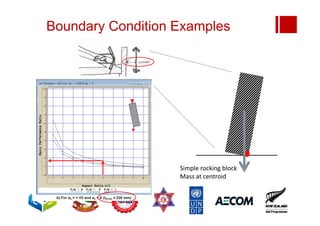


![Earthquake demand
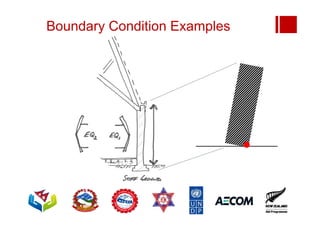
Tributary weight for half wall:
(0.9 x 18) x [(5.2 +1)/2 x 1.0 x 16]
= 787 kN
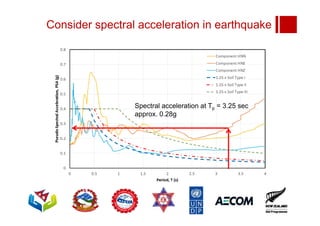
Spectral accel = 0.28g
Horiz demand = 0.28 x 787
= 220 kN
Overturning moment =
220 x 2/3 x 16 = 2352 kNm](https://image.slidesharecdn.com/module1session11boundaryconditionsandendwallseperation-240122171004-bf95376d/85/Module-1-session-11-Boundary-conditions-and-end-wall-seperation-pdf-64-320.jpg)
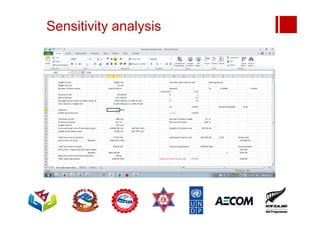
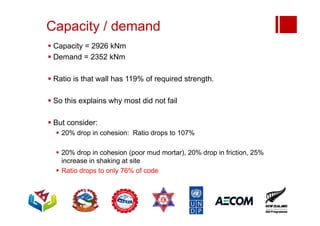
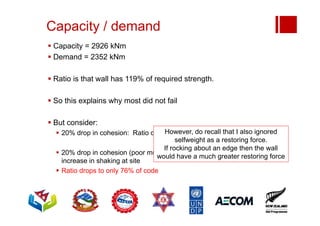
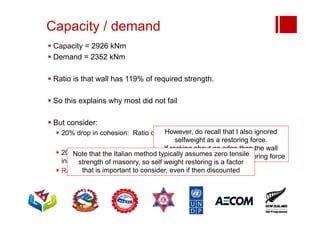

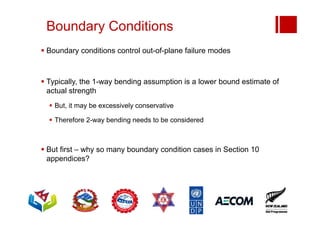
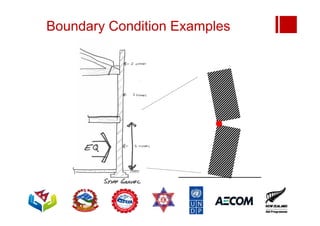
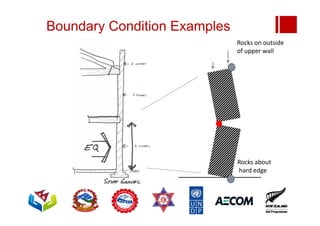
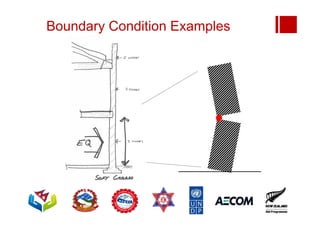
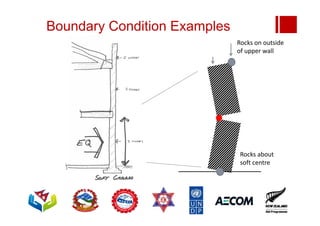
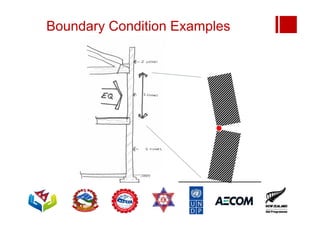
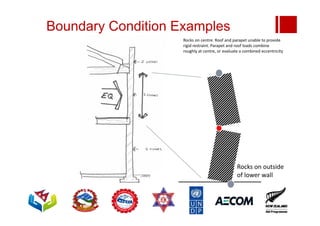
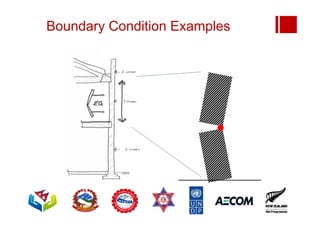
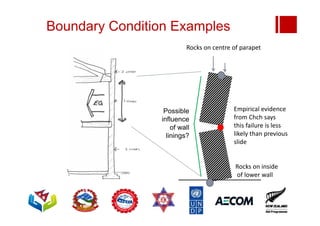
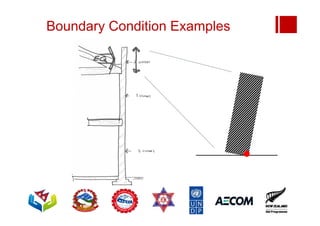
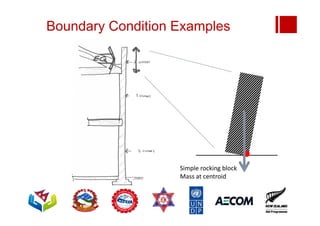
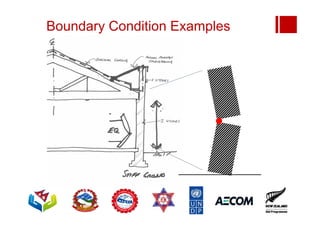
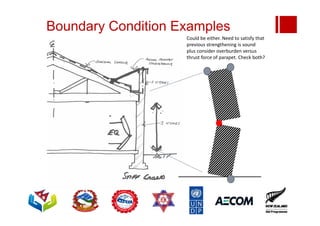
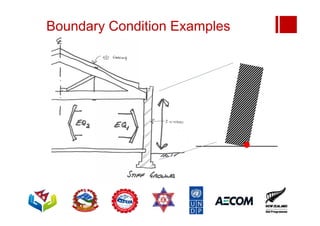
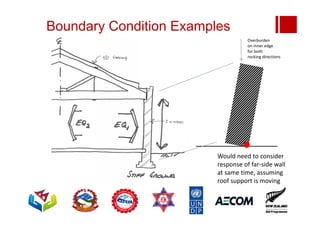
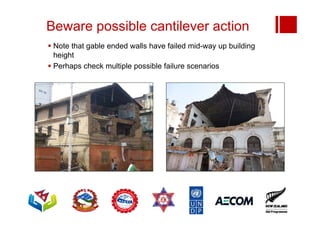
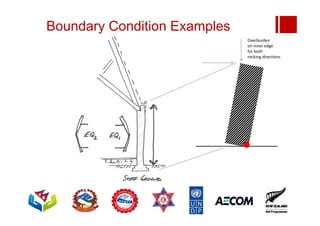
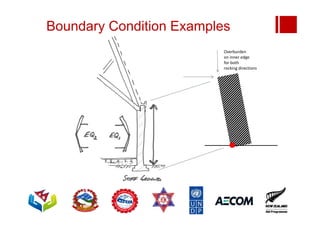
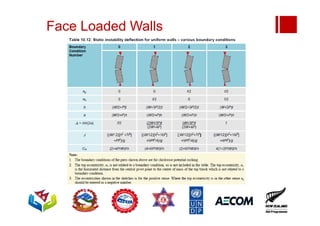
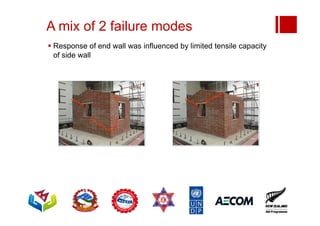
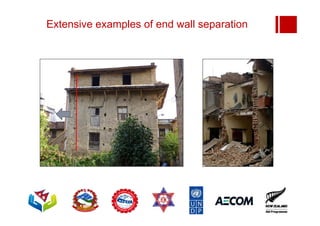
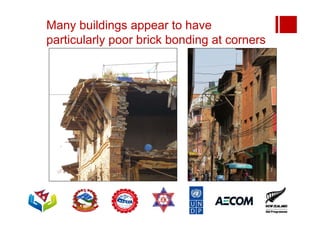
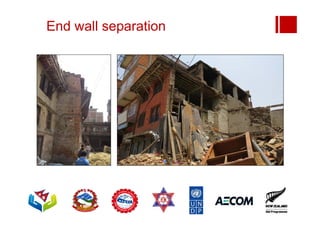
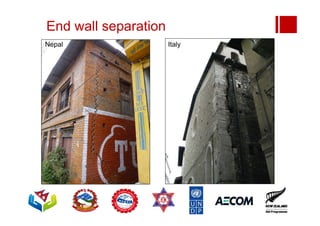
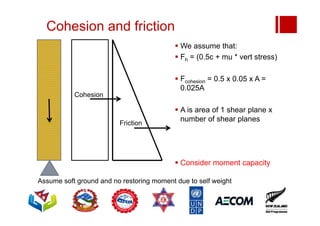
Boundary conditions and end wall separation are important factors in unreinforced masonry building assessment. Proper boundary conditions are needed to control out-of-plane failure modes. End wall separation is a common failure that can lead to two-way bending failure of the face loaded wall. A sensitivity analysis considering factors like cohesion, friction, and seismic demand shows how a wall's capacity may drop below code requirements depending on conditions. Self weight provides an important restoring force if rocking about an edge that was not considered in the analysis.


