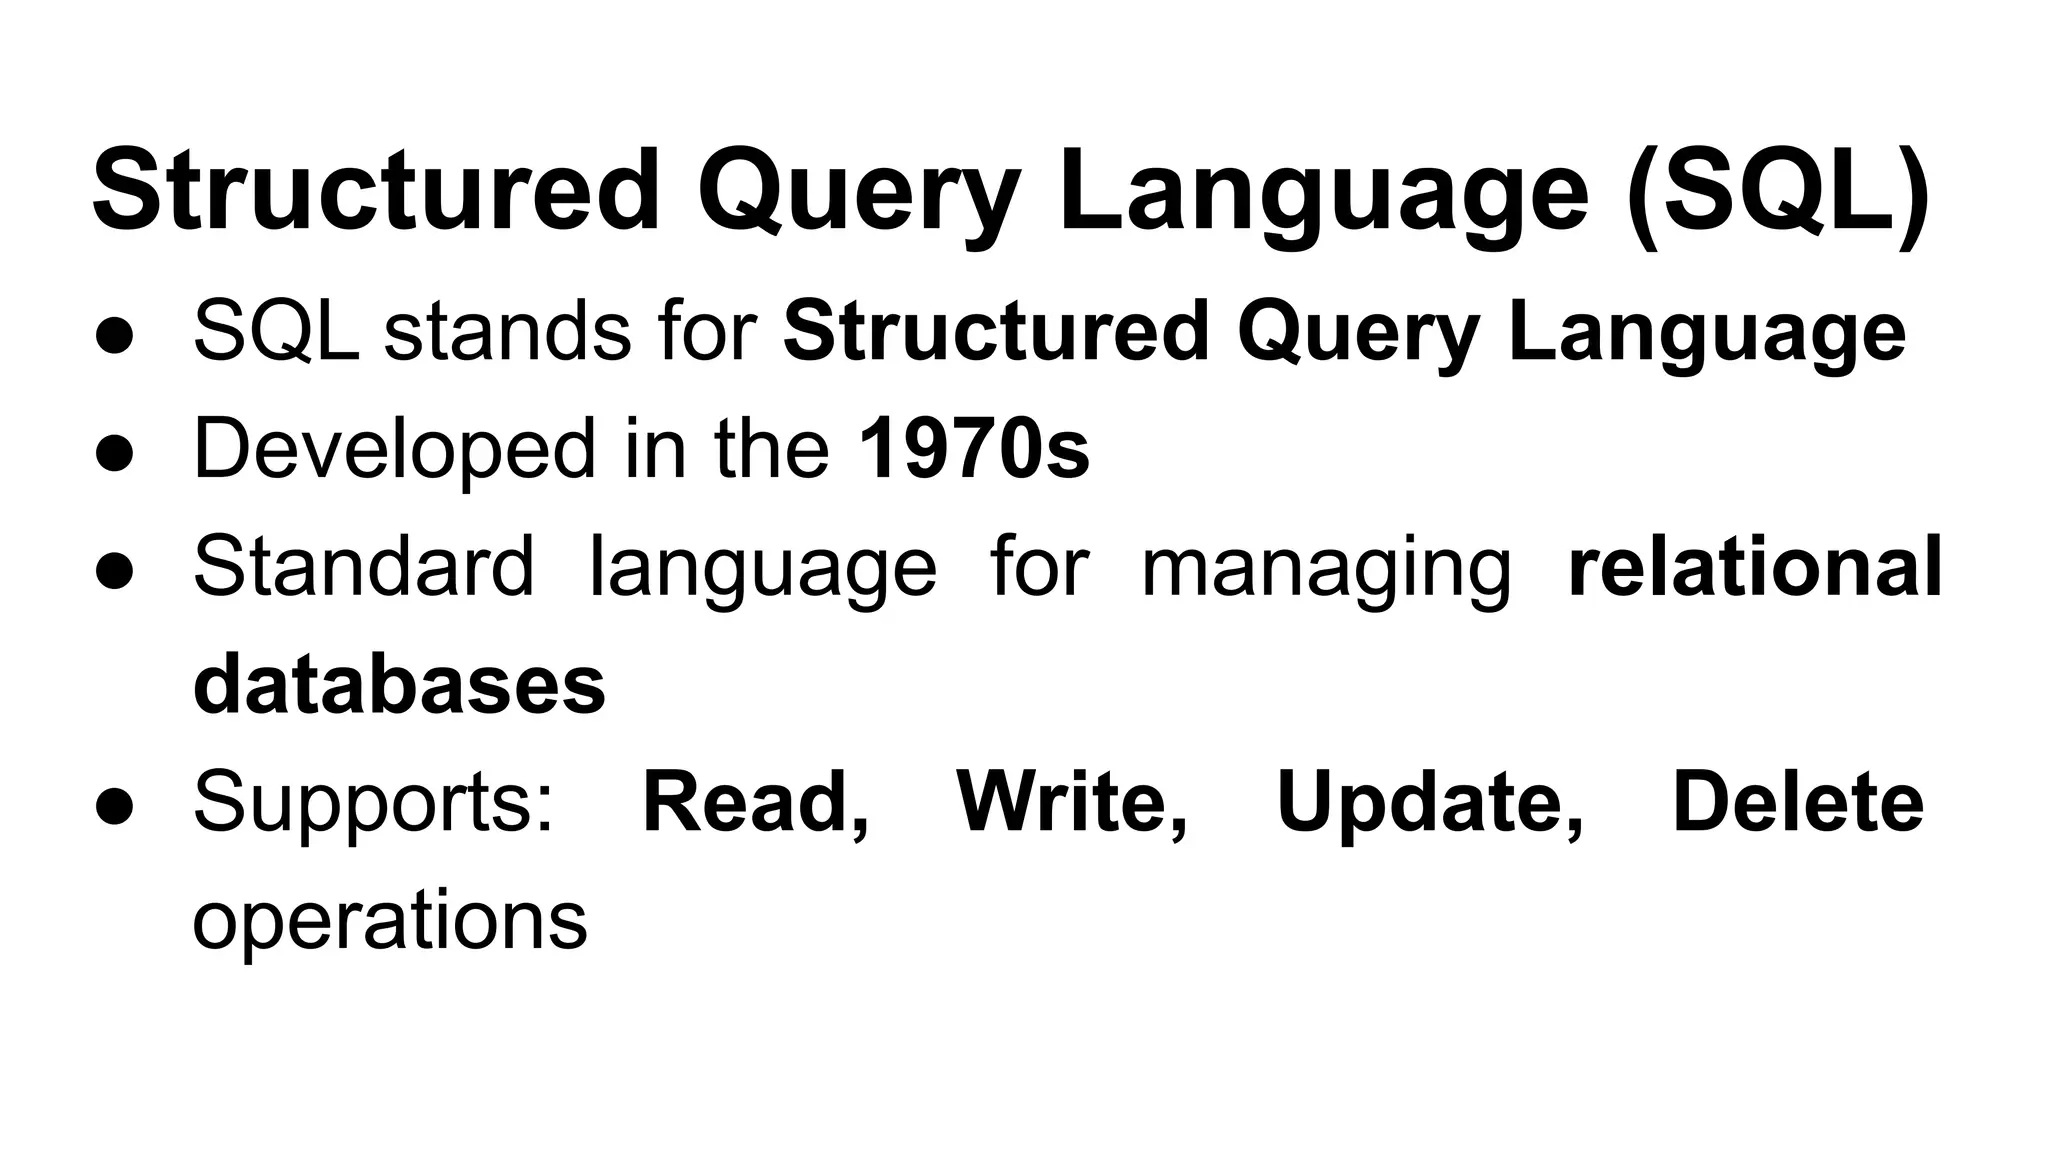
Structured Query Language(SQL)
● SQL stands for Structured Query Language
● Developed in the 1970s
● Standard language for managing relational
databases
● Supports: Read, Write, Update, Delete
operations
3.
Why SQL isPopular Among Data Analysts
✅ Access large data directly, no need to copy
✅ Handles any shape and massive size of data
✅ SQL queries are auditable and replicable
✅ Better than Excel for joining, automating, reusing
code
✅ Easy to learn — suitable for analysts, developers,
and more
5.
SQL Server inOrganizations
Used widely with enterprise applications
Supports over 36 data types
Fine-grained security control
Enables role-based access to datasets
Ideal for large-scale, secure data management
6.
SQL Key Functions
●SELECT, INSERT, UPDATE, DELETE
● JOIN operations
● Aggregation: SUM(), AVG(), COUNT()
● Filtering: WHERE, GROUP BY, HAVING
● Sorting: ORDER BY
8.
Mean Value (Average)
●Definition: Average = Sum of all values / Count
SELECT AVG(salary) AS MEAN
FROM Emp;
Output:
Mean = (1000 + 2000 + ... + 10000) / 10 = 5500
9.
Mode Value (MostFrequent Value)
Definition: Mode = Value that appears most often
SQL Code (No built-in function):
SELECT TOP 1 salary
FROM Emp
GROUP BY salary
ORDER BY COUNT(*) DESC;
Output:
Mode = No Repeating Salary → No mode
10.
Median Value (MiddleValue)
● Definition:
○ For odd count → Middle value
○ For even count → Average of two middle values
11.
SET @rindex :=-1;
SELECT AVG(m.sal) AS MEDIAN
FROM (
SELECT @rindex := @rindex + 1 AS rowindex, Emp.salary AS sal
FROM Emp
ORDER BY Emp.salary
) AS m
WHERE m.rowindex IN (FLOOR(@rindex / 2), CEIL(@rindex / 2));
Class Task: AnalyzeSales Data Using SQL (Mean,
Mode, Median)
Use SQL to calculate Mean, Mode, and Median values from a small real-time
sales dataset and interpret the results.
14.
Class Task
You areworking as a database developer for a college management system, and your task is to
design and manage a simple relational database to track students, courses, and enrollments.
Begin by creating three tables: Students (with columns: student_id, name, department),
Courses (with columns: course_id, course_name, department), and Enrollments (with columns:
enrollment_id, student_id, course_id, grade). Populate the tables using INSERT statements with at
least five student records, three course records, and six enrollment records. Use SELECT with
JOIN operations to display the list of student names along with the courses they are enrolled in,
and their corresponding grades. Apply the UPDATE command to change the grade of a student for
a particular course, and use the DELETE command to remove a student who has dropped out,
including their enrollment records. Utilize SQL aggregation functions such as COUNT(), SUM(),
and AVG() to calculate the total number of students per department and the average grade per
course. Use filtering operations like WHERE to find students with grades above 85, and apply
GROUP BY and HAVING to list departments that have more than two students. Finally, sort the
output using ORDER BY to display students and their grades in descending order. This real-time
task will help you understand how to use core SQL operations in managing a college database
efficiently.
Using SQL, calculatethe following for the Quantity
column from the SalesData table:
1. Mean Quantity – Use the AVG() function
2. Mode Quantity – Write a query to find the most frequent
quantity
3. Median Quantity – Write a query to calculate the middle
value
17.
Data Munging withSQL
● It is a phase of data transformation in the data analysis pipeline.
● Aims to convert raw data into a usable format.
● Makes data simpler to work with and easier to understand.
● May involve manual or automated steps such as:
○ Cleaning
○ Merging
○ Updating
○ Restructuring
● Helps in preparing data that is ready for analysis.
● Involves mapping data from one format to another.
● Ensures data is valuable and compatible with analytics tools.
22.
Class Task
You havebeen hired to clean and standardize raw student data
collected from multiple sources. The data contains
inconsistencies in text formatting, missing values, and
duplicate entries. Your task is to identify issues, suggest
cleaning steps, and explain how to apply string functions such
as UPPER(), LOWER(), TRIM(), LTRIM(), RTRIM(), LEFT(),
RIGHT(), and REPLACE() to correct the data — all done
manually in your notebook.
24.
1. Identify atleast 6 data quality issues present in the
above table. (e.g., duplicate records, inconsistent
casing, invalid dates, etc.)
2. List and explain the use of the string functions to
clean the data
25.
Filtering Joins andaggregation
In SQL, joins are commands used to combine rows from two or more tables.
These tables are combined based on a related column (usually a foreign key or
common field).
There are four basic types of SQL joins:
● INNER JOIN
● LEFT JOIN
● RIGHT JOIN
● FULL JOIN
Each type of join returns data differently depending on how the tables match.
A Venn diagram is the easiest way to understand and explain the difference
between these types of joins.
27.
Inner Join
1. Theinner join selects all rows from both tables as long as
there is a match between the columns.
2. This join returns those records that have matching values
in both tables.
3. If you perform an inner join operation between the Emp
table and the Dept table, all the records that have
matching values in both the tables will be given as output
29.
Left Join
1. Theleft outer join (or left join) returns all the rows of the left
side table and matching rows in the right side table of the
join.
2. The rows for which there is no matching row on the right
side, the result will contain NULL.
3. From the left table (Emp), the left join keyword returns all
records, even if there are no matches in the right tables
(Dept).
31.
Right Outer Join
1.The right outer join (or right join) returns all the
rows of the right side table and matching rows
for the left side table of the join.
2. The rows for which there is no matching row on
the left side, the result will contain NULL.
33.
Full Outer Join
1.The full outer join (or full join) returns all those
records that have a match in either the left table
(Emp) or the right table (Dept) table.
2. The joined table will contain all records from
both the tables, and if there is no matching field
on either side, then fill in NULLs.
35.
Aggregation
● SQL providesthe following built-in functions for
aggregating data.
● The COUNT() function returns the number of values
in the dataset (“salary” is column in table “Emp”)
36.
● The AVG()function returns the average of a
group of selected numeric column values.
37.
● The SUM()function returns the total sum of a
numeric column.
38.
● The MIN()function returns the minimum value in the
selected column.
39.
● The MAX()function returns the maximum value in
the selected column.
1. Apply innerjoin, full outer join, left join, right join.
2. Write a query to count how many courses each
student is enrolled in.
43.
Filtering
● The datagenerated from the reports of various application
software often results in complex and large datasets.
● This dataset may consist of redundant records or impartial
records.
● This useless data may confuse the user.
● Filtering this redundant and useless data can also make the
dataset more efficient and useful.
● Data filtering is one of the major steps involved in data science
due to various reasons, and some are listed below:
44.
Filtering
● During certainsituations, we may require a specific part of
the actual data for analysis.
● Sometimes, we may require reducing the actual retrieved
data by removing redundant records as that may result in
wrong analysis.
● Query performance can be greatly enhanced by applying
it to refined data. Also, it can reduce strain on application.
45.
● Data filteringprocess consists of different
strategies for refining and reducing datasets.
● To understand data filtering using SQL, we will
use the following dataset throughout further
queries.
47.
The above queryextracts all data from the table. An asterisk (*) in the above
simple query indicates that “select all the data” in the table. In the above query,
when we add WHERE clause with the condition after WHERE, it filters data in the
table and returns only those records that satisfy the condition given after WHERE
clause.
49.
Suppose we wantto extract details of those employees who are working in “HR”
department in the above workers table.
51.
AND OR OPERATORS
●To fetch required data, sometimes, we may require
to force two or more conditions.
● We can use AND, OR operators to achieve this.
● Only those records that satisfy all the conditions in
the query will be retrieved when AND operator is
used between two conditions.
52.
EXAMPLE
● To findworkers in the HR department who have salary more than 47,000, we
can write the query as follows:
53.
● If ORis used between two conditions, then all records that satisfy either
condition will get retrieved along with records that satisfy both conditions.
● The following query will fetch the details of the workers who are working
in the HR department or who have a salary less than 36,000.
54.
● Sometimes, wemay want to match a pattern in text data. The LIKE clause
can be used to specify a pattern matching condition.
● Two wildcards, percent sign “%” and underscore “_”, are used to specify
conditions.
● The percent sign is used to represent any string of zero or more characters,
and underscore represents a single number or character.
● For example, to retrieve ENAME that ends with character “y” of workers table
56.
● Sometimes, wemay need to filter records based on match of multiple values
in a given dataset.
● The SQL IN operator allows you to test if the given expression matches any
value in the list of values.
● If the records matched with any one of the values in the list, then it is returned
as result.
57.
● Sometimes, wemay want to exclude some values; we can use
NOT keyword in query.
● The following query returns those workers’ details whose
DEPTNAME is not “Workshop” or “Testing”
58.
SELECT query embeddedwithin the WHERE
clause of another query
● A subquery is a query within another query. A subquery (called a nested
query or subselect) is a SELECT query embedded within the WHERE
clause of another query.
● The data returned by the subquery (inner query) is used by the outer
query in the same way literal values are used.
● A subquery is used to return data that will be used in the main or the outer
query as a condition that the data must satisfy to be retrieved.
● Subqueries provide an easy way to handle the queries that depend on the
results from another query.
59.
EXAMPLE
● For example,in the following query, the inner query retrieves EID of workers
who work in “HR” department or get salary >= 40,000. The main query uses
the result of the inner query and retrieves workers’ details whose EID
matches with EIDs returned by the inner query
60.
Sometimes, we mayneed to filter records based on match of a large range of
values. You can use the keyword BETWEEN for this purpose. It allows you to
specify a start value and an end value of required range. This clause is a
shorthand representation for two conditions with >= and <= operators. For
example, to retrieve details of those workers having salary >= 30,000 and <=
45,000, we can write the query as follows
61.
NOT BETWEEN
To retrievedetails of workers whose salary is not in the range of >=
30,000 and <= 45,000, we can write the query using NOT BETWEEN
clause as follows
62.
CLASS TASK
You arepart of the HR department of a
tech company. The company has just
completed quarterly performance reviews.
You are given a table of employee data and
your job is to filter the data to answer
specific queries.
64.
1. List allemployees with a rating greater than 4.0.
2. List employees from the IT department who are
based in Chennai.
3. Find employees who have more than 5 years of
experience and are older than 30.
4. Display all employees not from the HR
department.
5. Sort the table by rating in descending order and
show the top 3 performers.
65.
CLASS TASK
Your teammanages employee data for a
multinational company. Use SQL filtering
commands to answer business queries
from the table employee_data.
67.
Filter using WHERE- List all employees from the ‘IT’ department.
Use BETWEEN - Find employees whose age is between 28 and
35.
Use NOT BETWEEN - Find employees whose salary is not
between 45,000 and 60,000.
Use IN - List employees from cities Mumbai or Delhi.
Use LIKE - List all employees whose names start with the letter
‘A’.
Combine Conditions - Find IT department employees from
Chennai who joined after 2019 and earn more than 47000.
68.
WINDOW FUNCTION ANDORDERED DATA
● SQL window functions calculate results based on a set of rows (window) rather
than a single row.
● The term “window” refers to the subset of rows used for computation.
● Similar to aggregate functions but without collapsing rows into groups.
● Aggregate functions with GROUP BY operate on entire grouped sets.
● Window functions return results per row, combining individual and grouped
attributes.
● Commonly used in the SELECT or ORDER BY clauses.
● Cannot be used in the WHERE clause.
● Called in the SELECT column list to calculate values for each row.
● The OVER() clause is used to define the window of rows.
● A query can contain multiple window functions, each operating on different
windows.
69.
WINDOW FUNCTION ANDORDERED DATA
The OVER() clause has the following subclauses:
• PARTITION BY clause to define window partitions to form
groups of rows on which window function will be applied.
• ORDER BY clause for logical sorting of rows within a
partition.
70.
To demonstrate SQLwindow function, we will use the
following “workers” table:
71.
RANK () WindowFunction
● The RANK() function returns the position of any row in the specified partition.
● The OVER and PARTITION BY functions are used to divide the result set into
partitions according to specified criteria.
● Further, ORDER BY clause can be used to sort data in ascending or
descending order based on some attribute.
75.
● The RANK()function skips the rank 5 and rank 8 in the above result because
two rows share the fourth rank and two records share the seventh rank.
● The RANK function skips the next k−1 ranks if there is a tie between k
previous ranks.
● Suppose we want to find out each employee’s salary ranks in relation to the
top salary of their department.
● This can be calculated by following math expression:
76.
The next querywill show all employees ordered by the above metric; the
employees with the lowest salary (relative to their highest departmental salary) will
be listed first.
81.
DENSE_RANK () TheDENSE_RANK () window function
calculates the rank of value in a group of rows based on
the ORDER BY expression specified in the OVER clause.
For each partition, rank starts from 1. Rows with the same
values receive the same rank. DENSE_RANK function
does not keep gaps in ranks if there is a similarity between
previous one or more rows ranks. This feature makes it
different from RANK() function
84.
NTILE()
● The SQLNTILE() function partitions a logically ordered dataset into a number
of buckets demonstrated by the expression and allocates the bucket number
to each row.
● The buckets are numbered from 1 through expression where the expression
value must result in a positive integer value for each partition.
● For example, the following query will allocate rows to three buckets.
86.
If PARTITION BYclause is excluded from the above query,
then it will give results as follows:
88.
CUME_DIST()
● CUME_DIST() TheSQL window function CUME_DIST() returns the
cumulative distribution of a value within a partition of values.
● The cumulative distribution of a value calculated by the number of
rows with values less than or equal to (<=) the current row’s value is
divided by the total number of rows.
N/totalrows
where N is the number of rows with the value less than or equal to the
current row value and total rows is the number of rows in the group or
result set. Function returns value having a range between 0 and 1.
93.
AVG()
● AVG() Awindow function applies function across a set of table rows that are
related to the current row.
● The window function does not cause rows to be clustered into a single output
row; the rows maintain their separate identities.
● The window function is able to access more than just the current row of the
query result.
● To calculate average value of each partition, we can use window function
AVG().
● To calculate average salary in each department, we can write the query as
follows:
95.
Also, moving aggregatecan be calculated by adding
ORDER BY clause along with PARTITION BY in window
function with AVG().
99.
If we wantto calculate moving sum of salaries of each
department, then we can add an ORDER BY clause in the
above query.
105.
LEAD()
● SQL LEAD()function has a capacity that gives admittance to a column at a
predefined actual counterbalance which follows the current row.
● For example, by utilizing the LEAD() function, from the current line, you can
get information of the following line, or the second line that follows the current
line, or the third line that follows the current line, etc.
114.
Assign a uniquerow number to each employee's record ordered by sales within each region.
→ Use ROW_NUMBER().
Rank employees by sales in their respective regions. Show how tied sales are handled.
→ Use RANK() and DENSE_RANK().
Divide employees into 4 performance quartiles based on their monthly sales in each region.
→ Use NTILE(4).
Find the cumulative distribution of employees within each region based on their sales.
→ Use CUME_DIST().
For each region, calculate:
● Total sales → SUM()
● Average sales → AVG()
● Highest sale → MAX()
● Lowest sale → MIN()
● Number of employees contributing sales → COUNT()
115.
(Use window functionsover partitioned data)
For each employee, show:
● This month’s sales
● The previous month’s sales → Use LAG()
● The next month’s sales → Use LEAD()
For each employee, find:
● First recorded sales value in the year →
FIRST_VALUE()
● Most recent sales value → LAST_VALUE()