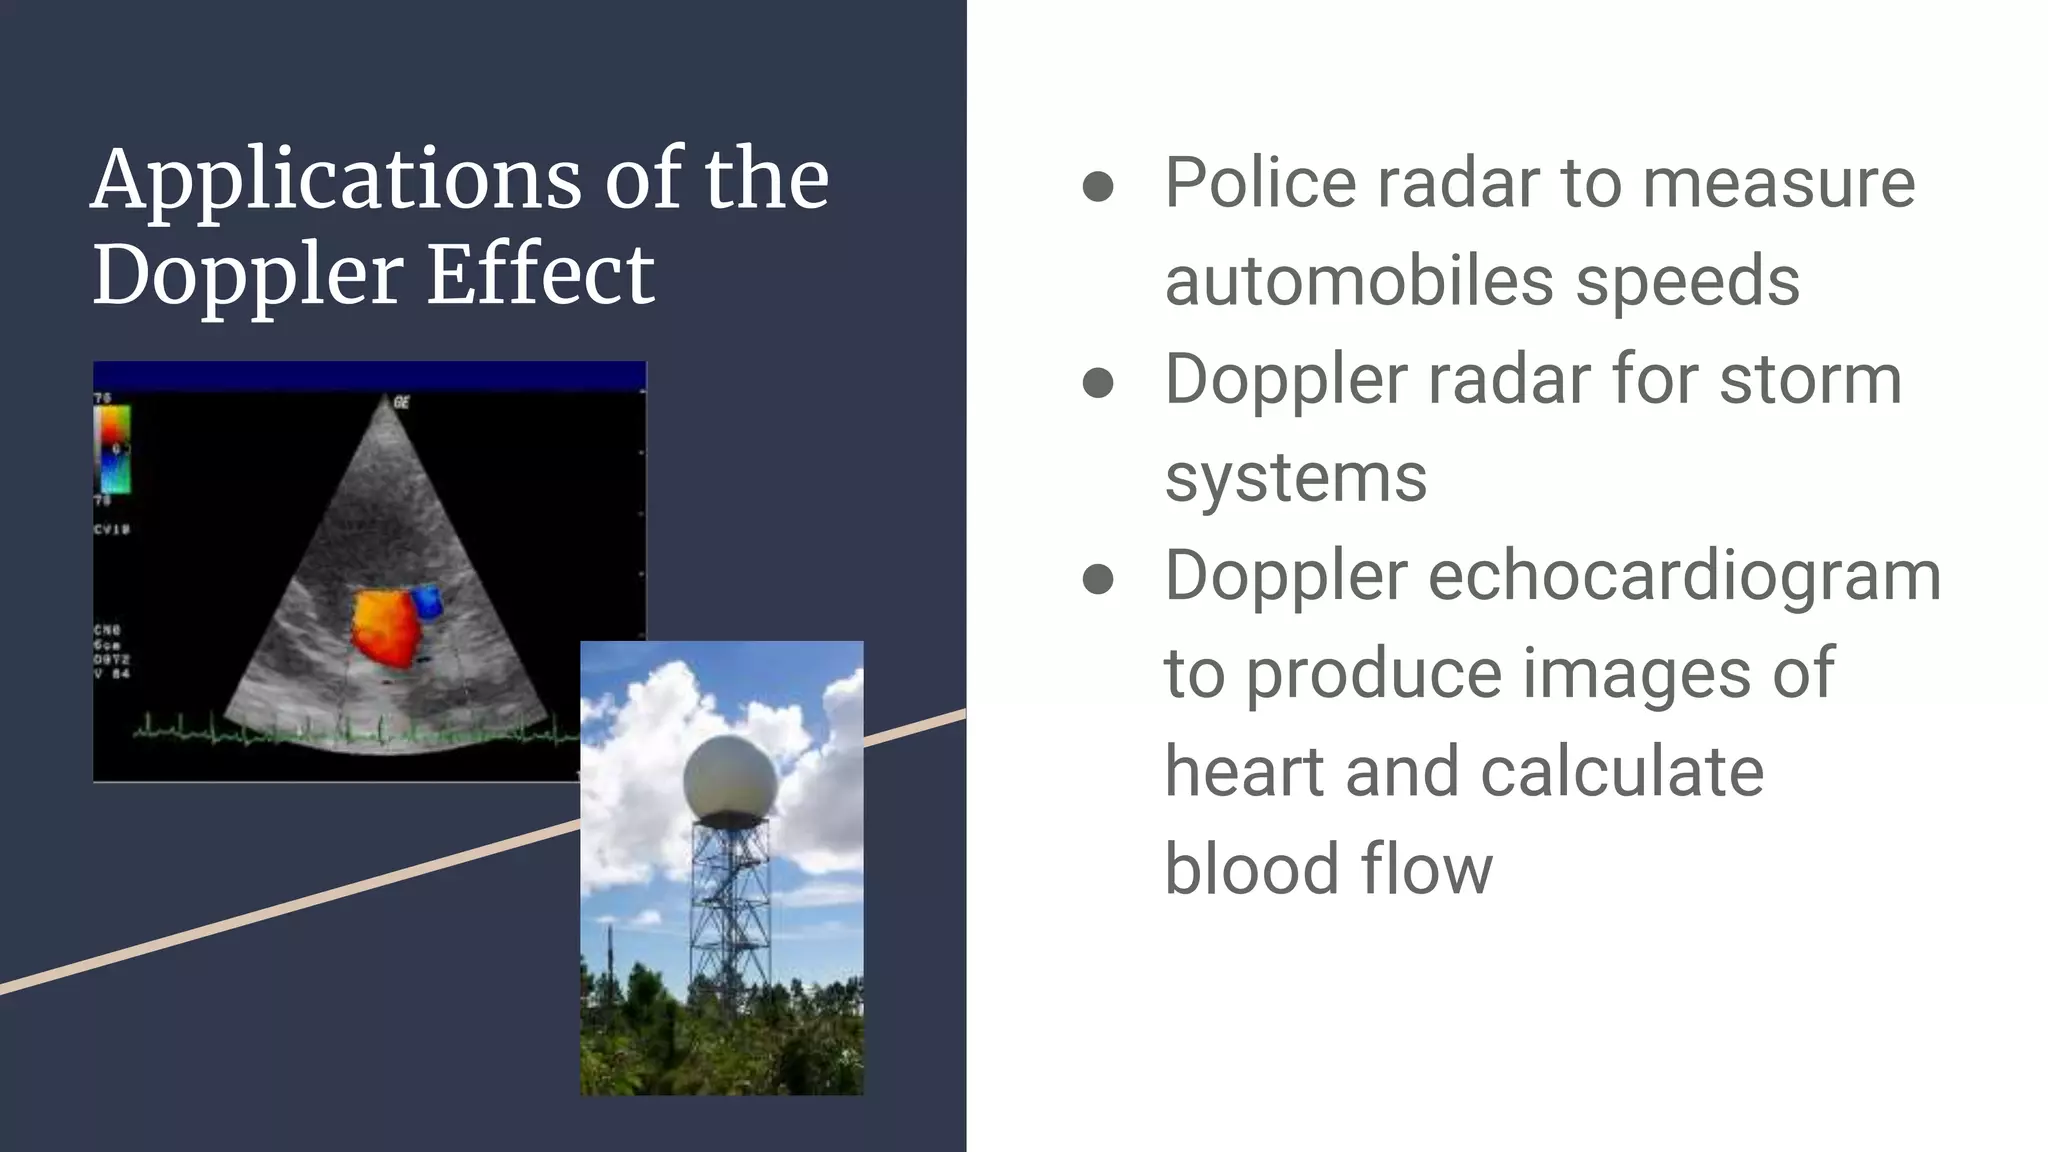
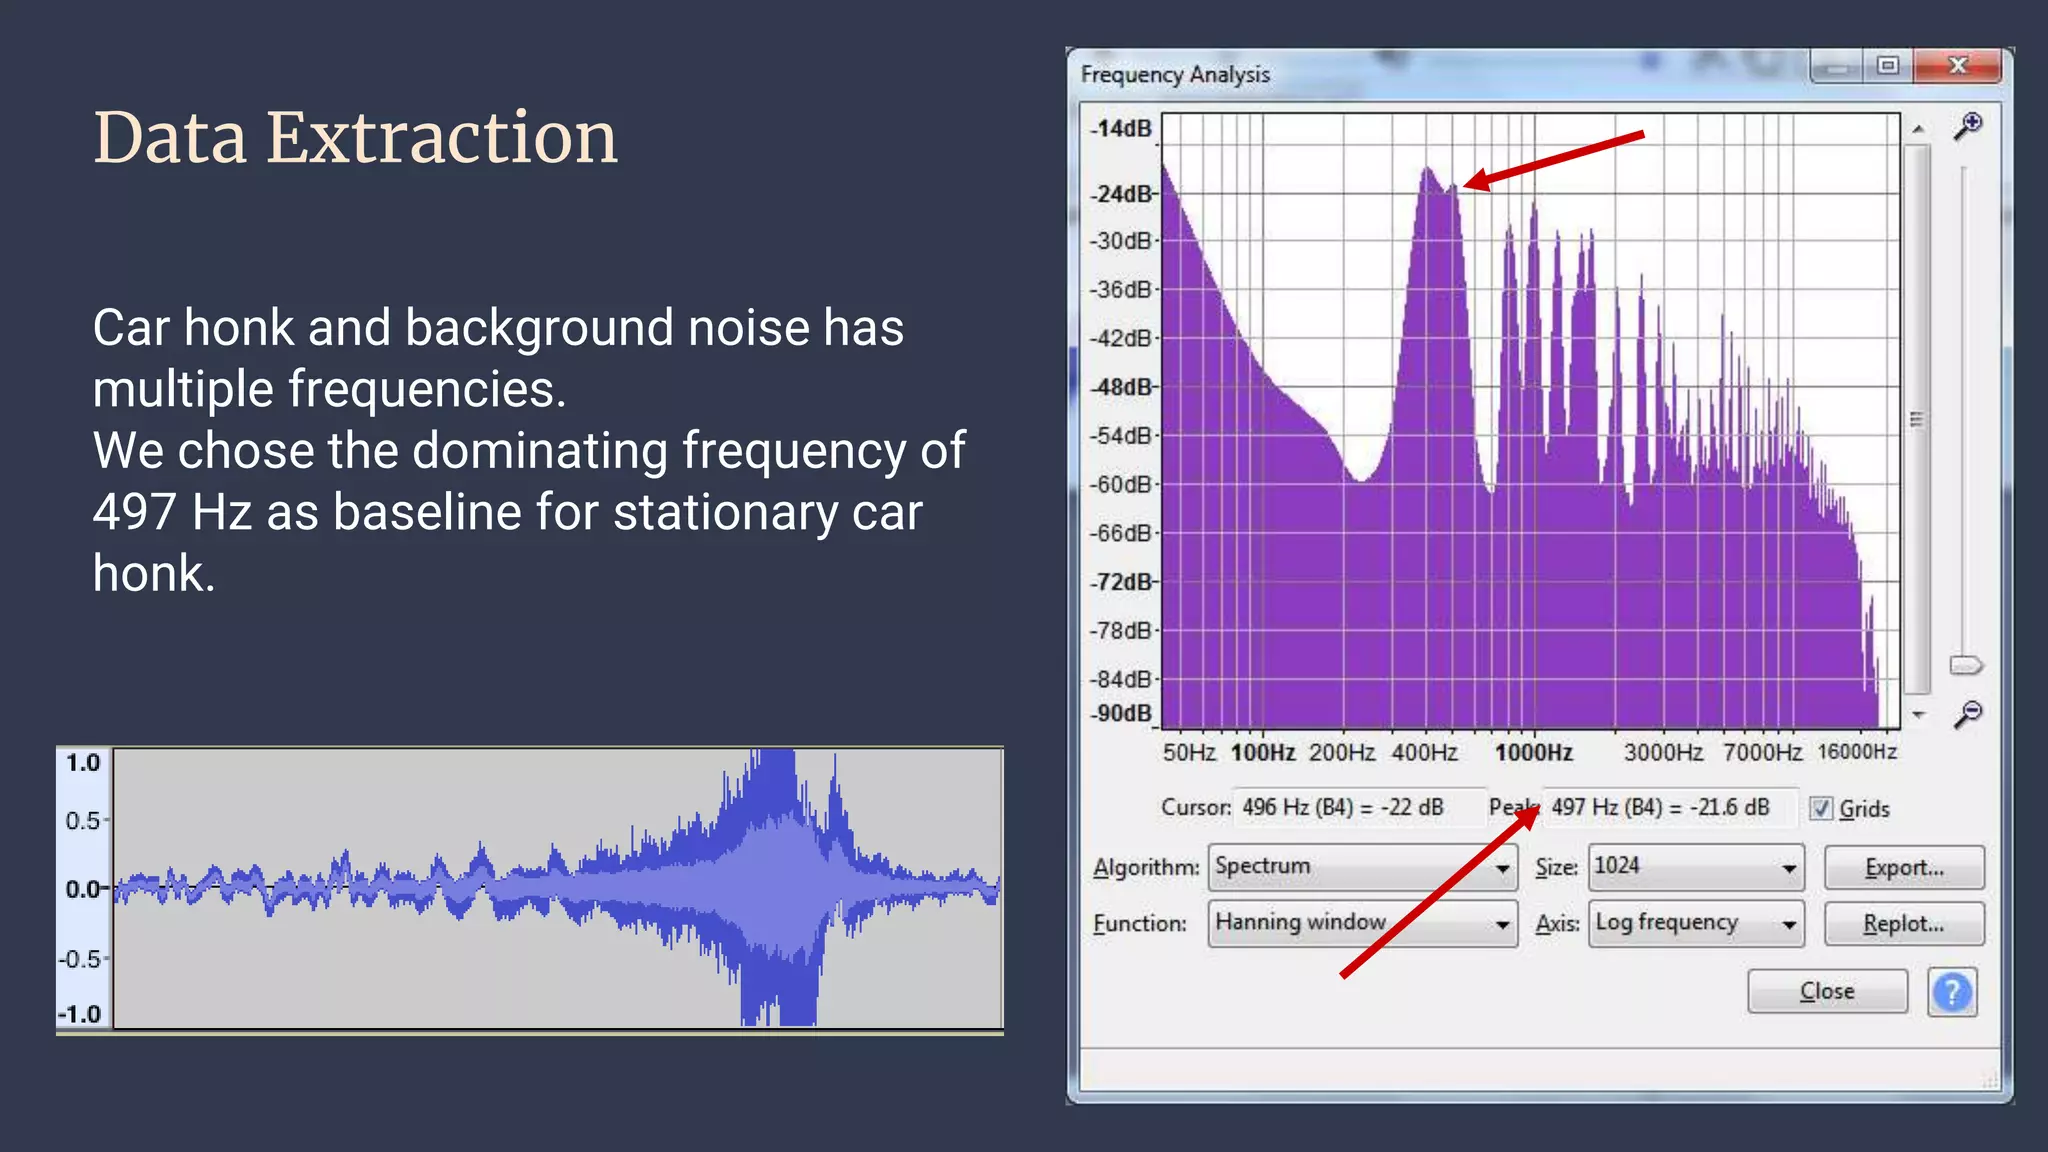
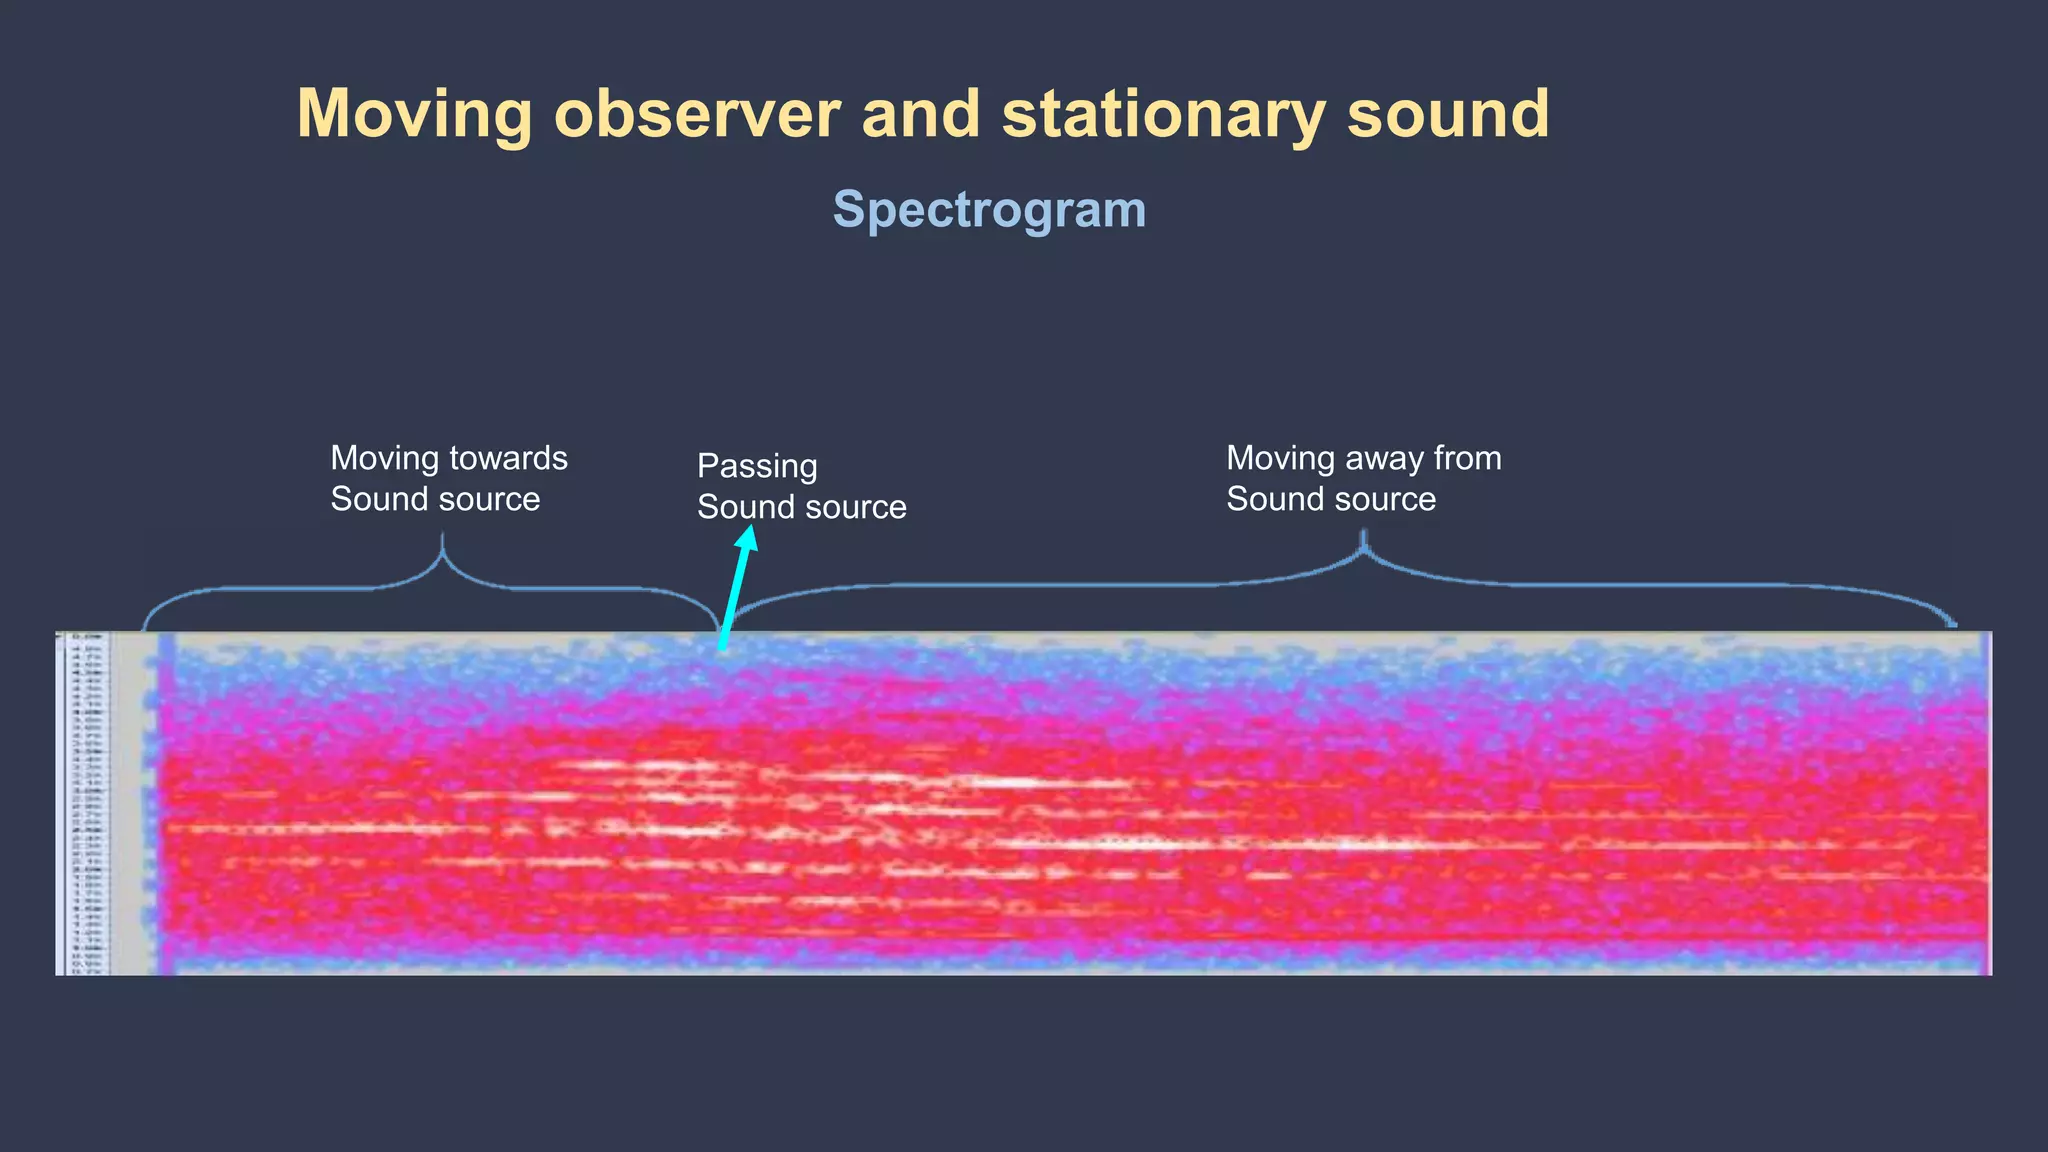
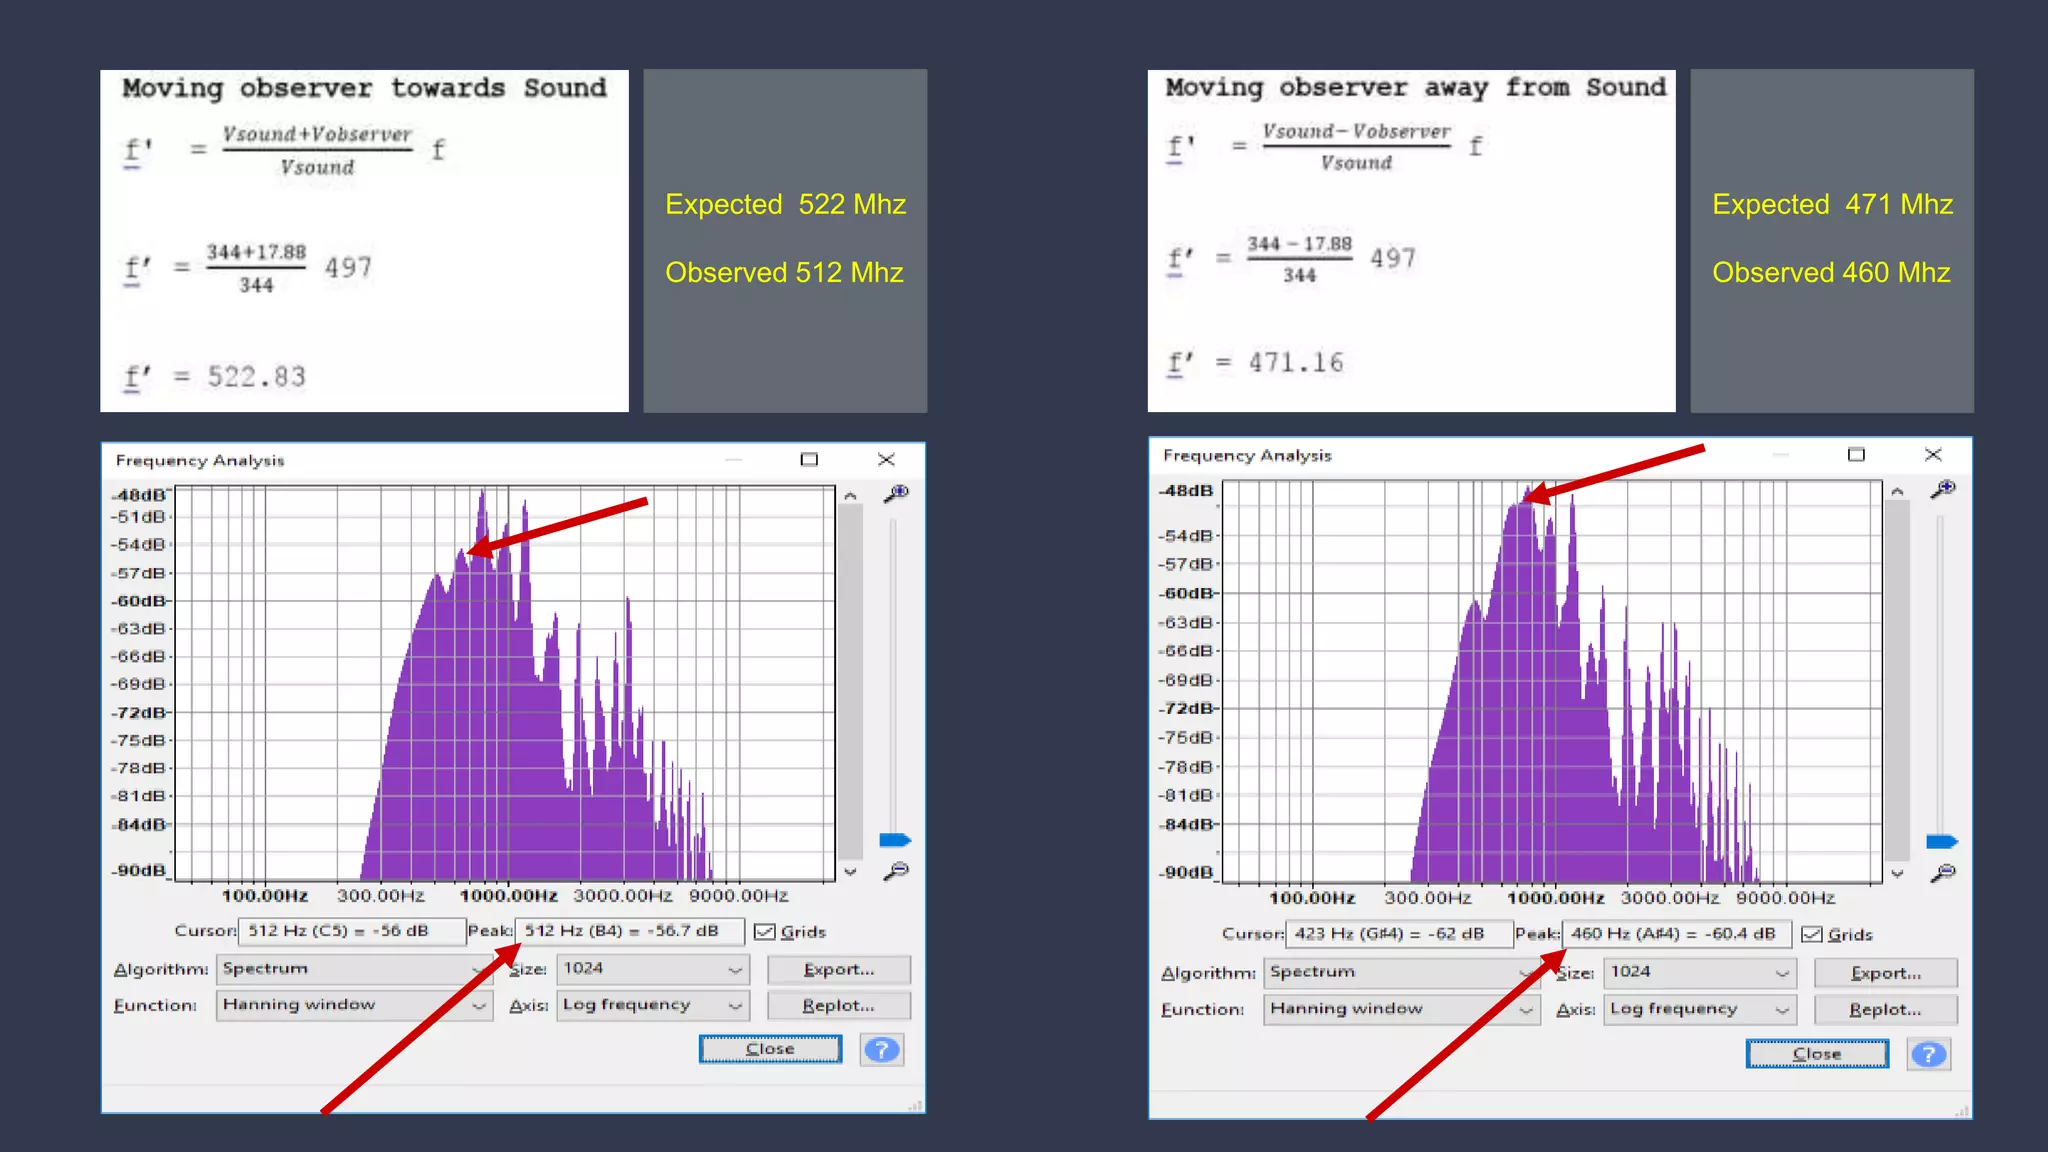
Modeling the Doppler Effect
Vijayan Thanasekaran, Ashley
Rodde, Gabriela Quiroz
The Doppler Effect: Explained
● As sound source approaches observer, its frequency appears higher
than its actual frequency
○ Each successive wave crest is emitted closer to previous crest
○ Wavelength and frequency are inversely proportional (v = fλ) ->
As wavelength decreases, frequency increases
● As source moves away from the observer, its frequency appears
lower
○ Each successive wave crest is emitted farther from previous
Applications of the
Doppler Effect
● Police radar to measure
automobiles speeds
● Doppler radar for storm
systems
● Doppler echocardiogram
to produce images of
heart and calculate
blood flow
1. Can we model the Doppler Effect,
observing higher frequencies of a
sound as it approaches, and lower
frequencies as it moves farther
away?
2. How will our observed values
compare to values calculated using
known equations?
Setup
1. Static Observer and Moving
Source
a. Person 1 (observer) on
sidewalk with
microphone
b. Person 2 drives car
(sound source) past
observer at constant
velocity while honking
Setup
2. Moving Observer and Static
Source
a. Person 1 (source) in
parked car honking
b. Person 2 drives car past
source at constant
velocity with Person 3
(observer) in passenger
seat holding
microphone
Setup
3. Moving Observer and
Moving Source
a. Person 1 drives car
(source) past observer
at constant velocity
while honking
b. Person 2 drives second
car past source at
constant velocity with
Person 3 (observer) in
passenger seat holding
microphone
Car honk and background noise has
multiple frequencies.
We chose the dominating frequency of
497 Hz as baseline for stationary car
honk.
Data Extraction
Results
Set-up 1: Moving Sound Stationary Observer
Spectrogram
Passing
observer
Moving towards
observer
Moving away
From observer
Moving Sound and stationary observer
Mhz Mhz
Expected 524 Mhz
Observed 522 Mhz
Expected 472 Mhz
Observed 481 Mhz
Set-up 2: Moving Observer Stationary Sound
Moving towards
Sound source
Passing
Sound source
Moving away from
Sound source
Spectrogram
Moving observer and stationary sound
Expected 522 Mhz
Observed 512 Mhz
Expected 471 Mhz
Observed 460 Mhz
Set-up 3: Moving Observer and Moving Sound
Moving towards
Each other
Moving away from
Each other
Passing
Each other
Spectrogram
Moving observer and moving sound
Expected 551 Mhz
Observed 546 Mhz
Expected 447 Mhz
Observed 440 Mhz
Discussion
Percent Errors:
Calculated
Lack of pure tone: +/ - 5 Hz
Speed of vehicle not
constant: +/- 1 m/s
Background noise: +/- 20 Hz
Sources of Error:
Estimated
Conclusion
Modeling the doppler effect was successful with our
experiment design. Data reflected the shift in
observed sound frequency for all three scenarios.
Improvements ● Pure tone
● Cruise control
● Quieter location
● Video recording to
measure precise time at
which observer and
sound pass each other
Further Investigation
● Investigate how police
radar works!
○ Use set up 1
throughout
○ Change speed of car
(moving source) in
each round
○ Calculate the speed
of the car based on
observed frequencies
References
By Charly Whisky 18:20, 27 January 2007 (yyy) - Own work, CC BY-SA 3.0,
https://commons.wikimedia.org/w/index.php?curid=1606823
https://science.howstuffworks.com/science-vs-myth/everyday-myths/doppler-effect3.htm
https://www.nssl.noaa.gov/tools/radar/
By Kalumet - Own work, CC BY-SA 3.0, https://commons.wikimedia.org/w/index.php?curid=214411
https://www.thecarconnection.com/news/1094497_uh-oh-police-radar-guns-could-soon-tell-if-youre-texting-too

Modeling the Doppler Effect using Audacity

  • 1.
    Modeling the DopplerEffect Vijayan Thanasekaran, Ashley Rodde, Gabriela Quiroz
  • 2.
    The Doppler Effect:Explained ● As sound source approaches observer, its frequency appears higher than its actual frequency ○ Each successive wave crest is emitted closer to previous crest ○ Wavelength and frequency are inversely proportional (v = fλ) -> As wavelength decreases, frequency increases ● As source moves away from the observer, its frequency appears lower ○ Each successive wave crest is emitted farther from previous
  • 3.
    Applications of the DopplerEffect ● Police radar to measure automobiles speeds ● Doppler radar for storm systems ● Doppler echocardiogram to produce images of heart and calculate blood flow
  • 4.
    1. Can wemodel the Doppler Effect, observing higher frequencies of a sound as it approaches, and lower frequencies as it moves farther away? 2. How will our observed values compare to values calculated using known equations?
  • 5.
    Setup 1. Static Observerand Moving Source a. Person 1 (observer) on sidewalk with microphone b. Person 2 drives car (sound source) past observer at constant velocity while honking
  • 6.
    Setup 2. Moving Observerand Static Source a. Person 1 (source) in parked car honking b. Person 2 drives car past source at constant velocity with Person 3 (observer) in passenger seat holding microphone
  • 7.
    Setup 3. Moving Observerand Moving Source a. Person 1 drives car (source) past observer at constant velocity while honking b. Person 2 drives second car past source at constant velocity with Person 3 (observer) in passenger seat holding microphone
  • 8.
    Car honk andbackground noise has multiple frequencies. We chose the dominating frequency of 497 Hz as baseline for stationary car honk. Data Extraction
  • 9.
  • 10.
    Set-up 1: MovingSound Stationary Observer
  • 11.
    Spectrogram Passing observer Moving towards observer Moving away Fromobserver Moving Sound and stationary observer
  • 12.
    Mhz Mhz Expected 524Mhz Observed 522 Mhz Expected 472 Mhz Observed 481 Mhz
  • 13.
    Set-up 2: MovingObserver Stationary Sound
  • 14.
    Moving towards Sound source Passing Soundsource Moving away from Sound source Spectrogram Moving observer and stationary sound
  • 15.
    Expected 522 Mhz Observed512 Mhz Expected 471 Mhz Observed 460 Mhz
  • 16.
    Set-up 3: MovingObserver and Moving Sound
  • 17.
    Moving towards Each other Movingaway from Each other Passing Each other Spectrogram Moving observer and moving sound
  • 18.
    Expected 551 Mhz Observed546 Mhz Expected 447 Mhz Observed 440 Mhz
  • 19.
  • 20.
  • 21.
    Lack of puretone: +/ - 5 Hz Speed of vehicle not constant: +/- 1 m/s Background noise: +/- 20 Hz Sources of Error: Estimated
  • 22.
    Conclusion Modeling the dopplereffect was successful with our experiment design. Data reflected the shift in observed sound frequency for all three scenarios.
  • 23.
    Improvements ● Puretone ● Cruise control ● Quieter location ● Video recording to measure precise time at which observer and sound pass each other
  • 24.
    Further Investigation ● Investigatehow police radar works! ○ Use set up 1 throughout ○ Change speed of car (moving source) in each round ○ Calculate the speed of the car based on observed frequencies
  • 25.
    References By Charly Whisky18:20, 27 January 2007 (yyy) - Own work, CC BY-SA 3.0, https://commons.wikimedia.org/w/index.php?curid=1606823 https://science.howstuffworks.com/science-vs-myth/everyday-myths/doppler-effect3.htm https://www.nssl.noaa.gov/tools/radar/ By Kalumet - Own work, CC BY-SA 3.0, https://commons.wikimedia.org/w/index.php?curid=214411 https://www.thecarconnection.com/news/1094497_uh-oh-police-radar-guns-could-soon-tell-if-youre-texting-too

Editor's Notes

  • #11 https://drive.google.com/open?id=1Pkf7ZsUwwqq_b9Dp0Q8Es1013YpeUVlE
  • #14 https://drive.google.com/open?id=1s4TsytfEFts_h4nRjjUj_632YWwDW2rr
  • #17 https://drive.google.com/open?id=1xQJZLs-tLnW6PJcM1dh8ll-PmKvovqNg