Downloaded 916 times
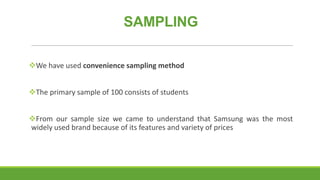
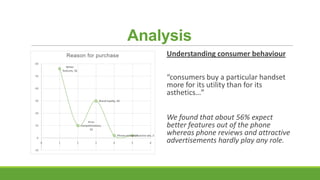
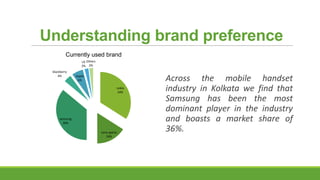
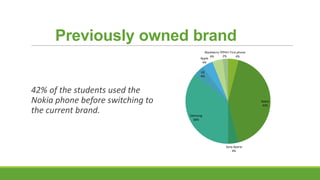
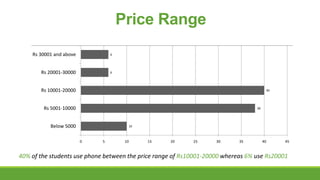
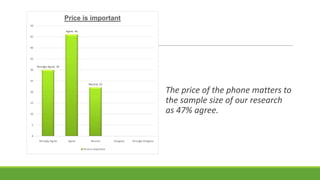
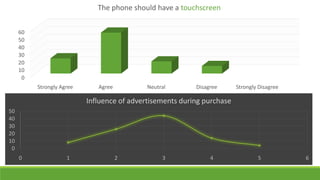
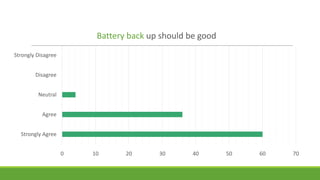
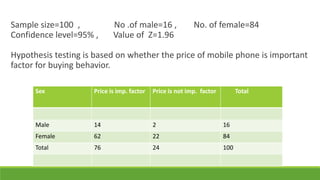
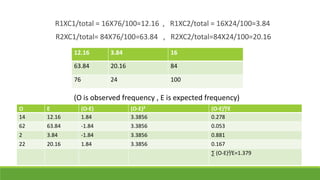
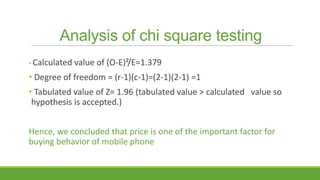

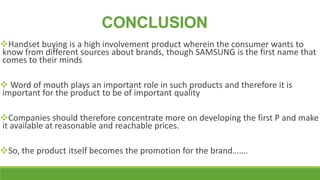
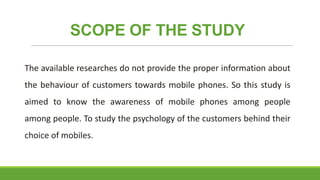


The document summarizes research on the consumer buying behavior of youth towards mobile phones in Kolkata, India. The research had primary objectives to study brand preferences and usage patterns. It found that Samsung had the largest market share at 36% and consumers primarily buy phones for better features over aesthetics or advertising. Price was also an important factor, with 40% of respondents purchasing phones priced between Rs. 10,001-20,000. The document presents findings through charts and tables and concludes that companies should focus on quality products at reasonable prices to attract consumers.