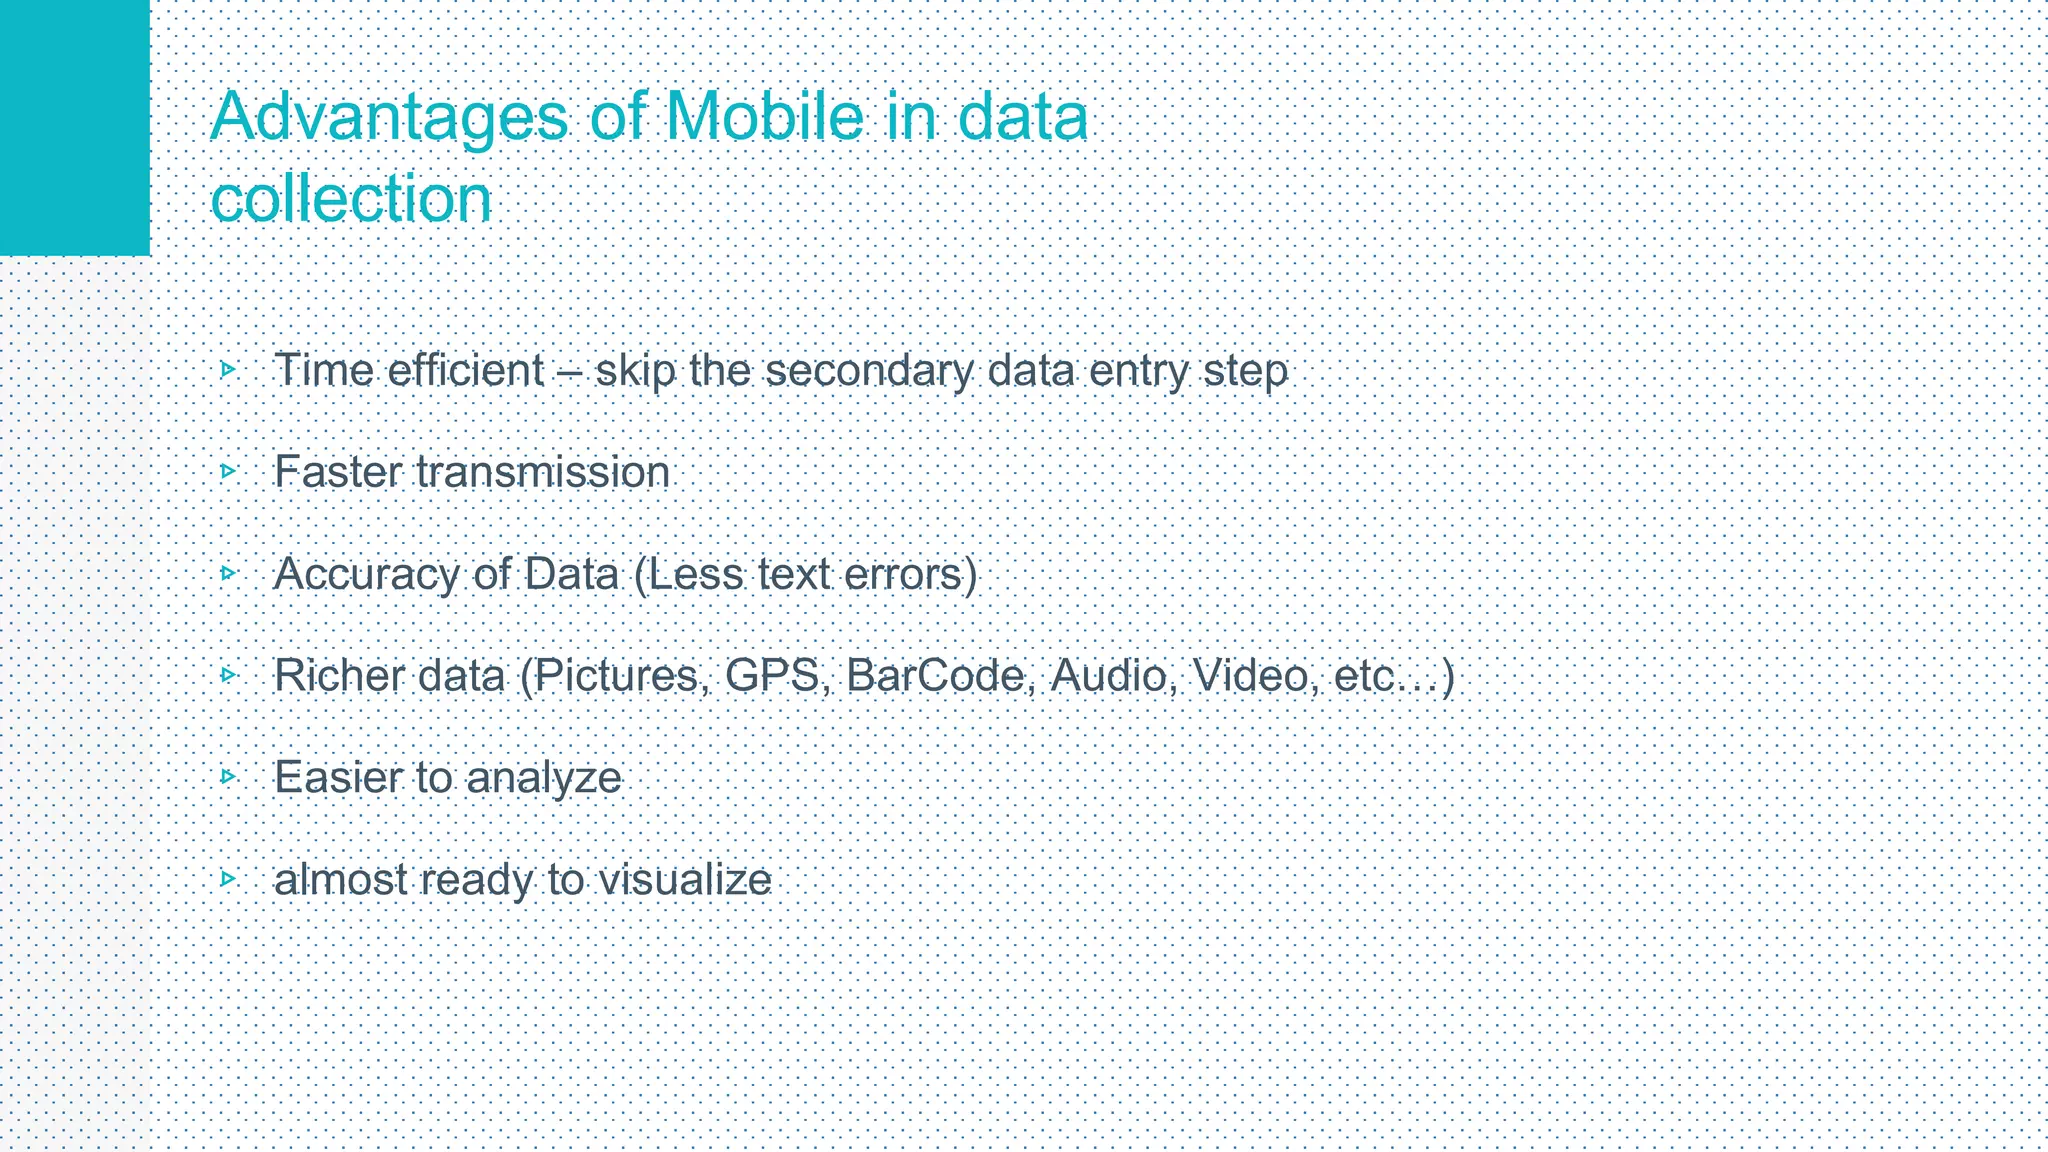
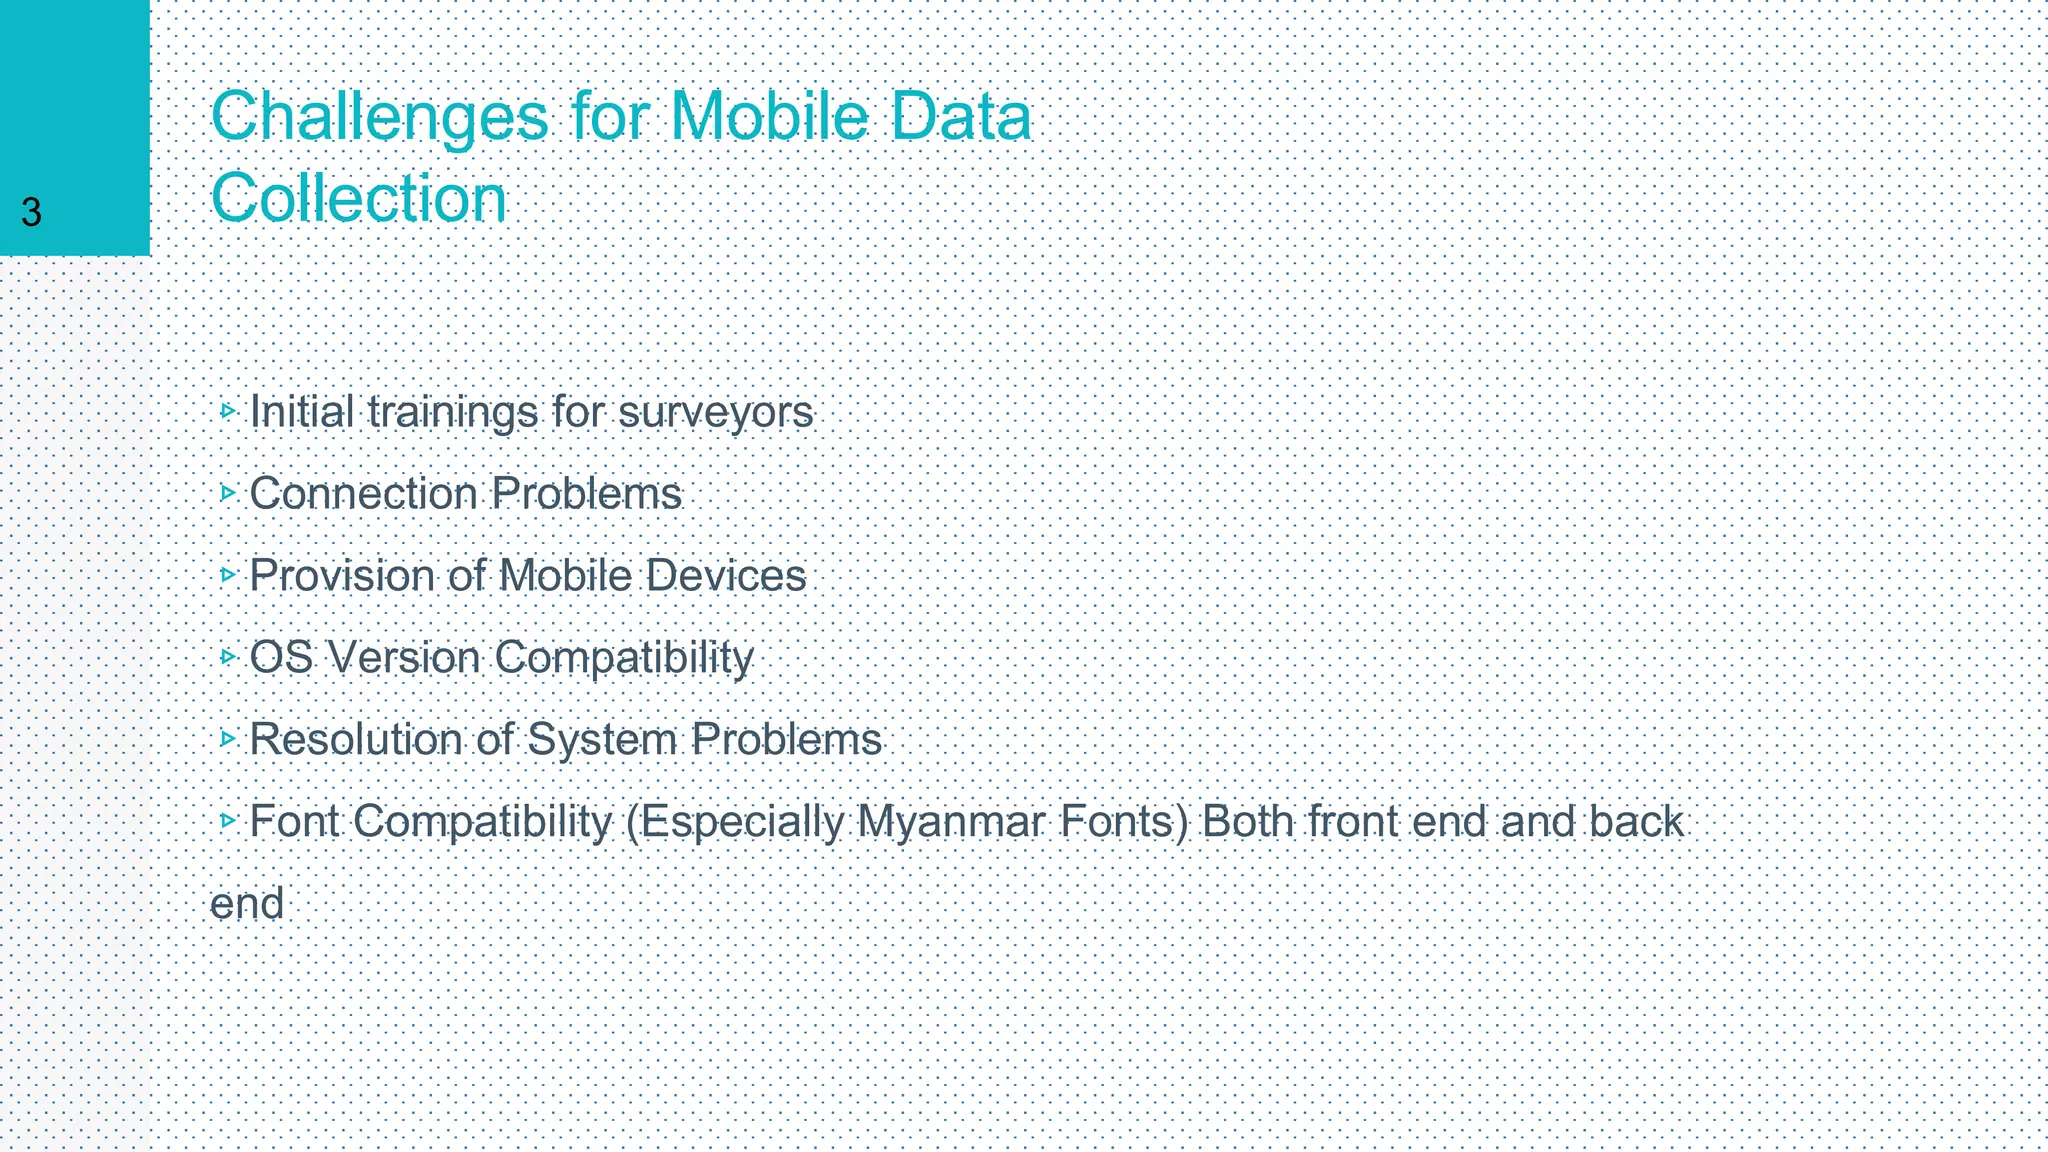
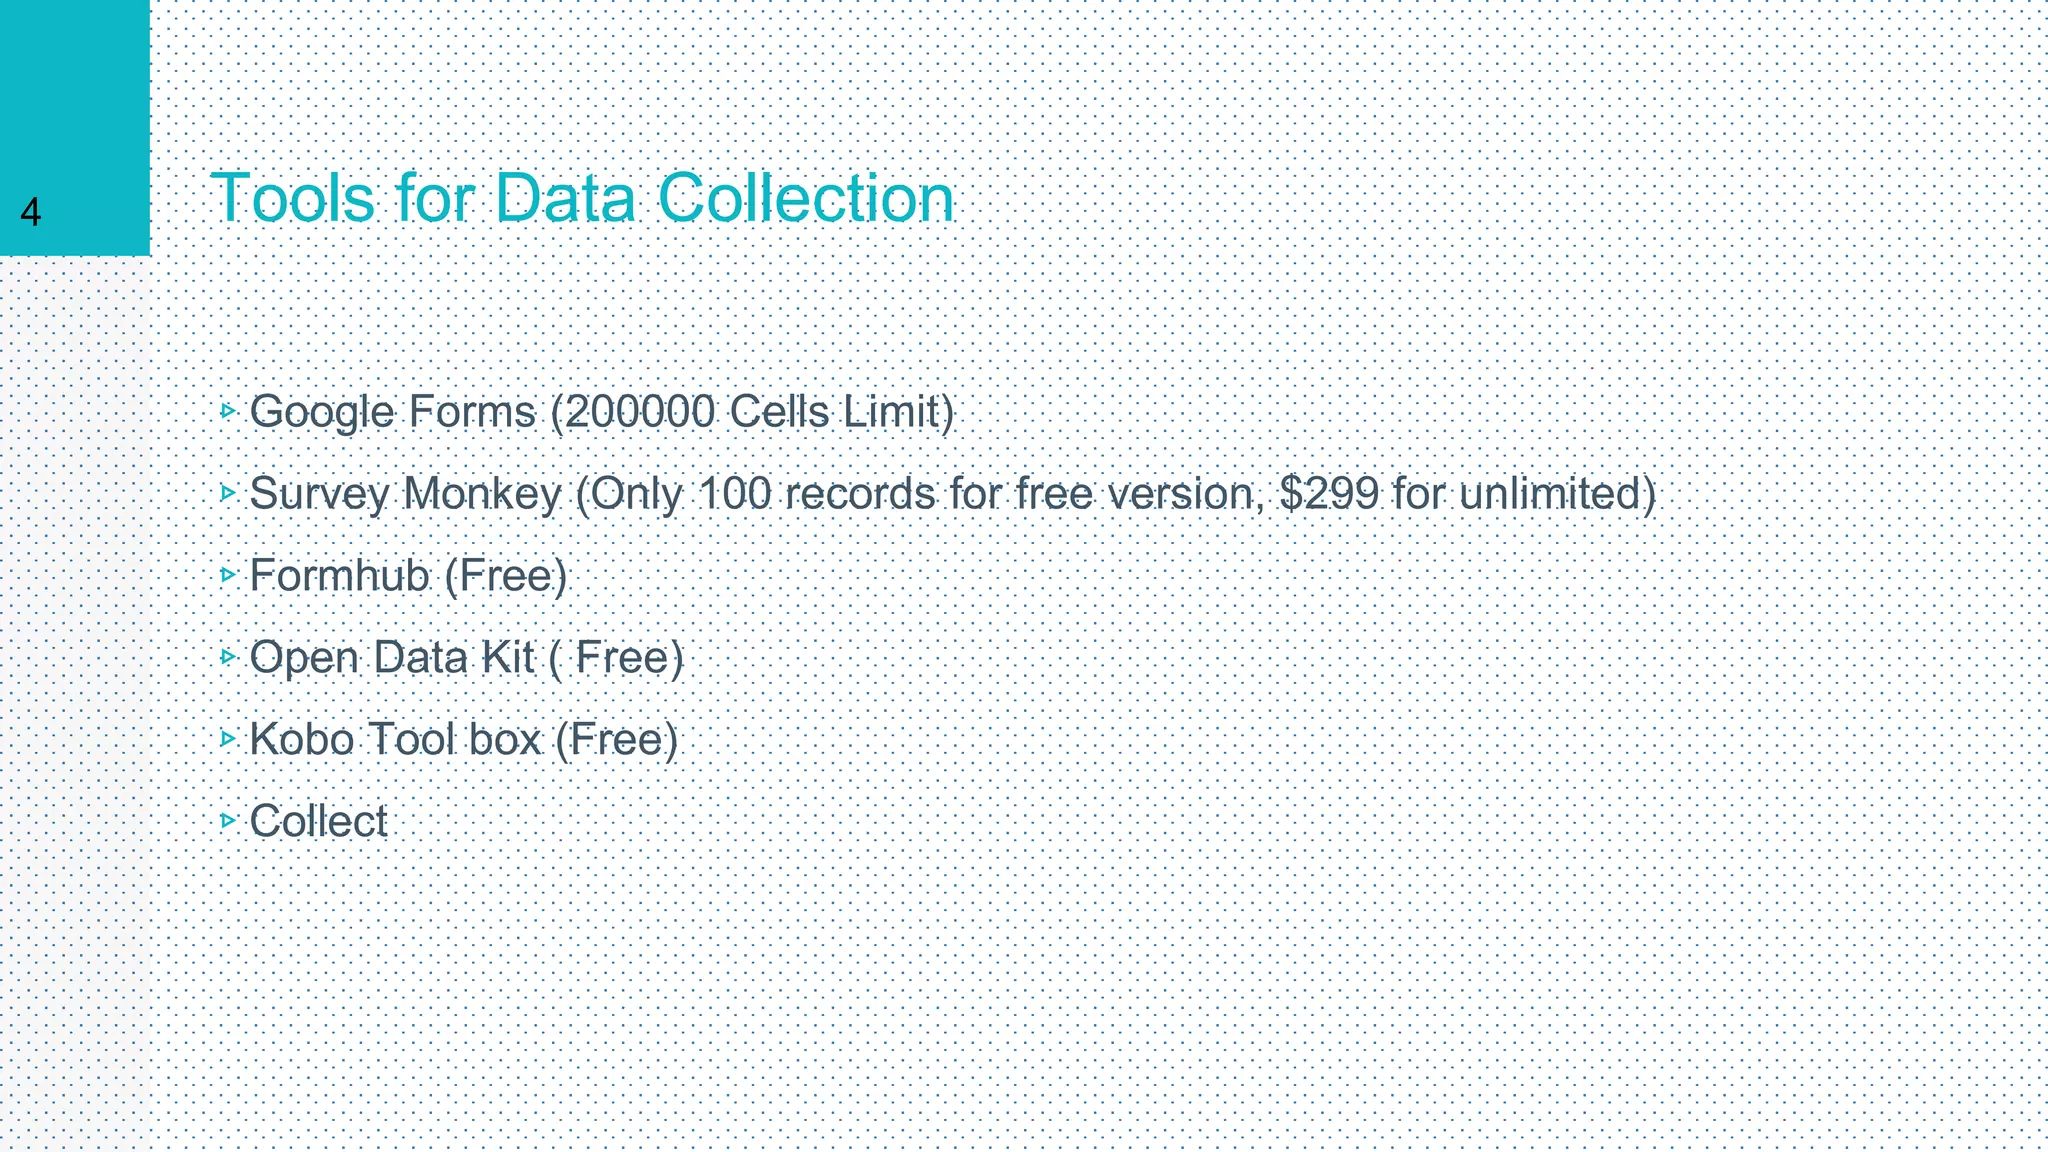
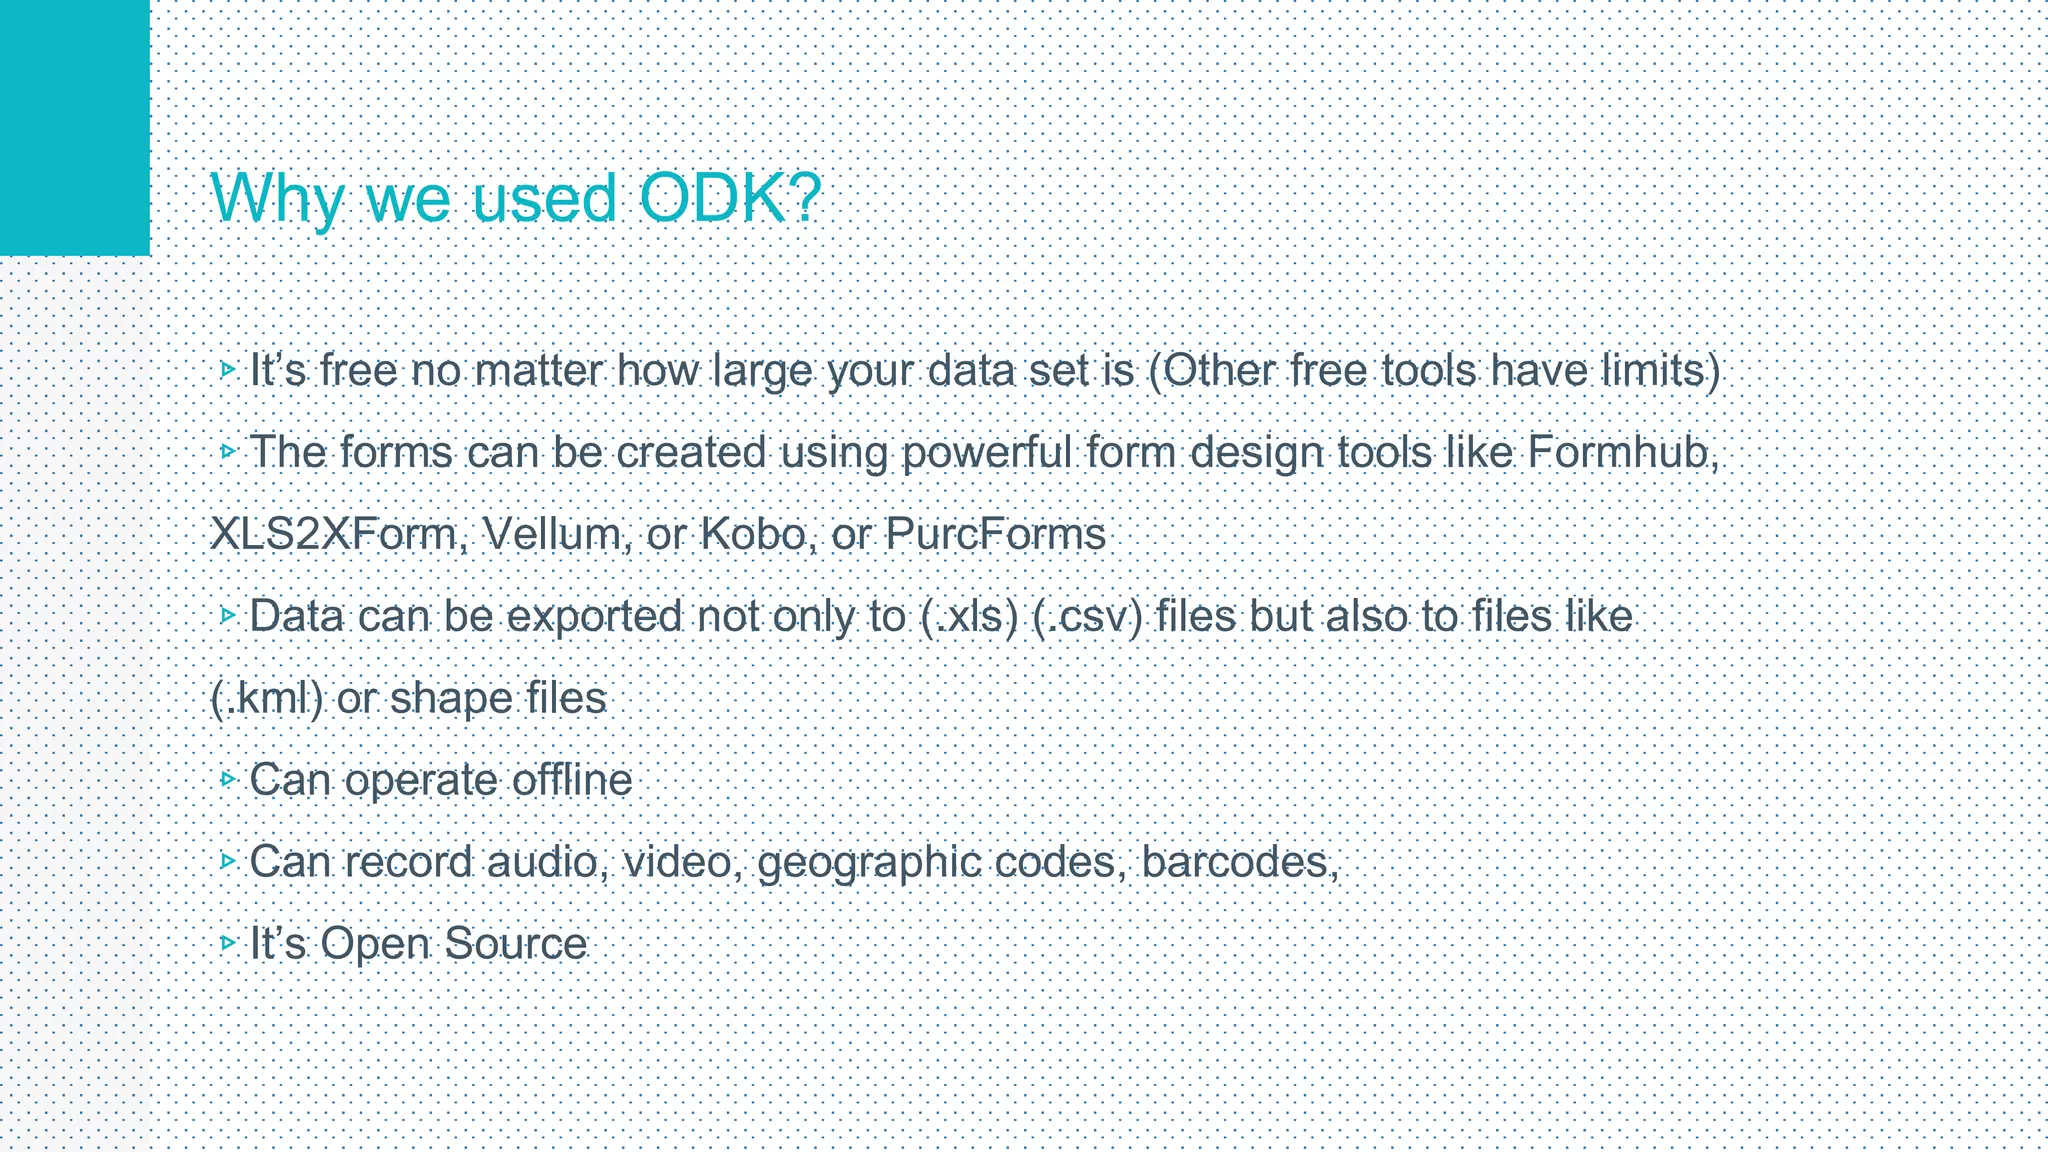
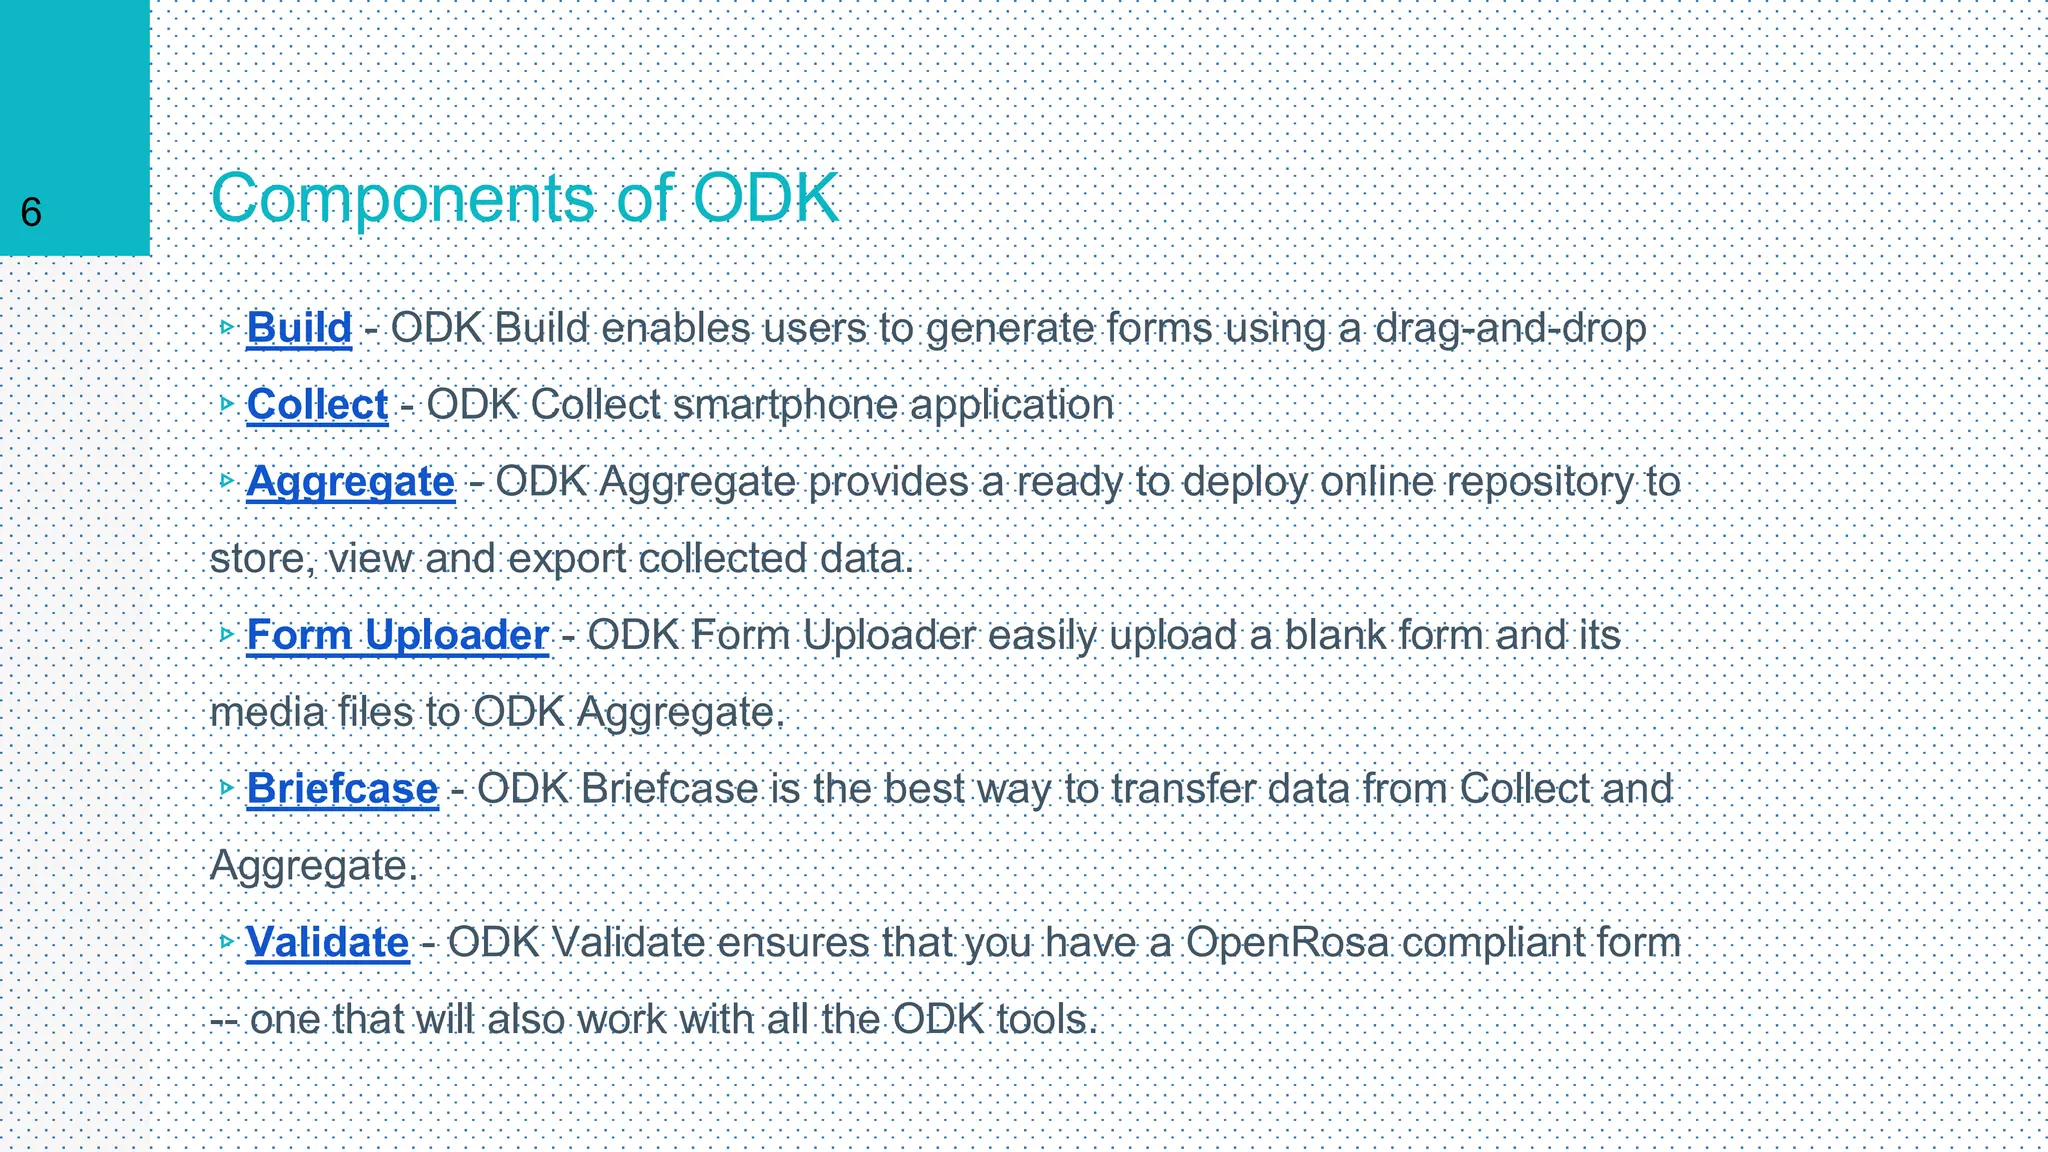
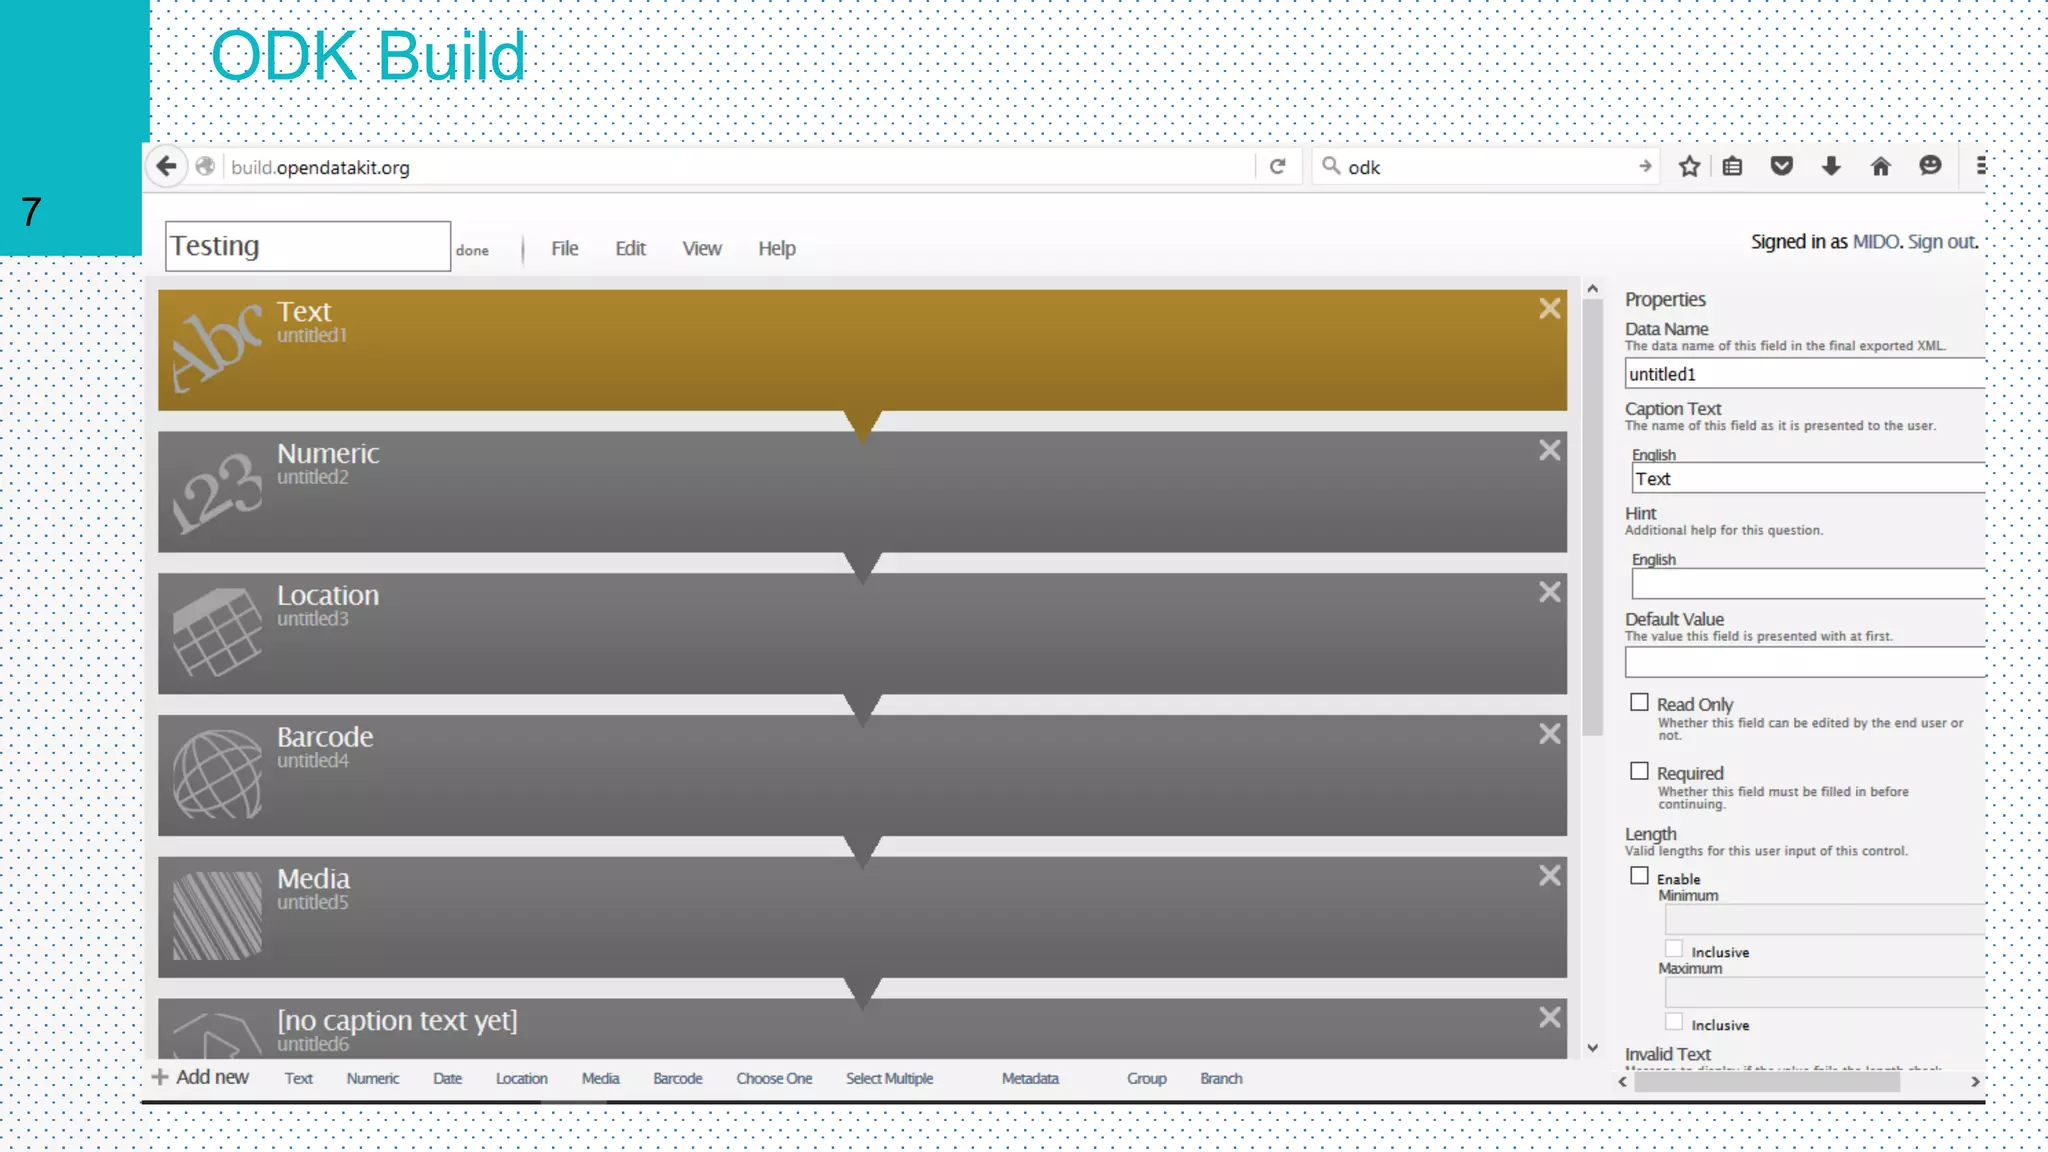
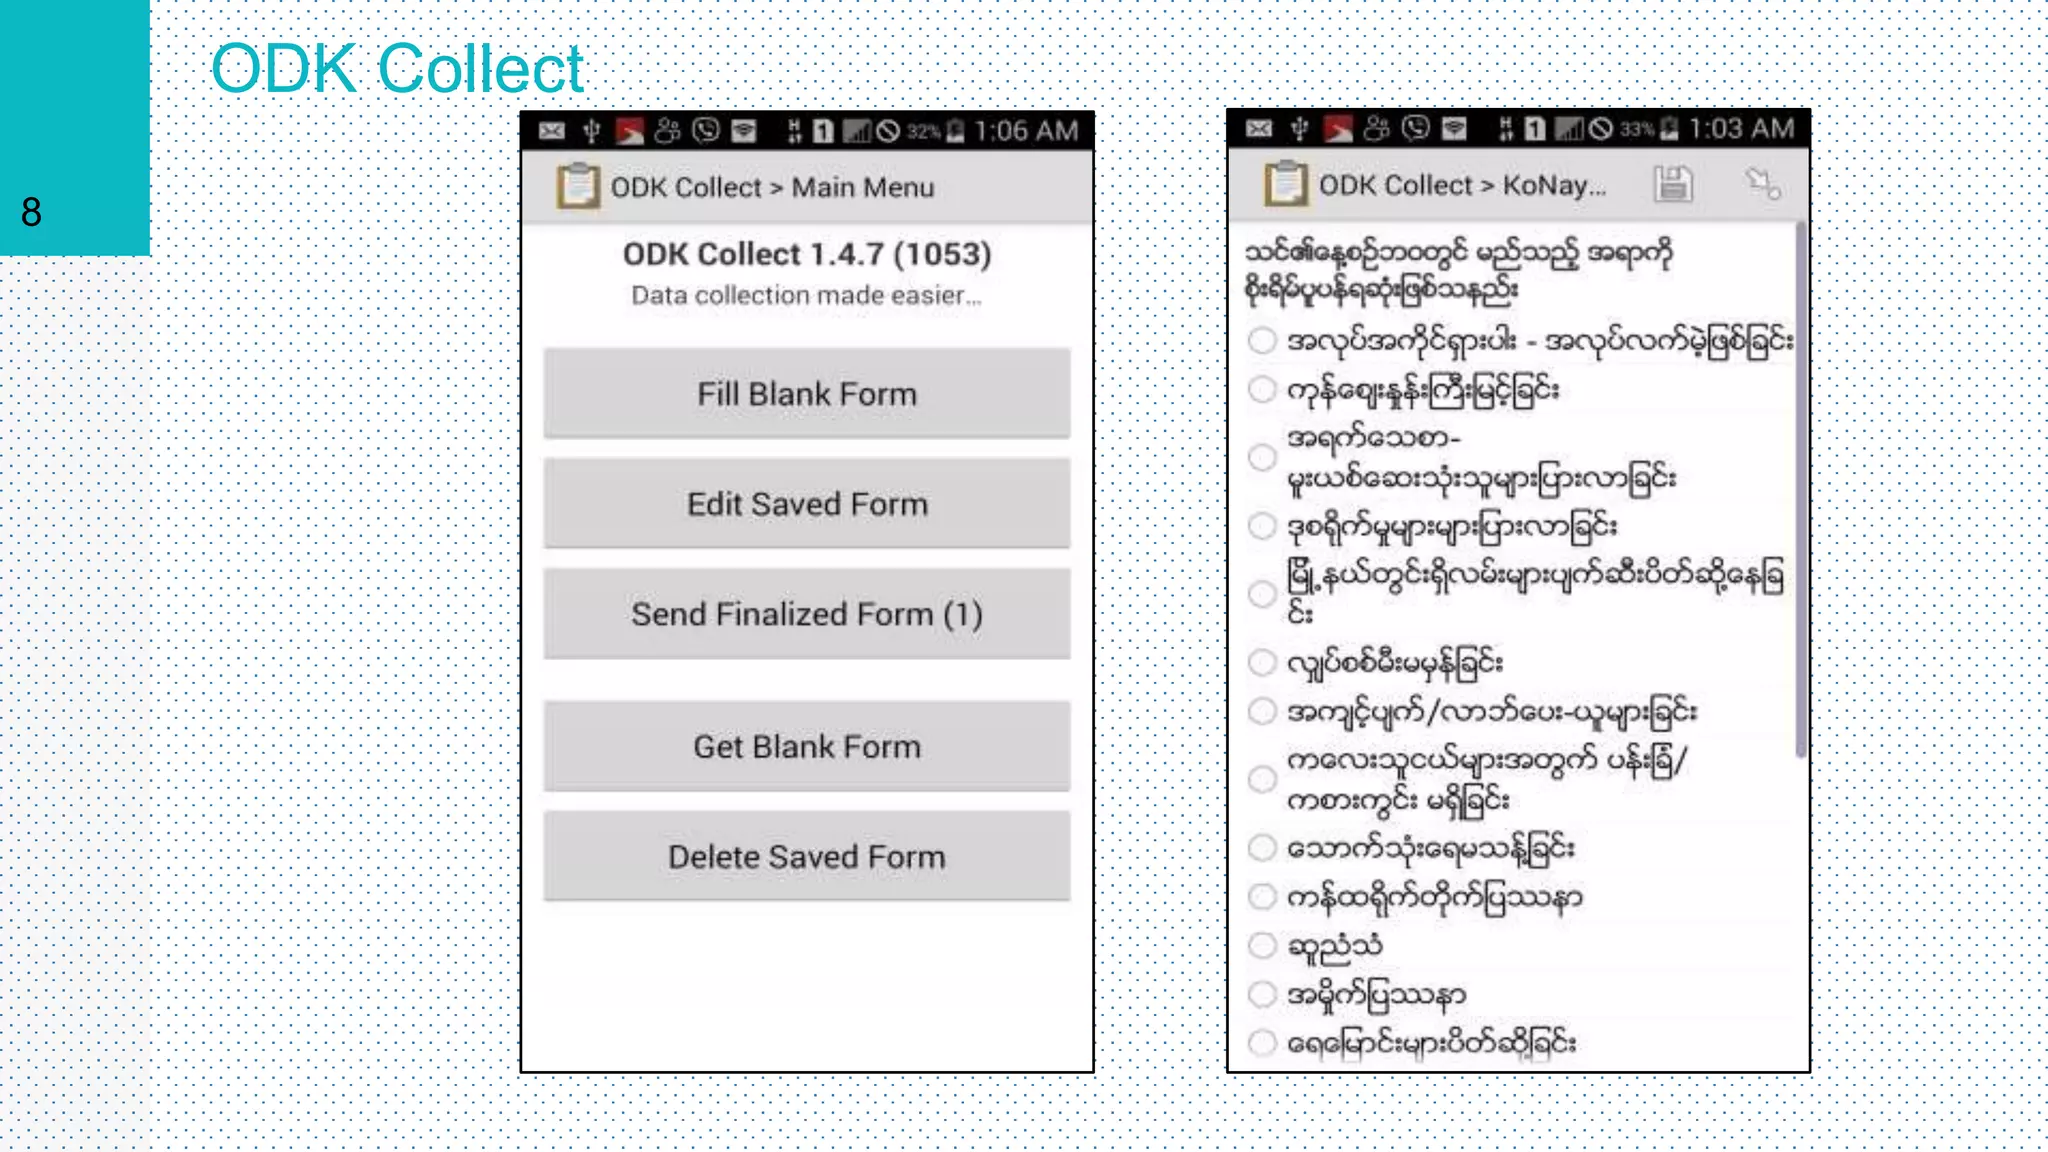
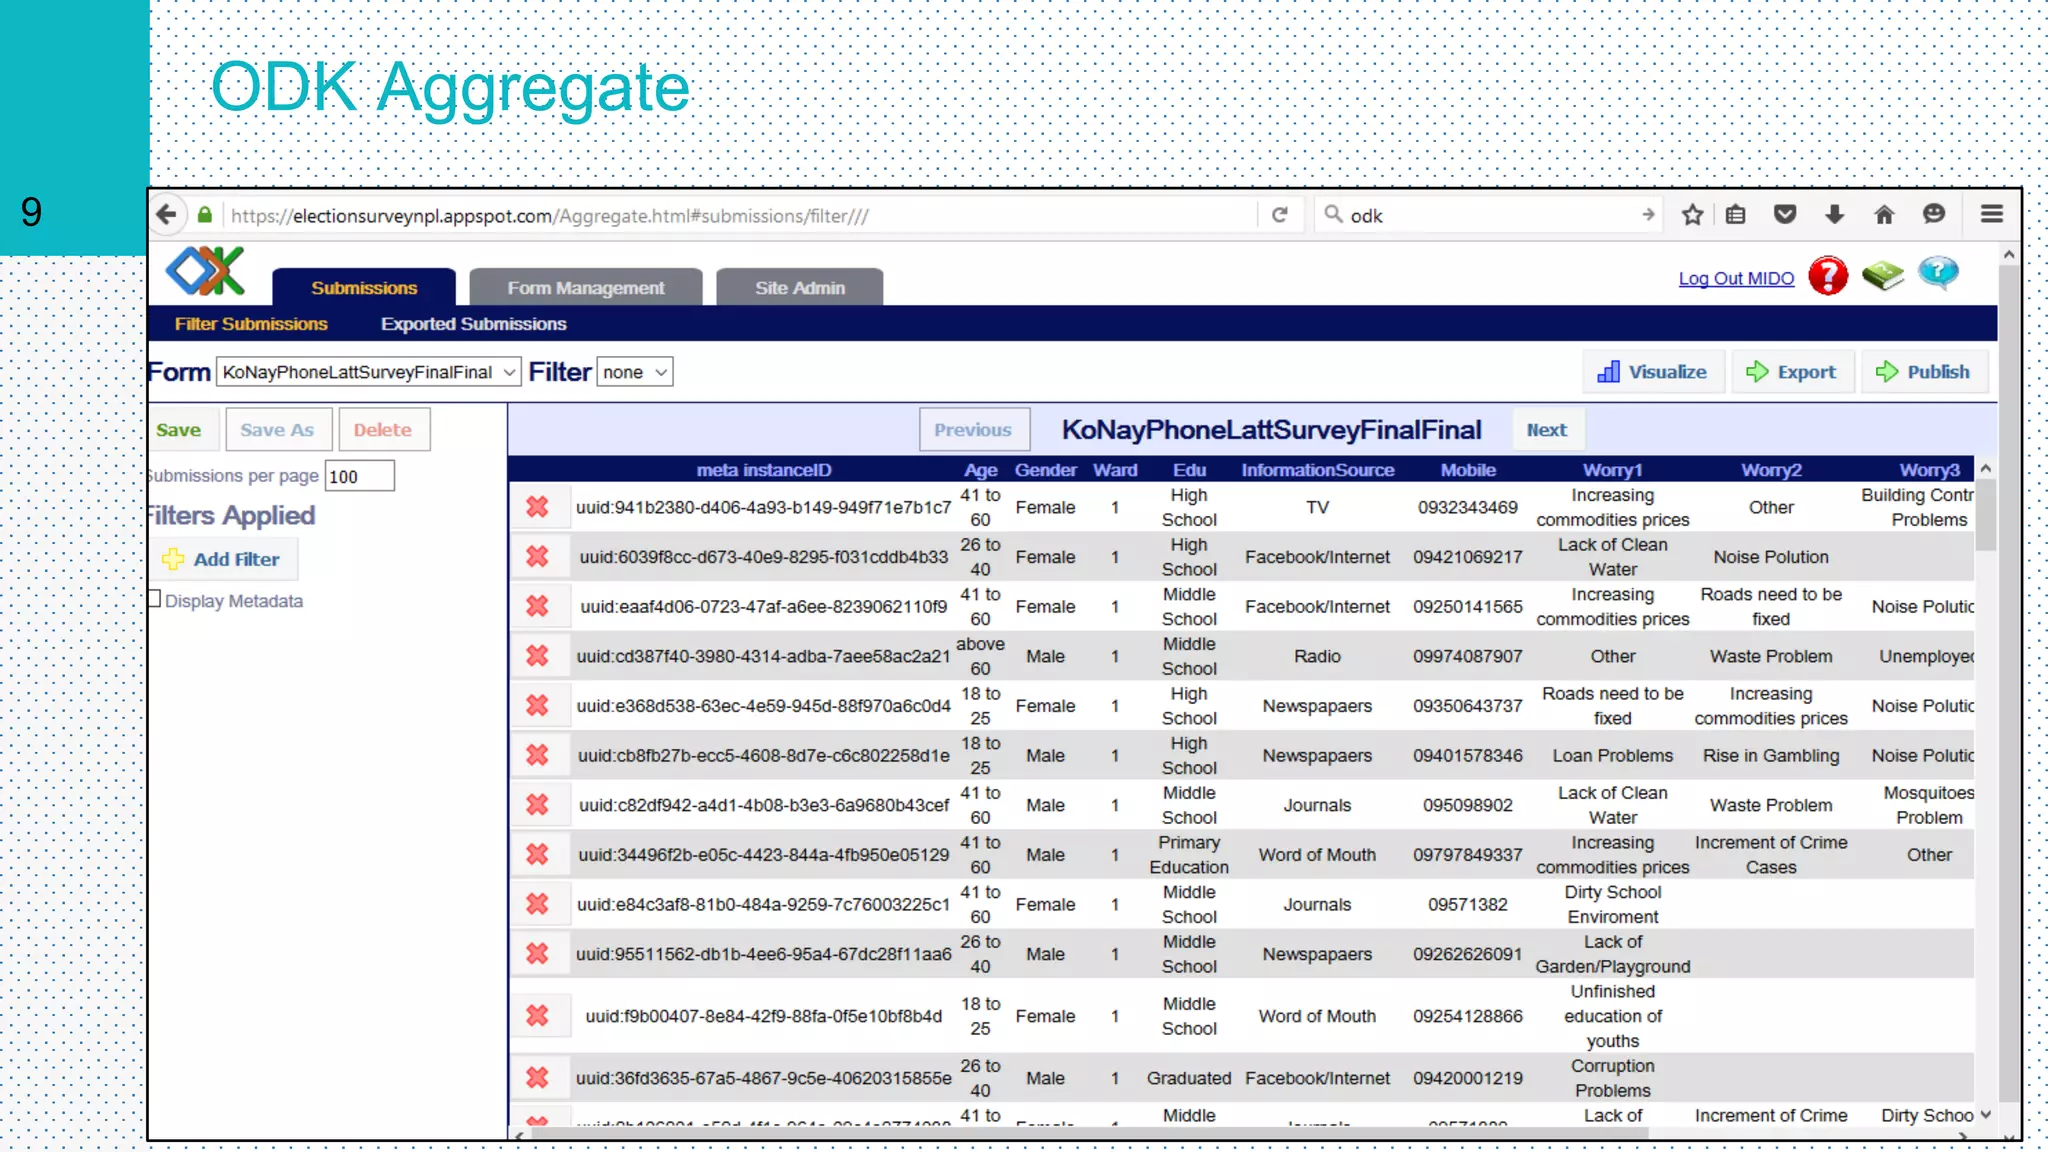
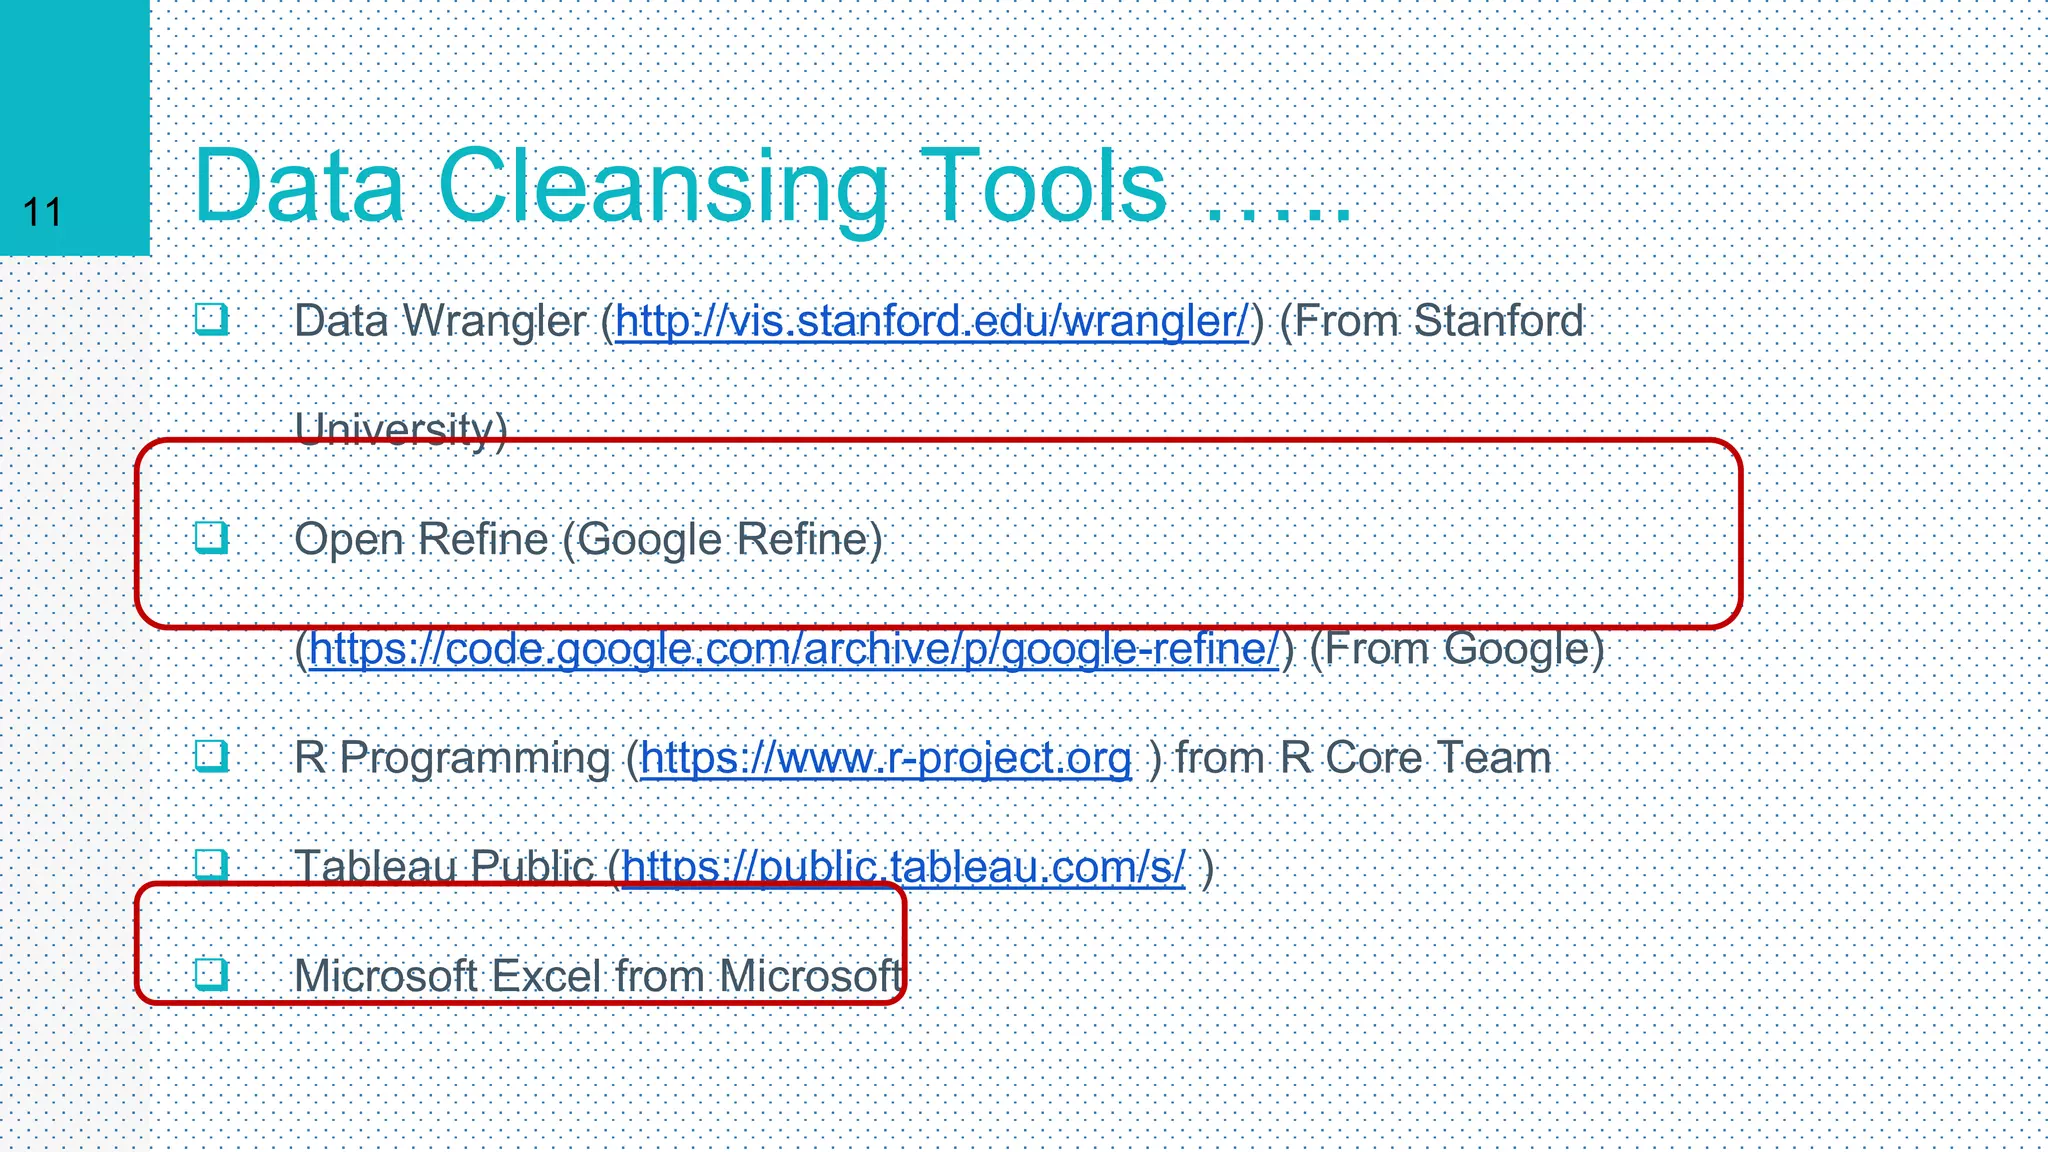
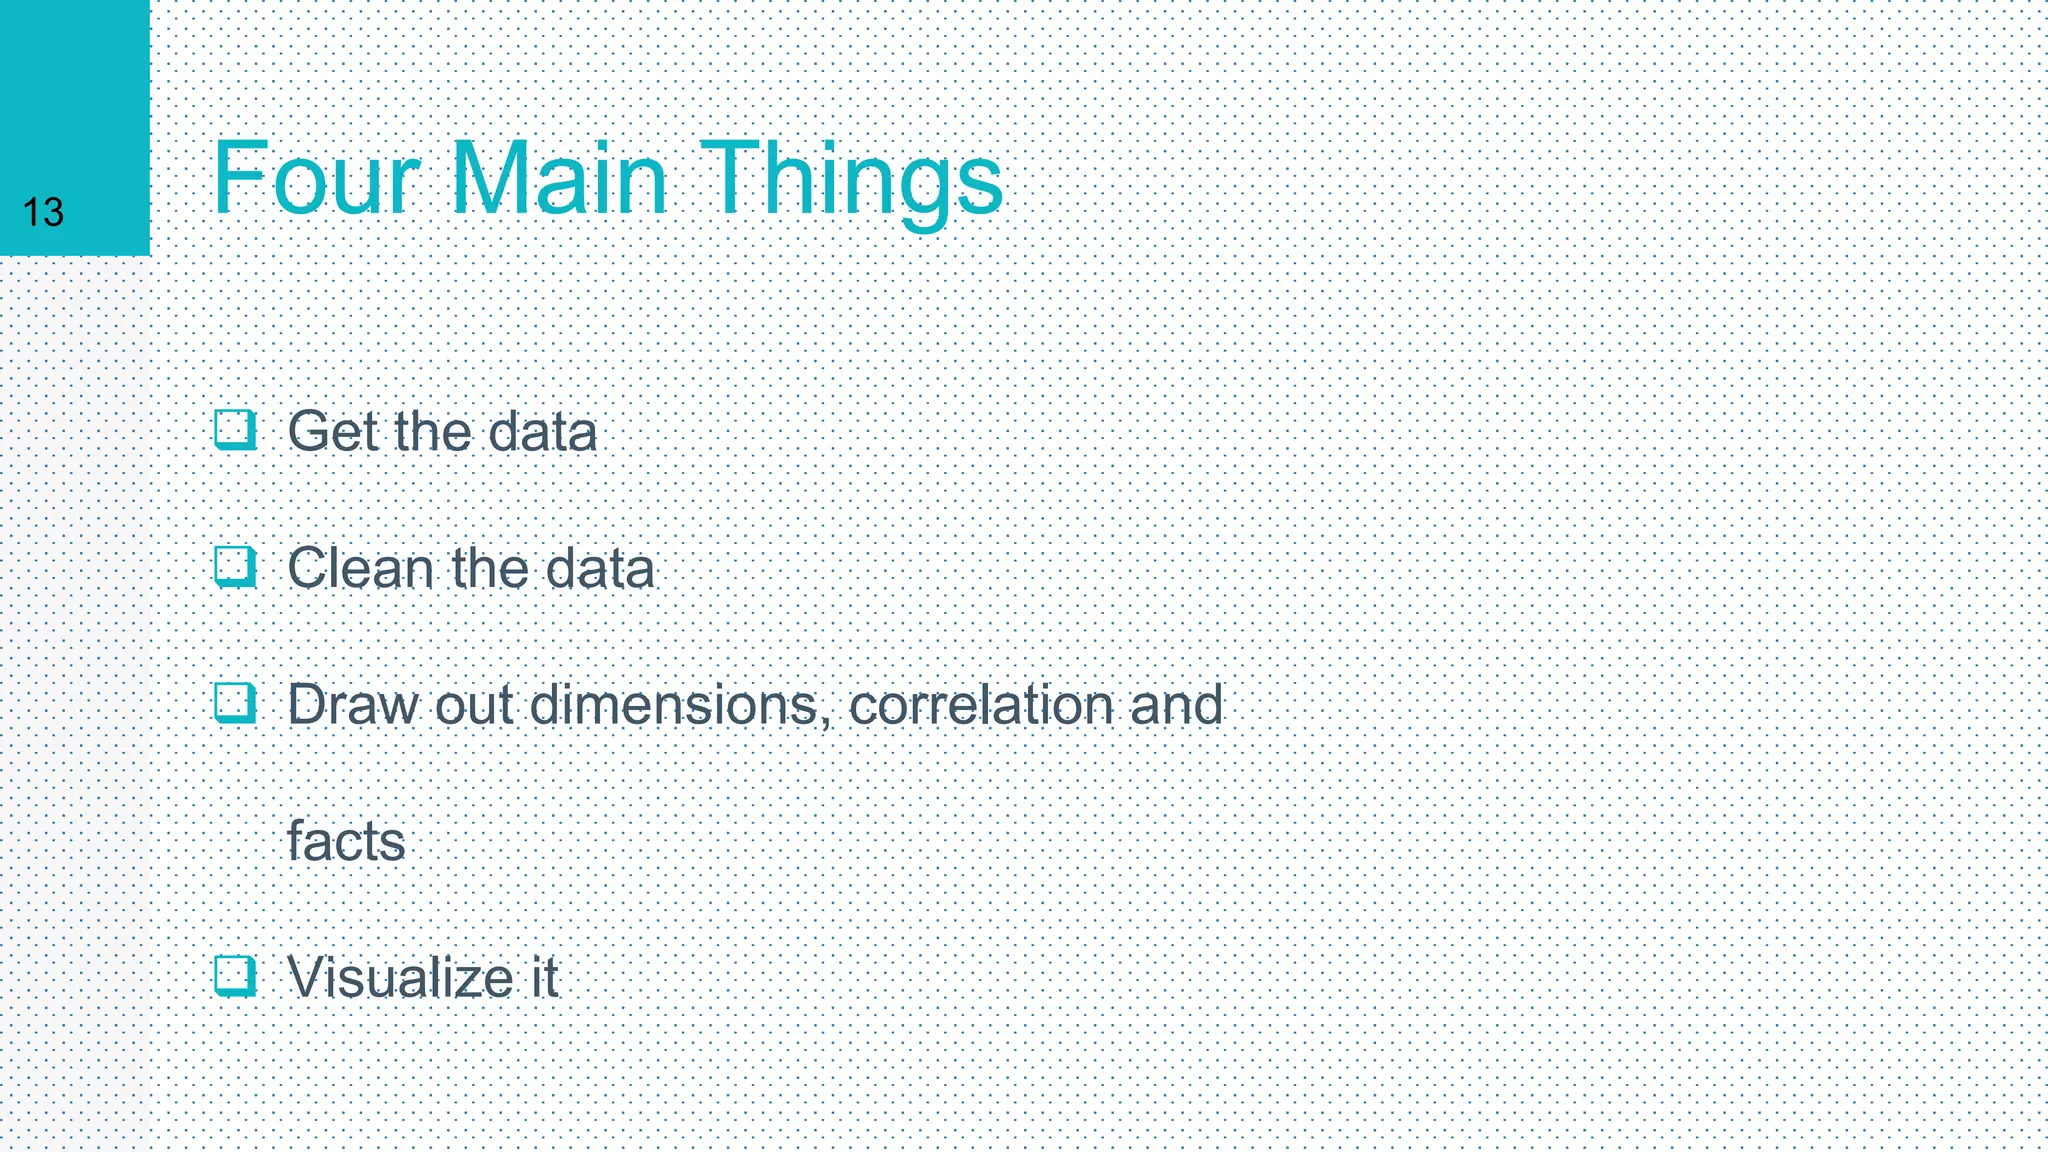
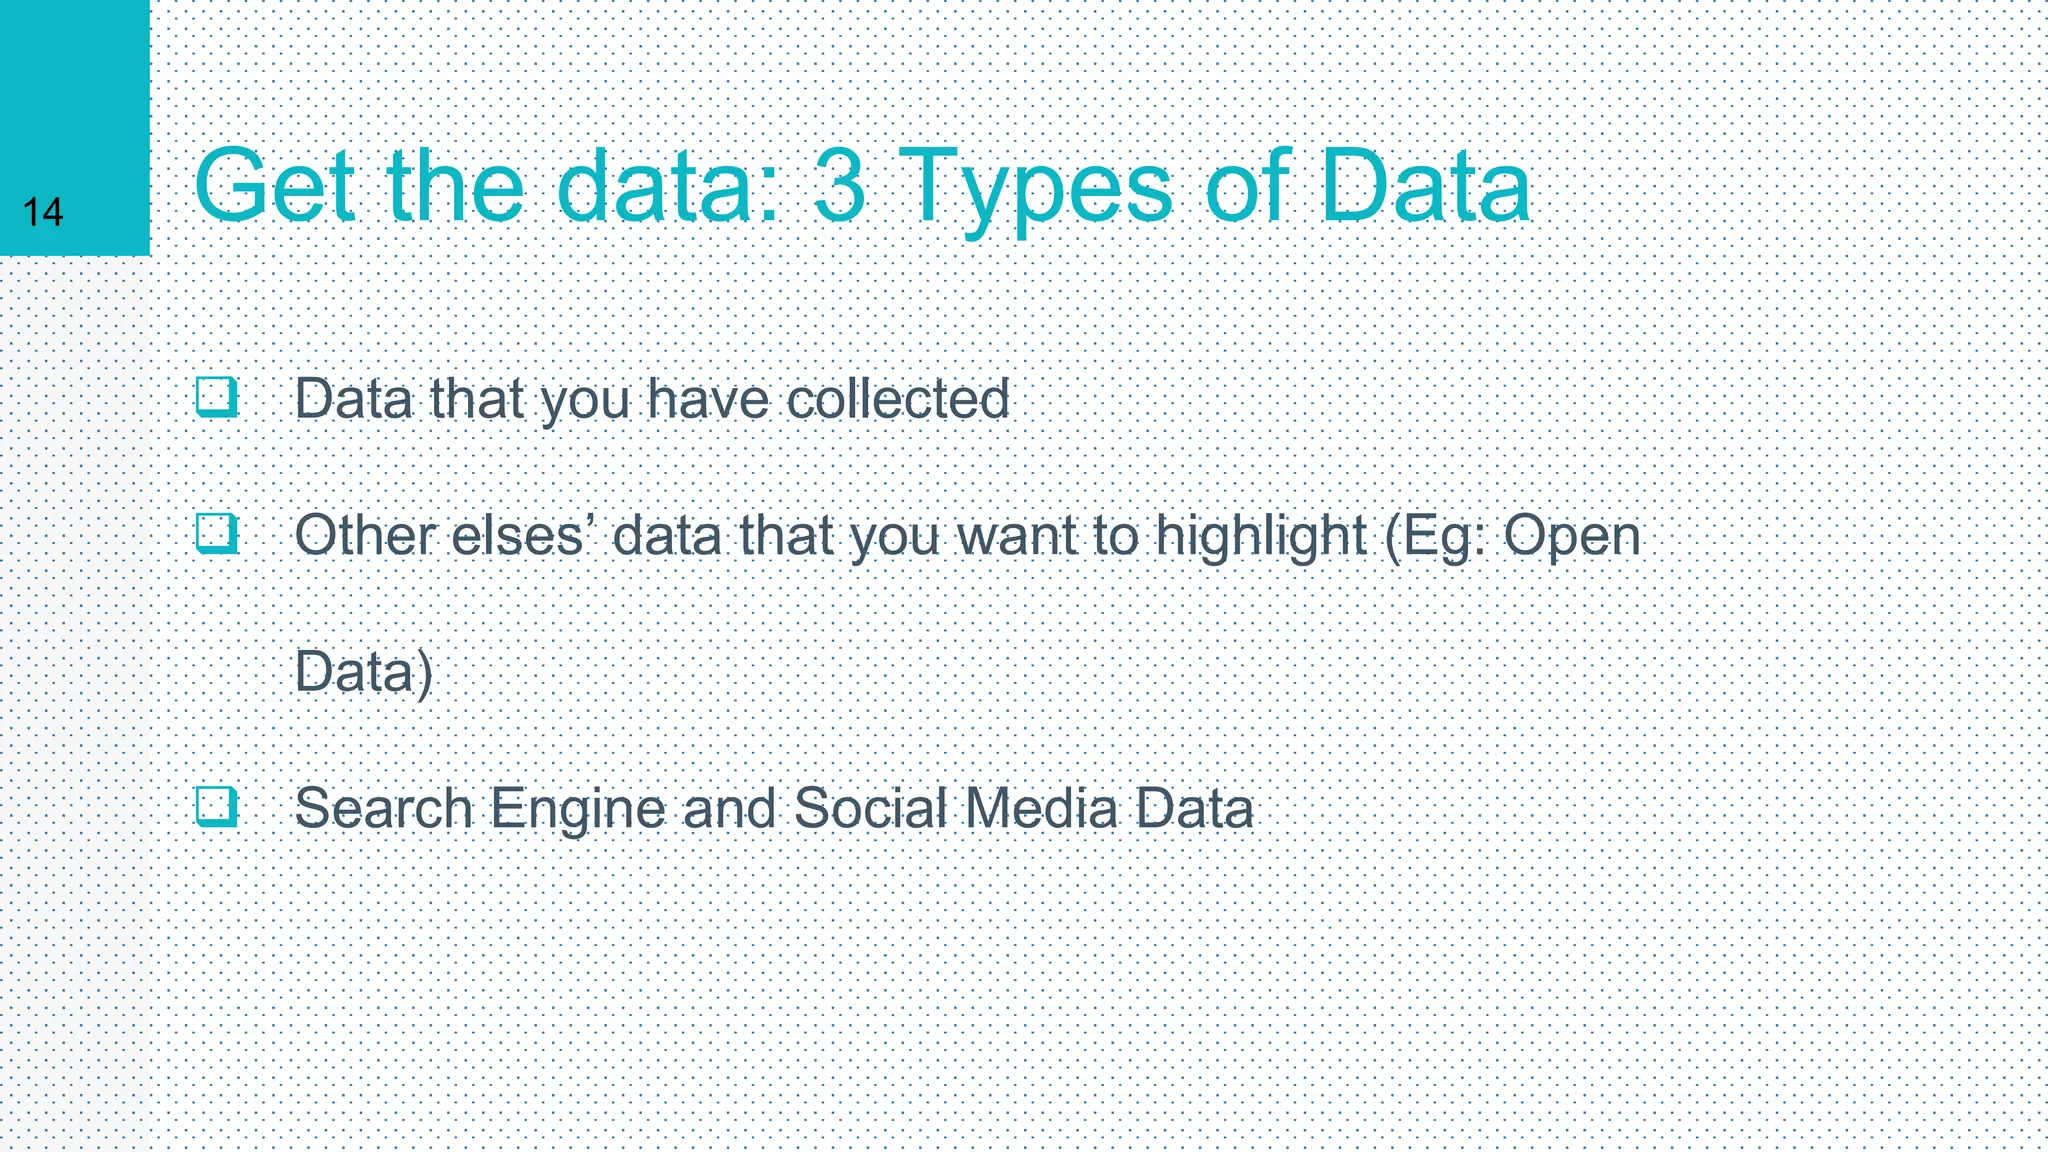
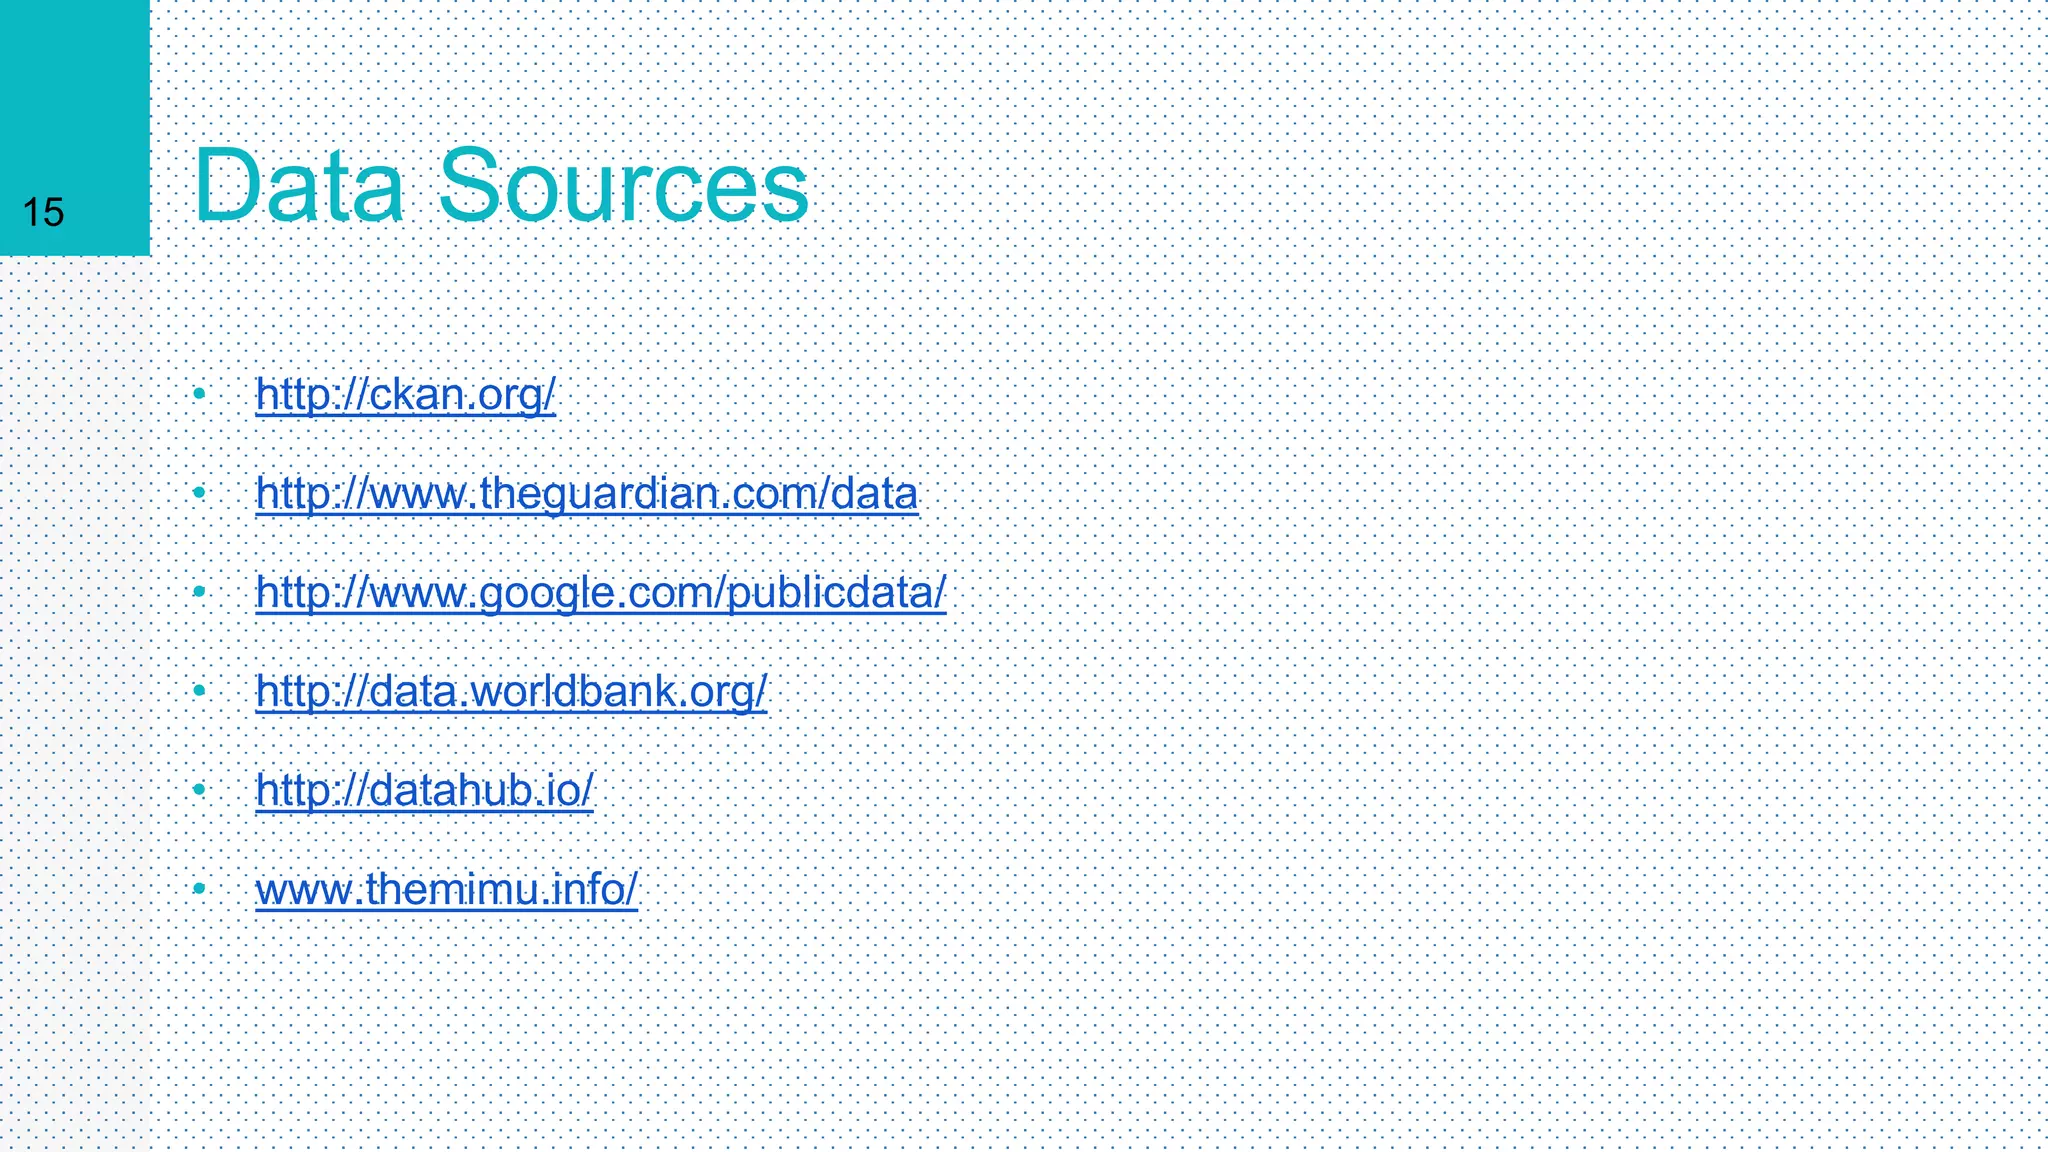
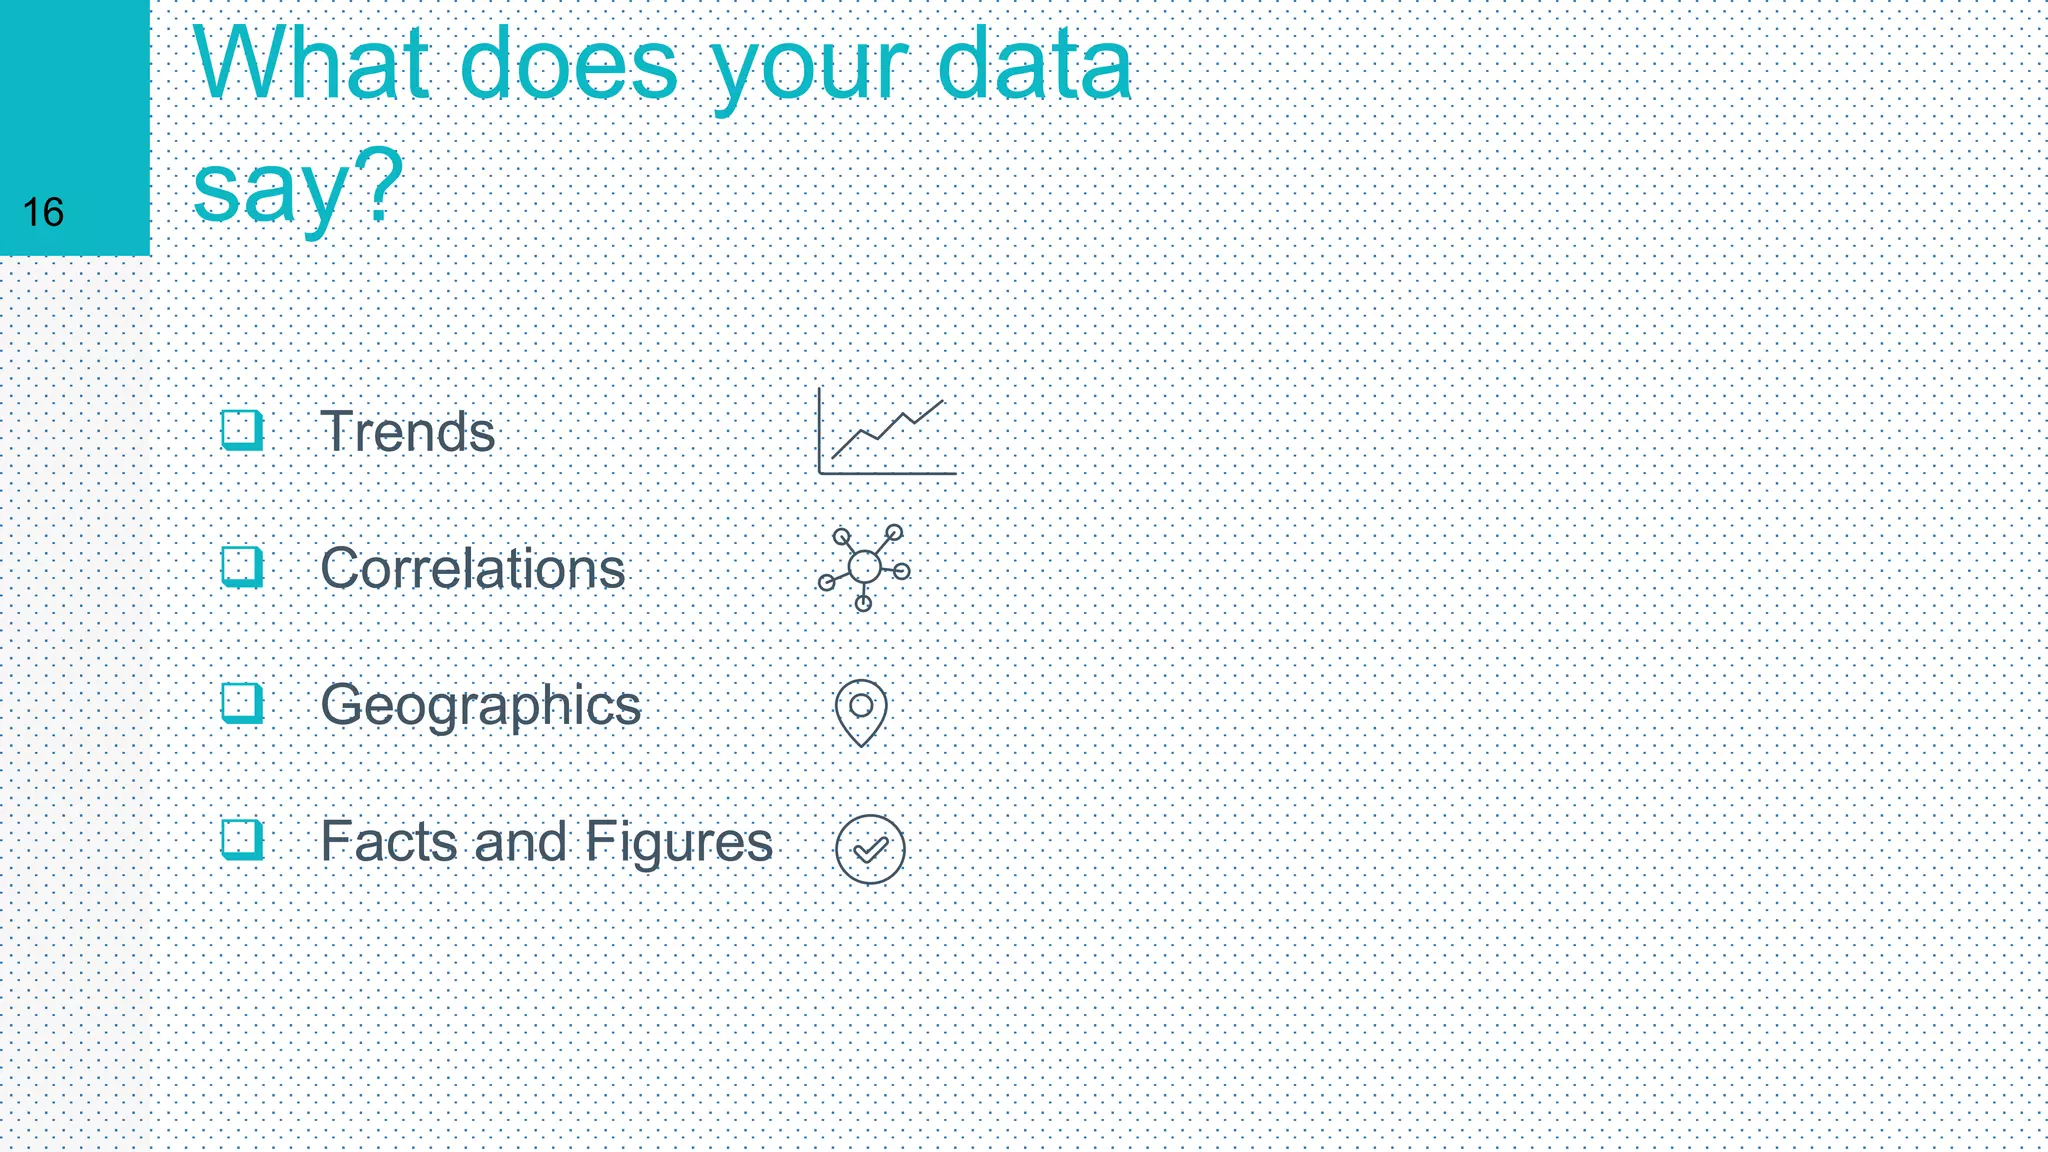
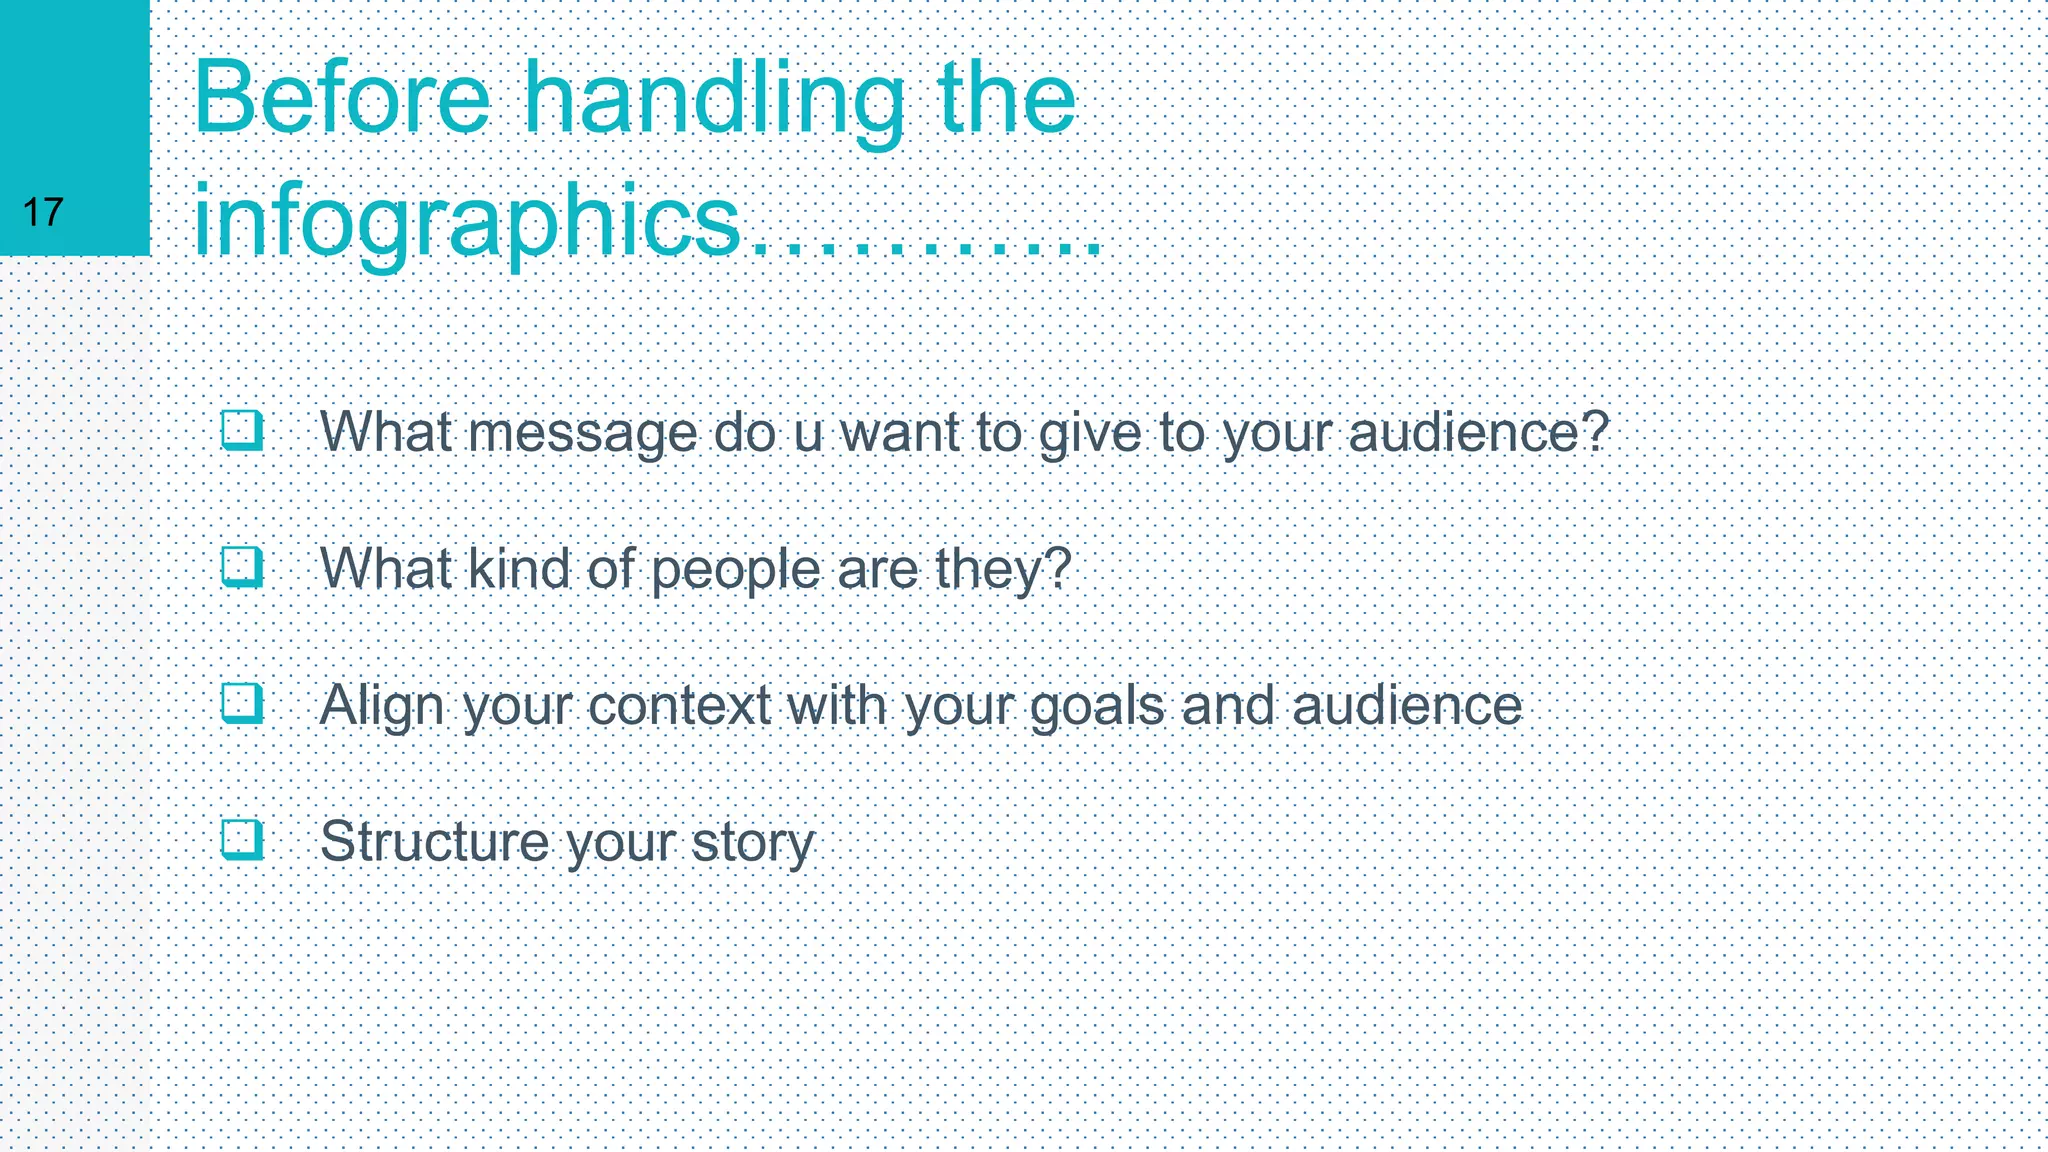
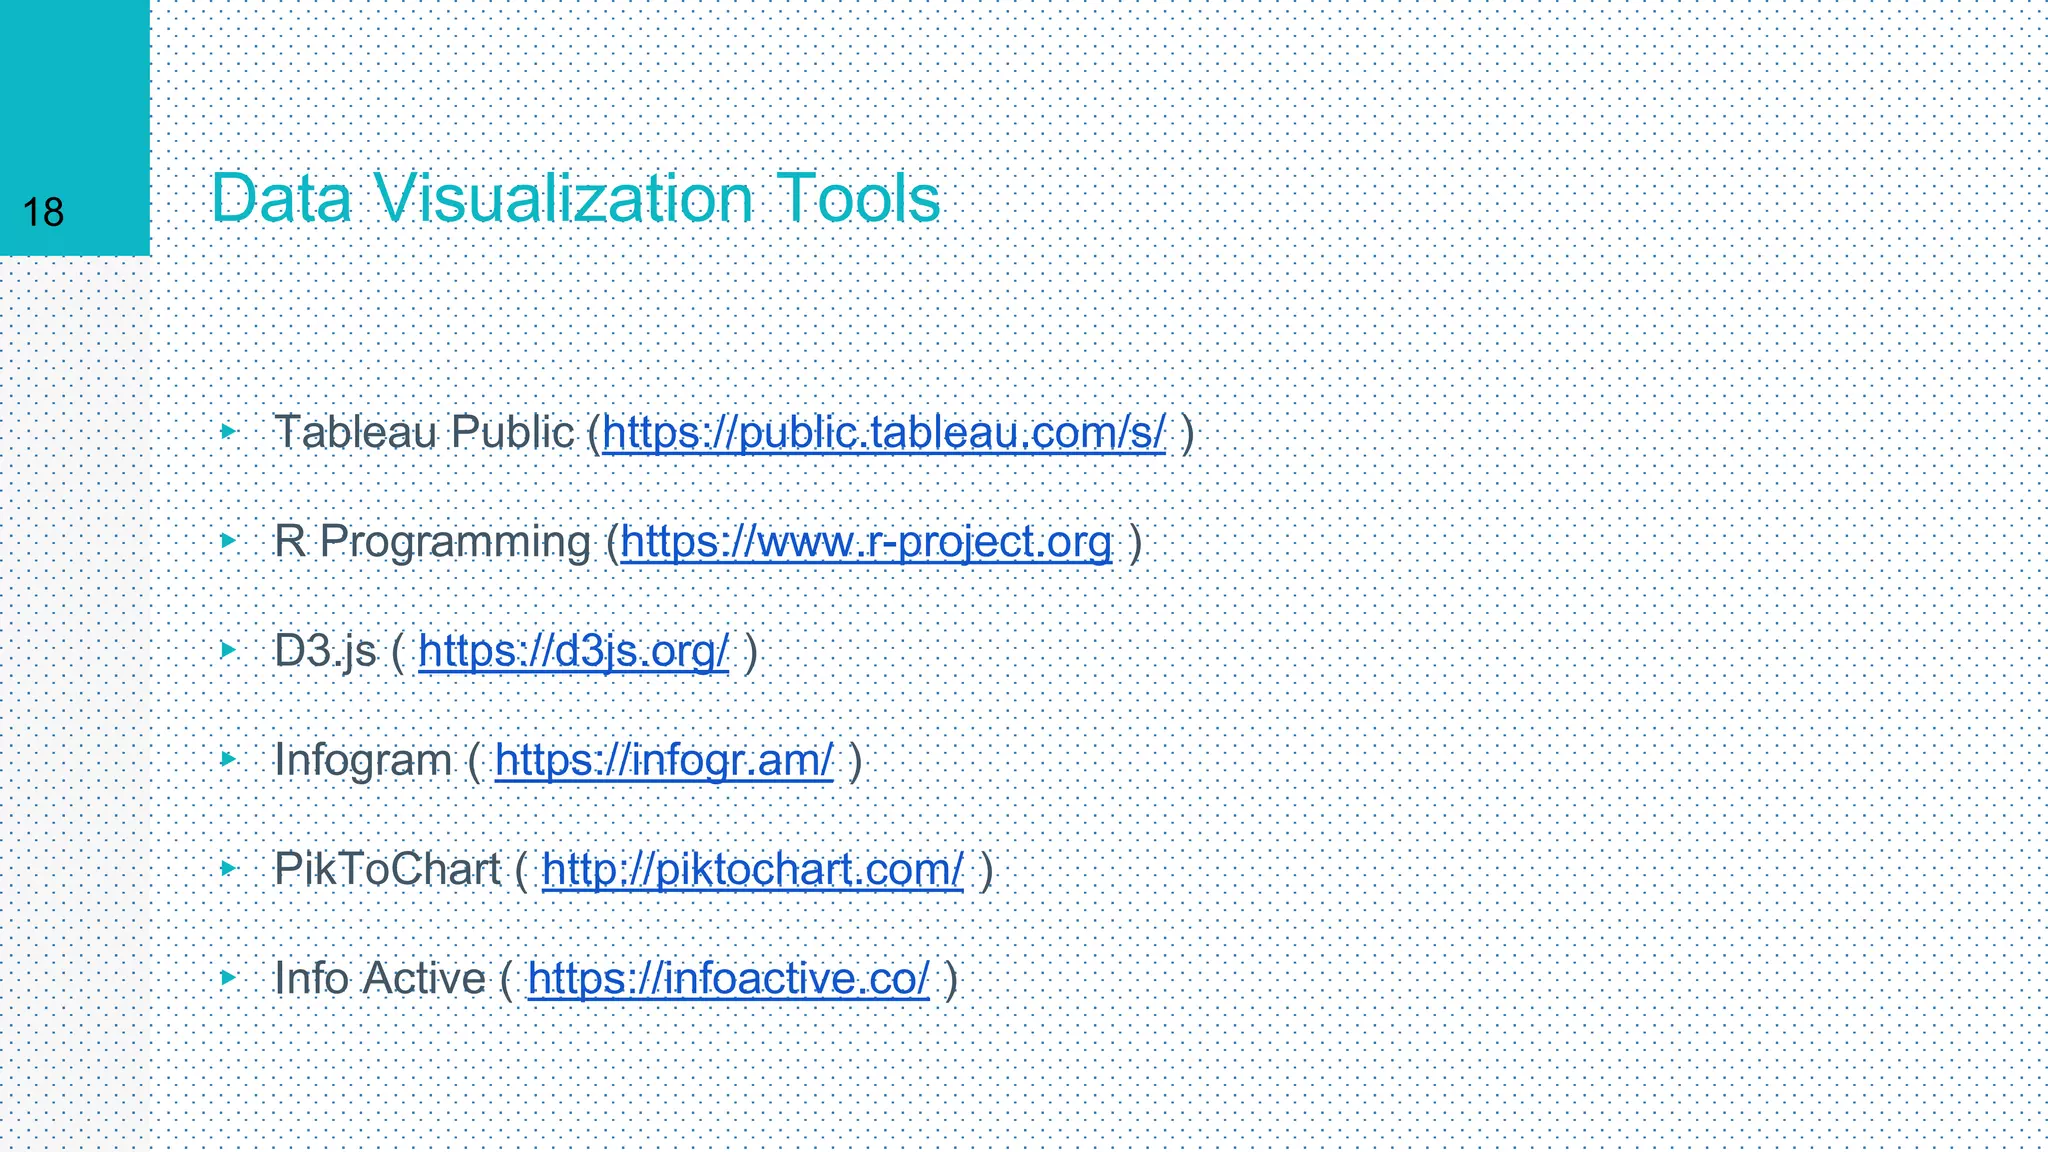
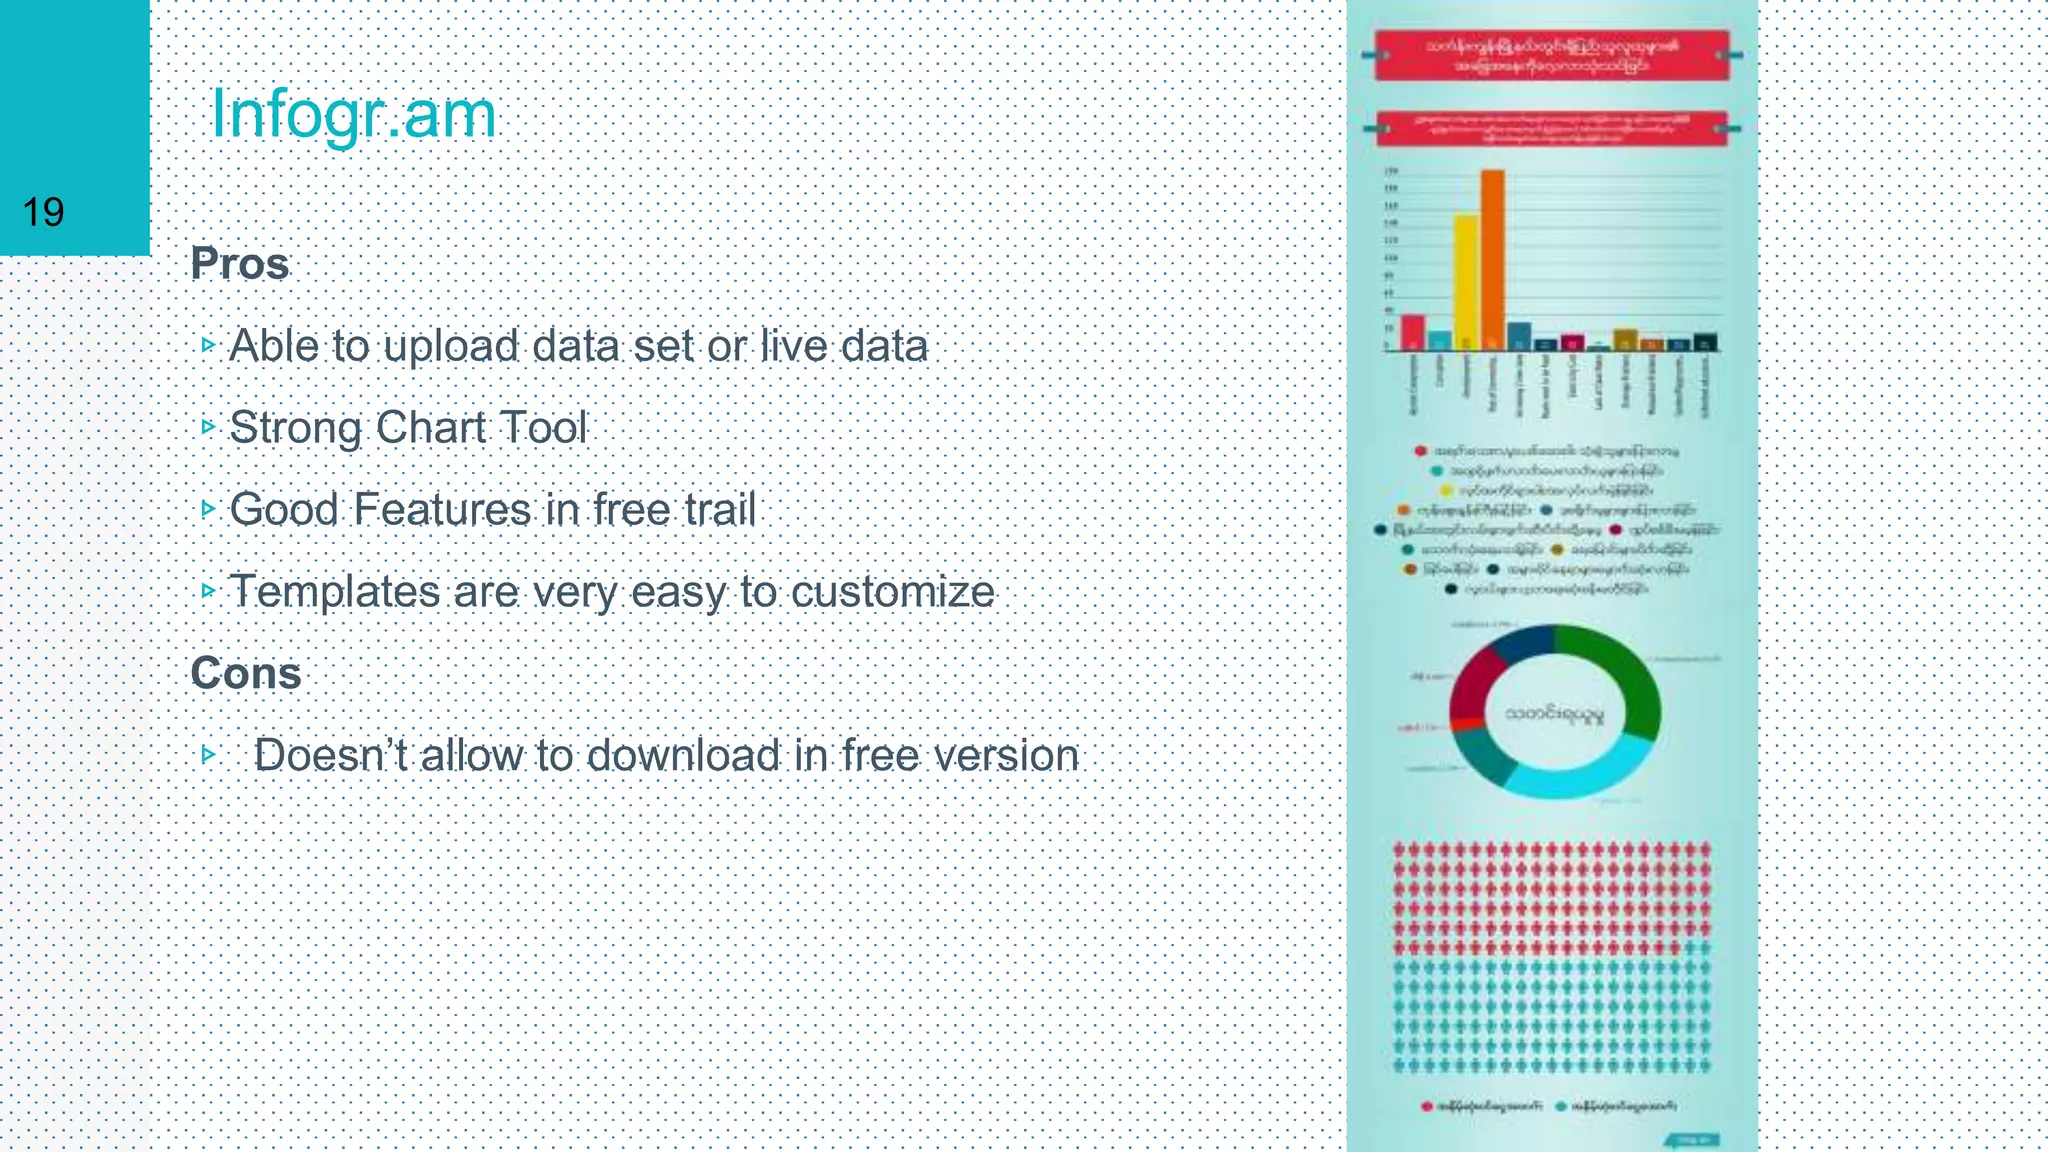
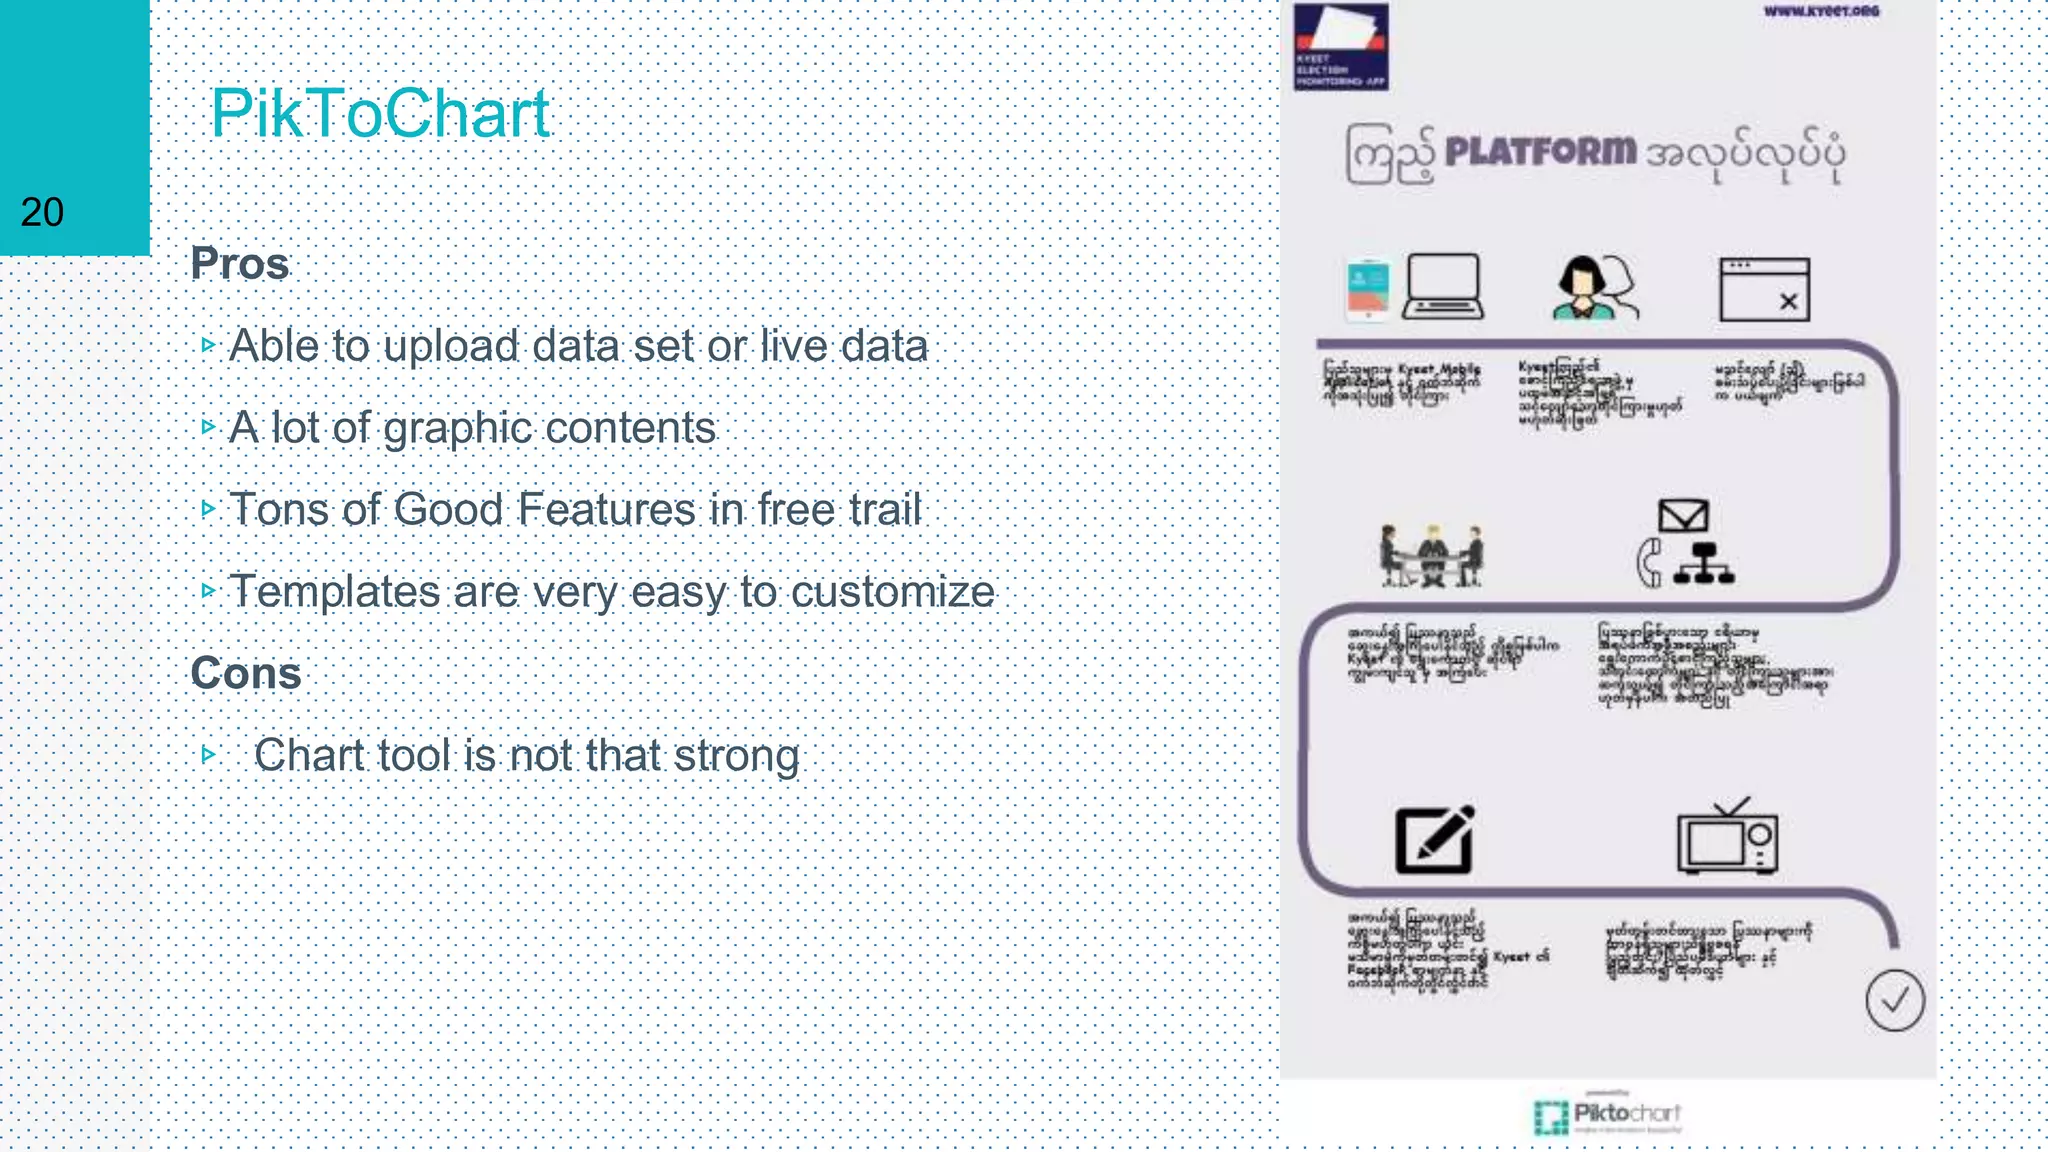
This document discusses mobile data collection and visualization tools. It begins by outlining advantages of mobile data collection like time efficiency and richer data. Challenges like initial trainings and device provisioning are also covered. Popular free and open source tools for data collection are introduced, including Google Forms, Survey Monkey, Formhub and Open Data Kit (ODK). ODK is recommended due to its capabilities and because it is free for unlimited data sets. The components of ODK like Build, Collect and Aggregate are described. Steps for data cleaning and visualization are outlined. Finally, visualization tools like Tableau, R and Infogram are mentioned.
Mobile Data Collection - opportunitiesmirjamschaap
Presentation for colleagues at brownbag of Centre for Development Innovation, Wageningen UR on potential of using mobile devices and Open Data Kit (ODK) for data collection. May 2014
Mobile Data Collection - opportunitiesmirjamschaap
Presentation for colleagues at brownbag of Centre for Development Innovation, Wageningen UR on potential of using mobile devices and Open Data Kit (ODK) for data collection. May 2014
A few to get started with ODK. Move away from the paper-based questionnaire to digital questionnaire, it will save you money and time. Its easy and its free
Mobile Offline First for inclusive data that spans the data divideRob Worthington
This presentation - given at the 2016 GovTech conference in South Africa - provides an overview of a new mobile offline first architecture for government applications
IBM THINK 2019 - Self-Service Cloud Data Management with SQL Torsten Steinbach
SQL is a powerful language to express data transformations. But did you know that you can also use IBM Cloud SQL to convert data between various data formats and layouts on disks? In this session, you will see the full power of using SQL Query to move and transform your cloud data in an entirely self-service fashion. You can specify any data format, layout or partitioning with a simple SQL statement. See how you can move and transform terabytes of data in the cloud in a very scalable fashion and still being charged only for the individual SQL movement and transformation jobs without having standing costs.
An introduction to the mobile data collection, messaging, and data visualization capabilities of Magpi. Since 2003, Magpi has been bringing powerful, affordable, and usable mobile tools to global health, international development, WASH, education, energy, and other sectors. Learn how Magpi can empower your organization!
Mobile App Test Attacks to Efficiently Explore SoftwareTEST Huddle
In the tradition of James Whittaker’s book series How to Break … Software, Jon Hagar applies the testing “attack” concept to the domain of mobile app software. Jon defines the sub-domain of mobile software and examines industry product failure caused by defects in that software. Next, Jon summarizes a set of attacks against mobile software based on these common modes of failure that testers can direct against their own app software to quickly find bugs. Specific attack methods identified include developer based cases, computation and control structures for batteries and sensor hubs, hardware-software interfaces, and communications. This session is based on the book: “Software Test Attacks to Break Mobile and Embedded Devices” CRC press, 2013
Key Takeaways:
- Breaking Mobile App Software to find bugs
- Embedded risk-based exploratory testing concepts
- Attack based testing specific to mobile devices
모바일 오피스 구축 확대
-전자문서 관리 및 유통 확대
-기업의 BYOD 환경과의 접목
업무용 APP 개발 확산
-기업/개인이 보유한 업무용 스마트 기기
-Android, i-OS, Windows RT등 모바일 OS
모바일 Data 보안의 필요성 확대
-모바일을 통한 데이터 유출통제 강화
-업무용단달기 분실(노브북포함) 대응
MDeC, Tune Talk, Effective Measure Mobile Data Visualization Hackathon (6-7 D...Peter Kua
Slides that was presented during the MDeC, Tune Talk, Effective Measure Mobile Data Visualization Hackathon on 6 & 7 Dec 2014. A 24-hour coding fest that saw over 30 teams sweat it out at Cyberjaya, Malaysia. Prizes were sponsored by Tune Talk, Dell and MDeC. A Malaysian Big Data Analytics Initiative.
SAP BusinessOjects Roambi Solution Relief - Mobile Data VisualizationChristian Kelly
Data is the lifeblood of your business. That’s why you’ve spent so much time and effort creating data resources to help people make better decisions. Now to throw another curve into the picture, how do I access this critical data on my mobile device?
Big Data and Data Visualization(Inforgraphics) 2012년 KISTI(한국정보과학기술연구원) 발표 자료Seul Koo
Presentation about Big Data and Data Visualization(Inforgraphics) at KISTI(Korea Institute of Science and Technology Information). Data Visualization Technology can analyze and find a hidden business opportunity through a systematic visualization tool for Big Data.
Training course on Mobile Data Collection using KoBoToolBox (form builder & S...gildasCrepin
Training on ODK on how to conduct or implementation digital data collection and monitor in real time data collection from the field.
Kobo Collect is being used for the training
Recognizing the importance of the agriculture sector, SADC Member States have taken steps to unleash
its potential in the region. To achieve that ambition and provide guidance in the implementation process,
SADC Vision 2050 and the Regional Indicative Strategic Development Plan (RISDP) were formulated,
resulting in the development of a set of policy documents, notably the Dar-es-Salaam Extraordinary
Summit Declaration and Plan of Action on Agriculture and Food Security, the Regional Agricultural
Investment Plan and the Regional Agricultural Policy (RAP). The latter provides the SADC short- and
long-term vision for the development of the agriculture sector.
Considering the importance of the agriculture sector in SADC Member States, and motivated by the
need to support the implementation of the aforementioned policies, a wide range of timely, reliable,
relevant and accurate data and statistics are required to help in formulating, managing, planning,
monitoring and evaluating the impact of those policies and investments. This increasing demand for
statistics, notably agricultural statistics, has prompted the need to minimize and/or eliminate error and
improve quality of data as well as statistical information released to better guide decision making and
increased efficiency of any policy, programme and project implemented.
Mobile Phone Based Data Collection using ODK and Kobo Toolbox has been recognized worldwide
as very useful and convenient data collection method substituting paper-based data collection method.
Due to the increase demand to Member States to generate accurate agricultural information and to
ensure timely reporting, a training curriculum has been developed on Mobile Data Collection using
Kobo Toolbox and ODK/KoboCollect.
Data Science at Scale - The DevOps ApproachMihai Criveti
DevOps Practices for Data Scientists and Engineers
1 Data Science Landscape
2 Process and Flow
3 The Data
4 Data Science Toolkit
5 Cloud Computing Solutions
6 The rise of DevOps
7 Reusable Assets and Practices
8 Skills Development
Open Data Portals: 9 Solutions and How they CompareSafe Software
Get a comparison of CKAN, Socrata, ArcGIS Open Data and other top open data solutions. Plus get answers to best practice questions such as: Which datasets are important to share? What are the approximate costs? Which file formats should the data be shared in? How often should the data get updated? And overall, how can we ensure success with our open data portal?
Open Data Kit, Digital data collection tool, training manual.pptxEbrahimSeid2
The Open Data Kit (ODK), developed by the Department of Computer Science and Engineering at the University of Washington, United Nations of America, is among the commonly used and preferred digital data collection tool by different organizations (especially NGOs). It supports a wide range of questions and answer types, and designed to work well without network connectivity.
In today’s day and age, where almost every work is possible through online applications and software, it is evident that people are going to turn to online methods to solve a problem. To help with accurate data collection you can choose a field data collection tool out of numerous tools available.
Field data collection software help you to collect surveys and research data in a systematized, easily presentable, and accurate manner. Using the right platform is very crucial for this. There are some data collection platforms mentioned here that make your work easier :
DevOps for Data Engineers - Automate Your Data Science Pipeline with Ansible,...Mihai Criveti
Automate your Data Science pipeline with Ansible, Python and Kubernetes - ODSC Talk
What is Data Science and the Data Science Landscape
Process and Flow
Understanding Data
The Data Science Toolkit
The Big Data Challenge
Cloud Computing Solutions
The rise of DevOps in Data Science
Automate your data pipeline with Ansible
This a talk that I gave at BioIT World West on March 12, 2019. The talk was called: A Gen3 Perspective of Disparate Data:From Pipelines in Data Commons to AI in Data Ecosystems.
Opendatabay - Open Data Marketplace.pptxOpendatabay
Opendatabay.com unlocks the power of data for everyone. Open Data Marketplace fosters a collaborative hub for data enthusiasts to explore, share, and contribute to a vast collection of datasets.
First ever open hub for data enthusiasts to collaborate and innovate. A platform to explore, share, and contribute to a vast collection of datasets. Through robust quality control and innovative technologies like blockchain verification, opendatabay ensures the authenticity and reliability of datasets, empowering users to make data-driven decisions with confidence. Leverage cutting-edge AI technologies to enhance the data exploration, analysis, and discovery experience.
From intelligent search and recommendations to automated data productisation and quotation, Opendatabay AI-driven features streamline the data workflow. Finding the data you need shouldn't be a complex. Opendatabay simplifies the data acquisition process with an intuitive interface and robust search tools. Effortlessly explore, discover, and access the data you need, allowing you to focus on extracting valuable insights. Opendatabay breaks new ground with a dedicated, AI-generated, synthetic datasets.
Leverage these privacy-preserving datasets for training and testing AI models without compromising sensitive information. Opendatabay prioritizes transparency by providing detailed metadata, provenance information, and usage guidelines for each dataset, ensuring users have a comprehensive understanding of the data they're working with. By leveraging a powerful combination of distributed ledger technology and rigorous third-party audits Opendatabay ensures the authenticity and reliability of every dataset. Security is at the core of Opendatabay. Marketplace implements stringent security measures, including encryption, access controls, and regular vulnerability assessments, to safeguard your data and protect your privacy.
Explore our comprehensive data analysis project presentation on predicting product ad campaign performance. Learn how data-driven insights can optimize your marketing strategies and enhance campaign effectiveness. Perfect for professionals and students looking to understand the power of data analysis in advertising. for more details visit: https://bostoninstituteofanalytics.org/data-science-and-artificial-intelligence/
Show drafts
volume_up
Empowering the Data Analytics Ecosystem: A Laser Focus on Value
The data analytics ecosystem thrives when every component functions at its peak, unlocking the true potential of data. Here's a laser focus on key areas for an empowered ecosystem:
1. Democratize Access, Not Data:
Granular Access Controls: Provide users with self-service tools tailored to their specific needs, preventing data overload and misuse.
Data Catalogs: Implement robust data catalogs for easy discovery and understanding of available data sources.
2. Foster Collaboration with Clear Roles:
Data Mesh Architecture: Break down data silos by creating a distributed data ownership model with clear ownership and responsibilities.
Collaborative Workspaces: Utilize interactive platforms where data scientists, analysts, and domain experts can work seamlessly together.
3. Leverage Advanced Analytics Strategically:
AI-powered Automation: Automate repetitive tasks like data cleaning and feature engineering, freeing up data talent for higher-level analysis.
Right-Tool Selection: Strategically choose the most effective advanced analytics techniques (e.g., AI, ML) based on specific business problems.
4. Prioritize Data Quality with Automation:
Automated Data Validation: Implement automated data quality checks to identify and rectify errors at the source, minimizing downstream issues.
Data Lineage Tracking: Track the flow of data throughout the ecosystem, ensuring transparency and facilitating root cause analysis for errors.
5. Cultivate a Data-Driven Mindset:
Metrics-Driven Performance Management: Align KPIs and performance metrics with data-driven insights to ensure actionable decision making.
Data Storytelling Workshops: Equip stakeholders with the skills to translate complex data findings into compelling narratives that drive action.
Benefits of a Precise Ecosystem:
Sharpened Focus: Precise access and clear roles ensure everyone works with the most relevant data, maximizing efficiency.
Actionable Insights: Strategic analytics and automated quality checks lead to more reliable and actionable data insights.
Continuous Improvement: Data-driven performance management fosters a culture of learning and continuous improvement.
Sustainable Growth: Empowered by data, organizations can make informed decisions to drive sustainable growth and innovation.
By focusing on these precise actions, organizations can create an empowered data analytics ecosystem that delivers real value by driving data-driven decisions and maximizing the return on their data investment.
Techniques to optimize the pagerank algorithm usually fall in two categories. One is to try reducing the work per iteration, and the other is to try reducing the number of iterations. These goals are often at odds with one another. Skipping computation on vertices which have already converged has the potential to save iteration time. Skipping in-identical vertices, with the same in-links, helps reduce duplicate computations and thus could help reduce iteration time. Road networks often have chains which can be short-circuited before pagerank computation to improve performance. Final ranks of chain nodes can be easily calculated. This could reduce both the iteration time, and the number of iterations. If a graph has no dangling nodes, pagerank of each strongly connected component can be computed in topological order. This could help reduce the iteration time, no. of iterations, and also enable multi-iteration concurrency in pagerank computation. The combination of all of the above methods is the STICD algorithm. [sticd] For dynamic graphs, unchanged components whose ranks are unaffected can be skipped altogether.
Chatty Kathy - UNC Bootcamp Final Project Presentation - Final Version - 5.23...John Andrews
SlideShare Description for "Chatty Kathy - UNC Bootcamp Final Project Presentation"
Title: Chatty Kathy: Enhancing Physical Activity Among Older Adults
Description:
Discover how Chatty Kathy, an innovative project developed at the UNC Bootcamp, aims to tackle the challenge of low physical activity among older adults. Our AI-driven solution uses peer interaction to boost and sustain exercise levels, significantly improving health outcomes. This presentation covers our problem statement, the rationale behind Chatty Kathy, synthetic data and persona creation, model performance metrics, a visual demonstration of the project, and potential future developments. Join us for an insightful Q&A session to explore the potential of this groundbreaking project.
Project Team: Jay Requarth, Jana Avery, John Andrews, Dr. Dick Davis II, Nee Buntoum, Nam Yeongjin & Mat Nicholas
Adjusting primitives for graph : SHORT REPORT / NOTESSubhajit Sahu
Graph algorithms, like PageRank Compressed Sparse Row (CSR) is an adjacency-list based graph representation that is
Multiply with different modes (map)
1. Performance of sequential execution based vs OpenMP based vector multiply.
2. Comparing various launch configs for CUDA based vector multiply.
Sum with different storage types (reduce)
1. Performance of vector element sum using float vs bfloat16 as the storage type.
Sum with different modes (reduce)
1. Performance of sequential execution based vs OpenMP based vector element sum.
2. Performance of memcpy vs in-place based CUDA based vector element sum.
3. Comparing various launch configs for CUDA based vector element sum (memcpy).
4. Comparing various launch configs for CUDA based vector element sum (in-place).
Sum with in-place strategies of CUDA mode (reduce)
1. Comparing various launch configs for CUDA based vector element sum (in-place).
1. Mobile Data Collection and
Data Visualization tools
Myo Min Oo
Chalk & Slate
www.chalkandslate.co
info@chalkandslate.co
1
2. Advantages of Mobile in data
collection
▹ Time efficient – skip the secondary data entry step
▹ Faster transmission
▹ Accuracy of Data (Less text errors)
▹ Richer data (Pictures, GPS, BarCode, Audio, Video, etc…)
▹ Easier to analyze
▹ almost ready to visualize
2
3. Challenges for Mobile Data
Collection
▹Initial trainings for surveyors
▹Connection Problems
▹Provision of Mobile Devices
▹OS Version Compatibility
▹Resolution of System Problems
▹Font Compatibility (Especially Myanmar Fonts) Both front end and back
end
3
4. Tools for Data Collection
▹Google Forms (200000 Cells Limit)
▹Survey Monkey (Only 100 records for free version, $299 for unlimited)
▹Formhub (Free)
▹Open Data Kit ( Free)
▹Kobo Tool box (Free)
▹Collect
4
5. Why we used ODK?
▹It’s free no matter how large your data set is (Other free tools have limits)
▹The forms can be created using powerful form design tools like Formhub,
XLS2XForm, Vellum, or Kobo, or PurcForms
▹Data can be exported not only to (.xls) (.csv) files but also to files like
(.kml) or shape files
▹Can operate offline
▹Can record audio, video, geographic codes, barcodes,
▹It’s Open Source
5
6. Components of ODK
▹Build - ODK Build enables users to generate forms using a drag-and-drop
▹Collect - ODK Collect smartphone application
▹Aggregate - ODK Aggregate provides a ready to deploy online repository to
store, view and export collected data.
▹Form Uploader - ODK Form Uploader easily upload a blank form and its
media files to ODK Aggregate.
▹Briefcase - ODK Briefcase is the best way to transfer data from Collect and
Aggregate.
▹Validate - ODK Validate ensures that you have a OpenRosa compliant form
-- one that will also work with all the ODK tools.
6
11. 11 Data Cleansing Tools …..
Data Wrangler (http://vis.stanford.edu/wrangler/) (From Stanford
University)
Open Refine (Google Refine)
(https://code.google.com/archive/p/google-refine/) (From Google)
R Programming (https://www.r-project.org ) from R Core Team
Tableau Public (https://public.tableau.com/s/ )
Microsoft Excel from Microsoft
13. Four Main Things
Get the data
Clean the data
Draw out dimensions, correlation and
facts
Visualize it
13
14. 14 Get the data: 3 Types of Data
Data that you have collected
Other elses’ data that you want to highlight (Eg: Open
Data)
Search Engine and Social Media Data
16. 16
What does your data
say?
Trends
Correlations
Geographics
Facts and Figures
17. 17
Before handling the
infographics………..
What message do u want to give to your audience?
What kind of people are they?
Align your context with your goals and audience
Structure your story
18. Data Visualization Tools
▸ Tableau Public (https://public.tableau.com/s/ )
▸ R Programming (https://www.r-project.org )
▸ D3.js ( https://d3js.org/ )
▸ Infogram ( https://infogr.am/ )
▸ PikToChart ( http://piktochart.com/ )
▸ Info Active ( https://infoactive.co/ )
18
19. Infogr.am
Pros
▹Able to upload data set or live data
▹Strong Chart Tool
▹Good Features in free trail
▹Templates are very easy to customize
Cons
▹ Doesn’t allow to download in free version
19
20. PikToChart
Pros
▹Able to upload data set or live data
▹A lot of graphic contents
▹Tons of Good Features in free trail
▹Templates are very easy to customize
Cons
▹ Chart tool is not that strong
20