SlideShare a Scribd company logo
1 of 85
Download to read offline
Mitacs Accelerate Project
Final Report
Comparative assessment of NH3 production and utilization in agriculture,
energy and utilities, and transportation systems for Ontario
Period:
January-June 2016
Submission Date:
June 17, 2016
Supervisor:
Prof. Dr. Ibrahim Dincer
Intern:
Yusuf Bicer
Partner Organization:
Hydrofuel Inc.
1
TABLE OF CONTENTS
Table of Contents.............................................................................................................................1
Acknowledgment.............................................................................................................................2
Nomenclature...................................................................................................................................3
Summary..........................................................................................................................................4
CHAPTER 1. COMPARATIVE ASSESSMENT OF ALTERNATIVE FUELED
VEHICLES INCLUDING AMMONIA
1. Introduction..................................................................................................................................5
2. Methodology................................................................................................................................6
2.1 Uncertainty analyses..................................................................................................................7
3. Systems Description.....................................................................................................................7
3.1 Passenger car manufacturing .....................................................................................................7
3.2 Maintenance...............................................................................................................................8
3.3 Disposal of the vehicles .............................................................................................................8
3.4 Operation of vehicles.................................................................................................................9
4. Results and Discussion ..............................................................................................................11
4.1 Comparison of Various Fuels Production................................................................................24
4.2 Ammonia vs. Natural Gas........................................................................................................27
5. Conclusions................................................................................................................................28
CHAPTER 2. AMMONIA FROM HYDROCARBON DISSOCIATION
1. Thermo-Catalytic Decomposition of Liquid Hydrocarbons....................................................30
2. Comparison of Furnace and Plasma Processes........................................................................34
3. Microwave Usage for Hydrocarbons Applications..................................................................44
4. Microwaves and Radio Frequency Applications in Oil Sands ................................................46
5. Microwave-Assisted Oil Sands Separation..............................................................................46
6. Microwave-Assisted Oil Sands/Oil Shale Extraction..............................................................47
7. In-Situ Recovery of Oil by Electromagnetic Heating..............................................................47
8. Conclusions..............................................................................................................................52
CHAPTER 3. CASE STUDIES
1. Experimental Investigation of Ammonia Synthesis via Molten Salt Electrolyte Based
Electrochemical Route.............................................................................................................54
2. Ammonia Production Using Water Electrolysis from Low-Cost Hydropower and Wind Energy
..................................................................................................................................................59
3. Ammonia Production From Steam Methane Reforming (SMR) with CO2 Capture and
Sequestration............................................................................................................................62
4. Cost Analyses Results..............................................................................................................64
5. Environmental Impact Assessment Results.............................................................................74
6. Efficiency and Sustainability Assessment Results ..................................................................78
7. Conclusions..............................................................................................................................80
References......................................................................................................................................81
2
ACKNOWLEDGEMENT
The principal investigator and intern acknowledge the financial support provided by the Mitacs
and Hydrofuel Inc.
3
Nomenclature
ATR Auto-thermal Reforming
AP Acidification Potential
BTX Benzene-toluenexylene-ethylbenzene
CCS Carbon Capture Storage
CF Carbon Filaments
CML Center of Environmental Science of Leiden University
CNG Compressed Natural Gas
CV Coefficient of Variance
CNT Carbon Nanotubes
DBD Dielectric Barrier Discharge
EV Electric Vehicle
FCC Federal Communications Commission
GHG Greenhouse Gas
GREET Greenhouse Gases, Regulated Emissions, and Energy Use in Transportation
GTA Greater Toronto Area
HEV Hybrid Electric Vehicle
HF High Frequency
HRF Heavy Residual Fractions
HRSG Heat Recovery Steam Generator
ICE Internal Combustion Engine
ISO International Organization for Standards
LCA Life Cycle Assessment
LHV Lower Heating Value
LPG Liquefied Petroleum Gas
MSWI Municipal Waste Incineration Plant
ODP Ozone Layer Depletion
PEC Photoelectrochemical
POX Partial Oxidation
PSA Pressure Swing Absorption
PTW Pump to Wheel
RCV Refuse Collection Vehicles
RF Radio Frequency
SAF Super Abrasion Furnace
SD Standard Deviation
SI Sustainability Index
SMR Steam Methane Reforming
TCD Thermo-catalytic Decomposition
UCG Underground Coal Gasification
UCTE Union for the Co‐ordination of Transmission of Electricity
UOP Universal Oil Products
WGS Water Gas Shift
WTP Wheel to Pump
WTW Well to Wheel
4
SUMMARY
In this first section of the final report, a comparative life cycle assessment of internal combustion
engine (ICE) based vehicles fueled by various fuels, ranging from hydrogen to gasoline, is
conducted in addition to electric and hybrid electric vehicles. Various types of vehicles are
considered, such as ICE vehicles using gasoline, diesel, LPG, methanol, CNG, hydrogen and
ammonia; hybrid electric vehicles using 50% gasoline and 50% electricity; and electric only
vehicles for comprehensive comparison and environmental impact assessment. The processes are
analyzed from raw material extraction to vehicle disposal using life cycle assessment
methodology. In order to reflect the sustainability of the vehicles, seven different environmental
impact categories are considered: abiotic depletion, acidification, eutrophication, global warming,
human toxicity, ozone layer depletion and terrestrial ecotoxicity. The energy resources are chosen
mainly conventional and currently utilized options to indicate the actual performances of the
vehicles. The results show that electric and hybrid electric vehicles result in higher human toxicity,
terrestrial ecotoxicity and acidification values because of manufacturing and maintenance phases.
In contrast, hydrogen and ammonia vehicles yield the most environmentally benign options.
In the second section of this report, production of ammonia using conventional
hydrocarbons is investigated by implying current technologies and developments. Hydrogen can
be produced by dissociation of hydrocarbons which can be then converted to ammonia using a
nitrogen supply. Decomposition of heavy fractions can bring some challenges because of various
metal and sulfur contents, however, purification is possible and applicable. There are multiple
pathways for decomposition namely; thermal, non-thermal, plasma, non-plasma techniques. An
alternative method of hydrogen and ammonia production from hydrocarbons is their thermal
decomposition which is accompanied by the formation of carbon deposits. Methane can be
thermally or thermocatalytically decomposed (TCD) into carbon and hydrogen without CO or CO2
production. There are some research papers and patents in the literature regarding the application
of microwave energy for hydrocarbons. They have shown that bitumen, which is the end product
from oil sand, can be decomposed using microwave energy. Many of the inorganic particles in
processed oil sands hold a charge, and could be influenced by electromagnetic radiation. They are
excited at a different rate than the water and bitumen when irradiated, creating a temperature
gradient between the different components of the oil sands.
In the third section, detailed cost and feasibility analyses of various key scenarios for
production, storage and transportation of ammonia in Ontario, Newfoundland and Labrador, and
Alberta are performed. Renewable resources based ammonia is quite attractive supplying similar
costs in some cases compared to conventional steam methane reforming route. The high
hydroelectric and wind energy source potential of Newfoundland and Labrador make the energy
storage attractive using ammonia. Ontario, with decreasing electricity prices, has potentials for
hydropower especially in Northwestern region for on-site ammonia production. The hydrocarbon
decomposition option is also considered for Alberta province and it is observed that the cost of
ammonia can be lower than conventional steam methane reforming. Storage and transportation of
ammonia brings additional costs after production which is a significant disadvantage for long
distance transportation. The results imply that using appropriate renewable resources and cleaner
hydrocarbon utilization paths, ammonia production can be cost-effective and environmentally
friendly.
5
CHAPTER 1. COMPARATIVE ASSESSMENT OF ALTERNATIVE FUELED
VEHICLES INCLUDING AMMONIA
1. Introduction
The transportation sector is one of the fundamental sectors contributing the GHG emissions
worldwide. In a current report by International Energy Agency (IEA), it can be seen that the
transportation sector consumed 61.2% of the world's oil, subsidizing 28% of the total final energy
supply [1] and 23% of the world's CO2 emissions [2]. Because of these reasons, a further
investigation for sustainable transport systems is considered to diminish the utilization of fossil
fuels, by implementing alternative fuels such as biofuels, electricity and ammonia. Globally,
generation of electricity and heat relies greatly on coal which is in fact the most carbon intensive
fossil fuel. The usage of fossil fuel based electricity decreases the attractiveness of electric (EV)
and hybrid electric (HEV) vehicles. Henceforth, noteworthy attention should be paid to the power
generation technologies and their CO2 intensity, used to supply electricity to EVs or HEVs.
As an alternative energy carrier and transportation fuel, ammonia (NH3), is a deviation of
hydrogen fuel. It is a molecule which composes of three atoms of hydrogen and one atom of
nitrogen. Note that the physical characteristics of ammonia are similar to propane. The capability
to convert a liquid at adequate pressure permits ammonia to store more hydrogen per unit volume
than compressed hydrogen/cryogenic liquid hydrogen. Besides having a significant advantages in
storing and transporting hydrogen, ammonia may also be burned directly in ICE. Compared to
gasoline vehicles, ammonia-fueled vehicles do not produce direct CO2 emission during operation.
. Furthermore, ammonia can be produced at locations where oil and natural gas extraction wells
are located. In this way, generated CO2 can be reinjected into the ground for sequestration.
Ammonia can then be easily transferred through pipelines, railway cars, and ships by delivering
to consumption area where it may be utilized as a source of hydrogen, chemical substance,
fertilizer for agriculture, fuel for transportation, power generation sector, and working fluid or
refrigerant. Ammonia as a hydrogen carrier seems to be more attractive than methane in numerous
features such as storing more hydrogen energy per volumetric tank, having three times less energy
cost, having fewer danger because of non-flammability and being non-explosive in spite of its
toxicity.
One of the key factors in decision of alternative fueled vehicles is to conduct life cycle
assessment from cradle to grave. In this progress report, a comprehensive environmental impact
analyses of fuel and vehicle cycle of various fueled passenger cars are investigated using life cycle
assessment tool. The environmental impact categories taken into account in this study are human
toxicity, global warming, acidification potential, eutrophication, depletion of abiotic resources,
stratospheric ozone depletion and terrestrial ecotoxicity. The considered vehicle options for
analyses and assessments are listed as follows:
 Gasoline fueled ICE vehicle
 Diesel fueled ICE vehicle
 Methanol (90%) & gasoline (10%) fueled ICE vehicle
 Electric vehicle (EV) using lithium ion battery
 Hybrid electric vehicle (HEV) using lithium ion battery and ICE
 Ammonia fueled ICE
 Hydrogen fueled ICE
 Liquefied petroleum gas (LPG) fueled vehicle
 Compressed natural gas (CNG) fueled vehicle.
6
2. Methodology
A characteristic life cycle of a vehicle technology can be categorized into two main steps, namely
fuel cycle and vehicle cycle. In the fuel cycle, the processes beginning from the feedstock
production to fuel utilization in the vehicle are considered. At this phase of CNG production, the
related input of energy to extract natural gas and the emissions linked to the extraction are taken
into account. Similarly, the extraction of crude petroleum is accounted for diesel. Transformation
of crude oil feedstock into useful fuels is a too energy intensive stage of the fuel cycle, producing
substantial amounts of GHG. Nevertheless, purification of natural gas results in considerably fewer
energy usage and GHG. The fuel needs to be transported to be available for vehicle usage. Hence,
emissions and energy usages associated with fueling trucks/pipelines are thus accounted for in the
fuel delivery step [3]. The boundaries of the current analyses are illustrated in Fig. 1 including fuel
and vehicle cycles.
A noteworthy part of any life cycle analysis involves gathering of reliable data. The
excellence of data has a deep influence on the quality of the results predicted or estimated by an
LCA tool. National Laboratory has developed a full life cycle model called GREET (Greenhouse
gases, Regulated Emissions, and Energy use in Transportation), sponsored by the U.S. Department
of Energy, Office of Energy Efficiency and Renewable Energy, which allows to evaluate various
vehicle and fuel combinations on a full fuel cycle or vehicle cycle basis.
Raw material
Energy production
Production/assembly/
infrastructure and auxiliaries
Transport services
Vehicle
ManufacturingVehicle OperationVehicle Disposal
Vehicle Maintenance
Energy production Energy consumptionEnergy
transmission
Energy production
Transport services
Infrastructure
Fig.1. Boundaries of conducted LCA analyses including fuel/vehicle cycle.
It is a strong software with a substantial amount of alternative vehicles. It takes into account
the well to pump (WTP) and well to wheel (WTW) processes. WTW phases for each fuel starts
with the extraction of the primary energy and ends with the consumption in vehicles. WTP consists
of the feedstock and fuel phases, counting fuel feedstock extraction, transmission, distribution and
storage. Pump to wheel (PTW) represents the energy use and emissions during vehicle operation.
The functional unit is the distance travelled by the vehicle. The results of the primary energy
demand and the GHG emissions for each vehicle type are expressed as MJ/km and g CO2 eq/km
respectively [4].
In this study, GREET 2015 software is utilized to simulate the life cycle GHG emissions
for the selected vehicles only for the operation process. After the required operation data is
obtained from GREET software, they are used in SimaPro LCA tool for complete LCA analyses.
The scope of the analyses represent a complete LCA since they include the well to wheel (WTW)
stages as well as the equipment life cycle. The equipment life cycle includes production,
manufacturing, maintenance and end-of-life of vehicle infrastructure. GREET software can
calculate energy use with high accuracy. In this study, the vehicle operation emissions belonging
7
to different types of vehicles and transportation fuels are based on GREET 2015 calculations [5].
A part of GREET model characterizes the life cycle of vehicles, including production,
maintenance, operation and disposal [6]. For this study, we have utilized only the operation
parameters of all selected vehicles. Besides, electric and hybrid electric vehicle data are utilized
from production until disposal and then adapted in SimaPro LCA software. The LCA database
ecoinvent, v2.2 was used as source of background LCI data. Life cycle impact assessment (LCIA),
quantification of life-cycle environmental weights and potential impacts was carried out using the
LCA software SimaPro [7].
2.1 Uncertainty analyses
In the absence of an uncertainty analysis in LCA, the assessment results is questionable and non-
satisfactory for interpretation phase. In order to capture the characteristic variability of data in the
process or production systems, Monte Carlo analysis can be used embedded in SimaPro software.
This tool simulates a probable range of outcomes given a set of variable conditions and can be
applied within life cycle inventory framework to capture parameter variability. Hence, Monte
Carlo is a method engaged to quantify variability and uncertainty using probability distributions.
In quantifying the effect of the uncertainty in diverse data inputs on your LCA results, it shows
whether the inventoried data is of appropriate quality and the whether the uncertainty in LCA
results is tolerable.
3. Systems Description
On average, lifetime performance of a passenger car is assumed to be 239,000 person km.
Generally, the average utilization factor is expected to be 1.59-1.6 passengers per car. Henceforth,
the lifetime of the selected vehicles is approximately 150,000 km. Here, the assessment comprises
the following life cycle phases, as illustrated in Fig. 1:
 manufacturing of the vehicle,
 operation of the vehicle,
 maintenance of the vehicle,
 disposal of the vehicle.
3.1 Passenger car manufacturing
The inventory contains processes of energy, water and material usage in passenger car
manufacturing. Rail and road transport of materials is accounted for. The groundwork of plant is
involved together with the issues such as land use, building, road and parking structure. The
material consumption reflect a modern vehicle. The data for vehicle production are representative
for manufacturing sites with an environmental management system. Thus, the resulting data may
be an underestimation of environmental impacts of an average vehicle fleet.
The electricity comes from a mixture of UCTE (Union for the Co‐ordination of
Transmission of Electricity) countries. The UCTE is the association of transmission system
operators in which about 450 million people are supplied electricity. In the electricity usage
process, electricity production in UCTE, the transmission network and direct SF6-emissions to air
are included. Electricity losses during medium-voltage transmission and transformation from high-
voltage are also accounted for. The conversion of high-medium voltage as well as the transmission
of electricity at medium voltage are taken into account. Besides, the required high temperature is
assumed to be from methane burned in industrial furnace higher than 100kW which in turn
8
contains fuel feed from high pressure gas network, infrastructure (boiler), emissions, and required
electricity of operation.
In an electric vehicle, motion is attained from an electric motor and whole energy used for
traction is kept in a battery system. The car can travel if sufficient energy is available in the battery.
When the battery energy is consumed, the battery needs recharging by electricity grid or
exchanging. The operation of EV varies from the conventional vehicles in some characteristics as
the first difference is the energy source for operation where electricity is utilized despite of petrol
or diesel. Henceforth, there are no tail-pipe emissions. It is therefore assumed that emissions are
restricted to tire and brake wear and abrasion from the surface of road. Conceptually, a HEV is
very parallel to EV with the exception that it involves a fuel tank and an ICE. Whenever the battery
energy is consumed, the ICE can be used to recharge the battery or for traction power. In the
current study, HEV is assumed to be 50% electric and 50% gasoline. For electric vehicles, the
required amount of steel is lower compared to conventional cars since there is no ICE in the car.
However, for EVs and HEVs, production of electric motor and lithium ion batteries are included.
The battery is the on board energy storage system of the car. It contains an array of connected
cells, the packaging, and the battery management system. If a car is intended to have a range of
100 km with a regular consumption of about 0.2 kWh per km, a minimum of 20 kWh of energy
needs to be stored on-board. When energy density of 0.1 kWh/kg is assumed for the battery, the
total battery weight would be about 250 kg. Currently, commercially available car batteries range
between 100 kg and 400 kg, depending on automobile size and preferred range [8]. The average
masses of electric motor for and lithium ion battery are assumed to be 104 kg and 312 kg,
respectively for this study [9]. The inventory data for battery production and disposal is utilized
from GREET model and Ref. [10].
3.2 Maintenance
The inventory of maintenance of vehicles contains resources used for alteration parts and energy
consumption of garages. Rail and road transportation of supplies is accounted for. For EVs, during
the lifetime of the car, one battery change is assumed. Henceforth, lithium ion battery replacement
and disposal processes are also taken into account in the maintenance phase.
3.3 Disposal of the vehicles
The inventory of vehicle disposal contains disposal processes for bulk materials. For the disposal
of tires, a cut off allocation is applied. In addition, the transportation of tires to the cement works
is taken into account. For the disposal of steel, aluminum, copper and tires, a cut off allocation is
applied. Waste specific water together with air emissions from incineration and supplementary
supply depletion for flue gas scrubbing are accounted for. Short term releases to river water and
long term emissions to ground water from slag section and remaining material landfill are
considered with process energy loads for municipal waste incineration plant (MSWI). The
following processes are applied for the disposal of a vehicle scenario:
 Disposal of plastics in mixture with 15.3% water to municipal incineration (65 kg)
Energy production net output. The waste yields 0.01693 kg of slag and 0.006594 kg of remains
per kg of waste. They are landfilled. Supplementary solidifying with 0.002638 kg of cement is
applied. MSWI: 3.48MJ/kg waste energy in electric form and 7.03MJ/kg waste energy in thermal
form
 Disposal of glass to municipal incineration (30.1 kg)
9
Energy production in MSWI net output: 3.67MJ/kg waste electric energy and 7.39MJ/kg waste
thermal energy. The waste yields 0.01704 kg of slag and 0.01217 kg of residues per kg of waste.
They are landfilled. Supplementary solidifying with 0.004869 kg of cement is applied.
 Disposal of emulsion paint leftovers to HWI (100 kg)
Energy production in hazardous waste incineration (HWI) plant, net output: 17.11MJ/kg electric
energy and 1.27MJ/kg thermal energy. The waste yields 0.707 kg of remains per kg of waste. They
are landfilled. Supplementary solidifying with 0.2828 kg of cement is applied.
 Disposal of zinc in car shredder remains to MSWI (5.89 kg)
One kg of this waste produces 0.6244 kg of slag and 0.6202 kg of residues. They are landfilled.
Supplementary solidifying with 0.2481 kg of cement is applied.
Note that lithium ion batteries are recycled for numerous purposes. The most noticeable one is the
retrieval of valued materials and to follow to ecological laws. Numerous methods are present for
recycling lithium ion batteries with diverse environmental consequences. Usually, battery
recycling procedures can be expressed in three main categories: mechanical, pyrometallurgical and
hydrometallurgical processes. Hydrometallurgical processes are evaluated to require considerably
less energy compared to pyrometallurgical processes. In this study, hydrometallurgical process for
disposal of batteries are selected with an average efficiency of 57.5% and energy use of 140
kWh/tonne [8]. The inventory data for the disposal of batteries are taken from Ref. [8]. For
ammonia and hydrogen fueled vehicles, required amount of steel and electrical energy is a little
higher than other cars because of storage tank infrastructure.
3.4 Operation of vehicles
The operation process of the vehicles is one of the key sections of life cycle analyses. In this phase,
fuel consumption is involved. Direct airborne emissions of gaseous materials, particulate matters
and heavy metals are accounted for. Particulate emissions cover exhaust- and abrasions emissions.
Hydrocarbon emissions include evaporation. Heavy metal emissions to soil and water produced
by tire abrasion are accounted for. The values are based on operation of an average passenger car.
The specific conditions for the selected vehicles are presented herein:
 Gasoline: All processes on the refinery site excluding the emissions from combustion facilities,
including waste water treatment, process emissions and direct discharges to rivers are accounted
for. The inventory data also includes the distribution of petroleum product to the final consumer
including all necessary transports. Transportation of product from the refinery to the end user
is considered together with operation of storage tanks and petrol stations. Emissions from
evaporation and treatment of effluents are accounted for. Heavy metal emissions to soil and
water caused by tire abrasion are accounted for.
 Diesel: Diesel is evaluated as low-Sulphur at regional storage with an estimation for the total
conversion of refinery production to low-Sulphur diesel. An additional energy use (6% of
energy use for diesel production in the refinery) has been estimated. The other processes are
similar to gasoline. Heavy metal emissions to soil and water caused by tire abrasion are
accounted for.
 CNG: Natural gas with a production mix at service station is taken into account. The inventory
data contains electricity necessities of a natural gas service station together with emissions from
losses. The data set represents service stations with high (92%), medium (6%) and low (2%)
initial pressure. VOC emissions are obtained from gas losses and contents of natural gas. Heavy
metal emissions to soil and water caused by tire abrasion are accounted for.
10
 Hydrogen: Hydrogen is produced during cracking of hydrocarbons. It includes combined data
for all processes from raw material extraction until delivery at plant. The output fractions from
an oil refinery are composite combinations of mainly unreactive saturated hydrocarbons. The
first processing step in converting such elements into feedstock suitable for the petrochemical
industries is cracking. Essentially a cracker achieves two tasks in (i) rising the complexity of
the feed mixture into a smaller number of low molecular mass hydrocarbons and (ii) presenting
unsaturation into the hydrocarbons to enable more reactivity. The raw hydrocarbon input from
the refinery is fed to the heater unit where the temperature is increased. The forming reaction
products vary based on the composition of the input, the temperature of the heater and the
residence time. The cracker operator selects temperature and residence time to enhance product
mix from a supplied input. Cracker feeds can be naphtha from oil refining or natural gas or a
mixture of both. After exiting the heater, the hydrocarbon gas is cooled to prevent extra
reactions. After that, it is sent to the separation phase where the individual hydrocarbons are
separated from one another by fractional distillation. Heavy metal emissions to soil and water
caused by tire abrasion are accounted for.
 Ammonia: Ammonia synthesis process is Haber-Bosch which is the most common method in
the world. Ammonia production requires nitrogen and hydrogen. In this study, hydrogen is
assumed to be from hydrocarbon cracking. Cryogenic air separation is mostly used method for
massive amount of nitrogen production. In the life cycle assessment of nitrogen production,
electricity for process, cooling water, waste heat and infrastructure for air separation plant are
included. Haber-Bosch process is an exothermic method that combines hydrogen and nitrogen
in 3:1 ratio to produce ammonia. The reaction is facilitated by catalyst (iron-oxide based) and
the optimal temperature range is 450-600°C. Heavy metal emissions to soil and water caused
by tire abrasion are accounted for.
 EV: Electricity consumption is included. Particulate emissions comprise exhaust and abrasions
emissions. Heavy metal emissions to soil and water caused by tire abrasion are accounted for.
In the electricity usage process, electricity production mix, the transmission network and direct
SF6-emissions to air are included.
 HEV: Hybrid car is assumed to be 50% electric and 50% gasoline with ICE. Electricity and
gasoline consumptions are included. Particulate emissions comprise exhaust and abrasions
emissions. Heavy metal emissions to soil and water caused by tire abrasion are accounted for.
 Methanol: The selected fuel M90 consists of 90% methanol and 10% gasoline. The raw
materials, processing energy, estimate on catalyst use, and emissions to air and water from
process, plant infrastructure are included. The process describes the production of methanol
from natural gas via steam reforming process to obtain syngas for the production of methanol.
There is no CO2 use and hydrogen is assumed as burned in the furnace. Raw materials, average
transportation, emissions to air from tank storage, estimation for storage infrastructure are
included for the distribution part where 40% of the methanol is assumed to be transported from
overseas. Heavy metal emissions to soil and water caused by tire abrasion are accounted for.
 LPG: All processes on the refinery site excluding the emissions from combustion facilities,
including waste water treatment, process emissions and direct discharges to rivers are
considered. All flows of materials and energy due to the throughput of 1kg crude oil in the
refinery is accounted for. Refinery data include desalting, distillation (vacuum and
atmospheric), and hydro treating operations. Heavy metal emissions to soil and water caused
by tire abrasion are accounted for.
The following fuel consumption rates are considered in the analyses as tabulated in Table 1.
11
Table 1. Energy consumptions per km for the selected vehicles
Fuel
Fuel/Energy
Consumption
Fuel Cost
(US$/kg or
US$/kWh)
Driving Cost
(US$/100 km)
Gasoline 0.0649108 kg/km 1.004 6.518
Diesel 0.0551536 kg/km 0.8534 4.707
M90
Methanol 0.1180535 kg/km
0.25 3.308
Gasoline 0.0060664 kg/km
Hydrogen 0.0195508 kg/km 2.3 4.497
Ammonia 0.0926600 kg/km 0.28 3.102
EV 0.2167432 kWh/km 0.15 3.251
HEV
Electric 0.1083716 kWh/km
0.4916 4.558
Gasoline 0.0324554 kg/km
CNG 0.0603914 kg/km 0.8 4.831
LPG 0.057629687 kg/km 0.8182 4.715
4. Results and Discussion
The selected vehicle types are environmentally assessed in SimaPro LCA software based on the
energy consumption and GHG emissions of ICEV and EVs obtained from the wheel to wheel
simulations using GREET 2015 model. The results presented here are given on per km basis. The
energy use is based on units of MJ. The global warming potential is presented in kg per CO2
equivalent.
The battery production and assembly requires high amounts of copper and aluminum.
Henceforth, top two processes contributing issues related human toxicity are copper and aluminum
production at plants. Operation of EVs causes only 1% of total human toxicity values as shown in
Fig. 2. HEVs are quite similar to EVs in terms of battery manufacturing which yields second
highest value.
12
Fig. 2. Contribution of different processes to human toxicity values of electric vehicles
The depletion of ozone layer is one of the main reasons of environmental changes which
is actually caused by carbon emissions to the atmosphere. Since diesel, gasoline, CNG and LPG
fuels are fossil based and have huge amount of carbon substance, they have higher ozone layer
depletion values. The highest is equal to 3.3×10⁻⁸
kg CFC-11 eq. per km for diesel vehicle as Fig.
3 represents. The lowest contributions are from ammonia vehicle corresponding to 7.19×10⁻⁹
kg
CFC-11 eq/km. Because there is no direct CO2 emission during operation of ammonia vehicle.
The eutrophication is the impact of excessive levels of macro-nutrients in the environment
which is mainly caused by disposal processes. For EVs, HEVs and ammonia vehicles, the main
reason of eutrophication is disposal of spoil from lignite mining in surface landfill in which it
corresponds to about 66%, 49% and 47% for ammonia, EVs and HEVs respectively. There are
also other spoils during disposals such as sulfidic tailings, oxygen furnace wastes, decarbonizing
waste etc. which have minor impacts compared to coal mining processes. The lowest
eutrophication value is observed in hydrogen vehicle with an amount of 7.29×10⁻⁵
kg PO4 eq/km.
Ammonia vehicles represent lower acidification values compared to EVs and HEVs as seen in Fig.
4.
Methanol is used on a limited basis to fuel internal combustion engines. Methanol is
commonly produced via steam reforming of natural gas where natural gas is responsible about
90% of abiotic depletion. Therefore, the abiotic depletion values of methanol vehicle is more
compared to CNG and gasoline vehicles. 0.0025 kg Sb eq/km is the maximum value for methanol
vehicle while hydrogen and electric vehicles yield lower abiotic depletion.
73%
6%
5%
4%
3%
2%
1% 1%
5%
Copper, primary, at refinery
Aluminium, primary, liquid, at plant
Anode, aluminium electrolysis
Ferrochromium, high‐carbon, 68% Cr, at plant
Disposal, uranium tailings, non‐radioactive
emissions
Copper, primary, at refinery
Disposal, sulfidic tailings, off‐site
Electric Vehicle ‐ Operation
Remaining processes
13
Fig. 3. Life cycle comparison of ozone layer depletion results for various vehicles
Fig. 4. Life cycle comparison of acidification results for various vehicles
0.00E+00 5.00E‐09 1.00E‐08 1.50E‐08 2.00E‐08 2.50E‐08 3.00E‐08 3.50E‐08
Ammonia Vehicle
Electric Vehicle
Hybrid Electric Vehicle
Methanol Vehicle
LPG Vehicle
CNG Vehicle
Gasoline Vehicle
Diesel Vehicle
Ozone layer depletion steady state (kg CFC‐11 eq/km)
0
0.0002
0.0004
0.0006
0.0008
0.001
0.0012
0.0014
0.0016
Ammonia Vehicle Electric Vehicle Hybrid Electric Vehicle
Acidification (kg SO2 eq/km)
14
Fig. 5. Contribution of different processes to acidification values of ammonia vehicles
The acidification values of EVs and HEVs mainly cause by SO2 emission which
corresponds to 70% of overall acidification value. The source of SO2 emission is predominantly
the lignite and bituminous coal at mine that is used for electricity production mix and eventually
consumed in the EVs and HEVs.
Fig. 6. Life cycle comparison of global warming results for various vehicles
37%
23%
20%
9%
7%
4%
Ammonia Vehicle ‐ Operation ‐
Hydrocarbon Cracking
Hard coal, burned in power plant
Lignite, burned in power plant
Hydrogen, cracking, APME, at plant
Heavy fuel oil, burned in power plant
Operation, transoceanic freight ship
0.15
0.16
0.17
0.18
0.19
0.2
0.21
0.22
0.23
0.24
0.25
0.26
0.27
Gasoline Vehicle Hybrid Electric
Vehicle
LPG Vehicle Diesel Vehicle CNG Vehicle Ammonia Vehicle
Global warming 500a (kg CO2eq/km)
15
Afterward, ammonia vehicle has an acidification value of 0.001 kg SO2 eq/km as Fig. 4 specifies.
37% of this value is originated from ammonia vehicle operation and 9% comes from hydrogen
production for ammonia synthesis as shown in Fig. 5. Hydrocarbon cracking for hydrogen
production is fundamental contributor to hydrogen vehicle with 47%. Furthermore, platinum and
nickel have about 21% share in which they are used for hydrogen vehicle manufacturing process.
The global warming potentials of assessed vehicles are comparatively shown in Fig. 6. The
lowest GHG emissions are observed in hydrogen and ammonia vehicles where it corresponds to
0.17 kg CO2 eq/km for ammonia vehicle. Ammonia driven vehicles represent a more
environmentally friendly option among others.
Hydrogen production process contributes 32% of abiotic depletion for ammonia vehicle as
seen in Fig. 7. It is followed by lignite, hard coal and natural gas where they are consumed mainly
for electricity production.
Fig. 7. Abiotic depletion values (kg Sb. Eq.) of various processes for ammonia vehicles
Fig. 8. Contribution of operation only process of the vehicles to abiotic depletion
0.0005, 32%
0.0003, 20%0.0003, 15%
1.32E‐04, 8%
4.26E‐04, 25%
Hydrogen, cracking, APME,
at plant
Lignite, at mine
Hard coal, at mine
Natural gas, at production
onshore
Remaining processes
0% 10% 20% 30% 40% 50% 60% 70% 80% 90% 100%
Ammonia Vehicle ‐ Operation
CNG Vehicle ‐ Operation
Diesel Vehicle ‐ Operation
Electric Vehicle ‐ Operation
Gasoline Vehicle ‐ Operation
Hybrid EV ‐ Operation
Hydrogen Vehicle ‐ Operation
LPG Vehicle ‐ Operation
Methanol Vehicle ‐ Operation
Operation Manufacturing, Maintenance, Disposal
16
As Fig. 8 shows, the abiotic depletion is mainly caused by the operation processes of
vehicles. Highest percentage is observed in methanol vehicle operation since production of
methanol is highly dependent on natural gas. Manufacturing, maintenance and disposal of EVs
have higher shares during life cycle primarily initiated by production and disposal of lithium ion
batteries.
Fig. 9. Contribution of operation only process of the vehicles to global warming potential
On-board storage of hydrogen requires high resistant and strength tanks which leads to
higher steel and process requirement. Henceforth, non-operation part of hydrogen vehicle
constitute about 22% and 44% of overall hydrogen vehicle life cycle for abiotic depletion and
global warming potential as illustrated in Figs. 8 and 9. Overall, operation of the vehicles are
dominant contributors to complete life cycle.
Besides manufacturing and disposal of the vehicles, operation process is the fundamental
part for the vehicle life cycle. As seen in Fig. 10, ammonia driven vehicles is the second
environmentally benign option after electric vehicles during the operation.
0% 10% 20% 30% 40% 50% 60% 70% 80% 90% 100%
Ammonia Vehicle
CNG Vehicle
Diesel Vehicle
Electric Vehicle
Gasoline Vehicle
Hybrid Electric Vehicle
Hydrogen Vehicle
LPG Vehicle
Methanol Vehicle
Operation Manufacturing, Maintenance, Disposal
17
Fig. 10. Life cycle comparison of global warming results for operation only of various vehicles
Fig. 11 Comparison of life cycle environmental impact of ammonia fueled vehicle from
hydrocarbons and solar photovoltaics
Fig. 11 compares the global warming potential of ammonia driven vehicle where ammonia
is either produced from solar energy or hydrocarbon cracking. Global warming potential of
ammonia driven vehicle is similar for solar energy and fossil hydrocarbon based options. Hence,
the utilization of ammonia in the transportation sector will certainly contribute to lessen global
warming effect by using clean technologies even it is originated from fossil fuels.
0 0.05 0.1 0.15 0.2 0.25 0.3
Electric Vehicle ‐ Operation ‐ UCTE
Ammonia Vehicle ‐ Operation ‐ Hydrocarbon Cracking
CNG Vehicle ‐ Operation
Hybrid EV ‐ Operation
Diesel Vehicle ‐ Operation
LPG Vehicle ‐ Operation
Gasoline Vehicle ‐ Operation
Methanol Vehicle ‐ Operation
Global warming 500a (kg CO2 eq/km)
0
0.02
0.04
0.06
0.08
0.1
0.12
0.14
0.16
0.18
Ammonia Vehicle
(Source from Hydrocarbon Cracking)
Ammonia Vehicle
(Source from Solar Photovoltaic)
Global Warming Potential (kg CO2
eq/km)
18
Fig. 12. Singe score comparison of various source ammonia vehicles according to Eco-Indicator
99
The single score serves as an easy starting point to get to know the product under
consideration based on the environmental impact it creates. It relates the product’s environmental
impact to the overall environmental impacts in the country. A point (Pt) represents the annual
environmental load (i.e. entire production/consumption activities in the economy) in the US
divided up into the share of one American. It is important to understand that one point is not an
individual’s very own environmental impact. It represents the individual’s annual share regardless
of whether that individual participated in the economy’s environmental impacts directly or
indirectly. The single score indicator, the impact factor, is expressed in millipoints (mPts). One
millipoint is 1/1000 th of a point. It enables the measurement of smaller systems since most
products have a lower impact than one point. If we used points for most products, the results would
be in small numbers with many zeros after the decimal point. Millipoint results are more practical
for most expressing the environmental impacts of most products. Fig. 12 illustrates the single score
results of ammonia driven vehicles from various resources. Overall wind energy based option
yields lower environmental impact, however, hydrocarbon cracking and solar PV option have
similar impact factors.
0.
5.
10.
15.
20.
25.
30.
Ammonia Vehicle ‐
Hydrocarbon Cracking
Ammonia Vehicle ‐
Wind
Ammonia Vehicle ‐
UCG
Ammonia Vehicle ‐ PV
mPt
Carcinogens Respiratory organics Respiratory inorganics
Climate change Radiation Ozone layer
Ecotoxicity Acidification/ Eutrophication Land use
Minerals Fossil fuels
19
Fig. 13. Life cycle comparison of human toxicity results for various vehicles
The ammonia driven vehicles are significantly less human toxic compared to EVs and
HEVs as seen in Fig. 13.
Fig. 14 Abiotic depletion comparison of various source ammonia vehicles according to CML
2001
0
0.05
0.1
0.15
0.2
0.25
0.3
Ammonia Vehicle Hybrid Electric Vehicle Electric Vehicle
Human toxicity 500a (kg 1,4‐DB eq/km)
0 0.001 0.002 0.003
Ammonia Vehicle ‐ Wind
Ammonia Vehicle ‐ PV
Ammonia Vehicle ‐ UCG
Ammonia Vehicle ‐ Hydrocarbon Cracking
Abiotic depletion (kg Sb eq/km)
20
Fig. 15 Ozone layer depletion comparison of various source ammonia vehicles according to
CML 2001
When abiotic depletion values of different methods based ammonia vehicles are compared,
underground coal gasification (UCG) based method yields highest impact factor followed by
hydrocarbon cracking as shown in Fig. 14. On the other hand, ozone layer depletion value of
ammonia vehicles where ammonia comes from PV electrolysis has the highest value. It is noted
that underground coal gasification based ammonia driven vehicle yields the lowest impact as Fig.
15 shows.
Fig. 16. Climate change impacts of various source ammonia vehicles according to Eco Indicator-
99
0.00E+00 4.00E‐09 8.00E‐09 1.20E‐08 1.60E‐08 2.00E‐08
Ammonia Vehicle ‐ Wind
Ammonia Vehicle ‐ PV
Ammonia Vehicle ‐ UCG
Ammonia Vehicle ‐ Hydrocarbon Cracking
Ozone layer depletion steady state (kg CFC‐11 eq/km)
0.00E+00
5.00E‐10
1.00E‐09
1.50E‐09
2.00E‐09
2.50E‐09
3.00E‐09
Carbon
monoxide, fossil
Dinitrogen
monoxide
Methane, fossil Methane,
tetrafluoro‐,
CFC‐14
Sulfur
hexafluoride
DALY (Disability adjusted lifetime years)
Ammonia Vehicle ‐ Hydrocarbon
Cracking
Ammonia Vehicle ‐ Wind
Ammonia Vehicle ‐ UCG
Ammonia Vehicle ‐ PV
21
The emissions from various source ammonia vehicles are shown in Fig. 16. Methane
emission is highest in hydrocarbon cracking option while wind energy based option has lowest
dinitrogen monoxide emission.
Fig. 17 Human toxicity comparison of various source ammonia vehicles according to CML 2001
The PV manufacturing process includes many toxic materials, hence ammonia vehicle
from PV electrolysis option has the highest human toxicity value followed by wind electrolysis as
shown in Fig. 17.
Fig. 18 Global warming comparison of various source ammonia vehicles according to CML
2001
0
0.02
0.04
0.06
0.08
0.1
0.12
0.14
0.16
Ammonia Vehicle ‐
Wind
Ammonia Vehicle ‐ PV Ammonia Vehicle ‐
UCG
Ammonia Vehicle ‐
Hydrocarbon Cracking
Human toxicity 500a (kg 1,4‐DB eq/km)
0
0.05
0.1
0.15
0.2
0.25
0.3
0.35
0.4
0.45
Ammonia Vehicle ‐
Wind
Ammonia Vehicle ‐ PV Ammonia Vehicle ‐
UCG
Ammonia Vehicle ‐
Hydrocarbon
Cracking
Global warming 500a (kg CO2 eq/km)
22
Overall, life cycle global warming potential of ammonia driven vehicles from various
methods are shown in Fig. 18 where renewable based options have less GHG emissions. However,
hydrocarbon cracking option present only 23% difference from solar PV option.
Fig. 19. Uncertainty analyses results of selected categories for ammonia vehicle (ammonia from
UCG)
The uncertainty results are tabulated in Tables 2 and 3 for UCG and hydrocarbon options,
respectively. As Figs. 19 and 20 show, the uncertainty ranges are not huge for the selected
categories which implies more reliable results..
Table 2. Uncertainty results of ammonia vehicle for selected categories (ammonia from UCG)
Impact
category
Unit Mean SD CV 2.50% 97.50%
Std.err.o
f mean
Global
warming 500a
kg CO2
eq
4.08E-01 1.89E-02 4.64% 3.76E-01
4.48E-
01
0.00147
Acidification
kg SO2
eq
2.65E-03 1.83E-04 6.93% 2.36E-03
3.02E-
03
0.00219
Human
toxicity 500a
kg 1,4-
DB eq
9.84E-02 1.59E-02 16.10% 7.69E-02
1.33E-
01
0.0051
Ozone layer
depletion
steady state
kg CFC-
11 eq
5.59E-09 1.31E-09 23.50% 3.74E-09
8.91E-
09
0.00743
Terrestrial
ecotoxicity
infinite
kg 1,4-
DB eq
8.40E-04 2.20E-04 26.10% 5.75E-04
1.38E-
03
0.00826
20
40
60
80
100
120
140
160
180
200
Acidification Global warming 500a Human toxicity 500a Terrestrial ecotoxicity
infinite
Uncertainty ranges (%)
23
The lowest uncertainty range is seen in global warming impact category and abiotic
depletion for UCG and hydrocarbon option, respectively. The coefficient of variance (CV) of
global warming category is 4.64% and 9.36% for UCG and hydrocarbon based methods,
respectively.
Fig. 20. Uncertainty analyses results of selected categories for ammonia vehicle (ammonia from
hydrocarbon cracking)
Table 3. Uncertainty results of ammonia vehicle for selected categories (ammonia from
hydrocarbon cracking)
Impact category Unit Mean SD CV 2.50%
97.50
%
Std.err.of
mean
Abiotic depletion kg Sb eq
0.001
7
0.000
126
7.43
%
0.001
48
0.001
98
0.00235
Acidification kg SO2 eq
0.001
04
9.03E-
05
8.66
%
0.000
88
0.001
24
0.00274
Global warming 500a
kg CO2
eq
0.174
0.016
3
9.36
%
0.146 0.213 0.00296
Ozone layer depletion
steady state
kg CFC-
11 eq
7.22E-
09
1.47E-
09
20.40
%
4.99E-
09
1.09E-
08
0.00644
Human toxicity 500a
kg 1,4-
DB eq
0.046
3
0.009
88
21.30
%
0.033
0.069
5
0.00675
Terrestrial ecotoxicity
infinite
kg 1,4-
DB eq
0.000
63
0.000
16
25.30
%
0.000
409
0.001
06
0.00802
20
40
60
80
100
120
140
160
180
Abiotic
depletion
Acidification Global
warming 500a
Ozone layer
depletion
steady state
Human
toxicity 500a
Terrestrial
ecotoxicity
infinite
%
24
4.1 Comparison of Various Fuels Production
Besides the vehicles, the production processes of various fuel s are also compared in terms of
environmental impact in this section.
Fig. 21. Ozone layer depletion during productions of various fuels
Fig. 21 shows the comparison of ozone layer depletion values for various transportation
fuels. Ammonia has lowest ozone layer depletion even if it is produced from steam methane
reforming and partial oxidation of heavy oil. Production of fuel ammonia yields lower greenhouse
gas emissions compared to petrol and propane production as shown in Fig. 22.
Fig. 22. Greenhouse gas emissions during production of various fuels
The ammonia production from various resources have lower abiotic depletion and ozone
layer depletion values compared to other fuels such as propane, petrol, diesel and natural gas as
shown in Figs. 23 and 24. Ammonia production from wind energy has the lowest ozone layer
depletion impact.
0.00E+00
5.00E‐08
1.00E‐07
1.50E‐07
2.00E‐07
2.50E‐07
3.00E‐07
3.50E‐07
4.00E‐07
4.50E‐07
Propane/
butane, at
refinery
Petrol,
unleaded, at
refinery
Diesel, low‐
sulphur, at
refinery
Ammonia,
steam
reforming,
liquid, at plant
Ammonia,
partial
oxidation,
liquid, at plant
Ammonia,
hydrocarbon
cracking, at
plant
Ammonia,
wind energy,
at plant
Ozone layer depletion (kg CFC‐11 eq/kg fuel)
0 0.1 0.2 0.3 0.4 0.5 0.6 0.7
P E T R O L ,   U N L E A D E D ,   A T   R E F I N E R Y
P R O P A N E / B U T A N E ,   A T   R E F I N E R Y
A M M O N I A ,   F R O M   W I N D   E N E R G Y ,   A T   P L A N T  
D I E S E L ,   L O W ‐ S U L P H U R ,   A T   R E F I N E R Y
Gloabal warming potential (kg CO2 eq/kg fuel)
25
Fig. 23. Abiotic depletion values during production of various fuels
Fig. 24. Ozone depletion values during production of various fuels
0 0.005 0.01 0.015 0.02 0.025 0.03
Petrol, unleaded, at refinery
Propane/ butane, at refinery
Diesel, low‐sulphur, at refinery
Naphtha, at refinery
Natural gas, liquefied, at liquefaction plant
Ammonia, partial oxidation, liquid, at plant
Natural gas, at production
Ammonia, steam reforming, liquid, at plant
Ammonia (Hydrocarbon Cracking)
Ammonia (from PV electrolysis)
Ammonia (from Wind electrolysis)
Abiotic depletion (kg Sb eq/kg) (kg Sb eq/m3 for natural gas) 
0.00E+00 1.20E‐07 2.40E‐07 3.60E‐07 4.80E‐07 6.00E‐07
Ammonia (from Wind electrolysis)
Ammonia (from Hydrocarbon cracking)
Ammonia (from PV electrolysis)
Ammonia, steam reforming, liquid, at…
Ammonia, partial oxidation, liquid, at…
Naphtha, at refinery
Diesel, low‐sulphur, at refinery
Petrol, unleaded, at refinery
Propane/ butane, at refinery
Ozone layer depletion steady state (kg CFC‐11 eq/kg)
26
Fig. 25. Fossil fuels depletion impact values per MJ surplus for various fuels according to Eco
Indicator 99
As seen in Fig. 25, fossil fuels depletion is the lowest for ammonia production according
to Eco Indicator 99 LCA method.
Fig. 26 Acidification/Eutrophication values of various fuels according to Eco Indicator 99
0 0.5 1 1.5 2 2.5 3 3.5 4 4.5
Ammonia (from Wind electrolysis)
Ammonia (from PV electrolysis)
Ammonia (from Hydrocarbon cracking)
Ammonia, steam reforming, liquid, at plant
Natural gas, at production
Natural gas, liquefied, at liquefaction plant
Ammonia, partial oxidation, liquid, at plant
Naphtha, at refinery
Diesel, low‐sulphur, at refinery
Propane/ butane, at refinery
Petrol, unleaded, at refinery
Fossil fuels (MJ surplus)
0
0.005
0.01
0.015
0.02
0.025
Acidification/ Eutrophication (PDF*m2yr)
27
Similar to ammonia driven vehicles, production processes of ammonia from renewable
resources have less acidification and eutrophication values although current steam methane
reforming option yields lower than natural gas, petrol and propane as illustrated in Fig. 26.
Fig. 27. Monte-Carlo simulation results of characterized LCA comparison between ammonia and
CNG vehicle
4.2 Ammonia vs. Natural Gas
Compared to liquefied natural gas, there are more environmentally friendly fuels such as ammonia.
Ammonia does not emit direct greenhouse gas emissions when utilized in the vehicles.
Furthermore, production process of ammonia yields lower global warming impact compared to
LNG production. Ammonia can also be produced from natural gas and hydrocarbons such as
bitumen. Henceforth, in the ideal case, if Alberta oil sands bitumen can be converted into ammonia
and then transported via pipelines to the ports, it would have lower total environmental impact
both in the production process and utilization process. Furthermore, ammonia is liquid at higher
temperatures (-33°C) than natural gas (-162°C) which implies lower energy requirement in
liquefaction process. The other option for a more environmentally friendly process can be
conversion of LNG to ammonia after being produced and transported via pipelines. Natural gas
can be cracked into carbon black and hydrogen using plasma dissociation technique. In this case,
carbon black is also utilized as a useful output for tire, plastic etc. industry. Instead of emitting
CO2 to the environment, produced carbon black is used for various sectors, and greenhouse gas
emissions are lowered. Produced hydrogen can be used for ammonia synthesis and stored in the
vessels for the overseas transportation. In this manner, a cleaner alternative fuel is consumed and
‐80
‐100
‐100
‐40
0
‐80
20
0
0
60
100
20
‐100 ‐80 ‐60 ‐40 ‐20 20 40 60 80 100
Respiratory organics
Climate change
Ozone layer
Land use
Minerals
Fossil fuels
Ammonia Vehicle ‐ Hydrocarbon Cracking' (A) minus 'CNG Vehicle' (B),
A < B A >= B
28
total greenhouse gas emissions are significantly decreased. Henceforth, establishing an ammonia
production plant using either tidal energy (British Columbia has significant potentials) or
hydropower electricity would be more cost effective and environmentally friendly.
In Fig. 27, the green bars on the left represent the number of times ammonia vehicle had a
lower environmental impact than CNG vehicle. For instance, it shows that in 100% of the cases
the climate change impact score is lower for ammonia. In about 20% of the cases, the fossil fuels
category is lower in CNG vehicle. Overall, it is noted that ammonia driven vehicle is more
environmentally friendly compared to CNG vehicle.
5. Conclusions
Alternative fuels for transportation sector are intensively investigated by researchers in recent
years. The main criteria for a sustainable fuel is to be environmentally friendly and cost effective.
In this study, a comparative environmental impact assessment of alternative and conventional
fueled vehicles is conducted using cradle to grave approach via life cycle analyses under seven
different environmental impact categories. Conventional vehicles considered in this study include
diesel, gasoline, CNG and LPG. Alternative vehicles comprise of hydrogen, ammonia, methanol,
EV and HEV. The analyses are conducted from manufacturing of passenger cars to disposal
including operation of the vehicles. Monte Carlo uncertainty analyses of hydrogen vehicle results
are also conducted in order to investigate the reliability of the outcomes. The results show that
hydrogen vehicle is the most environmentally benign one in all environmental impact categories.
Ammonia as a sustainable and clean fuel has lowest global warming potential after EVs and yield
lower ozone layer depletion values than EVs. Although EVs do not emit direct CO2 during
operation, the production and disposal processes of batteries bring some consequences which harm
the environment in terms of acidification, eutrophication and human toxicity. Since methanol
production is dependent on mainly natural gas, it has highest global warming potential. It is
concluded that in order to have sustainable and clean transportation, production pathway of
vehicles, batteries and alternative fuels need to be environmentally friendly.
29
CHAPTER 2. AMMONIA FROM HYDROCARBON DISSOCIATION
In this section, dissociation of hydrocarbons including oil sand bitumen and natural gas for
ammonia production in Alberta is investigated.
Hydrocarbons can be used as a source of hydrogen which is required for ammonia
synthesis. There are various alternative pathways for hydrogen production from hydrocarbons. In
this section, a detailed literature review is presented for ammonia production via hydrocarbons.
The source of hydrogen needs to be only the hydrocarbon itself, which experiences thermal
decomposition:
C H 	→ 	nC	
m
2
	H 	
In the case of methane, steam conversion is twice as endothermic as thermal decomposition per
unit volume of methane as shown below:
CH 	 	2H O	 → 	CO 	4H 	;		∆H 163	kJ	
CH 	→ 	C	 	2H 	;		∆H 75.6	kJ
If the hydrocarbon itself is used as the thermal energy supply of the processes, the consumption of
hydrocarbon feedstock per unit of the product hydrogen in both cases is comparable.
The thermal dissociation of methane is a recognized process. It has long been used for the
production of soot. The process is multi-step containing the contact heating (a fire-brick) up to
1500°C and methane dissociation with the yield of soot and methane-hydrogen combinations. It
can be seen that the route necessitates elevated temperatures.
Muradov [11] implied that the thermodynamic data show that methane dissociation can be
done at reasonable temperatures. For example, at 800°C, the equilibrium concentration of
hydrogen in H2-CH4 gaseous mixes matches 94% by volume. Thus, for the application of thermal
dissociation of methane at relatively low temperatures, the use of catalysts is necessary.
Efforts were made to utilize catalysts for the cracking of methane and light hydrocarbons.
The "HYPRO" process was established for the generation of hydrogen from refinery gases and it
was shown that the method is financially appropriate for the concentration of hydrogen in gas
streams [11]. The method is based on the basic catalytic cracking of methane and other gaseous
hydrocarbons. The catalyst is conveyed by the gas streams. The process temperature is up to 980°C
and the pressure is atmospheric. The carbon placed on the catalyst was then burned to restore the
catalyst and to source the heat of the process. The "HYPRO" process lets the conversion of "dry"
refinery gases into a gaseous stream holding 90 vol% hydrogen and 10 vol% methane.
The temperature dependency of hydrogen concentration in methane cracking gas using iron
catalyst and other contacts is presented in Fig. 28. It is obvious that the iron catalyst discloses a
high catalytic activity at temperatures above 600°C, and at 800°C the composition of the cracking
gas approaches the equilibrium value.
30
Fig. 28 Temperature dependence of hydrogen concentration in gas of methane decomposition
using various catalysts and contacts: (1) iron oxide; (2) alumina; (3) graphite; (4) quartz; (--)
equilibrium curve (from Ref. [11])
1. Thermo-catalytic Decomposition of Liquid Hydrocarbons
Thermo-catalytic decomposition of light liquid hydrocarbons (boiling point 50-200°C, average
ratio H:C = 2:1) can be carried out with the production of carbon and hydrogen:
CH . 	→ 	C	 1.05	H 	
In some situations such as using aromatic-containing fractions, this reaction is thermo-neutral. The
volume of hydrogen achieved is slightly less than in the occasion of gaseous hydrocarbons. The
process does not vary significantly in its technical features from thermo-catalytic decomposition
of methane and other gaseous hydrocarbons. The technical structure of the procedure varies
considerably in the circumstance of heavy residual fractions (HRFs: boiling point higher than
350°C), which are used in industry as fuel and as a feedstock for the steam-oxygen gasification
process. It is known that HRFs comprise huge amounts of sulfur and metals, which in the case of
direct dissociation will transfer into the coke and will reduce it useless for further use. Moreover,
the process of coke separation from the catalyst will also turn into a complex type. Hence, it is
practical that the process be carded out in a two-step scheme, as in the case of the "HYDROCARB"
process [11]:
CH . 1.2	H → CH 	∶ hydrogasification
CH 	→ 	C	 2	H 	 : methane cracking
and for the overall process
CH . 	→ 	C	 0.8	H 	
The quantity of hydrogen generated is less than in the case of light hydrocarbon fractions.
Nevertheless, the procedure has substantial benefits, specifically, that it lets the co-production of
valuable by-products: sulfur (or sulfuric acid) and metals (vanadium, nickel and others). The
temperature of hydrogasification is about 750°C, pressure 1 - 10 GPa, and the hydrogenating gas
contains 95 vol% hydrogen. The occurrence of sulfur mixes in HRFs, as well as in the
hydrogenating gas, does not affect the product yields since the method is not catalytic. The yield
of liquid products changes from 2-3 to 21-23% by mass, depending on hydrogasificator
31
construction, using crude oil as a feedstock. Methane and ethane are the key yields of
hydrogasification of crude oil [11].
Methane decomposition reaction is moderately endothermic process. The energy
requirement per mole of hydrogen produced is considerably less than that for the steam reforming
process. Due to this relatively low endothermicity of the process, less than 10% of the heat of
methane combustion is needed to drive the process. There have been attempts to use different
catalysts to reduce the maximum temperature of thermal decomposition of methane. Metal
catalysts, including Ni, Fe, Co, Pd and others, have been most commonly used for methane
decomposition. However, there was a catalyst deactivation problem associated with the carbon
build up on the catalyst surface. In the vast majority of related publications, carbon produced was
burned off the catalyst surface in order to remove it from the reactor and regenerate the original
activity of the metal catalyst. Alternatively, carbon could be gasified with steam to produce
additional amount of hydrogen. In either case, the amount of CO2 produced is comparable with
that of the conventional processes such as SMR or partial oxidation [12].
Besides methane, as a main component, other heavier hydrocarbons such as ethane,
propane, butane and others, constitute natural gas. It was important, therefore, to investigate the
behavior of these hydrocarbons in the presence of different carbon catalysts at elevated
temperatures (800–900°C). Propane was selected as a representative hydrocarbon. Due to a
relatively weak C–H bond in propane molecule (402.2 kJ/mol), it is somewhat easier to split
propane than methane molecule (methane C–H bond energy is 440.0 kJ/mol). 26.0 kJ is required
to produce one mole H2 from propane, comparing that to 37.8 kJ for methane (at standard
conditions):
C H 	→ 	3C	 4	H 	;	∆H 103.9	kJ/mol
However thermal cracking of propane at high temperatures could also proceed via a
thermodynamically more favorable formation of methane and ethylene
C H → 	CH 	 	C H 	;	∆H 	81.3	kJ/mol
As a result, pyrolysis of propane at relatively low residence times produced gaseous mixtures
containing hydrogen, methane, ethylene and small amounts of ethane and propylene. Fig. 29
depicts the experimental results of propane catalytic pyrolysis over carbon black (a) and activated
carbon (b) type catalysts at 800°C using a packed bed reactor. Activated carbon demonstrated high
initial activity in propane decomposition reaction followed by the rapid drop in catalytic activity
which is similar to methane decomposition [12].
Fig. 29 Propane pyrolysis over carbon black catalyst (a) and activated carbon catalyst (b) at
800°C (from Ref. [12])
32
There are several technological options for methane dissociation to hydrogen and carbon, which
are summarized in Fig. 30.
Fig. 30 Main routes for decomposition of methane to hydrogen and carbon (from Ref. [13])
Kværner company of Norway developed and operated on a limited commercial scale a thermal
plasma process for decomposition of methane and other hydrocarbon feedstocks to hydrogen and
carbon black [14]. Although technologically simple, the process is energy intensive: it was
estimated that up to 1.9 kWh of electricity is consumed per one normal cubic meter of hydrogen
produced [15].
Hydrogen via thermal (catalytic) dissociation of hydrocarbons represents an alternative
solution. One approach that recently attracted the attention of researchers is CO2-free production
of hydrogen and carbon via thermal decomposition (or pyrolysis, cracking) of methane. Methane
decomposition over metal catalysts due to a very strong C–H bond, methane is one of the most
stable organic molecules hence, thermal dissociation of methane would require temperatures in
excess of 1000°C. Different transition metal catalysts were used to reduce the maximum
temperature of methane thermal decomposition.
Fig. 31 summarizes the bulk of the available literature data on the catalysts, preferred
temperature range and carbon products of catalytic decomposition of methane. Here, 1:Ni-based,
2:Fe-based, 3:carbon-based, 4:summary of data related to Co, Ni, Fe, Pd, Pt, Cr, Ru, Mo, W
catalysts, 5:non-catalytic decomposition, CF: carbon filaments, TC: turbostratic carbon, GC:
graphitic carbon, AmC: amorphous carbon. Ni-based catalysts attracted an attention of a majority
of the researchers in the field due to their high catalytic activity and the capability of producing
carbon filaments (CF) or carbon nanotubes (CNT) at moderate temperatures (500–700°C). Fe-
based catalysts efficiently operate at a somewhat higher temperature range and also are able to
catalyze the formation of CNT [16].
The use of carbon-based catalysts offers certain advantages over metal catalysts due to
their availability, durability and low cost. In contrast to metal-based catalysts, carbon catalysts are
sulfur resistant and can withstand much higher temperatures. The concept is based on catalytic
decomposition of methane over catalytically active carbon particles with the production of
hydrogen-rich gas and carbon deposited on the surface of original carbon particles. The most
important features of the process are as follows: (i) it can be catalyzed by carbon produced in the
process, so that an external catalyst would not be required (except for the start-up operation), and
(ii) the separation of carbon product from the carbon catalyst is not necessary. The technical
33
feasibility of the concept and the data on catalytic activity of a variety of carbon materials of
different origin and structure, including a wide range of activated carbons (AC), carbon blacks
(CB), microcrystalline graphite and nanostructured carbons toward methane decomposition
reaction are reported [16].
Fig. 31 Comparison of catalysts, preferred temperature range and carbon products related to
catalytic methane decomposition reaction (from Ref. [16])
On perspectives of large-scale hydrogen production via catalytic decomposition of natural
gas, there are a number of ways to arrange hydrogen production by catalytic decomposition of
methane. In the 1960s, Universal Oil Products (UOP) operated a pilot plant with the capacity of
118 l/min for the continuous production of hydrogen via catalytic decomposition of methane in a
moving bed of Ni-catalyst particles at 815–1093°C [17]. The process, however, targeted the
production of only one product which is hydrogen. Carbon deposited on the catalyst was
combusted to provide the process heat causing important amounts of CO2 byproduct.
Lamacz and Krzton [18] presented a paper dealing with the catalytic decomposition of
hydrocarbons (methane and toluene) in the aspect of H2 production and types of obtained carbon
deposits. The catalyst used in the studies was nickel supported on ceriaezirconia (Ni/CeZrO2).
Hydrogen production was found to be higher for CH4 decomposition. Both types of carbon
deposits (filamentous and pyrolytic) were found to be very reactive with H2O, which is due to their
activation by the ceriaezirconia support.
An alternative method of hydrogen production from hydrocarbons is their thermal
decomposition which is accompanied by the formation of carbon deposits. Methane can be
thermally or thermocatalytically decomposed (TCD) into carbon and hydrogen without CO or CO2
production. Hence, the need for water gas shift (WGS) and CO2 removal is eliminated, and
obtained in TCD hydrogen can be supplied directly to the fuel cells. Takenaka et al. [19] reported
that the supported Ni catalyst is one of the most effective catalysts for the methane decomposition.
34
The catalytic performance of Ni-based catalysts for the decomposition of hydrocarbons of C3–C8
into CO-free hydrogen and carbon fibers was investigated in order to produce CO-free hydrogen
as a fuel. Ni–Pd/SiO2 catalyst showed a high activity and a long life for the decomposition of LPG
(propane and n-butane) into CO-free hydrogen and carbon fibers [19]. Chai et al. [20] investigated
that the size of NiO crystallites is a meaningful parameter in the formation of particular types of
filamentous carbon. Methane decomposition carried out at 550°C on the large size NiO (supported
on SiO2, HZMS-5 and CeO2) lead to CNFs (carbon nanofibers) while the formation of multi walled
CNTs (carbon nanotubes) was observed on the small size NiO supported on Al2O3.
Gac et al. [21] studied methane decomposition performing over nickel alumina catalysts
modified with magnesia between the temperatures of 500-700°C. The catalysts were obtained by
the co-precipitation method. Catalytic methane decomposition was studied over metal catalysts,
based on Ni , Co or Fe, different supports, including SiO2, TiO2 and Al2O3, MgO or metallic foams.
In spite of the intensive research of the numerous processes of hydrocarbons conversion and
synthesis of carbon nanomaterials, some questions still remain open; such as the influence of the
size of the crystallites, metal-support interactions, diffusion phenomena, reaction temperature or
the nature of carbon deposits. It was found out that the activity of catalysts and the properties of
carbon deposits were related to the catalysts composition and the reaction temperature. Carbon
filaments with fishbone-like packed graphitic layers were formed at 500°C, while the multi-walled
nanotubes were observed after reaction performed at 700°C.
Zhang et al. [22] investigated the catalytic cracking of methane as an alternative route for
the production of hydrogen from natural gas. Nickel supported on silica was found to be active for
this reaction producing stoichiometric amounts of hydrogen and carbon. While commercial
processes exist that utilize thermal cracking of methane at extremely high temperatures for the
production of acetylene and carbon black, hydrogen production via the catalytic cracking of
methane was only briefly considered in the past. Silica-supported nickel catalysts are active for
this reaction at relatively low temperatures around 550°C. These catalysts maintain their activity
for a sustained period of time because of their capability to accumulate large amounts of carbon
on their surface in the form of long cylindrical hollow ®laments, with a nickel particle located at
the front tip of each individual ®lament. Deactivation eventually occurs due to spatial limitations
imposed on the ®lament growth, which lead to the loss of exposed nickel surface.
2. Comparison of Furnace and Plasma Processes
If it is assumed that typical electro-thermic efficiency of modern plasma arc devices is over 80%,
it can be estimated that the electric energy supply needed for the cracking operation varies between
4 and 7 kWh per kg of carbon produced or between 1 and 1.9 kWh per normal cubic meter of
hydrogen produced [23]. Because of the wide range of grades of carbon black, the comparison will
only concern a well-defined product, whose industrial name is super abrasion furnace black (SAF).
This grade corresponds to an average structured black, used essentially as reinforcing filer to
improve abrasion properties. The average commercial price is about US $1000-1400 per ton.
Production temperature of this product is about 1600°C, so the theoretical energy supply, as
defined above, may be estimated at 5000 kWh per ton of carbon produced. It was presented in Fig.
32 the input/output mass and energy balances for the two processes which is related to one ton of
product. Hence, for a typical capacity of 100,000 tons per year with a 0.68 utilization rate, total
electric power of a plasma black installation will be 83 MW [23].
35
Fig. 32 Input-output balance for furnace and plasma processes (from Ref. [23])
This result compared well with conclusions of a study presented in 1983 [24], as the
authors, who were using a 15 kW radio frequency (RF) plasma, obtained with methane carbon
yields of about 96% with a lower energy of only 2.2 kWh per kg of carbon.
Plasma technology has been used since 1980 as an alternate method for generating carbon
black that takes advantage of the plasma's high enthalpy property [25]. The principle of carbon
black manufacture, by the "cracking" of a hydrocarbon vapor using a plasma source, was patented
in France in 1980 [26], and several studies have since been dedicated to this subject. Thus in 1983,
Ibberson et al. [27] used a 15-kW RF induction plasma reactor to process various hydrocarbons.
Methane, n-hexane and benzene were fed to the reactor and carbon black, in high yields, of up to
98%, were obtained, and with a corresponding low energy requirement per kg of carbon produced
(2.2 kWh per kg of carbon). Bolouri and Amouroux [28] described carbon (acetylene) black
production by direct processing of natural gas in an argon RF plasma reactor. Overall, their results
showed that, with a well-designed reactor, almost all input methane can be converted to carbon
and acetylene. The carbon yield reached about 45% when the total methane conversion rate
approaches 100%. The solid product obtained presented similar qualities to those of acetylene
black obtained by the classical processes.
Two, more recent laboratory-scale investigations of carbon black production have been
conducted using a HF plasma reactor at the Plasma Technology Research Center in Canada [29,
30]. Light hydrocarbons were used as the feedstock in the process and plasma power levels of
between 25 and 70 kW were used. In the first process stage, propane was fed to the system. The
injection method employed was found to be the most important parameter in this plasma process.
These authors found a relationship between the particular carbon black morphology and the
method of feed injection. For example, radial injection produced "flat" form particles similar to
those present in acetylene black produced at high frequency (HF). Axial injection produced very
spherical form particles, comparable to those carbon blacks with specific surfaces in the order of
75 to 100 m2
/g. A carbon black production rate of 0.35 g/s was obtained for the radial injection.
Propane decomposition rates of between 70 and 100% were observed during these experiences. In
36
the second described process, methane was fed to the plasma system, generating methane
decomposition yields of about 100% and carbon black yields of about 55% at 60 kW. Carbon
black, with particle sizes of between 20 and 80 nm and specific surfaces up to 250 m2
/g was
obtained. The feed rates and the particular injection method employed were found to be the most
important parameters determining the morphology of the carbon black produced. Specifically,
smaller size particles, with higher specific surfaces, were found when the feed rate was increased.
Impurities levels of below 100 ppm were found during these experiences. In 1990, Kvaerner
started the development of the innovative Kvaerner CB&H process [30]. This process was
considered primarily as a hydrogen-supply process [31]. By pyrolysis of the hydrocarbon
feedstock, the process produces two valuable products: hydrogen and carbon black. The process
yields almost 100% in feedstock efficiency and the impurity levels of the process products are
restricted to only those impurities introduced in the feedstock. Although the Kvaerner Engineering
organization represents this technology for industrial scale application [32], no evidence has been
forthcoming so far to demonstrate that the process can economically produce carbon black of
commercial interest [25].
Among the original potential reforming choices, plasma systems can deliver creative
answers to the disadvantages in terms of reactivity, compactness and efficiency. Various ways
were explored for the two last decades by means of various plasma techniques such as plasmatron,
gliding arc, dielectric barrier discharge (DBD), corona, microwave, pulsed discharge and reformed
hydrocarbons, such as methane, diesel and bio fuels [33]. The reforming method targeting
hydrogen generation is the conversion of a hydrocarbon into a more valued product in terms of
higher heating value. The difficulty is to achieve the process with the best energetic efficiency.
Due to the capability to relief high energetic densities, plasmas have then been considered with
interest for reforming uses. Based on their energy level, temperature and electronic density, plasma
state is typically categorized as a high temperature (or thermal) plasma and a cold (or non-thermal
or non-equilibrium) plasma. For example, neon lights are non-thermal plasmas and the sun is a
thermal one.
The hydrocarbon reforming is an oxidation reaction in which oxygen, water or carbon
dioxide have the responsibility of the oxidant. Plasma is an ionized gas that can be generated by a
number of ways, like combustion, flames, electrically heated furnaces, electric discharges (corona,
spark, glow, arc, microwave discharge, plasma jets and radio frequency plasma), and shocks
(electrically, magnetically and chemically driven) [34]. Consequently, plasma media shows a high
energetic state of substance, described by a high electrical conductivity. Traditionally, first plasma
assisted reformers were thermal ones, e.g. direct current (DC) plasma torch. Chemical reactions
were hence improved due to the presence of very reactive species (ions, electrons) in a very hot
intermediate but the energy consumption was high.
Non-thermal plasmas [34] have been used for fuel gas treatment and have been accepted
very promising for organic synthesis because of its non-equilibrium features; low power
requirement and its capacity to make physical and chemical reactions within gases at
comparatively low temperatures. The electrons in non-thermal plasma may extent temperatures of
10 000–100 000 K (1–10 eV) while the gas temperature can stay as low as room temperature. It is
the high electron temperature that controls the uncommon chemistry of non-thermal plasmas.
Based upon techniques of which plasma is produced, pressure used and the electrode geometry,
non-thermal plasmas involve very diverse kinds containing glow discharge, corona discharge,
silent discharge, DBD, microwave discharge and radio frequency discharge.
37
The RF discharge functions at high frequencies (several MHz) and very low pressure to
attain the non-equilibrium situations. This discharge is likewise not appropriate for chemical
synthesis. The microwave discharge works at very high frequencies, e.g. 2.45 GHz in the range of
microwaves, with which only light electrons can track the oscillations of the electric field. Thus,
this discharge is far from local thermodynamic equilibrium and may be functioned in a wide
pressure range. Lately, gliding arc discharge, a mixture of high power equilibrium arc discharge
and better selectivity of non-thermal plasmas was stated to be used for reforming uses [33]. An
illustrative comparison of specific energy requirement and efficiencies for various research results
is shown in Figs. 33, 34 and Table 4.
Gliding arc discharge reactor assisted the experimental study of methane conversion. It
consists of a 2.5 l reactor walled with quartz where 8 cm is inner diameter and 50 cm is the length.
Two 7 mm thick, 2 cm wide and 9 cm long diverging electrodes were utilized. They were hold by
a stainless steel plate situated at the top of the setup. Reactant types were preheated at temperatures
in the range 573–873K before entering the test chamber. Experimental runs circumstances were
atmospheric pressure, specific energy input in the range 3–12.1 MJ/kg (ratio of the input electric
power on the inlet gas flow rate), and partial oxidation was considered both for the air and 50%
oxygen enriched air [33].
Fig. 33 Comparative efficiencies of non-thermal plasma processes (from Ref. [33])
38
Fig. 34 Specific energy requirement of non-thermal plasma processes (from Ref. [33])
Table 4. Performances of some non-thermal plasma assisted reforming processes (from Ref.
[33])
Ref. Reactor Fuel
Fuel
injected
(kW)
Reforming
process
Plasma
power
(W)
Efficiency
(%)
Efficiency ratio
Conversion
rate (%)
Power
density
(kWH2/L)
[35] GEN 2 Diesel 10.78 Pox 270 46.67 80.9 2.6
[35] GEN 3
Methane
Ethanol
Methane
11
26
22.5
ATR+catal
.
Pox+catal.
Pox
210
200
375
63.59
43.5
36.70
0.84
0.84
0.57
103.98
73.38
3.57
57
42
[36,37] Glidarc Methane 1.52 Pox 50 75.81 0.98 87 0.476
[36,37] GAT
Isooctane
Methane
0.02
ATR+catal.
Pox
4
200
48.78
74
0.70
0.93
75 0.004
[38,39]
Sliding
discharge
Methane 2.68 ATR 830 24.59 0.40 22.53 7.8
[38,39]
Sliding
discharge
Methane 4.63 Pox 75 27.53 0.42 58.55 11.8
[40,41] Glidarc Gasoline 7 SR 1000 29 65.8 0.86
[40,41]
Plasma
torch
Isooctane 5.72 ATR 1000 41.78 0.72 90.55 8
[42,43] Glidarc I Diesel 12.01 Pox 280 54.28 100.14 4.44
[42,43] Glidarc I
Gasoline
95
6.23 Pox 350 49.06 95.78 2.15
39
Table 5. Performances of catalytic reforming systems (from Ref. [33])
Ref. Fuel
Power
injected
(kW)
Reforming
process
Efficiency
(%)
Efficiency
ratio
Power
density
(kWH2/L)
Start up
time
Time to
full
power
[44] Indolene 30 42.63
Pox, nickel
based
catalyst
78.5 0.96 16.12
[45] C7.494 H14.53 86.15
ATR,
monolith
catalyst
78 53.4 20s 140s
[46] Octane 1.44
ATR,
house
catalyst
68–70 0.4
[46] Gasoline 1.56
ATR,
house
catalyst
62–65 0.3 5min 50min
The performance values of some non-thermal plasma assisted reforming processes are
shown in Table 4. At the Institute for Advanced Sustainability Studies (IASS), an alternative
technology for methane decarbonisation applying liquid metal technology was proposed in
collaboration with the Karlsruhe Institute of Technology (KIT) [47]. They comprised the following
steps: conceptual design of a liquid metal bubble column reactor and material testing, process
engineering incorporating carbon separation and hydrogen purification, and a socio-economic
analysis. The results from the experimental tests showed that the liquid metal reactor design works
effectively in producing hydrogen and carbon separation. Other aspects of the technology such as
socio-economics, environmental impact, and scalability also appeared to be satisfactory making
methane decarbonisation based on liquid metal technique a possible candidate for CO2-free
hydrogen production [47].
The decarbonisation of fossil fuels, particularly, natural gas, is a promising alternative and
compromises definite benefits over the use of carbon capture storage (CCS) technologies. Methane
decarbonisation by pyrolysis also called as methane cracking includes the dissociation of methane
(CH4) into its molecular particles: solid carbon (C) and hydrogen (H2). Its key benefit lies in the
lack of CO/CO2 emissions. Conversely to CCS, it substitutes the managing of CO2 with a much
lower quantity of easier-to-handle solid carbon. Hydrogen signifies a significant clean energy
carrier, with an already substantial demand and capable projections for the future energy system.
Moreover, carbon is hypothetically marketable as a product for both current and envisaged usages
such as carbon fibres, materials and nanotechnology.
The methane dissociation reaction is initiated with the formation of a free radical CH4 →
CH3
*
+ H*
that dominates the kinetics of the reaction splitting the C-H bond (dissociation energy:
434.72 kJ/mol), which necessitates high temperature levels [48]. The evaluation of the reaction
thermodynamic equilibrium mole fraction with Cantera library [49] was depicted in Fig. 35. It
could be seen that above 1000°C, nearly comprehensive conversion of methane into hydrogen is
theoretically feasible. Performances of catalytic reforming systems are listed in Table 5.
Noteworthy effort was formerly devoted to offer catalysts to the reaction to attain a feasible
application below 1000°C. In particular, metallic catalysts based on Ni and Fe have attained quite
motivating conversion rates at temperatures of the order of 600-700°C. Carbon based catalysts
such as black carbon or activated carbon have been also proposed. Fig. 36 gives a schematic view
of the application range of the main catalyst types.
40
Fig. 35 Hydrogen mole fractions attained during thermodynamic equilibrium of the methane
cracking reaction at various temperatures and 1 bar pressure (from Ref. [47])
Fig. 36 Catalyst types used for methane cracking and their temperature range of applicability
(from Ref. [47])
The practical industrial implementation in the case of catalyzed reactions is limited by the
deactivation of the catalyst and its cost. The deactivation of the catalyst is a process resulting from
the formation of coke on the surface of the catalyst during its operation and its control is a very
important challenge. In the case of carbonaceous catalysts, carbon from the pyrolysis process
decreases the active surface, and lastly abolishing its catalytic effect [47].
41
Fig. 37 Basic methane decarbonisation process definition (from Ref. [47])
The schematic diagram of the experimental setup conducted by Abanades et al. [47] is
shown in Fig. 37. The steps followed in that study are explained shortly here.
 Feed preparation: The raw natural gas can need a preparation unit to increase the methane
content and to remove impurities.
 Reactor: The liquid metal bubble column reactor is envisaged to be made of quartz glass and
operated at temperatures above 1000°C.
 Heating: The heating to deliver the energy for the reactor is based on two selections for an
industrial application: a hydrogen burner or a methane burner. Moreover, the combination with
solar technology is envisioned for further steps, but that will bring higher capital costs.
 Carbon removal from the reactor: The carbon obtained from the experiments is characterized.
 Carbon separation from the gas stream: A filter is planned to eliminate small amounts of carbon
elements from the gas stream.
 Hydrogen separation from the process stream: There are two core selections under
consideration: pressure swing absorption (PSA), a developed method applied for CO2
sequestration, and metallic membranes. Unreacted methane after separation from the process
stream will be recycled back to the reactor.
The comparison of methane pyrolysis with other developed methods for hydrogen
production from fossil-fuels is displayed in Table 6. From this theoretical comparison, that should
be checked in a demo facility, the production of 100 Mtoe (toe = tonne of oil equivalent) of
hydrogen will produce 103.8 Mtonnes of carbon with methane cracking, avoiding the production
of 255.18 Mtonnes of CO2 with steam methane reforming, or 626.85 Mtonnes CO2 in comparison
with coal gasification. The volume of CO2 to be sequestrated and managed in supercritical state
will be 10 times larger than the volume of carbon produced for the same hydrogen energy
generation, substituting the management of carbon dioxide with solid carbon, which may have
additional applicability as well. The application of methane decarbonisation can be especially
convenient in industrial sectors, as in the case of ammonia production, in which huge amounts of
hydrogen are required. From the preliminary economic analysis, the H2 production cost that can
42
be expected from industrial methane cracking could be of the order of 1.5 $/kg [47]. In a previous
analysis of methane decarbonisation [13], a H2 cost of around 3.0 $/kg for solar methane pyrolysis
was reported. However, the higher cost was mainly due to the solar field, which represents a
significant capital cost of the facility.
Table 6. Comparison of hydrogen production technologies from fossil-fuels (data from Refs. [47
,50, 51])
Process
Methane steam
reforming
Coal gasification
Methane
pyrolysis
Reaction
Heat of reaction
(kJ/mol-H2)
CH4+2H2O→CO2+ 4H2
63.25
Coal+2H2O →
CO2+ 2H2
89.08
CH4→ C + 2H2
37.43
Energy efficiency in
transformation (%)
74 60 55
Energy efficiency with
CCS (%)
54 43 55
CO2 emission
(mol-CO2/mol-H2)
0.34 0.83 0.05
Carbon production
(mol-C/mol-H2)
0 0 0.5
In another study by Abanades et al. [52], the following experimental setup was used for
methane cracking as shown in Fig. 38.
Fig. 38 Schematic diagram of the experimental setup for methane cracking (from Ref. [52])
43
At temperatures higher than 1350°C, the decomposition is practically complete, and the main
component of the outgoing gas is H2, with almost no traces of hydrocarbon gases. A cloud of
carbon powder still goes out, but a huge fraction of the produced carbon appears as solid deposits
securely adhering to the wall. Elimination of the deposit by simple mechanical pushing is very
difficult, at least in cold conditions. That carbon deposit can be eliminated by combustion, just by
blowing air into the hot oven, so producing CO2, which is undesirable. Their experimental results
showed the amount of hydrogen at the tube outlet in volume ratio percentage which is depicted for
three flow rates implying three residence times of 16, 32 and 96 s in normal conditions (25°C, 1
bar) and at a temperature range between 875-1065°C as illustrated in Fig. 39. The summary of
their experimental results are shown in Table 7 where they observed 100% dissociation at 1400°C.
Fig. 39 Hydrogen volumetric ratio at the outlet gas as a function of the temperature and the
flow rate (from Ref. [52])
Wei et al. [53] studied methane cracking over different coal chars in a fixed bed reactor.
Their purpose was to study methane cracking on different coal chars with an aim to explain the
changes in the catalytic activity of different coal chars for methane cracking and to speculate the
mechanism of methane cracking. The chars have a profound catalytic effect on the methane
cracking, with the catalytic activity varying with different types of coal chars. The catalytic activity
of char in methane cracking decreases with increasing coal rank, with the Shengli lignite char
being the most active and the Jincheng anthracite char being the least active. Methane conversion
and hydrogen yield decrease with the time on stream as the coal char becomes deactivated and the
carbon deposition from methane cracking is primarily responsible for the loss of catalytic activity
of the chars with the time on stream. The methane cracking is a surface reaction controlled by the
gas phase diffusion and therefore is influenced by both reaction temperature and methane
concentration. The methane conversion increases with increasing temperature and decreasing
methane concentration. The catalytic effect of char decreases with increasing pyrolysis
temperature in the char preparation but is less affected by the pyrolysis time indicating that the
catalytic activity depends not only on the porous structures but also on the chemical nature of the
char surface [53].
44
Table 7. Summary table of the SiC tube experiments (from Ref. [52])
Experiment no. 1 2 3 4
T (°C) 1200 1300 1400 1400
Tube
CH4 flow (l/min)
SiC
1
SiC
1.1
SiC
1
SiC + Boron
Nitrate layer
1
Ar flow (l/min) 1 0.9 1
Time (h) 3 3 3 3
Dissociation rate
10% methane
in exit.
Hydrocarbons
presence.
Unknown H2
production.
3% methane in
exit.
H2 presence 60-
70%.
Very Low
hydrocarbons
presence.
0% methane
in exit
(complete
dissociation)
H2 presence
93-94%
0% methane
in exit
(complete
dissociation)
H2 presence
93-94%
Carbon deposit
Soft carbon
black
Soft dust carbon
black
Carbon black
Hard carbon
black
Soft dust
carbon black
Carbon black
Hard carbon
black
Soft dust
carbon black
Carbon black
Hard carbon
black
3. Microwave Usage for Hydrocarbons Applications
Microwaves are electromagnetic waves with a frequency range between 300 MHz to 300 GHz,
equivalent to wavelengths of 1 mm to 1 m. Further than 30 GHz, the microwave frequency range
overlays with the RF range. Since the type of microwaves, they are ruled by the Federal
Communications Commission (FCC). In North America, the single permitted frequencies for
industrial usage are 915, 2450, 5800, and 22,000 MHz [54]. For usage in laboratory and testing
applications, a 2450 MHz is preferred. Because this frequency carry suitable diffusion depth for
many laboratory reaction situations. Microwaves are produced if electrons resonate at high
frequencies. The electric field is formed by an internal cathode and external anode with a huge
potential variance in-between. The magnetic field is forced by perpetual magnets situated typically
on the bottom of the magnetron. The electrons in this atmosphere go from the cathode in an
external spiraling path, finally reaching to the anode. While the electrons pass by resonance
chambers, energy is released. This energy is collected by an antenna as microwaves. They are
usually used for a cavity via waveguides. The essentially dissimilar technique of transporting
energy from the resource to the sample is the key advantage of using microwave energy in
comparison to standard thermal processing. By distributing energy to microwave-absorbing
materials, problems like long heat up periods, thermal gradients, and energy lost to the system
environment can often be avoided. Moreover, the penetrating ability of microwave permits
volumetric heating of sections. Hence, these advantages of microwave energy create attractiveness
for industrial uses as a substitute to standard thermal processing options. In lots of the situations,
the usage of microwave energy creates dissimilar results in comparison with the standard thermal
reactions allowing a decreased heating time or decreased reaction temperature [55]. Additionally,
45
the sample heating encouraged by microwave fields is firmly affected by the capability of the
material to captivate microwave energy which consents samples to be selectively heated by
improving the efficiency of giving energy into the system.
The essential appliance of microwave heating contains agitation of polar molecules or ions
which oscillate under the influence of an oscillating electric or magnetic field. In the occurrence
of an oscillating field, particles attempt to position themselves to be in phase with the field.
Nevertheless, the movement of the particles is limited by resisting forces, which restrict the
movement of particles and make arbitrary motion, creating heat. Microwave heating for industrial
processing is categorized by numerous features which lead the method basically altered from
standard heating options because of physical and chemical changes in products. As the reply of
several materials to microwave radiation is different, not all materials are agreeable to microwave
heating. Depending on the response to microwaves, materials may be generally categorized as
follows: materials that are transparent to microwaves, e.g., sulfur; materials that reflect
microwaves, e.g., copper; and materials that absorb microwaves, e.g., water. So, materials that
absorb microwave radiation are related to microwave chemistry. Microwave heating arises via
three tools [56–58] dipolar polarization, ionic conduction, and interfacial polarization.
Dipolar polarization is a procedure by which heat is produced in polar molecules. The main
obligation for dipolar polarization is that the frequency range of the oscillating field need to permit
suitable inter-molecule interaction. If the frequency range is too high, intermolecular forces will
end the motion of a polar particle before it attempts to track the field, causing insufficient
interaction. Conversely, if the frequency range is low, the polar molecule acquires adequate time
to line up itself in phase with the field. Therefore, no arbitrary interaction occurs between the
adjoining particles. Microwave radiation has the suitable frequency (0.3–30 GHz) to fluctuate
polar particles and permit inter-molecular interaction. This oscillation rises the kinetic energy and
collisions of all particles in the structure. As temperature is the degree of the mean kinetic energy
of elements in a body, microwaves efficiently rise the temperature of dielectric medium. For
instance, food involves commonly water, a polar particle, therefore microwave ovens are operative
for heating in the kitchens.
The conduction procedure produces heat via resistance to an electric current. The
fluctuating electromagnetic field produces an oscillation of electrons or ions in a conductor,
causing an electric current. This current aspects interior resistance, which heats the conductor. The
key restriction of this technique is that it is not appropriate for substances which include high
conductivity, as this type of substances reflect most of the energy falling on them. At lesser
temperature levels and high frequencies, heating is realized typically by dipole rotation. As
temperature rises and frequency declines, ionic conduction keeps the importance in heating.
The interfacial polarization process can be deliberated as a mixture of the conduction and
dipolar polarization techniques. It is significant for heating arrangements that include a conducting
material detached in a non-conducting ambient. For instance, if the diffusion of metal elements in
sulfur is considered, sulfur does not react to microwaves, and metals reflect supreme of the
microwave energy they are faced to, but merging the two creates a microwave-absorbing material.
Nevertheless, for the occurrence of this, metals need to be utilized in powder form. This is due to
metal powder which is a good absorber of microwave radiation dissimilar than metal surface. It
absorbs radiation and is heated by a process which is comparable to dipolar polarization. The
surroundings of the metal powder actions as a solvent for polar particles and restricts motion by
forces that are correspondent to inter-molecular exchanges in polar solvents. The limiting forces,
Comparative assessment of NH3 production and utilization in Ontario

More Related Content

What's hot

2011 effect of-hho-gas-on-combustion-emissions-in-gasoline-engines-s.a.musmar...
2011 effect of-hho-gas-on-combustion-emissions-in-gasoline-engines-s.a.musmar...2011 effect of-hho-gas-on-combustion-emissions-in-gasoline-engines-s.a.musmar...
2011 effect of-hho-gas-on-combustion-emissions-in-gasoline-engines-s.a.musmar...Denis Pitarelli
 
Hubert Gasteiger at BASF Science Symposium 2015
Hubert Gasteiger at BASF Science Symposium 2015Hubert Gasteiger at BASF Science Symposium 2015
Hubert Gasteiger at BASF Science Symposium 2015BASF
 
Detlef Stolten at BASF Science Symposium 2015
Detlef Stolten at BASF Science Symposium 2015Detlef Stolten at BASF Science Symposium 2015
Detlef Stolten at BASF Science Symposium 2015BASF
 
PERFORMANCE ANALYSIS OF HYDROGEN FUELED INTERNAL COMBUSTION ENGINE
PERFORMANCE ANALYSIS OF HYDROGEN FUELED INTERNAL COMBUSTION ENGINEPERFORMANCE ANALYSIS OF HYDROGEN FUELED INTERNAL COMBUSTION ENGINE
PERFORMANCE ANALYSIS OF HYDROGEN FUELED INTERNAL COMBUSTION ENGINEijsrd.com
 
Detlef Kratz at BASF Science Symposium 2015
Detlef Kratz at BASF Science Symposium 2015Detlef Kratz at BASF Science Symposium 2015
Detlef Kratz at BASF Science Symposium 2015BASF
 
Mathematical modeling of municipal solid waste plasma gasification in a fixed...
Mathematical modeling of municipal solid waste plasma gasification in a fixed...Mathematical modeling of municipal solid waste plasma gasification in a fixed...
Mathematical modeling of municipal solid waste plasma gasification in a fixed...Qinglin Zhang
 
sufficient method of hydrogen production by water gas shift reactions
sufficient method of hydrogen production by water gas shift reactions sufficient method of hydrogen production by water gas shift reactions
sufficient method of hydrogen production by water gas shift reactions MUKULsethi5
 
CFD Modeling of FCC Riser Reactor
CFD Modeling of FCC Riser Reactor CFD Modeling of FCC Riser Reactor
CFD Modeling of FCC Riser Reactor IRJET Journal
 
Robert Schloegl at BASF Science Symposium 2015
Robert Schloegl at BASF Science Symposium 2015Robert Schloegl at BASF Science Symposium 2015
Robert Schloegl at BASF Science Symposium 2015BASF
 
Hydrogen fuel enhancement_for_vehicles_From_www.computerittech.com
Hydrogen fuel enhancement_for_vehicles_From_www.computerittech.comHydrogen fuel enhancement_for_vehicles_From_www.computerittech.com
Hydrogen fuel enhancement_for_vehicles_From_www.computerittech.comTareen IT Tech
 
Investigation on multi cylinder s.i engine using blends of hydrogen and cng
Investigation on multi cylinder s.i engine using blends of hydrogen and cngInvestigation on multi cylinder s.i engine using blends of hydrogen and cng
Investigation on multi cylinder s.i engine using blends of hydrogen and cngeSAT Publishing House
 
Power Generation in Future by Using Landfill Gases
Power Generation in Future by Using Landfill GasesPower Generation in Future by Using Landfill Gases
Power Generation in Future by Using Landfill GasesIJARIIT
 
Investigating a conventional and retrofit power plant on-board a Roll-on-Roll...
Investigating a conventional and retrofit power plant on-board a Roll-on-Roll...Investigating a conventional and retrofit power plant on-board a Roll-on-Roll...
Investigating a conventional and retrofit power plant on-board a Roll-on-Roll...Janie Ling Chin
 
Hydrogen storage
Hydrogen storage Hydrogen storage
Hydrogen storage ajay singh
 
International Journal of Computational Engineering Research(IJCER)
International Journal of Computational Engineering Research(IJCER)International Journal of Computational Engineering Research(IJCER)
International Journal of Computational Engineering Research(IJCER)ijceronline
 
Tetsuya Osaka at BASF Science Symposium 2015
Tetsuya Osaka at BASF Science Symposium 2015Tetsuya Osaka at BASF Science Symposium 2015
Tetsuya Osaka at BASF Science Symposium 2015BASF
 

What's hot (20)

2011 effect of-hho-gas-on-combustion-emissions-in-gasoline-engines-s.a.musmar...
2011 effect of-hho-gas-on-combustion-emissions-in-gasoline-engines-s.a.musmar...2011 effect of-hho-gas-on-combustion-emissions-in-gasoline-engines-s.a.musmar...
2011 effect of-hho-gas-on-combustion-emissions-in-gasoline-engines-s.a.musmar...
 
Hubert Gasteiger at BASF Science Symposium 2015
Hubert Gasteiger at BASF Science Symposium 2015Hubert Gasteiger at BASF Science Symposium 2015
Hubert Gasteiger at BASF Science Symposium 2015
 
Detlef Stolten at BASF Science Symposium 2015
Detlef Stolten at BASF Science Symposium 2015Detlef Stolten at BASF Science Symposium 2015
Detlef Stolten at BASF Science Symposium 2015
 
PERFORMANCE ANALYSIS OF HYDROGEN FUELED INTERNAL COMBUSTION ENGINE
PERFORMANCE ANALYSIS OF HYDROGEN FUELED INTERNAL COMBUSTION ENGINEPERFORMANCE ANALYSIS OF HYDROGEN FUELED INTERNAL COMBUSTION ENGINE
PERFORMANCE ANALYSIS OF HYDROGEN FUELED INTERNAL COMBUSTION ENGINE
 
Detlef Kratz at BASF Science Symposium 2015
Detlef Kratz at BASF Science Symposium 2015Detlef Kratz at BASF Science Symposium 2015
Detlef Kratz at BASF Science Symposium 2015
 
Mathematical modeling of municipal solid waste plasma gasification in a fixed...
Mathematical modeling of municipal solid waste plasma gasification in a fixed...Mathematical modeling of municipal solid waste plasma gasification in a fixed...
Mathematical modeling of municipal solid waste plasma gasification in a fixed...
 
sufficient method of hydrogen production by water gas shift reactions
sufficient method of hydrogen production by water gas shift reactions sufficient method of hydrogen production by water gas shift reactions
sufficient method of hydrogen production by water gas shift reactions
 
CFD Modeling of FCC Riser Reactor
CFD Modeling of FCC Riser Reactor CFD Modeling of FCC Riser Reactor
CFD Modeling of FCC Riser Reactor
 
L1302037480
L1302037480L1302037480
L1302037480
 
Robert Schloegl at BASF Science Symposium 2015
Robert Schloegl at BASF Science Symposium 2015Robert Schloegl at BASF Science Symposium 2015
Robert Schloegl at BASF Science Symposium 2015
 
Hydrogen fuel enhancement_for_vehicles_From_www.computerittech.com
Hydrogen fuel enhancement_for_vehicles_From_www.computerittech.comHydrogen fuel enhancement_for_vehicles_From_www.computerittech.com
Hydrogen fuel enhancement_for_vehicles_From_www.computerittech.com
 
Life Cycle Assessment of alternative fossil fuel based power generation value...
Life Cycle Assessment of alternative fossil fuel based power generation value...Life Cycle Assessment of alternative fossil fuel based power generation value...
Life Cycle Assessment of alternative fossil fuel based power generation value...
 
Kr3119551960
Kr3119551960Kr3119551960
Kr3119551960
 
Investigation on multi cylinder s.i engine using blends of hydrogen and cng
Investigation on multi cylinder s.i engine using blends of hydrogen and cngInvestigation on multi cylinder s.i engine using blends of hydrogen and cng
Investigation on multi cylinder s.i engine using blends of hydrogen and cng
 
Power Generation in Future by Using Landfill Gases
Power Generation in Future by Using Landfill GasesPower Generation in Future by Using Landfill Gases
Power Generation in Future by Using Landfill Gases
 
Investigating a conventional and retrofit power plant on-board a Roll-on-Roll...
Investigating a conventional and retrofit power plant on-board a Roll-on-Roll...Investigating a conventional and retrofit power plant on-board a Roll-on-Roll...
Investigating a conventional and retrofit power plant on-board a Roll-on-Roll...
 
Adsorption Materials and Processes for Carbon Capture from Gas-Fired Power Pl...
Adsorption Materials and Processes for Carbon Capture from Gas-Fired Power Pl...Adsorption Materials and Processes for Carbon Capture from Gas-Fired Power Pl...
Adsorption Materials and Processes for Carbon Capture from Gas-Fired Power Pl...
 
Hydrogen storage
Hydrogen storage Hydrogen storage
Hydrogen storage
 
International Journal of Computational Engineering Research(IJCER)
International Journal of Computational Engineering Research(IJCER)International Journal of Computational Engineering Research(IJCER)
International Journal of Computational Engineering Research(IJCER)
 
Tetsuya Osaka at BASF Science Symposium 2015
Tetsuya Osaka at BASF Science Symposium 2015Tetsuya Osaka at BASF Science Symposium 2015
Tetsuya Osaka at BASF Science Symposium 2015
 

Viewers also liked

Green ammonia siemens oxford cardiff
Green ammonia siemens oxford cardiffGreen ammonia siemens oxford cardiff
Green ammonia siemens oxford cardiffSteve Wittrig
 
eddie sturman presentation adaptive digital camless engine
eddie sturman presentation adaptive digital camless engineeddie sturman presentation adaptive digital camless engine
eddie sturman presentation adaptive digital camless engineSteve Wittrig
 
Large scale ammonia storage and handling
Large scale ammonia storage and handlingLarge scale ammonia storage and handling
Large scale ammonia storage and handlinglpgbnhgastank
 
Green ammonia-hughes siemens oxford
Green ammonia-hughes siemens oxfordGreen ammonia-hughes siemens oxford
Green ammonia-hughes siemens oxfordSteve Wittrig
 
Sturman engines camless digital engines overview article
Sturman engines camless digital engines overview articleSturman engines camless digital engines overview article
Sturman engines camless digital engines overview articleSteve Wittrig
 
Atlas v-2015 Department of Energy (DOE) Carbon Storage Atlas Julio et al 2015
Atlas v-2015 Department of Energy (DOE) Carbon Storage Atlas Julio et al 2015Atlas v-2015 Department of Energy (DOE) Carbon Storage Atlas Julio et al 2015
Atlas v-2015 Department of Energy (DOE) Carbon Storage Atlas Julio et al 2015Steve Wittrig
 

Viewers also liked (6)

Green ammonia siemens oxford cardiff
Green ammonia siemens oxford cardiffGreen ammonia siemens oxford cardiff
Green ammonia siemens oxford cardiff
 
eddie sturman presentation adaptive digital camless engine
eddie sturman presentation adaptive digital camless engineeddie sturman presentation adaptive digital camless engine
eddie sturman presentation adaptive digital camless engine
 
Large scale ammonia storage and handling
Large scale ammonia storage and handlingLarge scale ammonia storage and handling
Large scale ammonia storage and handling
 
Green ammonia-hughes siemens oxford
Green ammonia-hughes siemens oxfordGreen ammonia-hughes siemens oxford
Green ammonia-hughes siemens oxford
 
Sturman engines camless digital engines overview article
Sturman engines camless digital engines overview articleSturman engines camless digital engines overview article
Sturman engines camless digital engines overview article
 
Atlas v-2015 Department of Energy (DOE) Carbon Storage Atlas Julio et al 2015
Atlas v-2015 Department of Energy (DOE) Carbon Storage Atlas Julio et al 2015Atlas v-2015 Department of Energy (DOE) Carbon Storage Atlas Julio et al 2015
Atlas v-2015 Department of Energy (DOE) Carbon Storage Atlas Julio et al 2015
 

Similar to Comparative assessment of NH3 production and utilization in Ontario

IRJET- Co2 Mitigation
IRJET- Co2 MitigationIRJET- Co2 Mitigation
IRJET- Co2 MitigationIRJET Journal
 
PLANT DESIGN FOR MANUFACTURING OF HYDROGEN BY STEAM METHANE REFORMING (SMR)
PLANT DESIGN FOR MANUFACTURING OF HYDROGEN BY STEAM METHANE REFORMING (SMR)PLANT DESIGN FOR MANUFACTURING OF HYDROGEN BY STEAM METHANE REFORMING (SMR)
PLANT DESIGN FOR MANUFACTURING OF HYDROGEN BY STEAM METHANE REFORMING (SMR)Priyam Jyoti Borah
 
Al AlawiApplications of hydrogen in industryHydrogen’s use in .docx
Al AlawiApplications of hydrogen in industryHydrogen’s use in .docxAl AlawiApplications of hydrogen in industryHydrogen’s use in .docx
Al AlawiApplications of hydrogen in industryHydrogen’s use in .docxsimonlbentley59018
 
1-s2.0-S1876610211008265-main.pdf
1-s2.0-S1876610211008265-main.pdf1-s2.0-S1876610211008265-main.pdf
1-s2.0-S1876610211008265-main.pdfShahFaisal672527
 
downdraft Biomass
downdraft Biomassdowndraft Biomass
downdraft BiomassVivek Faldu
 
Production of Syngas from Biomass
Production of Syngas from Biomass  Production of Syngas from Biomass
Production of Syngas from Biomass Awais Chaudhary
 
IRJET- Hydrogen Fuel Cell
IRJET- Hydrogen Fuel CellIRJET- Hydrogen Fuel Cell
IRJET- Hydrogen Fuel CellIRJET Journal
 
Greg vezina-key-life-cycle-numbers-for-nh3-green-and-brown-energy-nh3fa20161
Greg vezina-key-life-cycle-numbers-for-nh3-green-and-brown-energy-nh3fa20161Greg vezina-key-life-cycle-numbers-for-nh3-green-and-brown-energy-nh3fa20161
Greg vezina-key-life-cycle-numbers-for-nh3-green-and-brown-energy-nh3fa20161Steve Wittrig
 
HydrogenPPTGroup25.pptx
HydrogenPPTGroup25.pptxHydrogenPPTGroup25.pptx
HydrogenPPTGroup25.pptxmadhav590273
 
Apec workshop 2 presentation 12 lh ci cinco presidentes-pemex-apec workshop 2
Apec workshop 2 presentation 12 lh ci cinco presidentes-pemex-apec workshop 2Apec workshop 2 presentation 12 lh ci cinco presidentes-pemex-apec workshop 2
Apec workshop 2 presentation 12 lh ci cinco presidentes-pemex-apec workshop 2Global CCS Institute
 
PRESENTATION ON PLANT DESIGN FOR MANUFACTURING OF HYDROGEN
PRESENTATION ON PLANT DESIGN FOR MANUFACTURING OF HYDROGENPRESENTATION ON PLANT DESIGN FOR MANUFACTURING OF HYDROGEN
PRESENTATION ON PLANT DESIGN FOR MANUFACTURING OF HYDROGENPriyam Jyoti Borah
 
184_presentation_20210606_132102.pptx
184_presentation_20210606_132102.pptx184_presentation_20210606_132102.pptx
184_presentation_20210606_132102.pptxArockiaFenil1
 
energies-13-06599-v2.pdf
energies-13-06599-v2.pdfenergies-13-06599-v2.pdf
energies-13-06599-v2.pdfssuser2668c5
 
Alternatefuels.doc
Alternatefuels.docAlternatefuels.doc
Alternatefuels.docAnupam952230
 

Similar to Comparative assessment of NH3 production and utilization in Ontario (20)

IRJET- Co2 Mitigation
IRJET- Co2 MitigationIRJET- Co2 Mitigation
IRJET- Co2 Mitigation
 
PLANT DESIGN FOR MANUFACTURING OF HYDROGEN BY STEAM METHANE REFORMING (SMR)
PLANT DESIGN FOR MANUFACTURING OF HYDROGEN BY STEAM METHANE REFORMING (SMR)PLANT DESIGN FOR MANUFACTURING OF HYDROGEN BY STEAM METHANE REFORMING (SMR)
PLANT DESIGN FOR MANUFACTURING OF HYDROGEN BY STEAM METHANE REFORMING (SMR)
 
Al AlawiApplications of hydrogen in industryHydrogen’s use in .docx
Al AlawiApplications of hydrogen in industryHydrogen’s use in .docxAl AlawiApplications of hydrogen in industryHydrogen’s use in .docx
Al AlawiApplications of hydrogen in industryHydrogen’s use in .docx
 
3.pdf
3.pdf3.pdf
3.pdf
 
1-s2.0-S1876610211008265-main.pdf
1-s2.0-S1876610211008265-main.pdf1-s2.0-S1876610211008265-main.pdf
1-s2.0-S1876610211008265-main.pdf
 
downdraft Biomass
downdraft Biomassdowndraft Biomass
downdraft Biomass
 
Production of Syngas from Biomass
Production of Syngas from Biomass  Production of Syngas from Biomass
Production of Syngas from Biomass
 
IRJET- Hydrogen Fuel Cell
IRJET- Hydrogen Fuel CellIRJET- Hydrogen Fuel Cell
IRJET- Hydrogen Fuel Cell
 
Air fuel technique
Air fuel techniqueAir fuel technique
Air fuel technique
 
Greg vezina-key-life-cycle-numbers-for-nh3-green-and-brown-energy-nh3fa20161
Greg vezina-key-life-cycle-numbers-for-nh3-green-and-brown-energy-nh3fa20161Greg vezina-key-life-cycle-numbers-for-nh3-green-and-brown-energy-nh3fa20161
Greg vezina-key-life-cycle-numbers-for-nh3-green-and-brown-energy-nh3fa20161
 
HydrogenPPTGroup25.pptx
HydrogenPPTGroup25.pptxHydrogenPPTGroup25.pptx
HydrogenPPTGroup25.pptx
 
Ijaret 06 10_020
Ijaret 06 10_020Ijaret 06 10_020
Ijaret 06 10_020
 
Apec workshop 2 presentation 12 lh ci cinco presidentes-pemex-apec workshop 2
Apec workshop 2 presentation 12 lh ci cinco presidentes-pemex-apec workshop 2Apec workshop 2 presentation 12 lh ci cinco presidentes-pemex-apec workshop 2
Apec workshop 2 presentation 12 lh ci cinco presidentes-pemex-apec workshop 2
 
feasibilty
feasibiltyfeasibilty
feasibilty
 
PRESENTATION ON PLANT DESIGN FOR MANUFACTURING OF HYDROGEN
PRESENTATION ON PLANT DESIGN FOR MANUFACTURING OF HYDROGENPRESENTATION ON PLANT DESIGN FOR MANUFACTURING OF HYDROGEN
PRESENTATION ON PLANT DESIGN FOR MANUFACTURING OF HYDROGEN
 
184_presentation_20210606_132102.pptx
184_presentation_20210606_132102.pptx184_presentation_20210606_132102.pptx
184_presentation_20210606_132102.pptx
 
energies-13-06599-v2.pdf
energies-13-06599-v2.pdfenergies-13-06599-v2.pdf
energies-13-06599-v2.pdf
 
Alternatefuels.doc
Alternatefuels.docAlternatefuels.doc
Alternatefuels.doc
 
Honours Project 2014
Honours Project 2014Honours Project 2014
Honours Project 2014
 
International Journal of Engineering Inventions (IJEI),
International Journal of Engineering Inventions (IJEI), International Journal of Engineering Inventions (IJEI),
International Journal of Engineering Inventions (IJEI),
 

More from Steve Wittrig

HYDROFUEL KINETIC EMERGY BROCHURE AICHE
HYDROFUEL KINETIC EMERGY BROCHURE AICHEHYDROFUEL KINETIC EMERGY BROCHURE AICHE
HYDROFUEL KINETIC EMERGY BROCHURE AICHESteve Wittrig
 
Mitacs comprehensive evaluation of nh3 production and utilization options for...
Mitacs comprehensive evaluation of nh3 production and utilization options for...Mitacs comprehensive evaluation of nh3 production and utilization options for...
Mitacs comprehensive evaluation of nh3 production and utilization options for...Steve Wittrig
 
Ammonia (nh3) as a potential transportation solution for ontario uoit dincer ...
Ammonia (nh3) as a potential transportation solution for ontario uoit dincer ...Ammonia (nh3) as a potential transportation solution for ontario uoit dincer ...
Ammonia (nh3) as a potential transportation solution for ontario uoit dincer ...Steve Wittrig
 
Ammonia (nh3) as a carbon free fuel uoit vezina white paper hydrofuel
Ammonia (nh3) as a carbon free fuel uoit vezina white paper hydrofuelAmmonia (nh3) as a carbon free fuel uoit vezina white paper hydrofuel
Ammonia (nh3) as a carbon free fuel uoit vezina white paper hydrofuelSteve Wittrig
 
KINETIC EMERGY OVERVIEW AND RESUME DR STEVE WITTRIG SEP17
KINETIC EMERGY OVERVIEW AND RESUME DR STEVE WITTRIG SEP17KINETIC EMERGY OVERVIEW AND RESUME DR STEVE WITTRIG SEP17
KINETIC EMERGY OVERVIEW AND RESUME DR STEVE WITTRIG SEP17Steve Wittrig
 
Tsinghua bp clean energy centre established time magazine tony blair 2003
Tsinghua bp clean energy centre established time magazine tony blair 2003Tsinghua bp clean energy centre established time magazine tony blair 2003
Tsinghua bp clean energy centre established time magazine tony blair 2003Steve Wittrig
 
Resume Dr T Stephen Wittrig
Resume Dr T Stephen WittrigResume Dr T Stephen Wittrig
Resume Dr T Stephen WittrigSteve Wittrig
 
Mitacs hydrofuel-uoit nov 2015 200 pp cost and tech analysis of a wide variet...
Mitacs hydrofuel-uoit nov 2015 200 pp cost and tech analysis of a wide variet...Mitacs hydrofuel-uoit nov 2015 200 pp cost and tech analysis of a wide variet...
Mitacs hydrofuel-uoit nov 2015 200 pp cost and tech analysis of a wide variet...Steve Wittrig
 
mitacs uoit study it05701 july 2015 vezina comparative ammonia costs producti...
mitacs uoit study it05701 july 2015 vezina comparative ammonia costs producti...mitacs uoit study it05701 july 2015 vezina comparative ammonia costs producti...
mitacs uoit study it05701 july 2015 vezina comparative ammonia costs producti...Steve Wittrig
 
2016 state-of-the-climate-report cfact
2016 state-of-the-climate-report cfact2016 state-of-the-climate-report cfact
2016 state-of-the-climate-report cfactSteve Wittrig
 
China automotive energy research center brief rr advisory committee ditan lab...
China automotive energy research center brief rr advisory committee ditan lab...China automotive energy research center brief rr advisory committee ditan lab...
China automotive energy research center brief rr advisory committee ditan lab...Steve Wittrig
 
Methanol institute 2016 overview of rapidly emerging methanol markets for fue...
Methanol institute 2016 overview of rapidly emerging methanol markets for fue...Methanol institute 2016 overview of rapidly emerging methanol markets for fue...
Methanol institute 2016 overview of rapidly emerging methanol markets for fue...Steve Wittrig
 
Air liquide lurgi 2016 overview of coal heavy oil ch4 to syngas h2 ammonia me...
Air liquide lurgi 2016 overview of coal heavy oil ch4 to syngas h2 ammonia me...Air liquide lurgi 2016 overview of coal heavy oil ch4 to syngas h2 ammonia me...
Air liquide lurgi 2016 overview of coal heavy oil ch4 to syngas h2 ammonia me...Steve Wittrig
 
Floating city-project-report-4 25-2014 seasteading institute white paper
Floating city-project-report-4 25-2014 seasteading institute white paperFloating city-project-report-4 25-2014 seasteading institute white paper
Floating city-project-report-4 25-2014 seasteading institute white paperSteve Wittrig
 
Roles of cecc eil ceftf evolution and sources of value - china programs kinet...
Roles of cecc eil ceftf evolution and sources of value - china programs kinet...Roles of cecc eil ceftf evolution and sources of value - china programs kinet...
Roles of cecc eil ceftf evolution and sources of value - china programs kinet...Steve Wittrig
 
Shenhua ccs program strategy and accomplishments for China Ren Xiankun 2009
Shenhua ccs program strategy and accomplishments for China Ren Xiankun 2009Shenhua ccs program strategy and accomplishments for China Ren Xiankun 2009
Shenhua ccs program strategy and accomplishments for China Ren Xiankun 2009Steve Wittrig
 
Zhang wenjiang shenhua direct coal liquefaction project 6 billion usd first...
Zhang wenjiang   shenhua direct coal liquefaction project 6 billion usd first...Zhang wenjiang   shenhua direct coal liquefaction project 6 billion usd first...
Zhang wenjiang shenhua direct coal liquefaction project 6 billion usd first...Steve Wittrig
 
Zhang yuzhuo CEO 2011 china shenhua coal conversion powerpoint LARGEST COAL C...
Zhang yuzhuo CEO 2011 china shenhua coal conversion powerpoint LARGEST COAL C...Zhang yuzhuo CEO 2011 china shenhua coal conversion powerpoint LARGEST COAL C...
Zhang yuzhuo CEO 2011 china shenhua coal conversion powerpoint LARGEST COAL C...Steve Wittrig
 
Shanghai electric 2011 brochure Overview of a selection of capabilities Shang...
Shanghai electric 2011 brochure Overview of a selection of capabilities Shang...Shanghai electric 2011 brochure Overview of a selection of capabilities Shang...
Shanghai electric 2011 brochure Overview of a selection of capabilities Shang...Steve Wittrig
 
Assessment of future prospects for biofuels for bp beyond petroleum strategy ...
Assessment of future prospects for biofuels for bp beyond petroleum strategy ...Assessment of future prospects for biofuels for bp beyond petroleum strategy ...
Assessment of future prospects for biofuels for bp beyond petroleum strategy ...Steve Wittrig
 

More from Steve Wittrig (20)

HYDROFUEL KINETIC EMERGY BROCHURE AICHE
HYDROFUEL KINETIC EMERGY BROCHURE AICHEHYDROFUEL KINETIC EMERGY BROCHURE AICHE
HYDROFUEL KINETIC EMERGY BROCHURE AICHE
 
Mitacs comprehensive evaluation of nh3 production and utilization options for...
Mitacs comprehensive evaluation of nh3 production and utilization options for...Mitacs comprehensive evaluation of nh3 production and utilization options for...
Mitacs comprehensive evaluation of nh3 production and utilization options for...
 
Ammonia (nh3) as a potential transportation solution for ontario uoit dincer ...
Ammonia (nh3) as a potential transportation solution for ontario uoit dincer ...Ammonia (nh3) as a potential transportation solution for ontario uoit dincer ...
Ammonia (nh3) as a potential transportation solution for ontario uoit dincer ...
 
Ammonia (nh3) as a carbon free fuel uoit vezina white paper hydrofuel
Ammonia (nh3) as a carbon free fuel uoit vezina white paper hydrofuelAmmonia (nh3) as a carbon free fuel uoit vezina white paper hydrofuel
Ammonia (nh3) as a carbon free fuel uoit vezina white paper hydrofuel
 
KINETIC EMERGY OVERVIEW AND RESUME DR STEVE WITTRIG SEP17
KINETIC EMERGY OVERVIEW AND RESUME DR STEVE WITTRIG SEP17KINETIC EMERGY OVERVIEW AND RESUME DR STEVE WITTRIG SEP17
KINETIC EMERGY OVERVIEW AND RESUME DR STEVE WITTRIG SEP17
 
Tsinghua bp clean energy centre established time magazine tony blair 2003
Tsinghua bp clean energy centre established time magazine tony blair 2003Tsinghua bp clean energy centre established time magazine tony blair 2003
Tsinghua bp clean energy centre established time magazine tony blair 2003
 
Resume Dr T Stephen Wittrig
Resume Dr T Stephen WittrigResume Dr T Stephen Wittrig
Resume Dr T Stephen Wittrig
 
Mitacs hydrofuel-uoit nov 2015 200 pp cost and tech analysis of a wide variet...
Mitacs hydrofuel-uoit nov 2015 200 pp cost and tech analysis of a wide variet...Mitacs hydrofuel-uoit nov 2015 200 pp cost and tech analysis of a wide variet...
Mitacs hydrofuel-uoit nov 2015 200 pp cost and tech analysis of a wide variet...
 
mitacs uoit study it05701 july 2015 vezina comparative ammonia costs producti...
mitacs uoit study it05701 july 2015 vezina comparative ammonia costs producti...mitacs uoit study it05701 july 2015 vezina comparative ammonia costs producti...
mitacs uoit study it05701 july 2015 vezina comparative ammonia costs producti...
 
2016 state-of-the-climate-report cfact
2016 state-of-the-climate-report cfact2016 state-of-the-climate-report cfact
2016 state-of-the-climate-report cfact
 
China automotive energy research center brief rr advisory committee ditan lab...
China automotive energy research center brief rr advisory committee ditan lab...China automotive energy research center brief rr advisory committee ditan lab...
China automotive energy research center brief rr advisory committee ditan lab...
 
Methanol institute 2016 overview of rapidly emerging methanol markets for fue...
Methanol institute 2016 overview of rapidly emerging methanol markets for fue...Methanol institute 2016 overview of rapidly emerging methanol markets for fue...
Methanol institute 2016 overview of rapidly emerging methanol markets for fue...
 
Air liquide lurgi 2016 overview of coal heavy oil ch4 to syngas h2 ammonia me...
Air liquide lurgi 2016 overview of coal heavy oil ch4 to syngas h2 ammonia me...Air liquide lurgi 2016 overview of coal heavy oil ch4 to syngas h2 ammonia me...
Air liquide lurgi 2016 overview of coal heavy oil ch4 to syngas h2 ammonia me...
 
Floating city-project-report-4 25-2014 seasteading institute white paper
Floating city-project-report-4 25-2014 seasteading institute white paperFloating city-project-report-4 25-2014 seasteading institute white paper
Floating city-project-report-4 25-2014 seasteading institute white paper
 
Roles of cecc eil ceftf evolution and sources of value - china programs kinet...
Roles of cecc eil ceftf evolution and sources of value - china programs kinet...Roles of cecc eil ceftf evolution and sources of value - china programs kinet...
Roles of cecc eil ceftf evolution and sources of value - china programs kinet...
 
Shenhua ccs program strategy and accomplishments for China Ren Xiankun 2009
Shenhua ccs program strategy and accomplishments for China Ren Xiankun 2009Shenhua ccs program strategy and accomplishments for China Ren Xiankun 2009
Shenhua ccs program strategy and accomplishments for China Ren Xiankun 2009
 
Zhang wenjiang shenhua direct coal liquefaction project 6 billion usd first...
Zhang wenjiang   shenhua direct coal liquefaction project 6 billion usd first...Zhang wenjiang   shenhua direct coal liquefaction project 6 billion usd first...
Zhang wenjiang shenhua direct coal liquefaction project 6 billion usd first...
 
Zhang yuzhuo CEO 2011 china shenhua coal conversion powerpoint LARGEST COAL C...
Zhang yuzhuo CEO 2011 china shenhua coal conversion powerpoint LARGEST COAL C...Zhang yuzhuo CEO 2011 china shenhua coal conversion powerpoint LARGEST COAL C...
Zhang yuzhuo CEO 2011 china shenhua coal conversion powerpoint LARGEST COAL C...
 
Shanghai electric 2011 brochure Overview of a selection of capabilities Shang...
Shanghai electric 2011 brochure Overview of a selection of capabilities Shang...Shanghai electric 2011 brochure Overview of a selection of capabilities Shang...
Shanghai electric 2011 brochure Overview of a selection of capabilities Shang...
 
Assessment of future prospects for biofuels for bp beyond petroleum strategy ...
Assessment of future prospects for biofuels for bp beyond petroleum strategy ...Assessment of future prospects for biofuels for bp beyond petroleum strategy ...
Assessment of future prospects for biofuels for bp beyond petroleum strategy ...
 

Recently uploaded

Architect Hassan Khalil Portfolio for 2024
Architect Hassan Khalil Portfolio for 2024Architect Hassan Khalil Portfolio for 2024
Architect Hassan Khalil Portfolio for 2024hassan khalil
 
High Profile Call Girls Nagpur Isha Call 7001035870 Meet With Nagpur Escorts
High Profile Call Girls Nagpur Isha Call 7001035870 Meet With Nagpur EscortsHigh Profile Call Girls Nagpur Isha Call 7001035870 Meet With Nagpur Escorts
High Profile Call Girls Nagpur Isha Call 7001035870 Meet With Nagpur Escortsranjana rawat
 
Call for Papers - African Journal of Biological Sciences, E-ISSN: 2663-2187, ...
Call for Papers - African Journal of Biological Sciences, E-ISSN: 2663-2187, ...Call for Papers - African Journal of Biological Sciences, E-ISSN: 2663-2187, ...
Call for Papers - African Journal of Biological Sciences, E-ISSN: 2663-2187, ...Christo Ananth
 
GDSC ASEB Gen AI study jams presentation
GDSC ASEB Gen AI study jams presentationGDSC ASEB Gen AI study jams presentation
GDSC ASEB Gen AI study jams presentationGDSCAESB
 
MANUFACTURING PROCESS-II UNIT-5 NC MACHINE TOOLS
MANUFACTURING PROCESS-II UNIT-5 NC MACHINE TOOLSMANUFACTURING PROCESS-II UNIT-5 NC MACHINE TOOLS
MANUFACTURING PROCESS-II UNIT-5 NC MACHINE TOOLSSIVASHANKAR N
 
The Most Attractive Pune Call Girls Budhwar Peth 8250192130 Will You Miss Thi...
The Most Attractive Pune Call Girls Budhwar Peth 8250192130 Will You Miss Thi...The Most Attractive Pune Call Girls Budhwar Peth 8250192130 Will You Miss Thi...
The Most Attractive Pune Call Girls Budhwar Peth 8250192130 Will You Miss Thi...ranjana rawat
 
Introduction to IEEE STANDARDS and its different types.pptx
Introduction to IEEE STANDARDS and its different types.pptxIntroduction to IEEE STANDARDS and its different types.pptx
Introduction to IEEE STANDARDS and its different types.pptxupamatechverse
 
(MEERA) Dapodi Call Girls Just Call 7001035870 [ Cash on Delivery ] Pune Escorts
(MEERA) Dapodi Call Girls Just Call 7001035870 [ Cash on Delivery ] Pune Escorts(MEERA) Dapodi Call Girls Just Call 7001035870 [ Cash on Delivery ] Pune Escorts
(MEERA) Dapodi Call Girls Just Call 7001035870 [ Cash on Delivery ] Pune Escortsranjana rawat
 
APPLICATIONS-AC/DC DRIVES-OPERATING CHARACTERISTICS
APPLICATIONS-AC/DC DRIVES-OPERATING CHARACTERISTICSAPPLICATIONS-AC/DC DRIVES-OPERATING CHARACTERISTICS
APPLICATIONS-AC/DC DRIVES-OPERATING CHARACTERISTICSKurinjimalarL3
 
Decoding Kotlin - Your guide to solving the mysterious in Kotlin.pptx
Decoding Kotlin - Your guide to solving the mysterious in Kotlin.pptxDecoding Kotlin - Your guide to solving the mysterious in Kotlin.pptx
Decoding Kotlin - Your guide to solving the mysterious in Kotlin.pptxJoão Esperancinha
 
(ANVI) Koregaon Park Call Girls Just Call 7001035870 [ Cash on Delivery ] Pun...
(ANVI) Koregaon Park Call Girls Just Call 7001035870 [ Cash on Delivery ] Pun...(ANVI) Koregaon Park Call Girls Just Call 7001035870 [ Cash on Delivery ] Pun...
(ANVI) Koregaon Park Call Girls Just Call 7001035870 [ Cash on Delivery ] Pun...ranjana rawat
 
VIP Call Girls Service Hitech City Hyderabad Call +91-8250192130
VIP Call Girls Service Hitech City Hyderabad Call +91-8250192130VIP Call Girls Service Hitech City Hyderabad Call +91-8250192130
VIP Call Girls Service Hitech City Hyderabad Call +91-8250192130Suhani Kapoor
 
Extrusion Processes and Their Limitations
Extrusion Processes and Their LimitationsExtrusion Processes and Their Limitations
Extrusion Processes and Their Limitations120cr0395
 
SPICE PARK APR2024 ( 6,793 SPICE Models )
SPICE PARK APR2024 ( 6,793 SPICE Models )SPICE PARK APR2024 ( 6,793 SPICE Models )
SPICE PARK APR2024 ( 6,793 SPICE Models )Tsuyoshi Horigome
 
Analog to Digital and Digital to Analog Converter
Analog to Digital and Digital to Analog ConverterAnalog to Digital and Digital to Analog Converter
Analog to Digital and Digital to Analog ConverterAbhinavSharma374939
 
What are the advantages and disadvantages of membrane structures.pptx
What are the advantages and disadvantages of membrane structures.pptxWhat are the advantages and disadvantages of membrane structures.pptx
What are the advantages and disadvantages of membrane structures.pptxwendy cai
 
Porous Ceramics seminar and technical writing
Porous Ceramics seminar and technical writingPorous Ceramics seminar and technical writing
Porous Ceramics seminar and technical writingrakeshbaidya232001
 
(RIA) Call Girls Bhosari ( 7001035870 ) HI-Fi Pune Escorts Service
(RIA) Call Girls Bhosari ( 7001035870 ) HI-Fi Pune Escorts Service(RIA) Call Girls Bhosari ( 7001035870 ) HI-Fi Pune Escorts Service
(RIA) Call Girls Bhosari ( 7001035870 ) HI-Fi Pune Escorts Serviceranjana rawat
 

Recently uploaded (20)

Architect Hassan Khalil Portfolio for 2024
Architect Hassan Khalil Portfolio for 2024Architect Hassan Khalil Portfolio for 2024
Architect Hassan Khalil Portfolio for 2024
 
High Profile Call Girls Nagpur Isha Call 7001035870 Meet With Nagpur Escorts
High Profile Call Girls Nagpur Isha Call 7001035870 Meet With Nagpur EscortsHigh Profile Call Girls Nagpur Isha Call 7001035870 Meet With Nagpur Escorts
High Profile Call Girls Nagpur Isha Call 7001035870 Meet With Nagpur Escorts
 
Call for Papers - African Journal of Biological Sciences, E-ISSN: 2663-2187, ...
Call for Papers - African Journal of Biological Sciences, E-ISSN: 2663-2187, ...Call for Papers - African Journal of Biological Sciences, E-ISSN: 2663-2187, ...
Call for Papers - African Journal of Biological Sciences, E-ISSN: 2663-2187, ...
 
GDSC ASEB Gen AI study jams presentation
GDSC ASEB Gen AI study jams presentationGDSC ASEB Gen AI study jams presentation
GDSC ASEB Gen AI study jams presentation
 
MANUFACTURING PROCESS-II UNIT-5 NC MACHINE TOOLS
MANUFACTURING PROCESS-II UNIT-5 NC MACHINE TOOLSMANUFACTURING PROCESS-II UNIT-5 NC MACHINE TOOLS
MANUFACTURING PROCESS-II UNIT-5 NC MACHINE TOOLS
 
The Most Attractive Pune Call Girls Budhwar Peth 8250192130 Will You Miss Thi...
The Most Attractive Pune Call Girls Budhwar Peth 8250192130 Will You Miss Thi...The Most Attractive Pune Call Girls Budhwar Peth 8250192130 Will You Miss Thi...
The Most Attractive Pune Call Girls Budhwar Peth 8250192130 Will You Miss Thi...
 
DJARUM4D - SLOT GACOR ONLINE | SLOT DEMO ONLINE
DJARUM4D - SLOT GACOR ONLINE | SLOT DEMO ONLINEDJARUM4D - SLOT GACOR ONLINE | SLOT DEMO ONLINE
DJARUM4D - SLOT GACOR ONLINE | SLOT DEMO ONLINE
 
Introduction to IEEE STANDARDS and its different types.pptx
Introduction to IEEE STANDARDS and its different types.pptxIntroduction to IEEE STANDARDS and its different types.pptx
Introduction to IEEE STANDARDS and its different types.pptx
 
(MEERA) Dapodi Call Girls Just Call 7001035870 [ Cash on Delivery ] Pune Escorts
(MEERA) Dapodi Call Girls Just Call 7001035870 [ Cash on Delivery ] Pune Escorts(MEERA) Dapodi Call Girls Just Call 7001035870 [ Cash on Delivery ] Pune Escorts
(MEERA) Dapodi Call Girls Just Call 7001035870 [ Cash on Delivery ] Pune Escorts
 
APPLICATIONS-AC/DC DRIVES-OPERATING CHARACTERISTICS
APPLICATIONS-AC/DC DRIVES-OPERATING CHARACTERISTICSAPPLICATIONS-AC/DC DRIVES-OPERATING CHARACTERISTICS
APPLICATIONS-AC/DC DRIVES-OPERATING CHARACTERISTICS
 
Decoding Kotlin - Your guide to solving the mysterious in Kotlin.pptx
Decoding Kotlin - Your guide to solving the mysterious in Kotlin.pptxDecoding Kotlin - Your guide to solving the mysterious in Kotlin.pptx
Decoding Kotlin - Your guide to solving the mysterious in Kotlin.pptx
 
(ANVI) Koregaon Park Call Girls Just Call 7001035870 [ Cash on Delivery ] Pun...
(ANVI) Koregaon Park Call Girls Just Call 7001035870 [ Cash on Delivery ] Pun...(ANVI) Koregaon Park Call Girls Just Call 7001035870 [ Cash on Delivery ] Pun...
(ANVI) Koregaon Park Call Girls Just Call 7001035870 [ Cash on Delivery ] Pun...
 
VIP Call Girls Service Hitech City Hyderabad Call +91-8250192130
VIP Call Girls Service Hitech City Hyderabad Call +91-8250192130VIP Call Girls Service Hitech City Hyderabad Call +91-8250192130
VIP Call Girls Service Hitech City Hyderabad Call +91-8250192130
 
Exploring_Network_Security_with_JA3_by_Rakesh Seal.pptx
Exploring_Network_Security_with_JA3_by_Rakesh Seal.pptxExploring_Network_Security_with_JA3_by_Rakesh Seal.pptx
Exploring_Network_Security_with_JA3_by_Rakesh Seal.pptx
 
Extrusion Processes and Their Limitations
Extrusion Processes and Their LimitationsExtrusion Processes and Their Limitations
Extrusion Processes and Their Limitations
 
SPICE PARK APR2024 ( 6,793 SPICE Models )
SPICE PARK APR2024 ( 6,793 SPICE Models )SPICE PARK APR2024 ( 6,793 SPICE Models )
SPICE PARK APR2024 ( 6,793 SPICE Models )
 
Analog to Digital and Digital to Analog Converter
Analog to Digital and Digital to Analog ConverterAnalog to Digital and Digital to Analog Converter
Analog to Digital and Digital to Analog Converter
 
What are the advantages and disadvantages of membrane structures.pptx
What are the advantages and disadvantages of membrane structures.pptxWhat are the advantages and disadvantages of membrane structures.pptx
What are the advantages and disadvantages of membrane structures.pptx
 
Porous Ceramics seminar and technical writing
Porous Ceramics seminar and technical writingPorous Ceramics seminar and technical writing
Porous Ceramics seminar and technical writing
 
(RIA) Call Girls Bhosari ( 7001035870 ) HI-Fi Pune Escorts Service
(RIA) Call Girls Bhosari ( 7001035870 ) HI-Fi Pune Escorts Service(RIA) Call Girls Bhosari ( 7001035870 ) HI-Fi Pune Escorts Service
(RIA) Call Girls Bhosari ( 7001035870 ) HI-Fi Pune Escorts Service
 

Comparative assessment of NH3 production and utilization in Ontario

  • 1. Mitacs Accelerate Project Final Report Comparative assessment of NH3 production and utilization in agriculture, energy and utilities, and transportation systems for Ontario Period: January-June 2016 Submission Date: June 17, 2016 Supervisor: Prof. Dr. Ibrahim Dincer Intern: Yusuf Bicer Partner Organization: Hydrofuel Inc.
  • 2. 1 TABLE OF CONTENTS Table of Contents.............................................................................................................................1 Acknowledgment.............................................................................................................................2 Nomenclature...................................................................................................................................3 Summary..........................................................................................................................................4 CHAPTER 1. COMPARATIVE ASSESSMENT OF ALTERNATIVE FUELED VEHICLES INCLUDING AMMONIA 1. Introduction..................................................................................................................................5 2. Methodology................................................................................................................................6 2.1 Uncertainty analyses..................................................................................................................7 3. Systems Description.....................................................................................................................7 3.1 Passenger car manufacturing .....................................................................................................7 3.2 Maintenance...............................................................................................................................8 3.3 Disposal of the vehicles .............................................................................................................8 3.4 Operation of vehicles.................................................................................................................9 4. Results and Discussion ..............................................................................................................11 4.1 Comparison of Various Fuels Production................................................................................24 4.2 Ammonia vs. Natural Gas........................................................................................................27 5. Conclusions................................................................................................................................28 CHAPTER 2. AMMONIA FROM HYDROCARBON DISSOCIATION 1. Thermo-Catalytic Decomposition of Liquid Hydrocarbons....................................................30 2. Comparison of Furnace and Plasma Processes........................................................................34 3. Microwave Usage for Hydrocarbons Applications..................................................................44 4. Microwaves and Radio Frequency Applications in Oil Sands ................................................46 5. Microwave-Assisted Oil Sands Separation..............................................................................46 6. Microwave-Assisted Oil Sands/Oil Shale Extraction..............................................................47 7. In-Situ Recovery of Oil by Electromagnetic Heating..............................................................47 8. Conclusions..............................................................................................................................52 CHAPTER 3. CASE STUDIES 1. Experimental Investigation of Ammonia Synthesis via Molten Salt Electrolyte Based Electrochemical Route.............................................................................................................54 2. Ammonia Production Using Water Electrolysis from Low-Cost Hydropower and Wind Energy ..................................................................................................................................................59 3. Ammonia Production From Steam Methane Reforming (SMR) with CO2 Capture and Sequestration............................................................................................................................62 4. Cost Analyses Results..............................................................................................................64 5. Environmental Impact Assessment Results.............................................................................74 6. Efficiency and Sustainability Assessment Results ..................................................................78 7. Conclusions..............................................................................................................................80 References......................................................................................................................................81
  • 3. 2 ACKNOWLEDGEMENT The principal investigator and intern acknowledge the financial support provided by the Mitacs and Hydrofuel Inc.
  • 4. 3 Nomenclature ATR Auto-thermal Reforming AP Acidification Potential BTX Benzene-toluenexylene-ethylbenzene CCS Carbon Capture Storage CF Carbon Filaments CML Center of Environmental Science of Leiden University CNG Compressed Natural Gas CV Coefficient of Variance CNT Carbon Nanotubes DBD Dielectric Barrier Discharge EV Electric Vehicle FCC Federal Communications Commission GHG Greenhouse Gas GREET Greenhouse Gases, Regulated Emissions, and Energy Use in Transportation GTA Greater Toronto Area HEV Hybrid Electric Vehicle HF High Frequency HRF Heavy Residual Fractions HRSG Heat Recovery Steam Generator ICE Internal Combustion Engine ISO International Organization for Standards LCA Life Cycle Assessment LHV Lower Heating Value LPG Liquefied Petroleum Gas MSWI Municipal Waste Incineration Plant ODP Ozone Layer Depletion PEC Photoelectrochemical POX Partial Oxidation PSA Pressure Swing Absorption PTW Pump to Wheel RCV Refuse Collection Vehicles RF Radio Frequency SAF Super Abrasion Furnace SD Standard Deviation SI Sustainability Index SMR Steam Methane Reforming TCD Thermo-catalytic Decomposition UCG Underground Coal Gasification UCTE Union for the Co‐ordination of Transmission of Electricity UOP Universal Oil Products WGS Water Gas Shift WTP Wheel to Pump WTW Well to Wheel
  • 5. 4 SUMMARY In this first section of the final report, a comparative life cycle assessment of internal combustion engine (ICE) based vehicles fueled by various fuels, ranging from hydrogen to gasoline, is conducted in addition to electric and hybrid electric vehicles. Various types of vehicles are considered, such as ICE vehicles using gasoline, diesel, LPG, methanol, CNG, hydrogen and ammonia; hybrid electric vehicles using 50% gasoline and 50% electricity; and electric only vehicles for comprehensive comparison and environmental impact assessment. The processes are analyzed from raw material extraction to vehicle disposal using life cycle assessment methodology. In order to reflect the sustainability of the vehicles, seven different environmental impact categories are considered: abiotic depletion, acidification, eutrophication, global warming, human toxicity, ozone layer depletion and terrestrial ecotoxicity. The energy resources are chosen mainly conventional and currently utilized options to indicate the actual performances of the vehicles. The results show that electric and hybrid electric vehicles result in higher human toxicity, terrestrial ecotoxicity and acidification values because of manufacturing and maintenance phases. In contrast, hydrogen and ammonia vehicles yield the most environmentally benign options. In the second section of this report, production of ammonia using conventional hydrocarbons is investigated by implying current technologies and developments. Hydrogen can be produced by dissociation of hydrocarbons which can be then converted to ammonia using a nitrogen supply. Decomposition of heavy fractions can bring some challenges because of various metal and sulfur contents, however, purification is possible and applicable. There are multiple pathways for decomposition namely; thermal, non-thermal, plasma, non-plasma techniques. An alternative method of hydrogen and ammonia production from hydrocarbons is their thermal decomposition which is accompanied by the formation of carbon deposits. Methane can be thermally or thermocatalytically decomposed (TCD) into carbon and hydrogen without CO or CO2 production. There are some research papers and patents in the literature regarding the application of microwave energy for hydrocarbons. They have shown that bitumen, which is the end product from oil sand, can be decomposed using microwave energy. Many of the inorganic particles in processed oil sands hold a charge, and could be influenced by electromagnetic radiation. They are excited at a different rate than the water and bitumen when irradiated, creating a temperature gradient between the different components of the oil sands. In the third section, detailed cost and feasibility analyses of various key scenarios for production, storage and transportation of ammonia in Ontario, Newfoundland and Labrador, and Alberta are performed. Renewable resources based ammonia is quite attractive supplying similar costs in some cases compared to conventional steam methane reforming route. The high hydroelectric and wind energy source potential of Newfoundland and Labrador make the energy storage attractive using ammonia. Ontario, with decreasing electricity prices, has potentials for hydropower especially in Northwestern region for on-site ammonia production. The hydrocarbon decomposition option is also considered for Alberta province and it is observed that the cost of ammonia can be lower than conventional steam methane reforming. Storage and transportation of ammonia brings additional costs after production which is a significant disadvantage for long distance transportation. The results imply that using appropriate renewable resources and cleaner hydrocarbon utilization paths, ammonia production can be cost-effective and environmentally friendly.
  • 6. 5 CHAPTER 1. COMPARATIVE ASSESSMENT OF ALTERNATIVE FUELED VEHICLES INCLUDING AMMONIA 1. Introduction The transportation sector is one of the fundamental sectors contributing the GHG emissions worldwide. In a current report by International Energy Agency (IEA), it can be seen that the transportation sector consumed 61.2% of the world's oil, subsidizing 28% of the total final energy supply [1] and 23% of the world's CO2 emissions [2]. Because of these reasons, a further investigation for sustainable transport systems is considered to diminish the utilization of fossil fuels, by implementing alternative fuels such as biofuels, electricity and ammonia. Globally, generation of electricity and heat relies greatly on coal which is in fact the most carbon intensive fossil fuel. The usage of fossil fuel based electricity decreases the attractiveness of electric (EV) and hybrid electric (HEV) vehicles. Henceforth, noteworthy attention should be paid to the power generation technologies and their CO2 intensity, used to supply electricity to EVs or HEVs. As an alternative energy carrier and transportation fuel, ammonia (NH3), is a deviation of hydrogen fuel. It is a molecule which composes of three atoms of hydrogen and one atom of nitrogen. Note that the physical characteristics of ammonia are similar to propane. The capability to convert a liquid at adequate pressure permits ammonia to store more hydrogen per unit volume than compressed hydrogen/cryogenic liquid hydrogen. Besides having a significant advantages in storing and transporting hydrogen, ammonia may also be burned directly in ICE. Compared to gasoline vehicles, ammonia-fueled vehicles do not produce direct CO2 emission during operation. . Furthermore, ammonia can be produced at locations where oil and natural gas extraction wells are located. In this way, generated CO2 can be reinjected into the ground for sequestration. Ammonia can then be easily transferred through pipelines, railway cars, and ships by delivering to consumption area where it may be utilized as a source of hydrogen, chemical substance, fertilizer for agriculture, fuel for transportation, power generation sector, and working fluid or refrigerant. Ammonia as a hydrogen carrier seems to be more attractive than methane in numerous features such as storing more hydrogen energy per volumetric tank, having three times less energy cost, having fewer danger because of non-flammability and being non-explosive in spite of its toxicity. One of the key factors in decision of alternative fueled vehicles is to conduct life cycle assessment from cradle to grave. In this progress report, a comprehensive environmental impact analyses of fuel and vehicle cycle of various fueled passenger cars are investigated using life cycle assessment tool. The environmental impact categories taken into account in this study are human toxicity, global warming, acidification potential, eutrophication, depletion of abiotic resources, stratospheric ozone depletion and terrestrial ecotoxicity. The considered vehicle options for analyses and assessments are listed as follows:  Gasoline fueled ICE vehicle  Diesel fueled ICE vehicle  Methanol (90%) & gasoline (10%) fueled ICE vehicle  Electric vehicle (EV) using lithium ion battery  Hybrid electric vehicle (HEV) using lithium ion battery and ICE  Ammonia fueled ICE  Hydrogen fueled ICE  Liquefied petroleum gas (LPG) fueled vehicle  Compressed natural gas (CNG) fueled vehicle.
  • 7. 6 2. Methodology A characteristic life cycle of a vehicle technology can be categorized into two main steps, namely fuel cycle and vehicle cycle. In the fuel cycle, the processes beginning from the feedstock production to fuel utilization in the vehicle are considered. At this phase of CNG production, the related input of energy to extract natural gas and the emissions linked to the extraction are taken into account. Similarly, the extraction of crude petroleum is accounted for diesel. Transformation of crude oil feedstock into useful fuels is a too energy intensive stage of the fuel cycle, producing substantial amounts of GHG. Nevertheless, purification of natural gas results in considerably fewer energy usage and GHG. The fuel needs to be transported to be available for vehicle usage. Hence, emissions and energy usages associated with fueling trucks/pipelines are thus accounted for in the fuel delivery step [3]. The boundaries of the current analyses are illustrated in Fig. 1 including fuel and vehicle cycles. A noteworthy part of any life cycle analysis involves gathering of reliable data. The excellence of data has a deep influence on the quality of the results predicted or estimated by an LCA tool. National Laboratory has developed a full life cycle model called GREET (Greenhouse gases, Regulated Emissions, and Energy use in Transportation), sponsored by the U.S. Department of Energy, Office of Energy Efficiency and Renewable Energy, which allows to evaluate various vehicle and fuel combinations on a full fuel cycle or vehicle cycle basis. Raw material Energy production Production/assembly/ infrastructure and auxiliaries Transport services Vehicle ManufacturingVehicle OperationVehicle Disposal Vehicle Maintenance Energy production Energy consumptionEnergy transmission Energy production Transport services Infrastructure Fig.1. Boundaries of conducted LCA analyses including fuel/vehicle cycle. It is a strong software with a substantial amount of alternative vehicles. It takes into account the well to pump (WTP) and well to wheel (WTW) processes. WTW phases for each fuel starts with the extraction of the primary energy and ends with the consumption in vehicles. WTP consists of the feedstock and fuel phases, counting fuel feedstock extraction, transmission, distribution and storage. Pump to wheel (PTW) represents the energy use and emissions during vehicle operation. The functional unit is the distance travelled by the vehicle. The results of the primary energy demand and the GHG emissions for each vehicle type are expressed as MJ/km and g CO2 eq/km respectively [4]. In this study, GREET 2015 software is utilized to simulate the life cycle GHG emissions for the selected vehicles only for the operation process. After the required operation data is obtained from GREET software, they are used in SimaPro LCA tool for complete LCA analyses. The scope of the analyses represent a complete LCA since they include the well to wheel (WTW) stages as well as the equipment life cycle. The equipment life cycle includes production, manufacturing, maintenance and end-of-life of vehicle infrastructure. GREET software can calculate energy use with high accuracy. In this study, the vehicle operation emissions belonging
  • 8. 7 to different types of vehicles and transportation fuels are based on GREET 2015 calculations [5]. A part of GREET model characterizes the life cycle of vehicles, including production, maintenance, operation and disposal [6]. For this study, we have utilized only the operation parameters of all selected vehicles. Besides, electric and hybrid electric vehicle data are utilized from production until disposal and then adapted in SimaPro LCA software. The LCA database ecoinvent, v2.2 was used as source of background LCI data. Life cycle impact assessment (LCIA), quantification of life-cycle environmental weights and potential impacts was carried out using the LCA software SimaPro [7]. 2.1 Uncertainty analyses In the absence of an uncertainty analysis in LCA, the assessment results is questionable and non- satisfactory for interpretation phase. In order to capture the characteristic variability of data in the process or production systems, Monte Carlo analysis can be used embedded in SimaPro software. This tool simulates a probable range of outcomes given a set of variable conditions and can be applied within life cycle inventory framework to capture parameter variability. Hence, Monte Carlo is a method engaged to quantify variability and uncertainty using probability distributions. In quantifying the effect of the uncertainty in diverse data inputs on your LCA results, it shows whether the inventoried data is of appropriate quality and the whether the uncertainty in LCA results is tolerable. 3. Systems Description On average, lifetime performance of a passenger car is assumed to be 239,000 person km. Generally, the average utilization factor is expected to be 1.59-1.6 passengers per car. Henceforth, the lifetime of the selected vehicles is approximately 150,000 km. Here, the assessment comprises the following life cycle phases, as illustrated in Fig. 1:  manufacturing of the vehicle,  operation of the vehicle,  maintenance of the vehicle,  disposal of the vehicle. 3.1 Passenger car manufacturing The inventory contains processes of energy, water and material usage in passenger car manufacturing. Rail and road transport of materials is accounted for. The groundwork of plant is involved together with the issues such as land use, building, road and parking structure. The material consumption reflect a modern vehicle. The data for vehicle production are representative for manufacturing sites with an environmental management system. Thus, the resulting data may be an underestimation of environmental impacts of an average vehicle fleet. The electricity comes from a mixture of UCTE (Union for the Co‐ordination of Transmission of Electricity) countries. The UCTE is the association of transmission system operators in which about 450 million people are supplied electricity. In the electricity usage process, electricity production in UCTE, the transmission network and direct SF6-emissions to air are included. Electricity losses during medium-voltage transmission and transformation from high- voltage are also accounted for. The conversion of high-medium voltage as well as the transmission of electricity at medium voltage are taken into account. Besides, the required high temperature is assumed to be from methane burned in industrial furnace higher than 100kW which in turn
  • 9. 8 contains fuel feed from high pressure gas network, infrastructure (boiler), emissions, and required electricity of operation. In an electric vehicle, motion is attained from an electric motor and whole energy used for traction is kept in a battery system. The car can travel if sufficient energy is available in the battery. When the battery energy is consumed, the battery needs recharging by electricity grid or exchanging. The operation of EV varies from the conventional vehicles in some characteristics as the first difference is the energy source for operation where electricity is utilized despite of petrol or diesel. Henceforth, there are no tail-pipe emissions. It is therefore assumed that emissions are restricted to tire and brake wear and abrasion from the surface of road. Conceptually, a HEV is very parallel to EV with the exception that it involves a fuel tank and an ICE. Whenever the battery energy is consumed, the ICE can be used to recharge the battery or for traction power. In the current study, HEV is assumed to be 50% electric and 50% gasoline. For electric vehicles, the required amount of steel is lower compared to conventional cars since there is no ICE in the car. However, for EVs and HEVs, production of electric motor and lithium ion batteries are included. The battery is the on board energy storage system of the car. It contains an array of connected cells, the packaging, and the battery management system. If a car is intended to have a range of 100 km with a regular consumption of about 0.2 kWh per km, a minimum of 20 kWh of energy needs to be stored on-board. When energy density of 0.1 kWh/kg is assumed for the battery, the total battery weight would be about 250 kg. Currently, commercially available car batteries range between 100 kg and 400 kg, depending on automobile size and preferred range [8]. The average masses of electric motor for and lithium ion battery are assumed to be 104 kg and 312 kg, respectively for this study [9]. The inventory data for battery production and disposal is utilized from GREET model and Ref. [10]. 3.2 Maintenance The inventory of maintenance of vehicles contains resources used for alteration parts and energy consumption of garages. Rail and road transportation of supplies is accounted for. For EVs, during the lifetime of the car, one battery change is assumed. Henceforth, lithium ion battery replacement and disposal processes are also taken into account in the maintenance phase. 3.3 Disposal of the vehicles The inventory of vehicle disposal contains disposal processes for bulk materials. For the disposal of tires, a cut off allocation is applied. In addition, the transportation of tires to the cement works is taken into account. For the disposal of steel, aluminum, copper and tires, a cut off allocation is applied. Waste specific water together with air emissions from incineration and supplementary supply depletion for flue gas scrubbing are accounted for. Short term releases to river water and long term emissions to ground water from slag section and remaining material landfill are considered with process energy loads for municipal waste incineration plant (MSWI). The following processes are applied for the disposal of a vehicle scenario:  Disposal of plastics in mixture with 15.3% water to municipal incineration (65 kg) Energy production net output. The waste yields 0.01693 kg of slag and 0.006594 kg of remains per kg of waste. They are landfilled. Supplementary solidifying with 0.002638 kg of cement is applied. MSWI: 3.48MJ/kg waste energy in electric form and 7.03MJ/kg waste energy in thermal form  Disposal of glass to municipal incineration (30.1 kg)
  • 10. 9 Energy production in MSWI net output: 3.67MJ/kg waste electric energy and 7.39MJ/kg waste thermal energy. The waste yields 0.01704 kg of slag and 0.01217 kg of residues per kg of waste. They are landfilled. Supplementary solidifying with 0.004869 kg of cement is applied.  Disposal of emulsion paint leftovers to HWI (100 kg) Energy production in hazardous waste incineration (HWI) plant, net output: 17.11MJ/kg electric energy and 1.27MJ/kg thermal energy. The waste yields 0.707 kg of remains per kg of waste. They are landfilled. Supplementary solidifying with 0.2828 kg of cement is applied.  Disposal of zinc in car shredder remains to MSWI (5.89 kg) One kg of this waste produces 0.6244 kg of slag and 0.6202 kg of residues. They are landfilled. Supplementary solidifying with 0.2481 kg of cement is applied. Note that lithium ion batteries are recycled for numerous purposes. The most noticeable one is the retrieval of valued materials and to follow to ecological laws. Numerous methods are present for recycling lithium ion batteries with diverse environmental consequences. Usually, battery recycling procedures can be expressed in three main categories: mechanical, pyrometallurgical and hydrometallurgical processes. Hydrometallurgical processes are evaluated to require considerably less energy compared to pyrometallurgical processes. In this study, hydrometallurgical process for disposal of batteries are selected with an average efficiency of 57.5% and energy use of 140 kWh/tonne [8]. The inventory data for the disposal of batteries are taken from Ref. [8]. For ammonia and hydrogen fueled vehicles, required amount of steel and electrical energy is a little higher than other cars because of storage tank infrastructure. 3.4 Operation of vehicles The operation process of the vehicles is one of the key sections of life cycle analyses. In this phase, fuel consumption is involved. Direct airborne emissions of gaseous materials, particulate matters and heavy metals are accounted for. Particulate emissions cover exhaust- and abrasions emissions. Hydrocarbon emissions include evaporation. Heavy metal emissions to soil and water produced by tire abrasion are accounted for. The values are based on operation of an average passenger car. The specific conditions for the selected vehicles are presented herein:  Gasoline: All processes on the refinery site excluding the emissions from combustion facilities, including waste water treatment, process emissions and direct discharges to rivers are accounted for. The inventory data also includes the distribution of petroleum product to the final consumer including all necessary transports. Transportation of product from the refinery to the end user is considered together with operation of storage tanks and petrol stations. Emissions from evaporation and treatment of effluents are accounted for. Heavy metal emissions to soil and water caused by tire abrasion are accounted for.  Diesel: Diesel is evaluated as low-Sulphur at regional storage with an estimation for the total conversion of refinery production to low-Sulphur diesel. An additional energy use (6% of energy use for diesel production in the refinery) has been estimated. The other processes are similar to gasoline. Heavy metal emissions to soil and water caused by tire abrasion are accounted for.  CNG: Natural gas with a production mix at service station is taken into account. The inventory data contains electricity necessities of a natural gas service station together with emissions from losses. The data set represents service stations with high (92%), medium (6%) and low (2%) initial pressure. VOC emissions are obtained from gas losses and contents of natural gas. Heavy metal emissions to soil and water caused by tire abrasion are accounted for.
  • 11. 10  Hydrogen: Hydrogen is produced during cracking of hydrocarbons. It includes combined data for all processes from raw material extraction until delivery at plant. The output fractions from an oil refinery are composite combinations of mainly unreactive saturated hydrocarbons. The first processing step in converting such elements into feedstock suitable for the petrochemical industries is cracking. Essentially a cracker achieves two tasks in (i) rising the complexity of the feed mixture into a smaller number of low molecular mass hydrocarbons and (ii) presenting unsaturation into the hydrocarbons to enable more reactivity. The raw hydrocarbon input from the refinery is fed to the heater unit where the temperature is increased. The forming reaction products vary based on the composition of the input, the temperature of the heater and the residence time. The cracker operator selects temperature and residence time to enhance product mix from a supplied input. Cracker feeds can be naphtha from oil refining or natural gas or a mixture of both. After exiting the heater, the hydrocarbon gas is cooled to prevent extra reactions. After that, it is sent to the separation phase where the individual hydrocarbons are separated from one another by fractional distillation. Heavy metal emissions to soil and water caused by tire abrasion are accounted for.  Ammonia: Ammonia synthesis process is Haber-Bosch which is the most common method in the world. Ammonia production requires nitrogen and hydrogen. In this study, hydrogen is assumed to be from hydrocarbon cracking. Cryogenic air separation is mostly used method for massive amount of nitrogen production. In the life cycle assessment of nitrogen production, electricity for process, cooling water, waste heat and infrastructure for air separation plant are included. Haber-Bosch process is an exothermic method that combines hydrogen and nitrogen in 3:1 ratio to produce ammonia. The reaction is facilitated by catalyst (iron-oxide based) and the optimal temperature range is 450-600°C. Heavy metal emissions to soil and water caused by tire abrasion are accounted for.  EV: Electricity consumption is included. Particulate emissions comprise exhaust and abrasions emissions. Heavy metal emissions to soil and water caused by tire abrasion are accounted for. In the electricity usage process, electricity production mix, the transmission network and direct SF6-emissions to air are included.  HEV: Hybrid car is assumed to be 50% electric and 50% gasoline with ICE. Electricity and gasoline consumptions are included. Particulate emissions comprise exhaust and abrasions emissions. Heavy metal emissions to soil and water caused by tire abrasion are accounted for.  Methanol: The selected fuel M90 consists of 90% methanol and 10% gasoline. The raw materials, processing energy, estimate on catalyst use, and emissions to air and water from process, plant infrastructure are included. The process describes the production of methanol from natural gas via steam reforming process to obtain syngas for the production of methanol. There is no CO2 use and hydrogen is assumed as burned in the furnace. Raw materials, average transportation, emissions to air from tank storage, estimation for storage infrastructure are included for the distribution part where 40% of the methanol is assumed to be transported from overseas. Heavy metal emissions to soil and water caused by tire abrasion are accounted for.  LPG: All processes on the refinery site excluding the emissions from combustion facilities, including waste water treatment, process emissions and direct discharges to rivers are considered. All flows of materials and energy due to the throughput of 1kg crude oil in the refinery is accounted for. Refinery data include desalting, distillation (vacuum and atmospheric), and hydro treating operations. Heavy metal emissions to soil and water caused by tire abrasion are accounted for. The following fuel consumption rates are considered in the analyses as tabulated in Table 1.
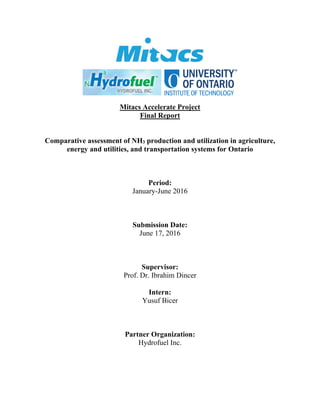
  • 12. 11 Table 1. Energy consumptions per km for the selected vehicles Fuel Fuel/Energy Consumption Fuel Cost (US$/kg or US$/kWh) Driving Cost (US$/100 km) Gasoline 0.0649108 kg/km 1.004 6.518 Diesel 0.0551536 kg/km 0.8534 4.707 M90 Methanol 0.1180535 kg/km 0.25 3.308 Gasoline 0.0060664 kg/km Hydrogen 0.0195508 kg/km 2.3 4.497 Ammonia 0.0926600 kg/km 0.28 3.102 EV 0.2167432 kWh/km 0.15 3.251 HEV Electric 0.1083716 kWh/km 0.4916 4.558 Gasoline 0.0324554 kg/km CNG 0.0603914 kg/km 0.8 4.831 LPG 0.057629687 kg/km 0.8182 4.715 4. Results and Discussion The selected vehicle types are environmentally assessed in SimaPro LCA software based on the energy consumption and GHG emissions of ICEV and EVs obtained from the wheel to wheel simulations using GREET 2015 model. The results presented here are given on per km basis. The energy use is based on units of MJ. The global warming potential is presented in kg per CO2 equivalent. The battery production and assembly requires high amounts of copper and aluminum. Henceforth, top two processes contributing issues related human toxicity are copper and aluminum production at plants. Operation of EVs causes only 1% of total human toxicity values as shown in Fig. 2. HEVs are quite similar to EVs in terms of battery manufacturing which yields second highest value.
  • 13. 12 Fig. 2. Contribution of different processes to human toxicity values of electric vehicles The depletion of ozone layer is one of the main reasons of environmental changes which is actually caused by carbon emissions to the atmosphere. Since diesel, gasoline, CNG and LPG fuels are fossil based and have huge amount of carbon substance, they have higher ozone layer depletion values. The highest is equal to 3.3×10⁻⁸ kg CFC-11 eq. per km for diesel vehicle as Fig. 3 represents. The lowest contributions are from ammonia vehicle corresponding to 7.19×10⁻⁹ kg CFC-11 eq/km. Because there is no direct CO2 emission during operation of ammonia vehicle. The eutrophication is the impact of excessive levels of macro-nutrients in the environment which is mainly caused by disposal processes. For EVs, HEVs and ammonia vehicles, the main reason of eutrophication is disposal of spoil from lignite mining in surface landfill in which it corresponds to about 66%, 49% and 47% for ammonia, EVs and HEVs respectively. There are also other spoils during disposals such as sulfidic tailings, oxygen furnace wastes, decarbonizing waste etc. which have minor impacts compared to coal mining processes. The lowest eutrophication value is observed in hydrogen vehicle with an amount of 7.29×10⁻⁵ kg PO4 eq/km. Ammonia vehicles represent lower acidification values compared to EVs and HEVs as seen in Fig. 4. Methanol is used on a limited basis to fuel internal combustion engines. Methanol is commonly produced via steam reforming of natural gas where natural gas is responsible about 90% of abiotic depletion. Therefore, the abiotic depletion values of methanol vehicle is more compared to CNG and gasoline vehicles. 0.0025 kg Sb eq/km is the maximum value for methanol vehicle while hydrogen and electric vehicles yield lower abiotic depletion. 73% 6% 5% 4% 3% 2% 1% 1% 5% Copper, primary, at refinery Aluminium, primary, liquid, at plant Anode, aluminium electrolysis Ferrochromium, high‐carbon, 68% Cr, at plant Disposal, uranium tailings, non‐radioactive emissions Copper, primary, at refinery Disposal, sulfidic tailings, off‐site Electric Vehicle ‐ Operation Remaining processes
  • 14. 13 Fig. 3. Life cycle comparison of ozone layer depletion results for various vehicles Fig. 4. Life cycle comparison of acidification results for various vehicles 0.00E+00 5.00E‐09 1.00E‐08 1.50E‐08 2.00E‐08 2.50E‐08 3.00E‐08 3.50E‐08 Ammonia Vehicle Electric Vehicle Hybrid Electric Vehicle Methanol Vehicle LPG Vehicle CNG Vehicle Gasoline Vehicle Diesel Vehicle Ozone layer depletion steady state (kg CFC‐11 eq/km) 0 0.0002 0.0004 0.0006 0.0008 0.001 0.0012 0.0014 0.0016 Ammonia Vehicle Electric Vehicle Hybrid Electric Vehicle Acidification (kg SO2 eq/km)
  • 15. 14 Fig. 5. Contribution of different processes to acidification values of ammonia vehicles The acidification values of EVs and HEVs mainly cause by SO2 emission which corresponds to 70% of overall acidification value. The source of SO2 emission is predominantly the lignite and bituminous coal at mine that is used for electricity production mix and eventually consumed in the EVs and HEVs. Fig. 6. Life cycle comparison of global warming results for various vehicles 37% 23% 20% 9% 7% 4% Ammonia Vehicle ‐ Operation ‐ Hydrocarbon Cracking Hard coal, burned in power plant Lignite, burned in power plant Hydrogen, cracking, APME, at plant Heavy fuel oil, burned in power plant Operation, transoceanic freight ship 0.15 0.16 0.17 0.18 0.19 0.2 0.21 0.22 0.23 0.24 0.25 0.26 0.27 Gasoline Vehicle Hybrid Electric Vehicle LPG Vehicle Diesel Vehicle CNG Vehicle Ammonia Vehicle Global warming 500a (kg CO2eq/km)
  • 16. 15 Afterward, ammonia vehicle has an acidification value of 0.001 kg SO2 eq/km as Fig. 4 specifies. 37% of this value is originated from ammonia vehicle operation and 9% comes from hydrogen production for ammonia synthesis as shown in Fig. 5. Hydrocarbon cracking for hydrogen production is fundamental contributor to hydrogen vehicle with 47%. Furthermore, platinum and nickel have about 21% share in which they are used for hydrogen vehicle manufacturing process. The global warming potentials of assessed vehicles are comparatively shown in Fig. 6. The lowest GHG emissions are observed in hydrogen and ammonia vehicles where it corresponds to 0.17 kg CO2 eq/km for ammonia vehicle. Ammonia driven vehicles represent a more environmentally friendly option among others. Hydrogen production process contributes 32% of abiotic depletion for ammonia vehicle as seen in Fig. 7. It is followed by lignite, hard coal and natural gas where they are consumed mainly for electricity production. Fig. 7. Abiotic depletion values (kg Sb. Eq.) of various processes for ammonia vehicles Fig. 8. Contribution of operation only process of the vehicles to abiotic depletion 0.0005, 32% 0.0003, 20%0.0003, 15% 1.32E‐04, 8% 4.26E‐04, 25% Hydrogen, cracking, APME, at plant Lignite, at mine Hard coal, at mine Natural gas, at production onshore Remaining processes 0% 10% 20% 30% 40% 50% 60% 70% 80% 90% 100% Ammonia Vehicle ‐ Operation CNG Vehicle ‐ Operation Diesel Vehicle ‐ Operation Electric Vehicle ‐ Operation Gasoline Vehicle ‐ Operation Hybrid EV ‐ Operation Hydrogen Vehicle ‐ Operation LPG Vehicle ‐ Operation Methanol Vehicle ‐ Operation Operation Manufacturing, Maintenance, Disposal
  • 17. 16 As Fig. 8 shows, the abiotic depletion is mainly caused by the operation processes of vehicles. Highest percentage is observed in methanol vehicle operation since production of methanol is highly dependent on natural gas. Manufacturing, maintenance and disposal of EVs have higher shares during life cycle primarily initiated by production and disposal of lithium ion batteries. Fig. 9. Contribution of operation only process of the vehicles to global warming potential On-board storage of hydrogen requires high resistant and strength tanks which leads to higher steel and process requirement. Henceforth, non-operation part of hydrogen vehicle constitute about 22% and 44% of overall hydrogen vehicle life cycle for abiotic depletion and global warming potential as illustrated in Figs. 8 and 9. Overall, operation of the vehicles are dominant contributors to complete life cycle. Besides manufacturing and disposal of the vehicles, operation process is the fundamental part for the vehicle life cycle. As seen in Fig. 10, ammonia driven vehicles is the second environmentally benign option after electric vehicles during the operation. 0% 10% 20% 30% 40% 50% 60% 70% 80% 90% 100% Ammonia Vehicle CNG Vehicle Diesel Vehicle Electric Vehicle Gasoline Vehicle Hybrid Electric Vehicle Hydrogen Vehicle LPG Vehicle Methanol Vehicle Operation Manufacturing, Maintenance, Disposal
  • 18. 17 Fig. 10. Life cycle comparison of global warming results for operation only of various vehicles Fig. 11 Comparison of life cycle environmental impact of ammonia fueled vehicle from hydrocarbons and solar photovoltaics Fig. 11 compares the global warming potential of ammonia driven vehicle where ammonia is either produced from solar energy or hydrocarbon cracking. Global warming potential of ammonia driven vehicle is similar for solar energy and fossil hydrocarbon based options. Hence, the utilization of ammonia in the transportation sector will certainly contribute to lessen global warming effect by using clean technologies even it is originated from fossil fuels. 0 0.05 0.1 0.15 0.2 0.25 0.3 Electric Vehicle ‐ Operation ‐ UCTE Ammonia Vehicle ‐ Operation ‐ Hydrocarbon Cracking CNG Vehicle ‐ Operation Hybrid EV ‐ Operation Diesel Vehicle ‐ Operation LPG Vehicle ‐ Operation Gasoline Vehicle ‐ Operation Methanol Vehicle ‐ Operation Global warming 500a (kg CO2 eq/km) 0 0.02 0.04 0.06 0.08 0.1 0.12 0.14 0.16 0.18 Ammonia Vehicle (Source from Hydrocarbon Cracking) Ammonia Vehicle (Source from Solar Photovoltaic) Global Warming Potential (kg CO2 eq/km)
  • 19. 18 Fig. 12. Singe score comparison of various source ammonia vehicles according to Eco-Indicator 99 The single score serves as an easy starting point to get to know the product under consideration based on the environmental impact it creates. It relates the product’s environmental impact to the overall environmental impacts in the country. A point (Pt) represents the annual environmental load (i.e. entire production/consumption activities in the economy) in the US divided up into the share of one American. It is important to understand that one point is not an individual’s very own environmental impact. It represents the individual’s annual share regardless of whether that individual participated in the economy’s environmental impacts directly or indirectly. The single score indicator, the impact factor, is expressed in millipoints (mPts). One millipoint is 1/1000 th of a point. It enables the measurement of smaller systems since most products have a lower impact than one point. If we used points for most products, the results would be in small numbers with many zeros after the decimal point. Millipoint results are more practical for most expressing the environmental impacts of most products. Fig. 12 illustrates the single score results of ammonia driven vehicles from various resources. Overall wind energy based option yields lower environmental impact, however, hydrocarbon cracking and solar PV option have similar impact factors. 0. 5. 10. 15. 20. 25. 30. Ammonia Vehicle ‐ Hydrocarbon Cracking Ammonia Vehicle ‐ Wind Ammonia Vehicle ‐ UCG Ammonia Vehicle ‐ PV mPt Carcinogens Respiratory organics Respiratory inorganics Climate change Radiation Ozone layer Ecotoxicity Acidification/ Eutrophication Land use Minerals Fossil fuels
  • 20. 19 Fig. 13. Life cycle comparison of human toxicity results for various vehicles The ammonia driven vehicles are significantly less human toxic compared to EVs and HEVs as seen in Fig. 13. Fig. 14 Abiotic depletion comparison of various source ammonia vehicles according to CML 2001 0 0.05 0.1 0.15 0.2 0.25 0.3 Ammonia Vehicle Hybrid Electric Vehicle Electric Vehicle Human toxicity 500a (kg 1,4‐DB eq/km) 0 0.001 0.002 0.003 Ammonia Vehicle ‐ Wind Ammonia Vehicle ‐ PV Ammonia Vehicle ‐ UCG Ammonia Vehicle ‐ Hydrocarbon Cracking Abiotic depletion (kg Sb eq/km)
  • 21. 20 Fig. 15 Ozone layer depletion comparison of various source ammonia vehicles according to CML 2001 When abiotic depletion values of different methods based ammonia vehicles are compared, underground coal gasification (UCG) based method yields highest impact factor followed by hydrocarbon cracking as shown in Fig. 14. On the other hand, ozone layer depletion value of ammonia vehicles where ammonia comes from PV electrolysis has the highest value. It is noted that underground coal gasification based ammonia driven vehicle yields the lowest impact as Fig. 15 shows. Fig. 16. Climate change impacts of various source ammonia vehicles according to Eco Indicator- 99 0.00E+00 4.00E‐09 8.00E‐09 1.20E‐08 1.60E‐08 2.00E‐08 Ammonia Vehicle ‐ Wind Ammonia Vehicle ‐ PV Ammonia Vehicle ‐ UCG Ammonia Vehicle ‐ Hydrocarbon Cracking Ozone layer depletion steady state (kg CFC‐11 eq/km) 0.00E+00 5.00E‐10 1.00E‐09 1.50E‐09 2.00E‐09 2.50E‐09 3.00E‐09 Carbon monoxide, fossil Dinitrogen monoxide Methane, fossil Methane, tetrafluoro‐, CFC‐14 Sulfur hexafluoride DALY (Disability adjusted lifetime years) Ammonia Vehicle ‐ Hydrocarbon Cracking Ammonia Vehicle ‐ Wind Ammonia Vehicle ‐ UCG Ammonia Vehicle ‐ PV
  • 22. 21 The emissions from various source ammonia vehicles are shown in Fig. 16. Methane emission is highest in hydrocarbon cracking option while wind energy based option has lowest dinitrogen monoxide emission. Fig. 17 Human toxicity comparison of various source ammonia vehicles according to CML 2001 The PV manufacturing process includes many toxic materials, hence ammonia vehicle from PV electrolysis option has the highest human toxicity value followed by wind electrolysis as shown in Fig. 17. Fig. 18 Global warming comparison of various source ammonia vehicles according to CML 2001 0 0.02 0.04 0.06 0.08 0.1 0.12 0.14 0.16 Ammonia Vehicle ‐ Wind Ammonia Vehicle ‐ PV Ammonia Vehicle ‐ UCG Ammonia Vehicle ‐ Hydrocarbon Cracking Human toxicity 500a (kg 1,4‐DB eq/km) 0 0.05 0.1 0.15 0.2 0.25 0.3 0.35 0.4 0.45 Ammonia Vehicle ‐ Wind Ammonia Vehicle ‐ PV Ammonia Vehicle ‐ UCG Ammonia Vehicle ‐ Hydrocarbon Cracking Global warming 500a (kg CO2 eq/km)
  • 23. 22 Overall, life cycle global warming potential of ammonia driven vehicles from various methods are shown in Fig. 18 where renewable based options have less GHG emissions. However, hydrocarbon cracking option present only 23% difference from solar PV option. Fig. 19. Uncertainty analyses results of selected categories for ammonia vehicle (ammonia from UCG) The uncertainty results are tabulated in Tables 2 and 3 for UCG and hydrocarbon options, respectively. As Figs. 19 and 20 show, the uncertainty ranges are not huge for the selected categories which implies more reliable results.. Table 2. Uncertainty results of ammonia vehicle for selected categories (ammonia from UCG) Impact category Unit Mean SD CV 2.50% 97.50% Std.err.o f mean Global warming 500a kg CO2 eq 4.08E-01 1.89E-02 4.64% 3.76E-01 4.48E- 01 0.00147 Acidification kg SO2 eq 2.65E-03 1.83E-04 6.93% 2.36E-03 3.02E- 03 0.00219 Human toxicity 500a kg 1,4- DB eq 9.84E-02 1.59E-02 16.10% 7.69E-02 1.33E- 01 0.0051 Ozone layer depletion steady state kg CFC- 11 eq 5.59E-09 1.31E-09 23.50% 3.74E-09 8.91E- 09 0.00743 Terrestrial ecotoxicity infinite kg 1,4- DB eq 8.40E-04 2.20E-04 26.10% 5.75E-04 1.38E- 03 0.00826 20 40 60 80 100 120 140 160 180 200 Acidification Global warming 500a Human toxicity 500a Terrestrial ecotoxicity infinite Uncertainty ranges (%)
  • 24. 23 The lowest uncertainty range is seen in global warming impact category and abiotic depletion for UCG and hydrocarbon option, respectively. The coefficient of variance (CV) of global warming category is 4.64% and 9.36% for UCG and hydrocarbon based methods, respectively. Fig. 20. Uncertainty analyses results of selected categories for ammonia vehicle (ammonia from hydrocarbon cracking) Table 3. Uncertainty results of ammonia vehicle for selected categories (ammonia from hydrocarbon cracking) Impact category Unit Mean SD CV 2.50% 97.50 % Std.err.of mean Abiotic depletion kg Sb eq 0.001 7 0.000 126 7.43 % 0.001 48 0.001 98 0.00235 Acidification kg SO2 eq 0.001 04 9.03E- 05 8.66 % 0.000 88 0.001 24 0.00274 Global warming 500a kg CO2 eq 0.174 0.016 3 9.36 % 0.146 0.213 0.00296 Ozone layer depletion steady state kg CFC- 11 eq 7.22E- 09 1.47E- 09 20.40 % 4.99E- 09 1.09E- 08 0.00644 Human toxicity 500a kg 1,4- DB eq 0.046 3 0.009 88 21.30 % 0.033 0.069 5 0.00675 Terrestrial ecotoxicity infinite kg 1,4- DB eq 0.000 63 0.000 16 25.30 % 0.000 409 0.001 06 0.00802 20 40 60 80 100 120 140 160 180 Abiotic depletion Acidification Global warming 500a Ozone layer depletion steady state Human toxicity 500a Terrestrial ecotoxicity infinite %
  • 25. 24 4.1 Comparison of Various Fuels Production Besides the vehicles, the production processes of various fuel s are also compared in terms of environmental impact in this section. Fig. 21. Ozone layer depletion during productions of various fuels Fig. 21 shows the comparison of ozone layer depletion values for various transportation fuels. Ammonia has lowest ozone layer depletion even if it is produced from steam methane reforming and partial oxidation of heavy oil. Production of fuel ammonia yields lower greenhouse gas emissions compared to petrol and propane production as shown in Fig. 22. Fig. 22. Greenhouse gas emissions during production of various fuels The ammonia production from various resources have lower abiotic depletion and ozone layer depletion values compared to other fuels such as propane, petrol, diesel and natural gas as shown in Figs. 23 and 24. Ammonia production from wind energy has the lowest ozone layer depletion impact. 0.00E+00 5.00E‐08 1.00E‐07 1.50E‐07 2.00E‐07 2.50E‐07 3.00E‐07 3.50E‐07 4.00E‐07 4.50E‐07 Propane/ butane, at refinery Petrol, unleaded, at refinery Diesel, low‐ sulphur, at refinery Ammonia, steam reforming, liquid, at plant Ammonia, partial oxidation, liquid, at plant Ammonia, hydrocarbon cracking, at plant Ammonia, wind energy, at plant Ozone layer depletion (kg CFC‐11 eq/kg fuel) 0 0.1 0.2 0.3 0.4 0.5 0.6 0.7 P E T R O L ,   U N L E A D E D ,   A T   R E F I N E R Y P R O P A N E / B U T A N E ,   A T   R E F I N E R Y A M M O N I A ,   F R O M   W I N D   E N E R G Y ,   A T   P L A N T   D I E S E L ,   L O W ‐ S U L P H U R ,   A T   R E F I N E R Y Gloabal warming potential (kg CO2 eq/kg fuel)
  • 26. 25 Fig. 23. Abiotic depletion values during production of various fuels Fig. 24. Ozone depletion values during production of various fuels 0 0.005 0.01 0.015 0.02 0.025 0.03 Petrol, unleaded, at refinery Propane/ butane, at refinery Diesel, low‐sulphur, at refinery Naphtha, at refinery Natural gas, liquefied, at liquefaction plant Ammonia, partial oxidation, liquid, at plant Natural gas, at production Ammonia, steam reforming, liquid, at plant Ammonia (Hydrocarbon Cracking) Ammonia (from PV electrolysis) Ammonia (from Wind electrolysis) Abiotic depletion (kg Sb eq/kg) (kg Sb eq/m3 for natural gas)  0.00E+00 1.20E‐07 2.40E‐07 3.60E‐07 4.80E‐07 6.00E‐07 Ammonia (from Wind electrolysis) Ammonia (from Hydrocarbon cracking) Ammonia (from PV electrolysis) Ammonia, steam reforming, liquid, at… Ammonia, partial oxidation, liquid, at… Naphtha, at refinery Diesel, low‐sulphur, at refinery Petrol, unleaded, at refinery Propane/ butane, at refinery Ozone layer depletion steady state (kg CFC‐11 eq/kg)
  • 27. 26 Fig. 25. Fossil fuels depletion impact values per MJ surplus for various fuels according to Eco Indicator 99 As seen in Fig. 25, fossil fuels depletion is the lowest for ammonia production according to Eco Indicator 99 LCA method. Fig. 26 Acidification/Eutrophication values of various fuels according to Eco Indicator 99 0 0.5 1 1.5 2 2.5 3 3.5 4 4.5 Ammonia (from Wind electrolysis) Ammonia (from PV electrolysis) Ammonia (from Hydrocarbon cracking) Ammonia, steam reforming, liquid, at plant Natural gas, at production Natural gas, liquefied, at liquefaction plant Ammonia, partial oxidation, liquid, at plant Naphtha, at refinery Diesel, low‐sulphur, at refinery Propane/ butane, at refinery Petrol, unleaded, at refinery Fossil fuels (MJ surplus) 0 0.005 0.01 0.015 0.02 0.025 Acidification/ Eutrophication (PDF*m2yr)
  • 28. 27 Similar to ammonia driven vehicles, production processes of ammonia from renewable resources have less acidification and eutrophication values although current steam methane reforming option yields lower than natural gas, petrol and propane as illustrated in Fig. 26. Fig. 27. Monte-Carlo simulation results of characterized LCA comparison between ammonia and CNG vehicle 4.2 Ammonia vs. Natural Gas Compared to liquefied natural gas, there are more environmentally friendly fuels such as ammonia. Ammonia does not emit direct greenhouse gas emissions when utilized in the vehicles. Furthermore, production process of ammonia yields lower global warming impact compared to LNG production. Ammonia can also be produced from natural gas and hydrocarbons such as bitumen. Henceforth, in the ideal case, if Alberta oil sands bitumen can be converted into ammonia and then transported via pipelines to the ports, it would have lower total environmental impact both in the production process and utilization process. Furthermore, ammonia is liquid at higher temperatures (-33°C) than natural gas (-162°C) which implies lower energy requirement in liquefaction process. The other option for a more environmentally friendly process can be conversion of LNG to ammonia after being produced and transported via pipelines. Natural gas can be cracked into carbon black and hydrogen using plasma dissociation technique. In this case, carbon black is also utilized as a useful output for tire, plastic etc. industry. Instead of emitting CO2 to the environment, produced carbon black is used for various sectors, and greenhouse gas emissions are lowered. Produced hydrogen can be used for ammonia synthesis and stored in the vessels for the overseas transportation. In this manner, a cleaner alternative fuel is consumed and ‐80 ‐100 ‐100 ‐40 0 ‐80 20 0 0 60 100 20 ‐100 ‐80 ‐60 ‐40 ‐20 20 40 60 80 100 Respiratory organics Climate change Ozone layer Land use Minerals Fossil fuels Ammonia Vehicle ‐ Hydrocarbon Cracking' (A) minus 'CNG Vehicle' (B), A < B A >= B
  • 29. 28 total greenhouse gas emissions are significantly decreased. Henceforth, establishing an ammonia production plant using either tidal energy (British Columbia has significant potentials) or hydropower electricity would be more cost effective and environmentally friendly. In Fig. 27, the green bars on the left represent the number of times ammonia vehicle had a lower environmental impact than CNG vehicle. For instance, it shows that in 100% of the cases the climate change impact score is lower for ammonia. In about 20% of the cases, the fossil fuels category is lower in CNG vehicle. Overall, it is noted that ammonia driven vehicle is more environmentally friendly compared to CNG vehicle. 5. Conclusions Alternative fuels for transportation sector are intensively investigated by researchers in recent years. The main criteria for a sustainable fuel is to be environmentally friendly and cost effective. In this study, a comparative environmental impact assessment of alternative and conventional fueled vehicles is conducted using cradle to grave approach via life cycle analyses under seven different environmental impact categories. Conventional vehicles considered in this study include diesel, gasoline, CNG and LPG. Alternative vehicles comprise of hydrogen, ammonia, methanol, EV and HEV. The analyses are conducted from manufacturing of passenger cars to disposal including operation of the vehicles. Monte Carlo uncertainty analyses of hydrogen vehicle results are also conducted in order to investigate the reliability of the outcomes. The results show that hydrogen vehicle is the most environmentally benign one in all environmental impact categories. Ammonia as a sustainable and clean fuel has lowest global warming potential after EVs and yield lower ozone layer depletion values than EVs. Although EVs do not emit direct CO2 during operation, the production and disposal processes of batteries bring some consequences which harm the environment in terms of acidification, eutrophication and human toxicity. Since methanol production is dependent on mainly natural gas, it has highest global warming potential. It is concluded that in order to have sustainable and clean transportation, production pathway of vehicles, batteries and alternative fuels need to be environmentally friendly.
  • 30. 29 CHAPTER 2. AMMONIA FROM HYDROCARBON DISSOCIATION In this section, dissociation of hydrocarbons including oil sand bitumen and natural gas for ammonia production in Alberta is investigated. Hydrocarbons can be used as a source of hydrogen which is required for ammonia synthesis. There are various alternative pathways for hydrogen production from hydrocarbons. In this section, a detailed literature review is presented for ammonia production via hydrocarbons. The source of hydrogen needs to be only the hydrocarbon itself, which experiences thermal decomposition: C H → nC m 2 H In the case of methane, steam conversion is twice as endothermic as thermal decomposition per unit volume of methane as shown below: CH 2H O → CO 4H ; ∆H 163 kJ CH → C 2H ; ∆H 75.6 kJ If the hydrocarbon itself is used as the thermal energy supply of the processes, the consumption of hydrocarbon feedstock per unit of the product hydrogen in both cases is comparable. The thermal dissociation of methane is a recognized process. It has long been used for the production of soot. The process is multi-step containing the contact heating (a fire-brick) up to 1500°C and methane dissociation with the yield of soot and methane-hydrogen combinations. It can be seen that the route necessitates elevated temperatures. Muradov [11] implied that the thermodynamic data show that methane dissociation can be done at reasonable temperatures. For example, at 800°C, the equilibrium concentration of hydrogen in H2-CH4 gaseous mixes matches 94% by volume. Thus, for the application of thermal dissociation of methane at relatively low temperatures, the use of catalysts is necessary. Efforts were made to utilize catalysts for the cracking of methane and light hydrocarbons. The "HYPRO" process was established for the generation of hydrogen from refinery gases and it was shown that the method is financially appropriate for the concentration of hydrogen in gas streams [11]. The method is based on the basic catalytic cracking of methane and other gaseous hydrocarbons. The catalyst is conveyed by the gas streams. The process temperature is up to 980°C and the pressure is atmospheric. The carbon placed on the catalyst was then burned to restore the catalyst and to source the heat of the process. The "HYPRO" process lets the conversion of "dry" refinery gases into a gaseous stream holding 90 vol% hydrogen and 10 vol% methane. The temperature dependency of hydrogen concentration in methane cracking gas using iron catalyst and other contacts is presented in Fig. 28. It is obvious that the iron catalyst discloses a high catalytic activity at temperatures above 600°C, and at 800°C the composition of the cracking gas approaches the equilibrium value.
  • 31. 30 Fig. 28 Temperature dependence of hydrogen concentration in gas of methane decomposition using various catalysts and contacts: (1) iron oxide; (2) alumina; (3) graphite; (4) quartz; (--) equilibrium curve (from Ref. [11]) 1. Thermo-catalytic Decomposition of Liquid Hydrocarbons Thermo-catalytic decomposition of light liquid hydrocarbons (boiling point 50-200°C, average ratio H:C = 2:1) can be carried out with the production of carbon and hydrogen: CH . → C 1.05 H In some situations such as using aromatic-containing fractions, this reaction is thermo-neutral. The volume of hydrogen achieved is slightly less than in the occasion of gaseous hydrocarbons. The process does not vary significantly in its technical features from thermo-catalytic decomposition of methane and other gaseous hydrocarbons. The technical structure of the procedure varies considerably in the circumstance of heavy residual fractions (HRFs: boiling point higher than 350°C), which are used in industry as fuel and as a feedstock for the steam-oxygen gasification process. It is known that HRFs comprise huge amounts of sulfur and metals, which in the case of direct dissociation will transfer into the coke and will reduce it useless for further use. Moreover, the process of coke separation from the catalyst will also turn into a complex type. Hence, it is practical that the process be carded out in a two-step scheme, as in the case of the "HYDROCARB" process [11]: CH . 1.2 H → CH ∶ hydrogasification CH → C 2 H : methane cracking and for the overall process CH . → C 0.8 H The quantity of hydrogen generated is less than in the case of light hydrocarbon fractions. Nevertheless, the procedure has substantial benefits, specifically, that it lets the co-production of valuable by-products: sulfur (or sulfuric acid) and metals (vanadium, nickel and others). The temperature of hydrogasification is about 750°C, pressure 1 - 10 GPa, and the hydrogenating gas contains 95 vol% hydrogen. The occurrence of sulfur mixes in HRFs, as well as in the hydrogenating gas, does not affect the product yields since the method is not catalytic. The yield of liquid products changes from 2-3 to 21-23% by mass, depending on hydrogasificator
  • 32. 31 construction, using crude oil as a feedstock. Methane and ethane are the key yields of hydrogasification of crude oil [11]. Methane decomposition reaction is moderately endothermic process. The energy requirement per mole of hydrogen produced is considerably less than that for the steam reforming process. Due to this relatively low endothermicity of the process, less than 10% of the heat of methane combustion is needed to drive the process. There have been attempts to use different catalysts to reduce the maximum temperature of thermal decomposition of methane. Metal catalysts, including Ni, Fe, Co, Pd and others, have been most commonly used for methane decomposition. However, there was a catalyst deactivation problem associated with the carbon build up on the catalyst surface. In the vast majority of related publications, carbon produced was burned off the catalyst surface in order to remove it from the reactor and regenerate the original activity of the metal catalyst. Alternatively, carbon could be gasified with steam to produce additional amount of hydrogen. In either case, the amount of CO2 produced is comparable with that of the conventional processes such as SMR or partial oxidation [12]. Besides methane, as a main component, other heavier hydrocarbons such as ethane, propane, butane and others, constitute natural gas. It was important, therefore, to investigate the behavior of these hydrocarbons in the presence of different carbon catalysts at elevated temperatures (800–900°C). Propane was selected as a representative hydrocarbon. Due to a relatively weak C–H bond in propane molecule (402.2 kJ/mol), it is somewhat easier to split propane than methane molecule (methane C–H bond energy is 440.0 kJ/mol). 26.0 kJ is required to produce one mole H2 from propane, comparing that to 37.8 kJ for methane (at standard conditions): C H → 3C 4 H ; ∆H 103.9 kJ/mol However thermal cracking of propane at high temperatures could also proceed via a thermodynamically more favorable formation of methane and ethylene C H → CH C H ; ∆H 81.3 kJ/mol As a result, pyrolysis of propane at relatively low residence times produced gaseous mixtures containing hydrogen, methane, ethylene and small amounts of ethane and propylene. Fig. 29 depicts the experimental results of propane catalytic pyrolysis over carbon black (a) and activated carbon (b) type catalysts at 800°C using a packed bed reactor. Activated carbon demonstrated high initial activity in propane decomposition reaction followed by the rapid drop in catalytic activity which is similar to methane decomposition [12]. Fig. 29 Propane pyrolysis over carbon black catalyst (a) and activated carbon catalyst (b) at 800°C (from Ref. [12])
  • 33. 32 There are several technological options for methane dissociation to hydrogen and carbon, which are summarized in Fig. 30. Fig. 30 Main routes for decomposition of methane to hydrogen and carbon (from Ref. [13]) Kværner company of Norway developed and operated on a limited commercial scale a thermal plasma process for decomposition of methane and other hydrocarbon feedstocks to hydrogen and carbon black [14]. Although technologically simple, the process is energy intensive: it was estimated that up to 1.9 kWh of electricity is consumed per one normal cubic meter of hydrogen produced [15]. Hydrogen via thermal (catalytic) dissociation of hydrocarbons represents an alternative solution. One approach that recently attracted the attention of researchers is CO2-free production of hydrogen and carbon via thermal decomposition (or pyrolysis, cracking) of methane. Methane decomposition over metal catalysts due to a very strong C–H bond, methane is one of the most stable organic molecules hence, thermal dissociation of methane would require temperatures in excess of 1000°C. Different transition metal catalysts were used to reduce the maximum temperature of methane thermal decomposition. Fig. 31 summarizes the bulk of the available literature data on the catalysts, preferred temperature range and carbon products of catalytic decomposition of methane. Here, 1:Ni-based, 2:Fe-based, 3:carbon-based, 4:summary of data related to Co, Ni, Fe, Pd, Pt, Cr, Ru, Mo, W catalysts, 5:non-catalytic decomposition, CF: carbon filaments, TC: turbostratic carbon, GC: graphitic carbon, AmC: amorphous carbon. Ni-based catalysts attracted an attention of a majority of the researchers in the field due to their high catalytic activity and the capability of producing carbon filaments (CF) or carbon nanotubes (CNT) at moderate temperatures (500–700°C). Fe- based catalysts efficiently operate at a somewhat higher temperature range and also are able to catalyze the formation of CNT [16]. The use of carbon-based catalysts offers certain advantages over metal catalysts due to their availability, durability and low cost. In contrast to metal-based catalysts, carbon catalysts are sulfur resistant and can withstand much higher temperatures. The concept is based on catalytic decomposition of methane over catalytically active carbon particles with the production of hydrogen-rich gas and carbon deposited on the surface of original carbon particles. The most important features of the process are as follows: (i) it can be catalyzed by carbon produced in the process, so that an external catalyst would not be required (except for the start-up operation), and (ii) the separation of carbon product from the carbon catalyst is not necessary. The technical
  • 34. 33 feasibility of the concept and the data on catalytic activity of a variety of carbon materials of different origin and structure, including a wide range of activated carbons (AC), carbon blacks (CB), microcrystalline graphite and nanostructured carbons toward methane decomposition reaction are reported [16]. Fig. 31 Comparison of catalysts, preferred temperature range and carbon products related to catalytic methane decomposition reaction (from Ref. [16]) On perspectives of large-scale hydrogen production via catalytic decomposition of natural gas, there are a number of ways to arrange hydrogen production by catalytic decomposition of methane. In the 1960s, Universal Oil Products (UOP) operated a pilot plant with the capacity of 118 l/min for the continuous production of hydrogen via catalytic decomposition of methane in a moving bed of Ni-catalyst particles at 815–1093°C [17]. The process, however, targeted the production of only one product which is hydrogen. Carbon deposited on the catalyst was combusted to provide the process heat causing important amounts of CO2 byproduct. Lamacz and Krzton [18] presented a paper dealing with the catalytic decomposition of hydrocarbons (methane and toluene) in the aspect of H2 production and types of obtained carbon deposits. The catalyst used in the studies was nickel supported on ceriaezirconia (Ni/CeZrO2). Hydrogen production was found to be higher for CH4 decomposition. Both types of carbon deposits (filamentous and pyrolytic) were found to be very reactive with H2O, which is due to their activation by the ceriaezirconia support. An alternative method of hydrogen production from hydrocarbons is their thermal decomposition which is accompanied by the formation of carbon deposits. Methane can be thermally or thermocatalytically decomposed (TCD) into carbon and hydrogen without CO or CO2 production. Hence, the need for water gas shift (WGS) and CO2 removal is eliminated, and obtained in TCD hydrogen can be supplied directly to the fuel cells. Takenaka et al. [19] reported that the supported Ni catalyst is one of the most effective catalysts for the methane decomposition.
  • 35. 34 The catalytic performance of Ni-based catalysts for the decomposition of hydrocarbons of C3–C8 into CO-free hydrogen and carbon fibers was investigated in order to produce CO-free hydrogen as a fuel. Ni–Pd/SiO2 catalyst showed a high activity and a long life for the decomposition of LPG (propane and n-butane) into CO-free hydrogen and carbon fibers [19]. Chai et al. [20] investigated that the size of NiO crystallites is a meaningful parameter in the formation of particular types of filamentous carbon. Methane decomposition carried out at 550°C on the large size NiO (supported on SiO2, HZMS-5 and CeO2) lead to CNFs (carbon nanofibers) while the formation of multi walled CNTs (carbon nanotubes) was observed on the small size NiO supported on Al2O3. Gac et al. [21] studied methane decomposition performing over nickel alumina catalysts modified with magnesia between the temperatures of 500-700°C. The catalysts were obtained by the co-precipitation method. Catalytic methane decomposition was studied over metal catalysts, based on Ni , Co or Fe, different supports, including SiO2, TiO2 and Al2O3, MgO or metallic foams. In spite of the intensive research of the numerous processes of hydrocarbons conversion and synthesis of carbon nanomaterials, some questions still remain open; such as the influence of the size of the crystallites, metal-support interactions, diffusion phenomena, reaction temperature or the nature of carbon deposits. It was found out that the activity of catalysts and the properties of carbon deposits were related to the catalysts composition and the reaction temperature. Carbon filaments with fishbone-like packed graphitic layers were formed at 500°C, while the multi-walled nanotubes were observed after reaction performed at 700°C. Zhang et al. [22] investigated the catalytic cracking of methane as an alternative route for the production of hydrogen from natural gas. Nickel supported on silica was found to be active for this reaction producing stoichiometric amounts of hydrogen and carbon. While commercial processes exist that utilize thermal cracking of methane at extremely high temperatures for the production of acetylene and carbon black, hydrogen production via the catalytic cracking of methane was only briefly considered in the past. Silica-supported nickel catalysts are active for this reaction at relatively low temperatures around 550°C. These catalysts maintain their activity for a sustained period of time because of their capability to accumulate large amounts of carbon on their surface in the form of long cylindrical hollow ®laments, with a nickel particle located at the front tip of each individual ®lament. Deactivation eventually occurs due to spatial limitations imposed on the ®lament growth, which lead to the loss of exposed nickel surface. 2. Comparison of Furnace and Plasma Processes If it is assumed that typical electro-thermic efficiency of modern plasma arc devices is over 80%, it can be estimated that the electric energy supply needed for the cracking operation varies between 4 and 7 kWh per kg of carbon produced or between 1 and 1.9 kWh per normal cubic meter of hydrogen produced [23]. Because of the wide range of grades of carbon black, the comparison will only concern a well-defined product, whose industrial name is super abrasion furnace black (SAF). This grade corresponds to an average structured black, used essentially as reinforcing filer to improve abrasion properties. The average commercial price is about US $1000-1400 per ton. Production temperature of this product is about 1600°C, so the theoretical energy supply, as defined above, may be estimated at 5000 kWh per ton of carbon produced. It was presented in Fig. 32 the input/output mass and energy balances for the two processes which is related to one ton of product. Hence, for a typical capacity of 100,000 tons per year with a 0.68 utilization rate, total electric power of a plasma black installation will be 83 MW [23].
  • 36. 35 Fig. 32 Input-output balance for furnace and plasma processes (from Ref. [23]) This result compared well with conclusions of a study presented in 1983 [24], as the authors, who were using a 15 kW radio frequency (RF) plasma, obtained with methane carbon yields of about 96% with a lower energy of only 2.2 kWh per kg of carbon. Plasma technology has been used since 1980 as an alternate method for generating carbon black that takes advantage of the plasma's high enthalpy property [25]. The principle of carbon black manufacture, by the "cracking" of a hydrocarbon vapor using a plasma source, was patented in France in 1980 [26], and several studies have since been dedicated to this subject. Thus in 1983, Ibberson et al. [27] used a 15-kW RF induction plasma reactor to process various hydrocarbons. Methane, n-hexane and benzene were fed to the reactor and carbon black, in high yields, of up to 98%, were obtained, and with a corresponding low energy requirement per kg of carbon produced (2.2 kWh per kg of carbon). Bolouri and Amouroux [28] described carbon (acetylene) black production by direct processing of natural gas in an argon RF plasma reactor. Overall, their results showed that, with a well-designed reactor, almost all input methane can be converted to carbon and acetylene. The carbon yield reached about 45% when the total methane conversion rate approaches 100%. The solid product obtained presented similar qualities to those of acetylene black obtained by the classical processes. Two, more recent laboratory-scale investigations of carbon black production have been conducted using a HF plasma reactor at the Plasma Technology Research Center in Canada [29, 30]. Light hydrocarbons were used as the feedstock in the process and plasma power levels of between 25 and 70 kW were used. In the first process stage, propane was fed to the system. The injection method employed was found to be the most important parameter in this plasma process. These authors found a relationship between the particular carbon black morphology and the method of feed injection. For example, radial injection produced "flat" form particles similar to those present in acetylene black produced at high frequency (HF). Axial injection produced very spherical form particles, comparable to those carbon blacks with specific surfaces in the order of 75 to 100 m2 /g. A carbon black production rate of 0.35 g/s was obtained for the radial injection. Propane decomposition rates of between 70 and 100% were observed during these experiences. In
  • 37. 36 the second described process, methane was fed to the plasma system, generating methane decomposition yields of about 100% and carbon black yields of about 55% at 60 kW. Carbon black, with particle sizes of between 20 and 80 nm and specific surfaces up to 250 m2 /g was obtained. The feed rates and the particular injection method employed were found to be the most important parameters determining the morphology of the carbon black produced. Specifically, smaller size particles, with higher specific surfaces, were found when the feed rate was increased. Impurities levels of below 100 ppm were found during these experiences. In 1990, Kvaerner started the development of the innovative Kvaerner CB&H process [30]. This process was considered primarily as a hydrogen-supply process [31]. By pyrolysis of the hydrocarbon feedstock, the process produces two valuable products: hydrogen and carbon black. The process yields almost 100% in feedstock efficiency and the impurity levels of the process products are restricted to only those impurities introduced in the feedstock. Although the Kvaerner Engineering organization represents this technology for industrial scale application [32], no evidence has been forthcoming so far to demonstrate that the process can economically produce carbon black of commercial interest [25]. Among the original potential reforming choices, plasma systems can deliver creative answers to the disadvantages in terms of reactivity, compactness and efficiency. Various ways were explored for the two last decades by means of various plasma techniques such as plasmatron, gliding arc, dielectric barrier discharge (DBD), corona, microwave, pulsed discharge and reformed hydrocarbons, such as methane, diesel and bio fuels [33]. The reforming method targeting hydrogen generation is the conversion of a hydrocarbon into a more valued product in terms of higher heating value. The difficulty is to achieve the process with the best energetic efficiency. Due to the capability to relief high energetic densities, plasmas have then been considered with interest for reforming uses. Based on their energy level, temperature and electronic density, plasma state is typically categorized as a high temperature (or thermal) plasma and a cold (or non-thermal or non-equilibrium) plasma. For example, neon lights are non-thermal plasmas and the sun is a thermal one. The hydrocarbon reforming is an oxidation reaction in which oxygen, water or carbon dioxide have the responsibility of the oxidant. Plasma is an ionized gas that can be generated by a number of ways, like combustion, flames, electrically heated furnaces, electric discharges (corona, spark, glow, arc, microwave discharge, plasma jets and radio frequency plasma), and shocks (electrically, magnetically and chemically driven) [34]. Consequently, plasma media shows a high energetic state of substance, described by a high electrical conductivity. Traditionally, first plasma assisted reformers were thermal ones, e.g. direct current (DC) plasma torch. Chemical reactions were hence improved due to the presence of very reactive species (ions, electrons) in a very hot intermediate but the energy consumption was high. Non-thermal plasmas [34] have been used for fuel gas treatment and have been accepted very promising for organic synthesis because of its non-equilibrium features; low power requirement and its capacity to make physical and chemical reactions within gases at comparatively low temperatures. The electrons in non-thermal plasma may extent temperatures of 10 000–100 000 K (1–10 eV) while the gas temperature can stay as low as room temperature. It is the high electron temperature that controls the uncommon chemistry of non-thermal plasmas. Based upon techniques of which plasma is produced, pressure used and the electrode geometry, non-thermal plasmas involve very diverse kinds containing glow discharge, corona discharge, silent discharge, DBD, microwave discharge and radio frequency discharge.
  • 38. 37 The RF discharge functions at high frequencies (several MHz) and very low pressure to attain the non-equilibrium situations. This discharge is likewise not appropriate for chemical synthesis. The microwave discharge works at very high frequencies, e.g. 2.45 GHz in the range of microwaves, with which only light electrons can track the oscillations of the electric field. Thus, this discharge is far from local thermodynamic equilibrium and may be functioned in a wide pressure range. Lately, gliding arc discharge, a mixture of high power equilibrium arc discharge and better selectivity of non-thermal plasmas was stated to be used for reforming uses [33]. An illustrative comparison of specific energy requirement and efficiencies for various research results is shown in Figs. 33, 34 and Table 4. Gliding arc discharge reactor assisted the experimental study of methane conversion. It consists of a 2.5 l reactor walled with quartz where 8 cm is inner diameter and 50 cm is the length. Two 7 mm thick, 2 cm wide and 9 cm long diverging electrodes were utilized. They were hold by a stainless steel plate situated at the top of the setup. Reactant types were preheated at temperatures in the range 573–873K before entering the test chamber. Experimental runs circumstances were atmospheric pressure, specific energy input in the range 3–12.1 MJ/kg (ratio of the input electric power on the inlet gas flow rate), and partial oxidation was considered both for the air and 50% oxygen enriched air [33]. Fig. 33 Comparative efficiencies of non-thermal plasma processes (from Ref. [33])
  • 39. 38 Fig. 34 Specific energy requirement of non-thermal plasma processes (from Ref. [33]) Table 4. Performances of some non-thermal plasma assisted reforming processes (from Ref. [33]) Ref. Reactor Fuel Fuel injected (kW) Reforming process Plasma power (W) Efficiency (%) Efficiency ratio Conversion rate (%) Power density (kWH2/L) [35] GEN 2 Diesel 10.78 Pox 270 46.67 80.9 2.6 [35] GEN 3 Methane Ethanol Methane 11 26 22.5 ATR+catal . Pox+catal. Pox 210 200 375 63.59 43.5 36.70 0.84 0.84 0.57 103.98 73.38 3.57 57 42 [36,37] Glidarc Methane 1.52 Pox 50 75.81 0.98 87 0.476 [36,37] GAT Isooctane Methane 0.02 ATR+catal. Pox 4 200 48.78 74 0.70 0.93 75 0.004 [38,39] Sliding discharge Methane 2.68 ATR 830 24.59 0.40 22.53 7.8 [38,39] Sliding discharge Methane 4.63 Pox 75 27.53 0.42 58.55 11.8 [40,41] Glidarc Gasoline 7 SR 1000 29 65.8 0.86 [40,41] Plasma torch Isooctane 5.72 ATR 1000 41.78 0.72 90.55 8 [42,43] Glidarc I Diesel 12.01 Pox 280 54.28 100.14 4.44 [42,43] Glidarc I Gasoline 95 6.23 Pox 350 49.06 95.78 2.15
  • 40. 39 Table 5. Performances of catalytic reforming systems (from Ref. [33]) Ref. Fuel Power injected (kW) Reforming process Efficiency (%) Efficiency ratio Power density (kWH2/L) Start up time Time to full power [44] Indolene 30 42.63 Pox, nickel based catalyst 78.5 0.96 16.12 [45] C7.494 H14.53 86.15 ATR, monolith catalyst 78 53.4 20s 140s [46] Octane 1.44 ATR, house catalyst 68–70 0.4 [46] Gasoline 1.56 ATR, house catalyst 62–65 0.3 5min 50min The performance values of some non-thermal plasma assisted reforming processes are shown in Table 4. At the Institute for Advanced Sustainability Studies (IASS), an alternative technology for methane decarbonisation applying liquid metal technology was proposed in collaboration with the Karlsruhe Institute of Technology (KIT) [47]. They comprised the following steps: conceptual design of a liquid metal bubble column reactor and material testing, process engineering incorporating carbon separation and hydrogen purification, and a socio-economic analysis. The results from the experimental tests showed that the liquid metal reactor design works effectively in producing hydrogen and carbon separation. Other aspects of the technology such as socio-economics, environmental impact, and scalability also appeared to be satisfactory making methane decarbonisation based on liquid metal technique a possible candidate for CO2-free hydrogen production [47]. The decarbonisation of fossil fuels, particularly, natural gas, is a promising alternative and compromises definite benefits over the use of carbon capture storage (CCS) technologies. Methane decarbonisation by pyrolysis also called as methane cracking includes the dissociation of methane (CH4) into its molecular particles: solid carbon (C) and hydrogen (H2). Its key benefit lies in the lack of CO/CO2 emissions. Conversely to CCS, it substitutes the managing of CO2 with a much lower quantity of easier-to-handle solid carbon. Hydrogen signifies a significant clean energy carrier, with an already substantial demand and capable projections for the future energy system. Moreover, carbon is hypothetically marketable as a product for both current and envisaged usages such as carbon fibres, materials and nanotechnology. The methane dissociation reaction is initiated with the formation of a free radical CH4 → CH3 * + H* that dominates the kinetics of the reaction splitting the C-H bond (dissociation energy: 434.72 kJ/mol), which necessitates high temperature levels [48]. The evaluation of the reaction thermodynamic equilibrium mole fraction with Cantera library [49] was depicted in Fig. 35. It could be seen that above 1000°C, nearly comprehensive conversion of methane into hydrogen is theoretically feasible. Performances of catalytic reforming systems are listed in Table 5. Noteworthy effort was formerly devoted to offer catalysts to the reaction to attain a feasible application below 1000°C. In particular, metallic catalysts based on Ni and Fe have attained quite motivating conversion rates at temperatures of the order of 600-700°C. Carbon based catalysts such as black carbon or activated carbon have been also proposed. Fig. 36 gives a schematic view of the application range of the main catalyst types.
  • 41. 40 Fig. 35 Hydrogen mole fractions attained during thermodynamic equilibrium of the methane cracking reaction at various temperatures and 1 bar pressure (from Ref. [47]) Fig. 36 Catalyst types used for methane cracking and their temperature range of applicability (from Ref. [47]) The practical industrial implementation in the case of catalyzed reactions is limited by the deactivation of the catalyst and its cost. The deactivation of the catalyst is a process resulting from the formation of coke on the surface of the catalyst during its operation and its control is a very important challenge. In the case of carbonaceous catalysts, carbon from the pyrolysis process decreases the active surface, and lastly abolishing its catalytic effect [47].
  • 42. 41 Fig. 37 Basic methane decarbonisation process definition (from Ref. [47]) The schematic diagram of the experimental setup conducted by Abanades et al. [47] is shown in Fig. 37. The steps followed in that study are explained shortly here.  Feed preparation: The raw natural gas can need a preparation unit to increase the methane content and to remove impurities.  Reactor: The liquid metal bubble column reactor is envisaged to be made of quartz glass and operated at temperatures above 1000°C.  Heating: The heating to deliver the energy for the reactor is based on two selections for an industrial application: a hydrogen burner or a methane burner. Moreover, the combination with solar technology is envisioned for further steps, but that will bring higher capital costs.  Carbon removal from the reactor: The carbon obtained from the experiments is characterized.  Carbon separation from the gas stream: A filter is planned to eliminate small amounts of carbon elements from the gas stream.  Hydrogen separation from the process stream: There are two core selections under consideration: pressure swing absorption (PSA), a developed method applied for CO2 sequestration, and metallic membranes. Unreacted methane after separation from the process stream will be recycled back to the reactor. The comparison of methane pyrolysis with other developed methods for hydrogen production from fossil-fuels is displayed in Table 6. From this theoretical comparison, that should be checked in a demo facility, the production of 100 Mtoe (toe = tonne of oil equivalent) of hydrogen will produce 103.8 Mtonnes of carbon with methane cracking, avoiding the production of 255.18 Mtonnes of CO2 with steam methane reforming, or 626.85 Mtonnes CO2 in comparison with coal gasification. The volume of CO2 to be sequestrated and managed in supercritical state will be 10 times larger than the volume of carbon produced for the same hydrogen energy generation, substituting the management of carbon dioxide with solid carbon, which may have additional applicability as well. The application of methane decarbonisation can be especially convenient in industrial sectors, as in the case of ammonia production, in which huge amounts of hydrogen are required. From the preliminary economic analysis, the H2 production cost that can
  • 43. 42 be expected from industrial methane cracking could be of the order of 1.5 $/kg [47]. In a previous analysis of methane decarbonisation [13], a H2 cost of around 3.0 $/kg for solar methane pyrolysis was reported. However, the higher cost was mainly due to the solar field, which represents a significant capital cost of the facility. Table 6. Comparison of hydrogen production technologies from fossil-fuels (data from Refs. [47 ,50, 51]) Process Methane steam reforming Coal gasification Methane pyrolysis Reaction Heat of reaction (kJ/mol-H2) CH4+2H2O→CO2+ 4H2 63.25 Coal+2H2O → CO2+ 2H2 89.08 CH4→ C + 2H2 37.43 Energy efficiency in transformation (%) 74 60 55 Energy efficiency with CCS (%) 54 43 55 CO2 emission (mol-CO2/mol-H2) 0.34 0.83 0.05 Carbon production (mol-C/mol-H2) 0 0 0.5 In another study by Abanades et al. [52], the following experimental setup was used for methane cracking as shown in Fig. 38. Fig. 38 Schematic diagram of the experimental setup for methane cracking (from Ref. [52])
  • 44. 43 At temperatures higher than 1350°C, the decomposition is practically complete, and the main component of the outgoing gas is H2, with almost no traces of hydrocarbon gases. A cloud of carbon powder still goes out, but a huge fraction of the produced carbon appears as solid deposits securely adhering to the wall. Elimination of the deposit by simple mechanical pushing is very difficult, at least in cold conditions. That carbon deposit can be eliminated by combustion, just by blowing air into the hot oven, so producing CO2, which is undesirable. Their experimental results showed the amount of hydrogen at the tube outlet in volume ratio percentage which is depicted for three flow rates implying three residence times of 16, 32 and 96 s in normal conditions (25°C, 1 bar) and at a temperature range between 875-1065°C as illustrated in Fig. 39. The summary of their experimental results are shown in Table 7 where they observed 100% dissociation at 1400°C. Fig. 39 Hydrogen volumetric ratio at the outlet gas as a function of the temperature and the flow rate (from Ref. [52]) Wei et al. [53] studied methane cracking over different coal chars in a fixed bed reactor. Their purpose was to study methane cracking on different coal chars with an aim to explain the changes in the catalytic activity of different coal chars for methane cracking and to speculate the mechanism of methane cracking. The chars have a profound catalytic effect on the methane cracking, with the catalytic activity varying with different types of coal chars. The catalytic activity of char in methane cracking decreases with increasing coal rank, with the Shengli lignite char being the most active and the Jincheng anthracite char being the least active. Methane conversion and hydrogen yield decrease with the time on stream as the coal char becomes deactivated and the carbon deposition from methane cracking is primarily responsible for the loss of catalytic activity of the chars with the time on stream. The methane cracking is a surface reaction controlled by the gas phase diffusion and therefore is influenced by both reaction temperature and methane concentration. The methane conversion increases with increasing temperature and decreasing methane concentration. The catalytic effect of char decreases with increasing pyrolysis temperature in the char preparation but is less affected by the pyrolysis time indicating that the catalytic activity depends not only on the porous structures but also on the chemical nature of the char surface [53].
  • 45. 44 Table 7. Summary table of the SiC tube experiments (from Ref. [52]) Experiment no. 1 2 3 4 T (°C) 1200 1300 1400 1400 Tube CH4 flow (l/min) SiC 1 SiC 1.1 SiC 1 SiC + Boron Nitrate layer 1 Ar flow (l/min) 1 0.9 1 Time (h) 3 3 3 3 Dissociation rate 10% methane in exit. Hydrocarbons presence. Unknown H2 production. 3% methane in exit. H2 presence 60- 70%. Very Low hydrocarbons presence. 0% methane in exit (complete dissociation) H2 presence 93-94% 0% methane in exit (complete dissociation) H2 presence 93-94% Carbon deposit Soft carbon black Soft dust carbon black Carbon black Hard carbon black Soft dust carbon black Carbon black Hard carbon black Soft dust carbon black Carbon black Hard carbon black 3. Microwave Usage for Hydrocarbons Applications Microwaves are electromagnetic waves with a frequency range between 300 MHz to 300 GHz, equivalent to wavelengths of 1 mm to 1 m. Further than 30 GHz, the microwave frequency range overlays with the RF range. Since the type of microwaves, they are ruled by the Federal Communications Commission (FCC). In North America, the single permitted frequencies for industrial usage are 915, 2450, 5800, and 22,000 MHz [54]. For usage in laboratory and testing applications, a 2450 MHz is preferred. Because this frequency carry suitable diffusion depth for many laboratory reaction situations. Microwaves are produced if electrons resonate at high frequencies. The electric field is formed by an internal cathode and external anode with a huge potential variance in-between. The magnetic field is forced by perpetual magnets situated typically on the bottom of the magnetron. The electrons in this atmosphere go from the cathode in an external spiraling path, finally reaching to the anode. While the electrons pass by resonance chambers, energy is released. This energy is collected by an antenna as microwaves. They are usually used for a cavity via waveguides. The essentially dissimilar technique of transporting energy from the resource to the sample is the key advantage of using microwave energy in comparison to standard thermal processing. By distributing energy to microwave-absorbing materials, problems like long heat up periods, thermal gradients, and energy lost to the system environment can often be avoided. Moreover, the penetrating ability of microwave permits volumetric heating of sections. Hence, these advantages of microwave energy create attractiveness for industrial uses as a substitute to standard thermal processing options. In lots of the situations, the usage of microwave energy creates dissimilar results in comparison with the standard thermal reactions allowing a decreased heating time or decreased reaction temperature [55]. Additionally,
  • 46. 45 the sample heating encouraged by microwave fields is firmly affected by the capability of the material to captivate microwave energy which consents samples to be selectively heated by improving the efficiency of giving energy into the system. The essential appliance of microwave heating contains agitation of polar molecules or ions which oscillate under the influence of an oscillating electric or magnetic field. In the occurrence of an oscillating field, particles attempt to position themselves to be in phase with the field. Nevertheless, the movement of the particles is limited by resisting forces, which restrict the movement of particles and make arbitrary motion, creating heat. Microwave heating for industrial processing is categorized by numerous features which lead the method basically altered from standard heating options because of physical and chemical changes in products. As the reply of several materials to microwave radiation is different, not all materials are agreeable to microwave heating. Depending on the response to microwaves, materials may be generally categorized as follows: materials that are transparent to microwaves, e.g., sulfur; materials that reflect microwaves, e.g., copper; and materials that absorb microwaves, e.g., water. So, materials that absorb microwave radiation are related to microwave chemistry. Microwave heating arises via three tools [56–58] dipolar polarization, ionic conduction, and interfacial polarization. Dipolar polarization is a procedure by which heat is produced in polar molecules. The main obligation for dipolar polarization is that the frequency range of the oscillating field need to permit suitable inter-molecule interaction. If the frequency range is too high, intermolecular forces will end the motion of a polar particle before it attempts to track the field, causing insufficient interaction. Conversely, if the frequency range is low, the polar molecule acquires adequate time to line up itself in phase with the field. Therefore, no arbitrary interaction occurs between the adjoining particles. Microwave radiation has the suitable frequency (0.3–30 GHz) to fluctuate polar particles and permit inter-molecular interaction. This oscillation rises the kinetic energy and collisions of all particles in the structure. As temperature is the degree of the mean kinetic energy of elements in a body, microwaves efficiently rise the temperature of dielectric medium. For instance, food involves commonly water, a polar particle, therefore microwave ovens are operative for heating in the kitchens. The conduction procedure produces heat via resistance to an electric current. The fluctuating electromagnetic field produces an oscillation of electrons or ions in a conductor, causing an electric current. This current aspects interior resistance, which heats the conductor. The key restriction of this technique is that it is not appropriate for substances which include high conductivity, as this type of substances reflect most of the energy falling on them. At lesser temperature levels and high frequencies, heating is realized typically by dipole rotation. As temperature rises and frequency declines, ionic conduction keeps the importance in heating. The interfacial polarization process can be deliberated as a mixture of the conduction and dipolar polarization techniques. It is significant for heating arrangements that include a conducting material detached in a non-conducting ambient. For instance, if the diffusion of metal elements in sulfur is considered, sulfur does not react to microwaves, and metals reflect supreme of the microwave energy they are faced to, but merging the two creates a microwave-absorbing material. Nevertheless, for the occurrence of this, metals need to be utilized in powder form. This is due to metal powder which is a good absorber of microwave radiation dissimilar than metal surface. It absorbs radiation and is heated by a process which is comparable to dipolar polarization. The surroundings of the metal powder actions as a solvent for polar particles and restricts motion by forces that are correspondent to inter-molecular exchanges in polar solvents. The limiting forces,