(if you want to watch the webinar recording associated to this presentation, go to: https://hubs.ly/H0g03_z0)
Businesses are collecting more data than ever. Being able to collect, collate and analyse this information is critical as organisations use this to improve efficiency and effectiveness. Yet how do you deliver meaningful outcomes? How do you separate the hype surrounding predictive analytics from the reality?
We will explore the myths and realities of digital transformation with Machine Learning:
WHAT can be delivered,
WHY you should be analysing this data, and most importantly...
WHO in your organisation already possesses many of the right skills
...and what we reveal should both surprise you and excite every data-driven professional. Learn the realities of this opportunity now.
Minitab Need to Knows Series 1 - How to Manage Data in MinitabMinitab, LLC
Do you find yourself cutting and pasting data into Minitab from Excel or other programs too often? We’d like to introduce you to a few good options you might not have known were available in Minitab. In this session, you will learn to:
*Import data from Excel, CSV files and other sources
*Structure the data how you need to work with it by stacking spreadsheets, transposing, sorting, using conditional formatting and more
*Make more data using the calculator function, patterned data and indicator variables
*Work with groups of data with stratification and deciding when to split data or use the include/exclude options during analysis
This is the first part of a webinar series introducing everything you Need to Know to start using Minitab and gain better insights when you go to interpret your results. If you want to see the recording of the live webinar go to: https://hubs.ly/H0d6VRm0
Minitab Tutorial for Beginners | What is Minitab? | Minitab Training for Stat...Invensis Learning
This presentation on "Minitab Tutorial for Beginners" will explain the fundamentals of Minitab. It also explains the need of using Minitab and how it can be used for statistics.
Areas covered:
1. How to download Minitab?
2. Understanding the basics of statistics - Descriptive & Inferential statistics
3. Introduction to Minitab
4. Minitab data types
5. Understanding row & column statistics using Minitab
#MinitabTutorial #MinitabForStatistics #InvensisLearning
Subscribe to our channel: https://bit.ly/3dmqNQS
Click here to check upcoming webinars on Minitab: https://goo.gl/M9v8oP
About Invensis Learning:
Invensis Learning is a pioneer in providing globally-recognized certification training courses for individuals and enterprises worldwide. We have trained and certified 15,000+ professionals from 50+ courses through multiple training delivery modes.
Invensis Learning provides live online certification training on Minitab Essentials: http://bit.ly/2KUp2lj
Minitab Essentials training is one of the most sought-after trainings worldwide due to its popularity to quickly analyze statistical data to identify patterns and reduce waste. Be part of this Minitab Essential course delivered by Invensis Learning to learn how to use Minitab and interpret data.
For more information please visit our website: https://www.invensislearning.com
Follow Us on:
Facebook: https://www.facebook.com/invensislearn/
LinkedIN: https://www.linkedin.com/company/inve...
Twitter: https://twitter.com/invensiselearn/
Minitab Preview Training: Introduction to t-Tests for ManufacturingMinitab, LLC
Learn how to assess whether your process is meeting its target and then prove that your project has made a real change.
Using real-life examples from the manufacturing industry, this presentation will demonstrate:
• The steps needed to run a hypothesis test
• When and how to run a 1-sample t-test using Minitab
• The assumptions required to run a 1-sample t-test
• Interpreting your results
• Graphical analysis
Download a 30-day trial of Minitab Statistical Software today: https://hubs.ly/H0pWVSv0
Companion by Minitab - Seeing the unknown identifying risk and quantifying pr...Minitab, LLC
If you want to check the recording of this webinar, go to: https://hubs.ly/H0chjcC0
Unknown risk can create considerable concern and worrying. However, known risk can be a secret weapon - empowering you to avoid wasteful spending and allocate resources more effectively. Monte Carlo simulation in Companion by Minitab can help you foresee the variety of outcomes likely to occur when you alter different variables.
You will learn how you can:
1. Ensure products meet their intended specifications by studying the process inputs and developing a (y=f(x)) equation that describes the process.
2. Take the equation further by considering the uncertainty in the inputs - which results in a more realistic view of the response.
3. Perform Monte Carlo simulation to predict process capability, and to identify the best strategy to determine optimal process settings using parameter optimization and sensitivity analysis.
Minitab - Fast-track Your Data Analysis with Basic MacrosMinitab, LLC
Do you hate redoing the same work over and over again and wish there was a simpler way? Automate your analyses with Minitab Macros. Set aside time to review this deck and we will help you get started saving hours and performing statistical analysis with minimal user input.
You will learn how to:
• Build 3 types of macros to automate a series of procedures or instantly format graphs.
• Add a button to the Minitab ribbon menu that launches your macro.
• Edit session commands to instantaneously import data and perform analyses.
If you want to see the recording of an on-demand webinar based on this presentation, you can go here: https://hubs.ly/H0bLg1F0
Minitab is a statistics package developed at the Pennsylvania State University by researchers Barbara F. Ryan, Thomas A. Ryan, Jr., and Brian L. Joiner in 1972.
It began as a light version of OMNITAB 80, a statistical analysis program by NIST.
Statistical analysis software such as Minitab automates calculations and the creation of graphs, allowing the user to focus more on the analysis of data and the interpretation of results.
It is compatible with other Minitab, LLC software.
Discover Minitab Workspace - The Ultimate Visual Toolkit to Elevate Your Work...Minitab, LLC
Searching for simple solutions to achieve the greatest impact with your work? Minitab Workspace enables you to move work forward with powerful visual tools, process maps, brainstorming diagrams and forms, all in one intuitive interface right at your fingertips. Our tools help form processes and identify opportunities ultimately making problems easier to solve.
Don't be one of them who are still not able to differentiate between Excel vs Minitab. Here in this PDF, we have provided the best every comparison between Excel vs Minitab.
Machinelearning: The next step in manufacturing performance Blackberry&Cross
Minitab, nuestro aliado desde 2004, ha dado esta presentación sobre Aprendizaje Automático y aqui les compartimos el futuro.
Haga click, no tanto "code".
Boost Your Data Expertise with the Latest Release of Minitab Statistical Soft...Minitab, LLC
The ability to derive and communicate meaningful information from your data is a critical skill, particularly now when we all must work smarter and more efficiently. You have more data available to you and your organisation than ever before, but are you tapping into it effectively using the best visualisations and analytics?
Download your free trial of Minitab Statistical Software today: https://hubs.ly/H0qsnbs0
Visualizations that make an impact - see what s new in minitab statistical s...Minitab, LLC
You rely on Minitab Statistical Software for trusted analyses and valuable insights to help you confidently make better decisions, but how do you bring those insights to life and really drive impact at your organization? The right visuals and accessibility can make all the difference.
Discover how the latest release of Minitab Statistical Software can help you enhance the impact of your work in your business by checking our presentation.
New visualizations and graphics willbe showcased in Minitab Statistical Software, that can strengthen your decisions and influence, make your insights easy-to-share, and then even easier to understand.
We'll also discuss the latest software features, statistical updates, including Classification and Regression Trees (CART®) and Validation , and how faster collaboration and new levels of productivity can be achieved with Minitab now on the cloud.
This presentation was delivered by our Minitab Expert Jenn Atlas, Global Market Development Manager, it can definitely help you enhance your impact with the power of Minitab Statistical Software by your side. A webinar on-demand provides the recording of Jenn's presentation at https://hubs.ly/H0zyGYQ0. Register free to replay the webinar.
Boost Your Data Expertise - What's New in Minitab 19.2020.1Minitab, LLC
The ability to derive and communicate meaningful information from your data is a critical skill, particularly now when we all must work smarter and more efficiently. You have more data available to you and your organization than ever before, but are you tapping into it effectively using the best visualizations and analytics?
Learn how to improve your data literacy and expertise using our latest version of Minitab Statistical Software. We’ll help you discover new and improved ways to find trusted insights and learn to communicate them better, faster and easier.
You’ll also learn how Classification and Regression Trees (CART®) will expand your predictive analytics capabilities to better enable you to proactively make decisions.
This presentation given by Think Big's senior data scientist Eliano Marques at Digital Natives conference in Berlin, Germany (November 2015), details how to go from experimentation to productionization for a predictive maintenance use case.
Golang for Data Analytics Applications is a suitable choice because of its standard official libraries which enable easy data parsing, sorting, analyzing and visualizing.
Data Analytics Role in Digital Business & Business Process ManagementBPMInstitute.org
Discover the role of data analytics in transformation projects and business process management. What are the four key areas of data analytics and what are the types of data analytics. Also explains data visuals.
Fhyzics is a Best Business Analytics training institute.
It's provides the business analytics training & Online business
analytics course.If You know more details Please visit
www.businessanalyticstraining.net
Delivered at Kristu Jayanti College, Feb 1, 2018
During IEEE International Conference on Current Trends in Advanced Computing.
Github - https://github.com/raghu-icecraft/tech-talks/tree/master/Tableau_Feb%2018
Data Strategy - Executive MBA Class, IE Business SchoolGam Dias
For today's enterprise Data is now very much a corporate asset, vital to delivering products and services efficiently and cost effectively. There are few organizations that can survive without harnessing data in some way.
Viewed as a strategic asset, data can be a source of new internal efficiencies, improved competitive advantage or a source of entirely new products that can be targeted at your existing or new customers.
This slide deck contains the highlights of a one day course on Data Strategy taught as part of the Executive MBA Program at IE Business School in Madrid.
Big Data, Big Thinking: Untapped OpportunitiesSAP Technology
In this webinar factsheet, SAP’s Rohit Nagarajan and Suni Verma from Ernst & Young explore Big Data in India, adoption patterns across the globe, and how you can embark on your own Big Data journey.
The speed, volume and complexity of decisions – as well as the impact they have on customer experience – demand automated, real-time decision making. Digital decisioning is an emerging best practice for delivering business impact from AI, machine learning, and analytics. Digital decisioning is an approach that ensures your systems act intelligently on your behalf, making precise, consistent, real-time decisions at every customer touchpoint.
Audio on our YouTube Channel: https://youtu.be/cGxPYnE5PTM
Fuel for the cognitive age: What's new in IBM predictive analytics IBM SPSS Software
IBM recently launched an updated version of its predictive analytics platform. Explore the latest features, including R, Python and Spark integration and more powerful decision optimization.
These slides - based on the webinar featuring Ingo Mierswa, CTO at RapidMiner, John Myers, managing research director at leading IT analyst firm Enterprise Management Associates (EMA), and Lyndsay Wise, research director at EMA - provide an overview of how to close the loop between predictive insights and action using big data analytics.
It’s Not About Big Data – It’s About Big Insights - SAP Webinar - 20 Aug 201...Edgar Alejandro Villegas
Presentation slides of:
It’s Not About Big Data – It’s About Big Insights - SAP Webinar - 20 Aug 2013 - PDF
Scott Mackenzie - Sr. Director, Platform & Analytics CoE
Michael Golzc - CIO for SAP Americas
Ken Demma - VP, Insight Driven Marketing
20 Aug 2013 - Webcast - http://goo.gl/T74WAL
Predictive analytics are increasingly a must-have competitive tool. A well-defined workflow and effective decision modeling approach ensures that the right predictive analytic models get built and deployed.
Big Data Developer Career Path: Job & Interview PreparationIntellipaat
Youtube link : https://www.youtube.com/watch?v=iggl879a0s8
Intellipaat Big Data Hadoop Training: https://intellipaat.com/big-data-hadoop-training/
Read complete Big Data Hadoop tutorial here: https://intellipaat.com/blog/tutorial/hadoop-tutorial/
Digital transformation - Ready or (Probably) NotEverest Group
Digital transformation is an industry agnostic top priority for virtually every organization … but how many are actually ready to transform? Very few, as it turns out – Everest Group research indicates that only about 10% of enterprise IT organizations are ready to reinvent their enterprise through digital technology.
Meanwhile, readiness remains to be the key predictor of digital transformation success and it depends on a variety of prerequisite investments and conditions.
In this deck, we highlight the prerequisites for readiness. This is nothing less than a must-view for any org looking to do more than survive as industries continue the rotation to digital.
To gain a current global snapshot of how organizations are using big data and analytics, cloud, mobile, and social technologies, the IBM Center for Applied Insights conducted a survey of 1,447 IT and business decision makers. The research shows that big data and analytics, cloud, mobile, and social are now mainstream, driving strategic opportunities for the enterprise. How are leading companies staying out ahead when everybody is jumping into the fray? Learn about three key Pacesetters characteristics that give them an edge.
Big Data white paper - Benefits of a Strategic Visionpanoratio
Following the massive deployment of new mobile technologies and social media, sources of data regarding organizations’ customer and staff behaviors keep increasing. However only a few companies are able to have a real knowledge of all the corresponding data.
Big Data management provides new capabilities both in term of velocity and volume of heterogeneous data processing. Those new systems impact directly the way organizations manage operational data monitoring, and are still complex to implement.
The first benefit of Panoratio is to allow organizations to handle the strategic dimension of Big Data, to serve companies’ challenges and business priorities before to implement new optimized operational monitoring systems.
To gain a current global snapshot of how organizations are using big data and analytics, cloud, mobile, and social technologies, the IBM Center for Applied Insights conducted a survey of 1,447 IT and business decision makers. The research shows that big data and analytics, cloud, mobile, and social are now mainstream, driving strategic opportunities for the enterprise. How are leading companies staying out ahead when everybody is jumping into the fray? Learn about three key characteristics that give them an edge.
Marketing Analytics Solutions from Gordian Knot Analytics v1.2Bill Taylor
Gordian Knot provides machine learning solutions that enable our clients’ marketing analytics efforts to be more effective, and deliver greater returns.
Cut the Digital Transformation Fluff: Creating Metrics That MatterVMware Tanzu
As the old adage goes, “you can’t manage what you can’t measure.” But what if the measurements are part of the problem? After all, you can move the needle on what you measure, but there may be unanticipated outcomes. When it comes to transforming how an organization delivers software, how you measure success also needs to change.
Despite a marked adoption of agile development practices in the last five years, Forrester Research found that developers haven’t made much progress at delivering software faster. What’s the disconnect? Forrester has found a number of interrelated factors behind organizations that outperform in software delivery. One of them is metrics.
Join this webinar with special guests Jeffrey Hammond, Forrester Research Analyst, and Patrick Feeney, Senior Director of IT Digital Products at Healthcare Services Corporation (HCSC), to learn:
● The types of metrics high-performance software teams are using
● Which metrics are counterproductive to improving software delivery
● How HCSC has used metrics to manage software delivery change
● Which roles should be using which metrics and when
Speakers:
Jeffrey Hammond, Vice President and Principal Analyst, Forrester Research
Patrick Feeney, Senior Director, IT Digital Products, Healthcare Services Corporation
Similar to Minitab webinar from unicorns to racehorses - presentation slides (20)
L'art de la visualisation pour une meilleure compréhension des donnéesMinitab, LLC
On dit que voir c'est croire. Les visualisations ont le pouvoir de persuader, de communiquer vos découvertes et de montrer vos réalisations. Elles jouent un rôle essentiel dans la transformation des données, leur analyse et leur exploitation mais créer la bonne visualisation peut demander beaucoup de temps et d'énergie, jusqu'à présent. Il existe une multitude de scénarios ou de problématiques dans lesquels il est possible d'utiliser une visualisation pour mieux comprendre et identifier le phénomène observé. Une visualisation adaptée facilitera la lecture des données et l'interprétation des résultats s'en retrouvera simplifiée.
Les solutions Minitab proposent un large éventail de visualisations qui vous accompagnera dans vos prises de décisions quel que soit votre métier (développement, qualité, méthodes, marketing, RH, finance, etc.). Découvrez au cours de ce webinaire comment l'art de la visualisation permet d'ajouter de la valeur à vos métiers et de contribuer au succès de votre organisation.
Pilotez le développement de vos produits et de vos procédés avec Minitab et M...Minitab, LLC
L'industrie automobile est en pleine transformation et doit s'adapter à de nouveaux enjeux dans l'économie mondiale.
La course au développement technologique, les régulations gouvernementales, la croissance du marché asiatique et des pays émergents, la mise sur le marché de véhicules électriques et autonomes et enfin les attentes croissantes et sophistiquées des clients et leur conscience environnementale font que l'industrie se trouve à un point tournant.
Dans ce contexte, tous les acteurs de l'industrie : constructeurs, fournisseurs, équipementiers sont concernés et peuvent se demander comment adapter le développement de leurs produits et de leurs procédés pour continuer de croître et d'évoluer ?
Que vous soyez novice dans le développement de produits et de procédés ou que vous ayez déjà l'expérience, ce webinaire vous présentera la complémentarité des solutions Minitab Statistical Software et Minitab Workspace pour améliorer le développement de vos produits et de vos procédés.
Au cours de ce webinaire, notre expert Sami Chaabi, Solutions Architect Minitab, vous présentera également quelques outils fondamentaux disponibles dans Minitab Workspace et Minitab Statistical Software pour développer vos produits et procédés, que vous exerciez dans le secteur automobile ou non.
A l'issue de ce webinaire, vous connaîtrez les avantages de nos solutions pour tirer de la valeur de vos procédés et ainsi adapter vos stratégies de développement face aux nouveaux enjeux de votre industrie. (durée 60 minutes).
Ce webinaire ne comprend pas de démonstration de logiciels, c'est une présentation des enjeux et des moyens envisageables.
Introducing Graph Builder: Visualizations Built to Move You ForwardMinitab, LLC
Meet Graph Builder, our new tool to instantly visualize, create, and explore your insights in the latest Minitab Statistical Software.
With its interactive and easy-to-browse gallery, Graph Builder lets you seamlessly switch from one graph to the next using the same data and without re-running your analysis, so you can focus on choosing the right visual for your needs.
Ready to see Graph Builder in action?
Watch our showcase of Graph Builder's capabilities here: https://hubs.ly/H0SGQSh0
Les solutions Minitab pour développer vos produits selon les réglementations ...Minitab, LLC
Le secteur pharmaceutique fait face actuellement à des défis de Supply Chain, de production, de R&D et d'optimisation des coûts. C'est encore plus en ces temps incertains que la gestion et la qualité de la donnée, le contrôle des procédés et le suivi des règlementations des organismes de régulation sont fondamentaux. Depuis l'accès aux données et leurs intégrités, permettant à tout un chacun dans une organisation de pouvoir utiliser simplement et rapidement les données, à l'exploration et l'exploitation de celles-ci pour une meilleure prise de décision dans le développement et la production médicamenteuse en passant par l'étape de la documentation et de la gestion projet, les solutions Minitab répondent aux besoins de ces différentes étapes et simplifient les procédés de production tout en assurant le respect des réglementations pharmaceutiques imposées par la FDA ou l'AEM. Découvrez dans ce webinaire comment la complémentarité des solutions d'analyse de données et de gestion de projet de Minitab peuvent aider à développer des médicaments sûrs et efficaces en respectant les normes de conformité en vigueur.
Minitab webinar presentation See the unknown with monte carlo simulationMinitab, LLC
Variation creates unknown risk within a process.
However, knowing how to identify and manage that risk can be a secret weapon – empowering you to avoid waste and allocate resources more effectively.
Minitab Statistical Software empowers you to model data and quantify risk.
Monte Carlo simulation in Minitab Workspace can help you predict risk and learn how to manage it.
In this presentation, you will learn how you can ensure products meet their intended specifications by studying the process inputs and developing a (y=f(x)) equation that describes the process, take the equation further by considering the uncertainty in the inputs – which results in a more realistic view of the response, and perform Monte Carlo simulation to further predict process capability and identify the best strategy to determine optimal process settings using parameter optimization and sensitivity analysis.
A recording of the presentation delivered by Minitab Global Market Development Manager Jenn Atlas is available online at https://hubs.ly/H0Rcd8q0.
Concrétisez votre transformation digitale avec Minitab et Minitab ConnectMinitab, LLC
Afin de répondre aux problématiques de gestion et de qualité des données, Minitab a lancé une nouvelle solution logicielle, Minitab Connect™, pour vous accompagner dans votre transformation digitale.
Dans ce webinaire, Sami Chaabi, Solutions Architect chez Minitab, vous présente :
Les outils en libre-service pour accéder à la data de sources multiples et diverses; la centraliser et l'agréger.
Les visualisations dynamiques et les rapports pour un suivi en temps réel de vos processus, accessibles à tous les collaborateurs de votre organisation pour une meilleure adhésion.
La complémentarité des solutions logicielles Minitab Connect et Minitab Statistical Software offrant un accès simple, rapide, intuitif à l'analyse détaillée de vos données.
A l'issue de ce webinaire, vous en saurez plus sur Minitab Connect™, notre nouvelle solution pour vous accompagner dans votre projet de transformation digitale, quel que soit votre domaine d’activité tel que le manufacturing, la logistique, la finance, le marketing, etc.
En route vers l'excellence avec les solutions MinitabMinitab, LLC
Depuis près de 50 ans et grâce à ses solutions propriétaires, Minitab épaule les organisations en matière de maîtrise des coûts, d'amélioration de la qualité, d'augmentation de la satisfaction client et de gain d'efficacité.
Des milliers d'entreprises et d'institutions du monde entier utilisent Minitab® Statistical Software, Minitab ConnectTM, Salford Predictive Modeler®, Minitab Workspace®, Minitab EngageTM et Quality Trainer® pour répondre à différents objectifs : identifier les opportunités d'amélioration, une meilleure conception dès le départ, une meilleure anticipation des problèmes qualité ou de défaillance, etc.
Découvrez dans cette présentation, l'approche intégrée de Minitab permettant aux entreprises de prendre de meilleures décisions afin d'atteindre l'excellence.
Meet Minitab Engage Your End-to-End Improvement Solution From Idea Generation...Minitab, LLC
Innovation and idea management, and operational excellence are critical to organizational success now more than ever. Successful improvement programs rely on dedicated budget, innovative ideas and people to deliver necessary results, which need to be shared with stakeholders in a meaningful way.
Delivered by our expert Mindy Tomlinson, Minitab Product Manager, this presentation will introduce you to Minitab Engage and highlight features to help you build improvement and innovation programs. Discover how Minitab Engage is the only solution designed to start, track, manage and share innovation and improvement initiatives from idea generation through execution.
Watch the presentation delivered by our expert Mindy Tomlinson, Minitab Product Manager, online here > https://hubs.ly/H0M5RrD0.
La puissance du machine learning et des algorithmes cart au service des métiersMinitab, LLC
Alors que les organisations doivent traiter des volumes de données de plus en plus croissants, il devient encore plus important de s'assurer que les bons outils sont choisis pour pouvoir analyser des données de taille et de complexité variables. Les outils de Machine Learning (auto-apprentissage) tels que les arbres de régression et de classification CART® proposés dans le logiciel d'analyse de données Minitab, et que nous présenterons dans ce webinaire, permettent d'identifier les paramètres critiques d'un procédé, de l'optimiser et d'anticiper les problèmes. Nous prendrons l'exemple de quelques problématiques métiers pour montrer comment les arbres de régression et de classification CART® peuvent fournir une image intuitive des relations complexes dans vos données d'observation de procédés. Nous terminerons par une démonstration de cet outil d'analyse prédictive et de son interface accessible et conviviale dans le logiciel d'analyse de données Minitab.
Strukturierte problemloesung mit datenunterstuetzungMinitab, LLC
In dieser Präsentation konzentrieren wir uns auf einen Anwendungsfall, bei dem ein Unternehmen mit Kundenbeschwerden konfrontiert wird.
Ihnen wird gezeigt wie Sie das Problem erfassen, die Grundursache finden und die effektivste Lösung umsetzen können.
Dieser Anwendungsfall wird mit Hilfe von den Minitab-Softwarepaketen Workspace und Statistical Software durchgeführt.
Wenn Kunden Probleme bei Dienstleistungen oder Produkten beanstanden, ist es unerlässlich, dass die Qualitätsexperten die Grundursache schnell und eindeutig identifizieren.
Wie können Sie Prozesse effektiv untersuchen, verbessern und auf dem verbesserten Niveau halten?
In dieser Präsentation wird ein Beispielprojekt bearbeiten, das sich mit Beschwerden von Kunden in Bezug auf die Qualität von Mobilfunksignalen befasst.
Roberto zeigt Ihnen einen Plan mit dem Sie:
Ihren Ansatz zur Problemlösung mit Daten strukturieren.
Die richtigen Methoden für die Ursachenforschung auswählen.
Lohnende Chancen für Verbesserungen identifizieren.
Lösungen für die besten Ergebnisse umsetzen und nachhaltig beibehalten können.
Sie erlernen eine bewährte Abfolge von Schritten, mit denen Sie Ihr Messsystem auswerten, die Grundursache aufdecken und ein erfolgreiches Lean Six Sigma-Projekt durchführen, von der Projektcharta und dem Ideendiagramm bis zum Kontrollplan.
Außerdem veranschaulichen wir wesentliche Analysen für die kontinuierliche Verbesserung, darunter:
Pareto-Diagramme, Messsystemanalyse, Prüferübereinstimmung bei attributiven Daten, Regelkarten, Prozessfähigkeitsanalyse und mehr.
Die Aufzeichnung dieser Präsentation ansehen: https://hubs.ly/H0GN6jj0
Tips & Tricks for CART (Classification and Regression Trees) in Minitab Stati...Minitab, LLC
This presentation is part of an on-demand webinar you can access here:https://hubs.ly/H0BVzst0
A while ago we encouraged you to up your Minitab Statistical Software game with our Tips & Tricks for Minitab webinar (https://info.minitab.com/resources/webinars/tips-tricks-minitab-statistical-software), and we received some great feedback!
Now, Minitab Solutions Architect Marilyn Wheatley is back to draw on over a decade of experience and share more tips and tricks with you, this time specifically focusing on Minitab’s newest predictive analytics tools – Classification and Regression Trees (CART).
Join us to learn
Tricks for manipulating your view of CART models
Tips for exploring CART results
Penalties for specific data conditions
Best practices for working with your results
Visualizaciones que crean impacto: Vea las novedades de Minitab Statistical ...Minitab, LLC
Estas diapositivas hacen parte de un seminario Gratuito que usted puede ver bajo demanda en: https://hubs.ly/H0Bvh5k0
Usted confía en Minitab Statistical Software para análisis confiables y conocimientos valiosos que lo ayudarán a tomar mejores decisiones, pero ¿cómo puede hacer que esos conocimientos cobren vida y realmente creen el impacto que necesita en su organización? Las imágenes y la accesibilidad adecuadas pueden marcar la diferencia.
Descubra cómo la última versión de Minitab Statistical Software puede ayudarlo a mejorar el impacto de su trabajo en su organización.
Powerful Statistical Tools in the Pharmaceutical and Medical Devices Industry...Minitab, LLC
The development of new drugs and medical devices follows well-established approval paths to make sure that they are safe when they reach the public. The U.S. FDA recommends five stages for the medical device and pharma development process, and some Asia Pacific countries' regulators suggest similar steps.
In this virtual hands-on workshop, Minitab Technical Services Manager Ming Dong will walk you through the Minitab Statistical Software and Minitab Workspace quality and visual tools that can be used in each stage. He will also take you through the common challenges faced by pharmaceutical and medical device manufacturers.
Statistical solutions to help you with 5 FDA medical devices stagesMinitab, LLC
From bandages to pacemakers, medical devices have a single, primary purpose: to improve the quality of life. Medical devices companies must be responsible for the safety and effectiveness of their products throughout the entire product development cycle. In the U.S., the FDA recommends five stages for the device development process. These stages ensure the safety and efficacy of medical devices in the whole product development cycle, creating a need for rigorous pre-market trials and post-market surveillance activities to monitor the performance of medical devices.
In this webinar, we will explore the stage goals and the statistical techniques typically conducted within each stage through examples of different medical devices.
Maximize Efficiency with Minitab Workspace and Minitab Statistical Software -...Minitab, LLC
Are you feeling pushed to the limit with your equipment and facilities while facing the challenge of satisfying customer demand? Buying new equipment or more space may seem like the perfect solution, but might not be realistic at this time. Increasing the operating time for your equipment might work for awhile, but is it sustainable?
Machine Learning with Classification & Regression Trees - APAC Minitab, LLC
In this final segment of our 3-part series, we will focus on classification and regression trees, or CART®. There are many applications for CART, such as determining the conditions that lead to process defects, predicting the probability of fraudulent transactions and determining the key drivers of anomalies in manufacturing processes.
Performing at your best turning words into numbers and numbers into data driv...Minitab, LLC
Learn how to perform text analytics with Minitab and Python. Text mining is useful when analyzing customer comments, call center transcriptions, doctor reports or any other free-form text that contains information you want to extract. We will show the basic steps from collecting summary statistics like Inverse Document Frequency (IDF) and cleaning text to more advanced concepts such as bag of words and sentiment values.
Machine Learning with Binary Logistic Regression - APACMinitab, LLC
In this second of our 3-part series, we will transition to Binary Logistic Regression to predict outcomes with a categorical response variable or target. We will also venture further into modern-day predictive analytics by discussing various feature and model selection techniques. We will look beyond p-values for model reduction and discuss the benefits and disadvantages of several strategies for selecting high-performing predictive models.
Machine Learning with Multiple Regression - APACMinitab, LLC
In this first of a 3-part series, we will move from using regression as an exploratory tool to using it as a powerful machine learning technique. Using real-world case studies, we will see how to mine observational data from your processes and extract valuable information. We will learn how and when to use specific model validation methods, including validation with a test set, leave-one-out validation and k-fold cross-validation. By incorporating validation into model assessment, you will discover how to improve the accuracy of your predictive models
Unleashing the Power of Python Using the New Minitab/Python Integration Modul...Minitab, LLC
Join our Senior Data Scientist, Mikhail Golovnya, for this webinar where we will introduce a new and exciting feature of Minitab - Python integration module. We will explain how to set up the Python connector in a series of simple intuitive steps. Next, we will introduce the core elements of the new functionality: first, how to send Minitab data, such as individual constants and data columns, to Python; second, how to send the results of Python computing back to Minitab and conveniently report them in textual, graphical, and tabular forms.
For more details, please go here: https://hubs.ly/H0r5XTz0
Listen to the keynote address and hear about the latest developments from Rachana Ananthakrishnan and Ian Foster who review the updates to the Globus Platform and Service, and the relevance of Globus to the scientific community as an automation platform to accelerate scientific discovery.
Quarkus Hidden and Forbidden ExtensionsMax Andersen
Quarkus has a vast extension ecosystem and is known for its subsonic and subatomic feature set. Some of these features are not as well known, and some extensions are less talked about, but that does not make them less interesting - quite the opposite.
Come join this talk to see some tips and tricks for using Quarkus and some of the lesser known features, extensions and development techniques.
Accelerate Enterprise Software Engineering with PlatformlessWSO2
Key takeaways:
Challenges of building platforms and the benefits of platformless.
Key principles of platformless, including API-first, cloud-native middleware, platform engineering, and developer experience.
How Choreo enables the platformless experience.
How key concepts like application architecture, domain-driven design, zero trust, and cell-based architecture are inherently a part of Choreo.
Demo of an end-to-end app built and deployed on Choreo.
Paketo Buildpacks : la meilleure façon de construire des images OCI? DevopsDa...Anthony Dahanne
Les Buildpacks existent depuis plus de 10 ans ! D’abord, ils étaient utilisés pour détecter et construire une application avant de la déployer sur certains PaaS. Ensuite, nous avons pu créer des images Docker (OCI) avec leur dernière génération, les Cloud Native Buildpacks (CNCF en incubation). Sont-ils une bonne alternative au Dockerfile ? Que sont les buildpacks Paketo ? Quelles communautés les soutiennent et comment ?
Venez le découvrir lors de cette session ignite
Gamify Your Mind; The Secret Sauce to Delivering Success, Continuously Improv...Shahin Sheidaei
Games are powerful teaching tools, fostering hands-on engagement and fun. But they require careful consideration to succeed. Join me to explore factors in running and selecting games, ensuring they serve as effective teaching tools. Learn to maintain focus on learning objectives while playing, and how to measure the ROI of gaming in education. Discover strategies for pitching gaming to leadership. This session offers insights, tips, and examples for coaches, team leads, and enterprise leaders seeking to teach from simple to complex concepts.
May Marketo Masterclass, London MUG May 22 2024.pdfAdele Miller
Can't make Adobe Summit in Vegas? No sweat because the EMEA Marketo Engage Champions are coming to London to share their Summit sessions, insights and more!
This is a MUG with a twist you don't want to miss.
TROUBLESHOOTING 9 TYPES OF OUTOFMEMORYERRORTier1 app
Even though at surface level ‘java.lang.OutOfMemoryError’ appears as one single error; underlyingly there are 9 types of OutOfMemoryError. Each type of OutOfMemoryError has different causes, diagnosis approaches and solutions. This session equips you with the knowledge, tools, and techniques needed to troubleshoot and conquer OutOfMemoryError in all its forms, ensuring smoother, more efficient Java applications.
Field Employee Tracking System| MiTrack App| Best Employee Tracking Solution|...informapgpstrackings
Keep tabs on your field staff effortlessly with Informap Technology Centre LLC. Real-time tracking, task assignment, and smart features for efficient management. Request a live demo today!
For more details, visit us : https://informapuae.com/field-staff-tracking/
Enterprise Resource Planning System includes various modules that reduce any business's workload. Additionally, it organizes the workflows, which drives towards enhancing productivity. Here are a detailed explanation of the ERP modules. Going through the points will help you understand how the software is changing the work dynamics.
To know more details here: https://blogs.nyggs.com/nyggs/enterprise-resource-planning-erp-system-modules/
Climate Science Flows: Enabling Petabyte-Scale Climate Analysis with the Eart...Globus
The Earth System Grid Federation (ESGF) is a global network of data servers that archives and distributes the planet’s largest collection of Earth system model output for thousands of climate and environmental scientists worldwide. Many of these petabyte-scale data archives are located in proximity to large high-performance computing (HPC) or cloud computing resources, but the primary workflow for data users consists of transferring data, and applying computations on a different system. As a part of the ESGF 2.0 US project (funded by the United States Department of Energy Office of Science), we developed pre-defined data workflows, which can be run on-demand, capable of applying many data reduction and data analysis to the large ESGF data archives, transferring only the resultant analysis (ex. visualizations, smaller data files). In this talk, we will showcase a few of these workflows, highlighting how Globus Flows can be used for petabyte-scale climate analysis.
A Comprehensive Look at Generative AI in Retail App Testing.pdfkalichargn70th171
Traditional software testing methods are being challenged in retail, where customer expectations and technological advancements continually shape the landscape. Enter generative AI—a transformative subset of artificial intelligence technologies poised to revolutionize software testing.
How Recreation Management Software Can Streamline Your Operations.pptxwottaspaceseo
Recreation management software streamlines operations by automating key tasks such as scheduling, registration, and payment processing, reducing manual workload and errors. It provides centralized management of facilities, classes, and events, ensuring efficient resource allocation and facility usage. The software offers user-friendly online portals for easy access to bookings and program information, enhancing customer experience. Real-time reporting and data analytics deliver insights into attendance and preferences, aiding in strategic decision-making. Additionally, effective communication tools keep participants and staff informed with timely updates. Overall, recreation management software enhances efficiency, improves service delivery, and boosts customer satisfaction.
Understanding Globus Data Transfers with NetSageGlobus
NetSage is an open privacy-aware network measurement, analysis, and visualization service designed to help end-users visualize and reason about large data transfers. NetSage traditionally has used a combination of passive measurements, including SNMP and flow data, as well as active measurements, mainly perfSONAR, to provide longitudinal network performance data visualization. It has been deployed by dozens of networks world wide, and is supported domestically by the Engagement and Performance Operations Center (EPOC), NSF #2328479. We have recently expanded the NetSage data sources to include logs for Globus data transfers, following the same privacy-preserving approach as for Flow data. Using the logs for the Texas Advanced Computing Center (TACC) as an example, this talk will walk through several different example use cases that NetSage can answer, including: Who is using Globus to share data with my institution, and what kind of performance are they able to achieve? How many transfers has Globus supported for us? Which sites are we sharing the most data with, and how is that changing over time? How is my site using Globus to move data internally, and what kind of performance do we see for those transfers? What percentage of data transfers at my institution used Globus, and how did the overall data transfer performance compare to the Globus users?
Check out the webinar slides to learn more about how XfilesPro transforms Salesforce document management by leveraging its world-class applications. For more details, please connect with sales@xfilespro.com
If you want to watch the on-demand webinar, please click here: https://www.xfilespro.com/webinars/salesforce-document-management-2-0-smarter-faster-better/
Top Features to Include in Your Winzo Clone App for Business Growth (4).pptxrickgrimesss22
Discover the essential features to incorporate in your Winzo clone app to boost business growth, enhance user engagement, and drive revenue. Learn how to create a compelling gaming experience that stands out in the competitive market.
Large Language Models and the End of ProgrammingMatt Welsh
Talk by Matt Welsh at Craft Conference 2024 on the impact that Large Language Models will have on the future of software development. In this talk, I discuss the ways in which LLMs will impact the software industry, from replacing human software developers with AI, to replacing conventional software with models that perform reasoning, computation, and problem-solving.
Providing Globus Services to Users of JASMIN for Environmental Data AnalysisGlobus
JASMIN is the UK’s high-performance data analysis platform for environmental science, operated by STFC on behalf of the UK Natural Environment Research Council (NERC). In addition to its role in hosting the CEDA Archive (NERC’s long-term repository for climate, atmospheric science & Earth observation data in the UK), JASMIN provides a collaborative platform to a community of around 2,000 scientists in the UK and beyond, providing nearly 400 environmental science projects with working space, compute resources and tools to facilitate their work. High-performance data transfer into and out of JASMIN has always been a key feature, with many scientists bringing model outputs from supercomputers elsewhere in the UK, to analyse against observational or other model data in the CEDA Archive. A growing number of JASMIN users are now realising the benefits of using the Globus service to provide reliable and efficient data movement and other tasks in this and other contexts. Further use cases involve long-distance (intercontinental) transfers to and from JASMIN, and collecting results from a mobile atmospheric radar system, pushing data to JASMIN via a lightweight Globus deployment. We provide details of how Globus fits into our current infrastructure, our experience of the recent migration to GCSv5.4, and of our interest in developing use of the wider ecosystem of Globus services for the benefit of our user community.
Using IESVE for Room Loads Analysis - Australia & New Zealand
Minitab webinar from unicorns to racehorses - presentation slides
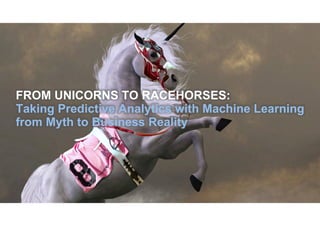
1. FROM UNICORNS TO RACEHORSES:
Taking Predictive Analytics with Machine Learning
from Myth to Business Reality
2. Powerful statistical
software everyone can
use.
Integrated project tools
and reporting to manage
Continuous Improvement.
Online learning solution to
master statistics and Minitab®
anytime, anywhere.
Powerful data mining with
machine learning and
predictive analytics.
What Minitab offers
PRODUCTS:
SERVICES:
Training
Public courses or onsite training
matched to your requirements.
Statistical
Consulting
Personalized help with your statistical
and analysis challenges from experts.
Support
Assisting your use of the software,
installation and implementation.
28. Taking Predictive Analytics with Machine Learning
from Myth to Business Reality
AN ORGANIZATION’S JOURNEY
Gillian Groom
Racehorse Trainer, Minitab Ltd
29. TRAINING: Enhance your skills with Minitab’s industry training courses
FREE CONSULTATION: Which analysis software is right for you?
ONLINE RESOURCES:
Webinars & Videos
Ebooks
Articles on our blog
Learn more at Minitab.com
More Resources:
30. Insights Events:
Run across the globe, conferences and workshops
Find our next event near you!
Subscribe to our Newsletter
at Minitab.com