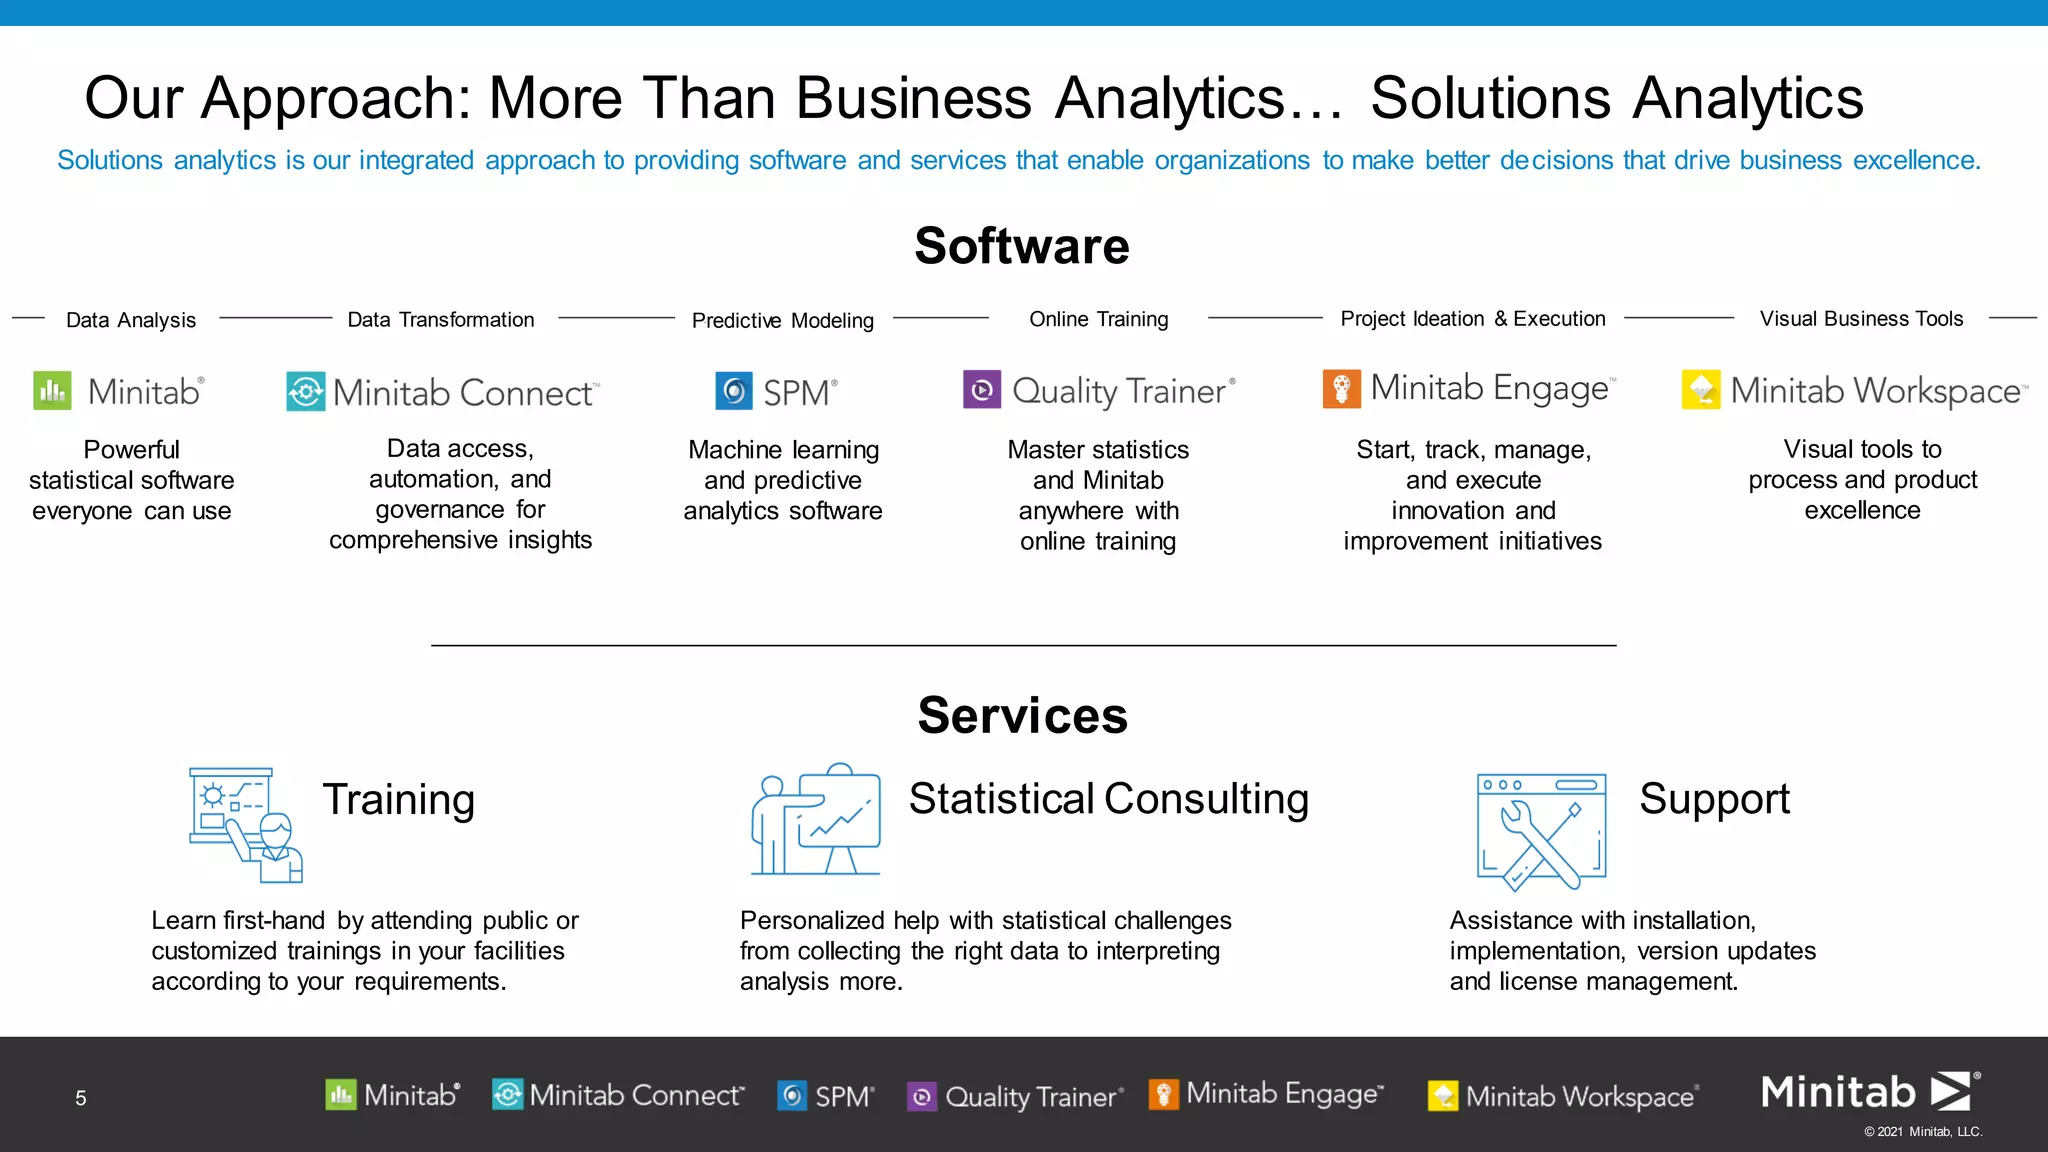
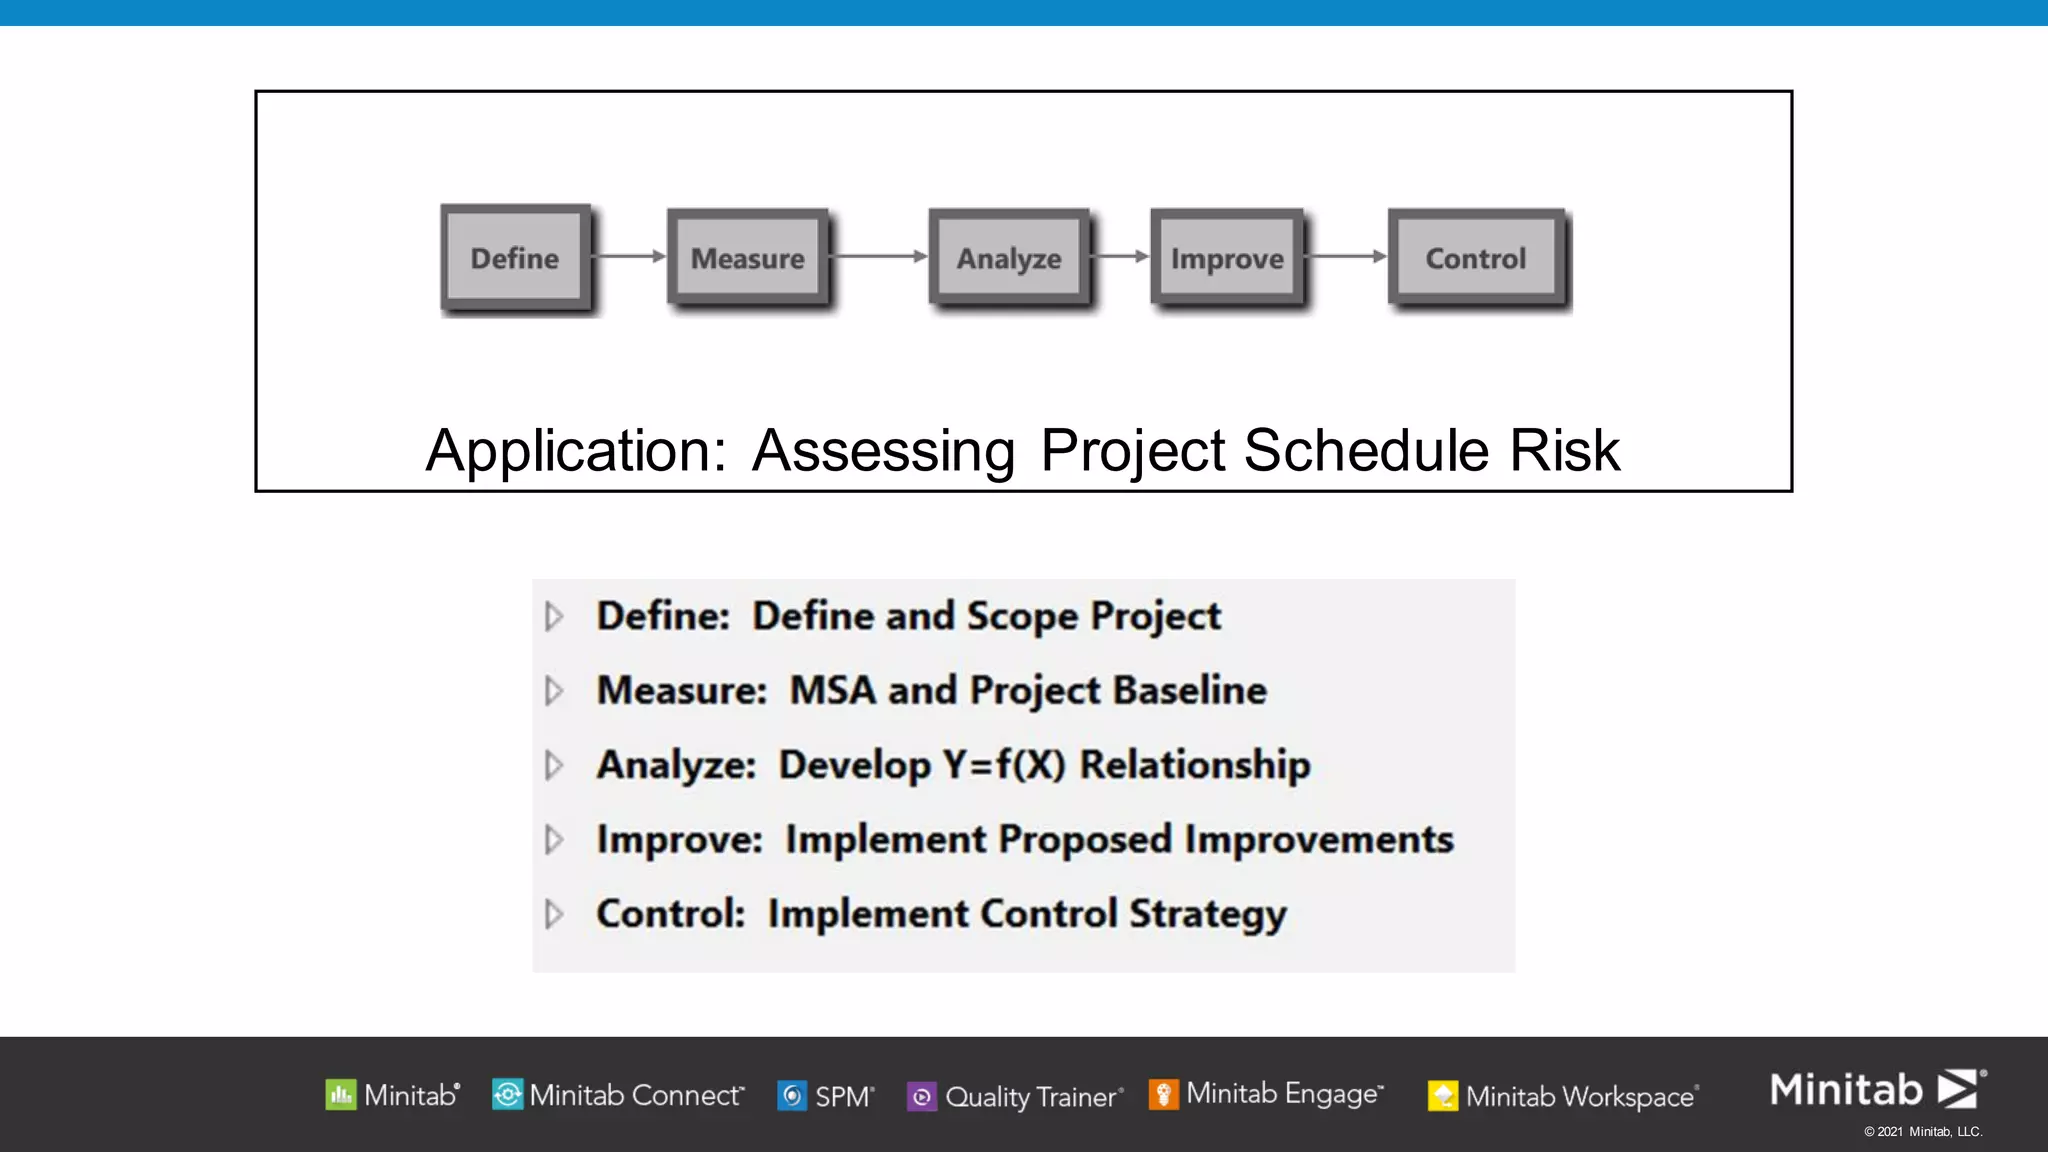
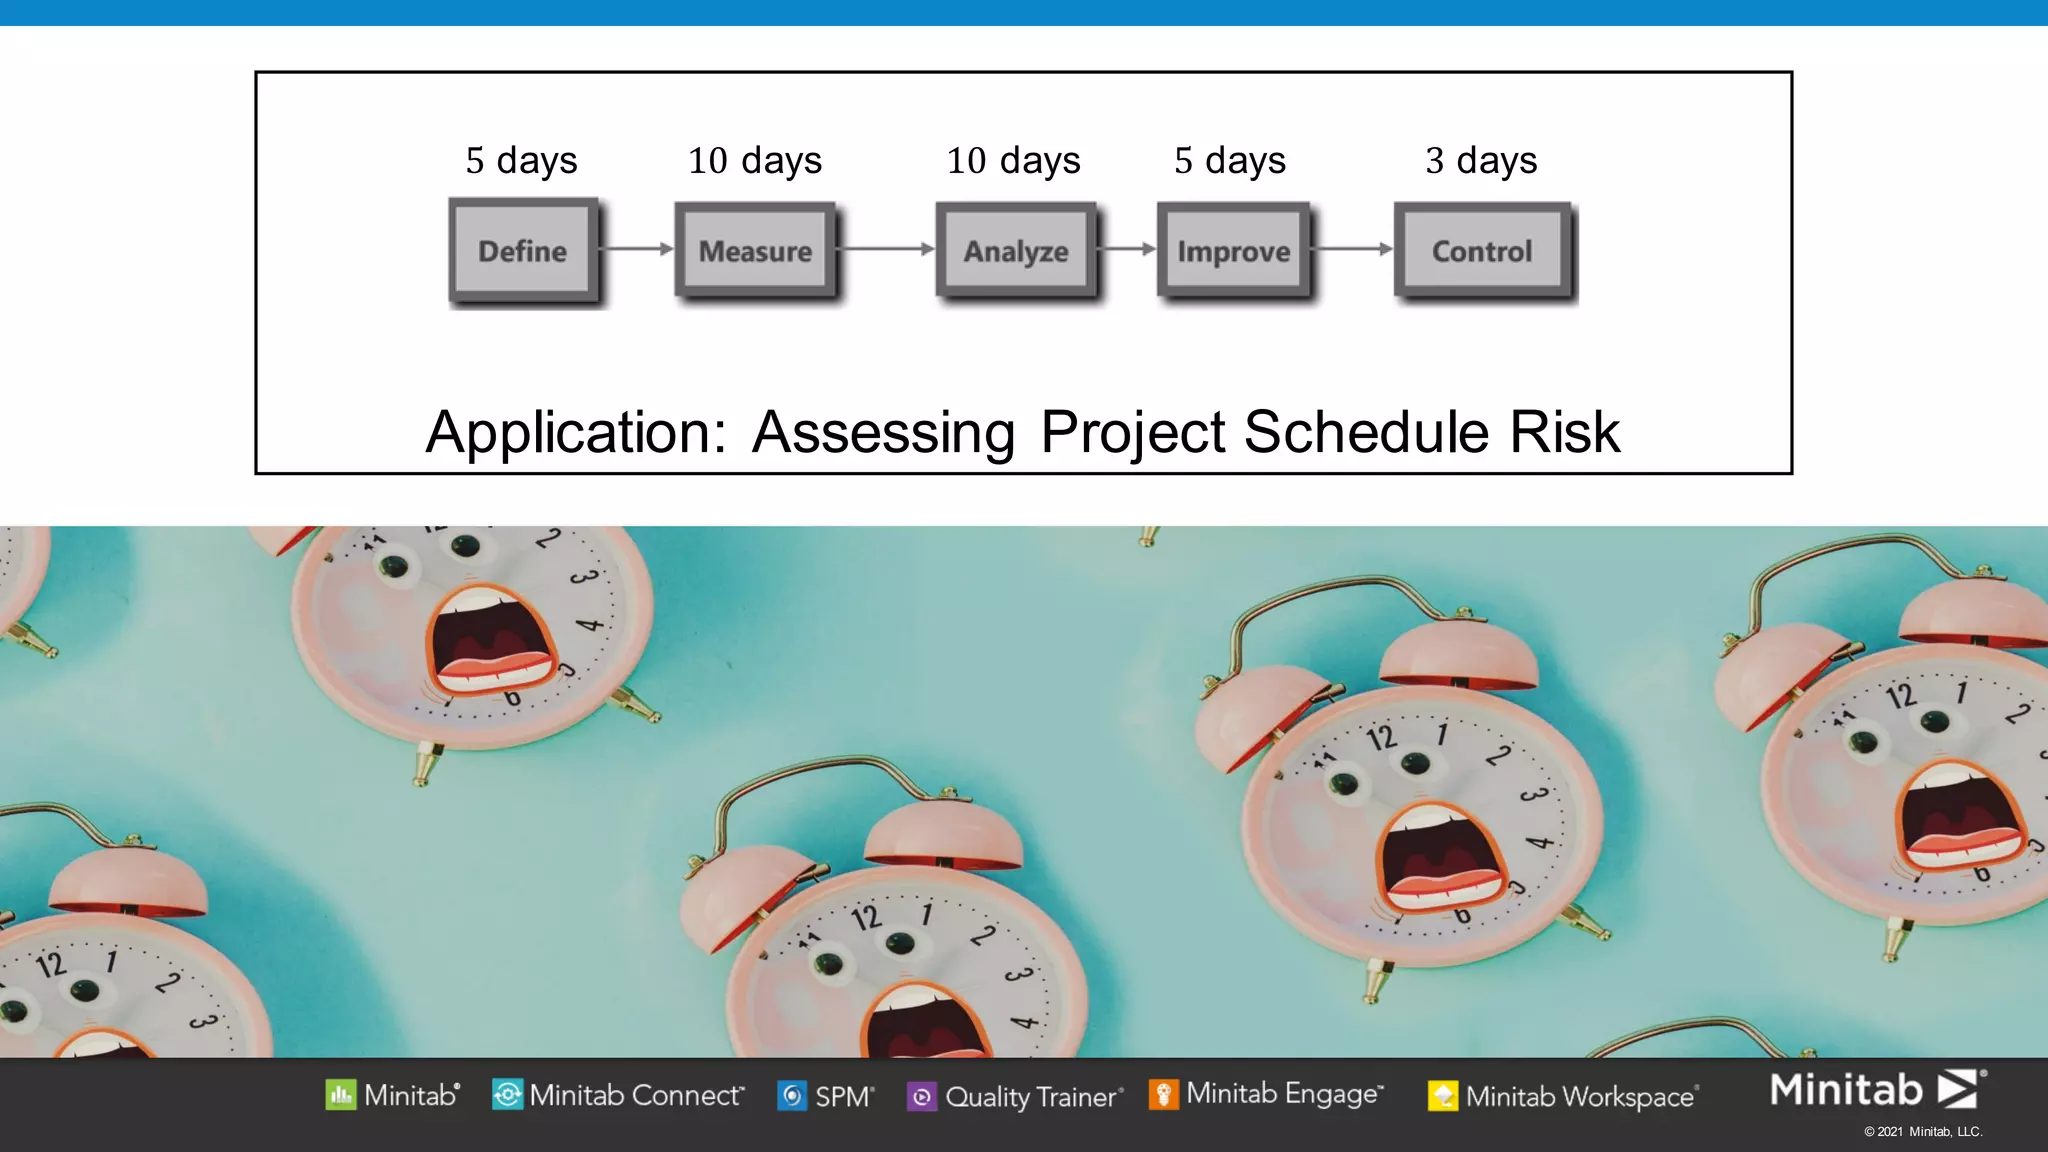
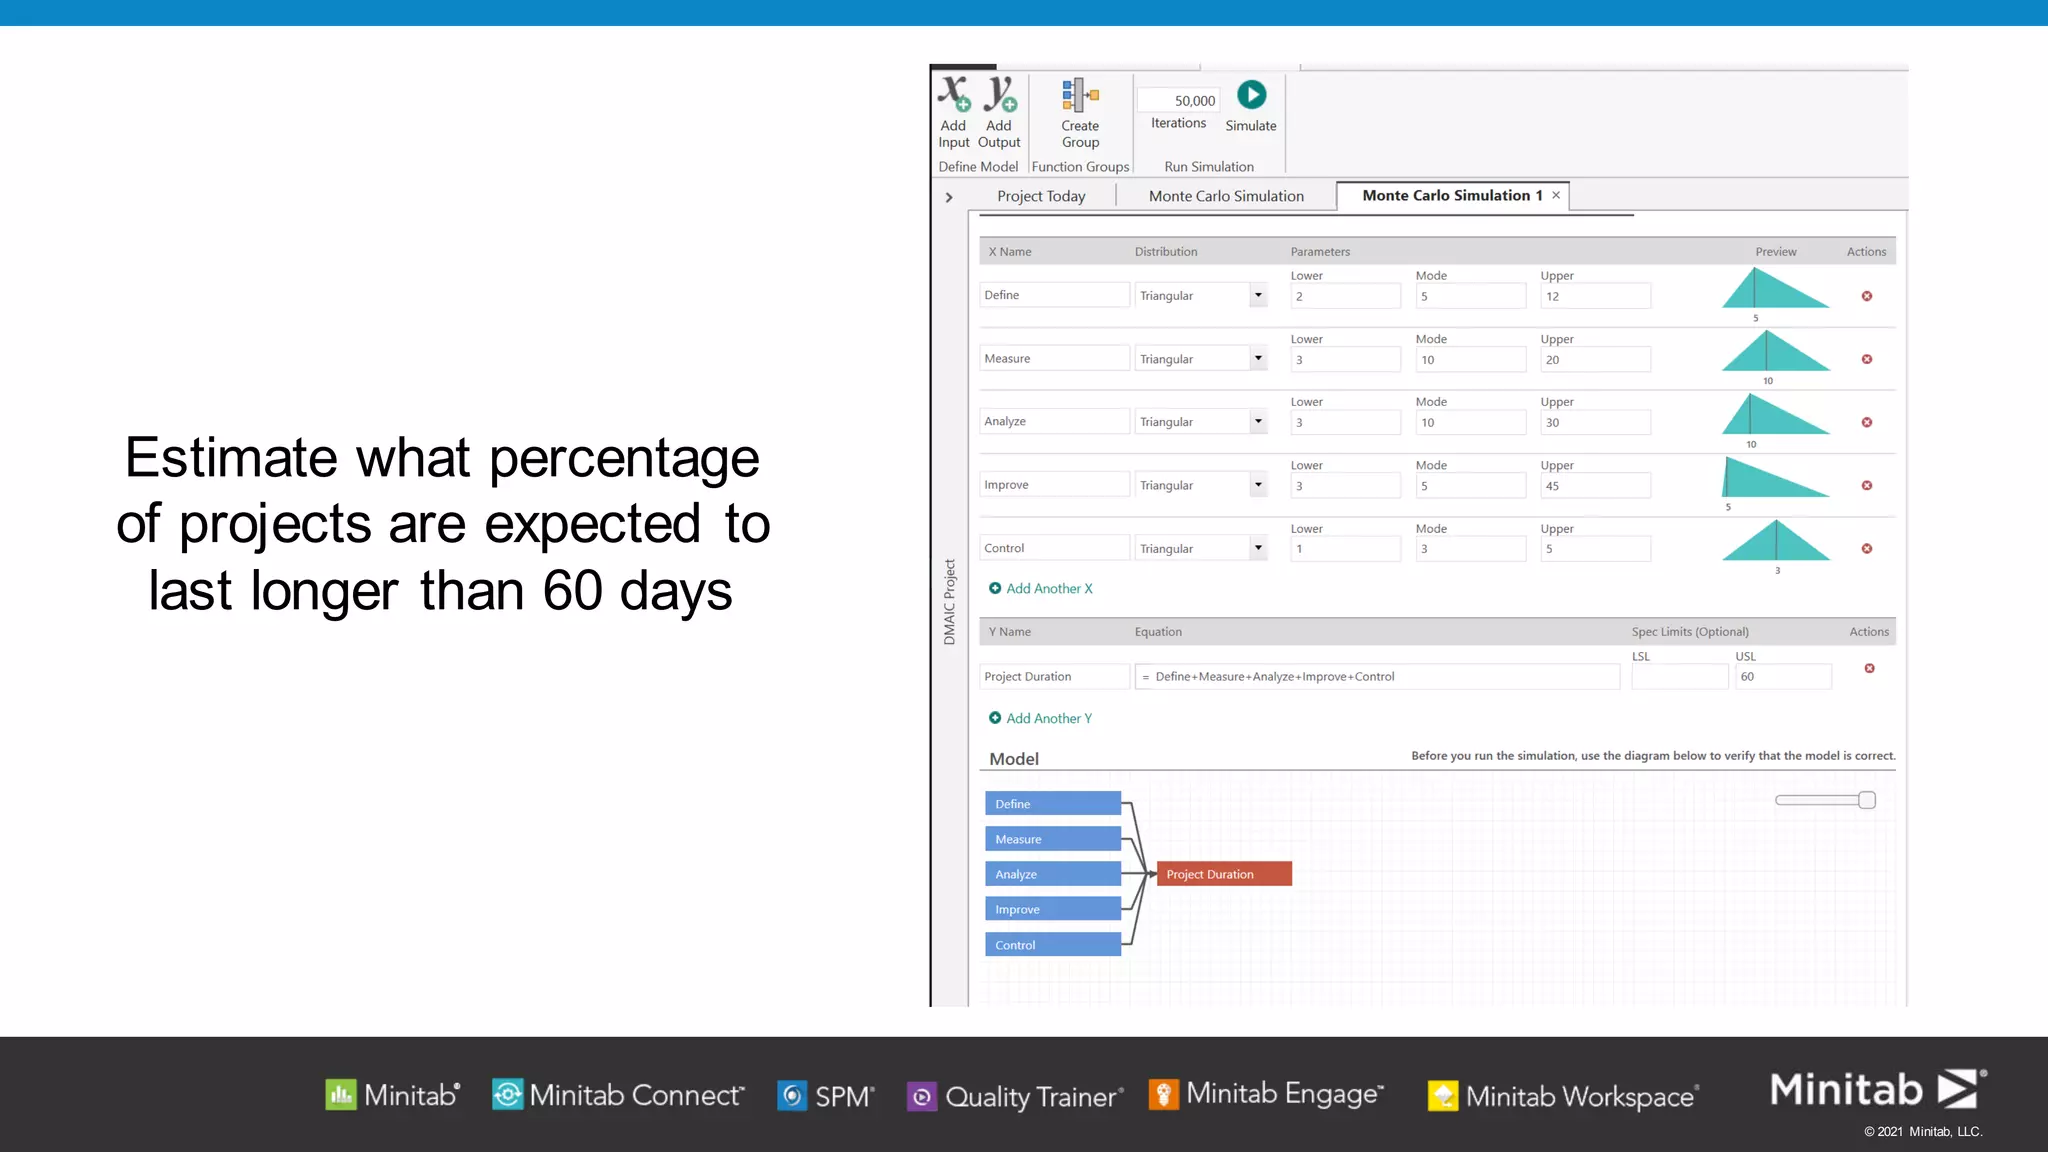
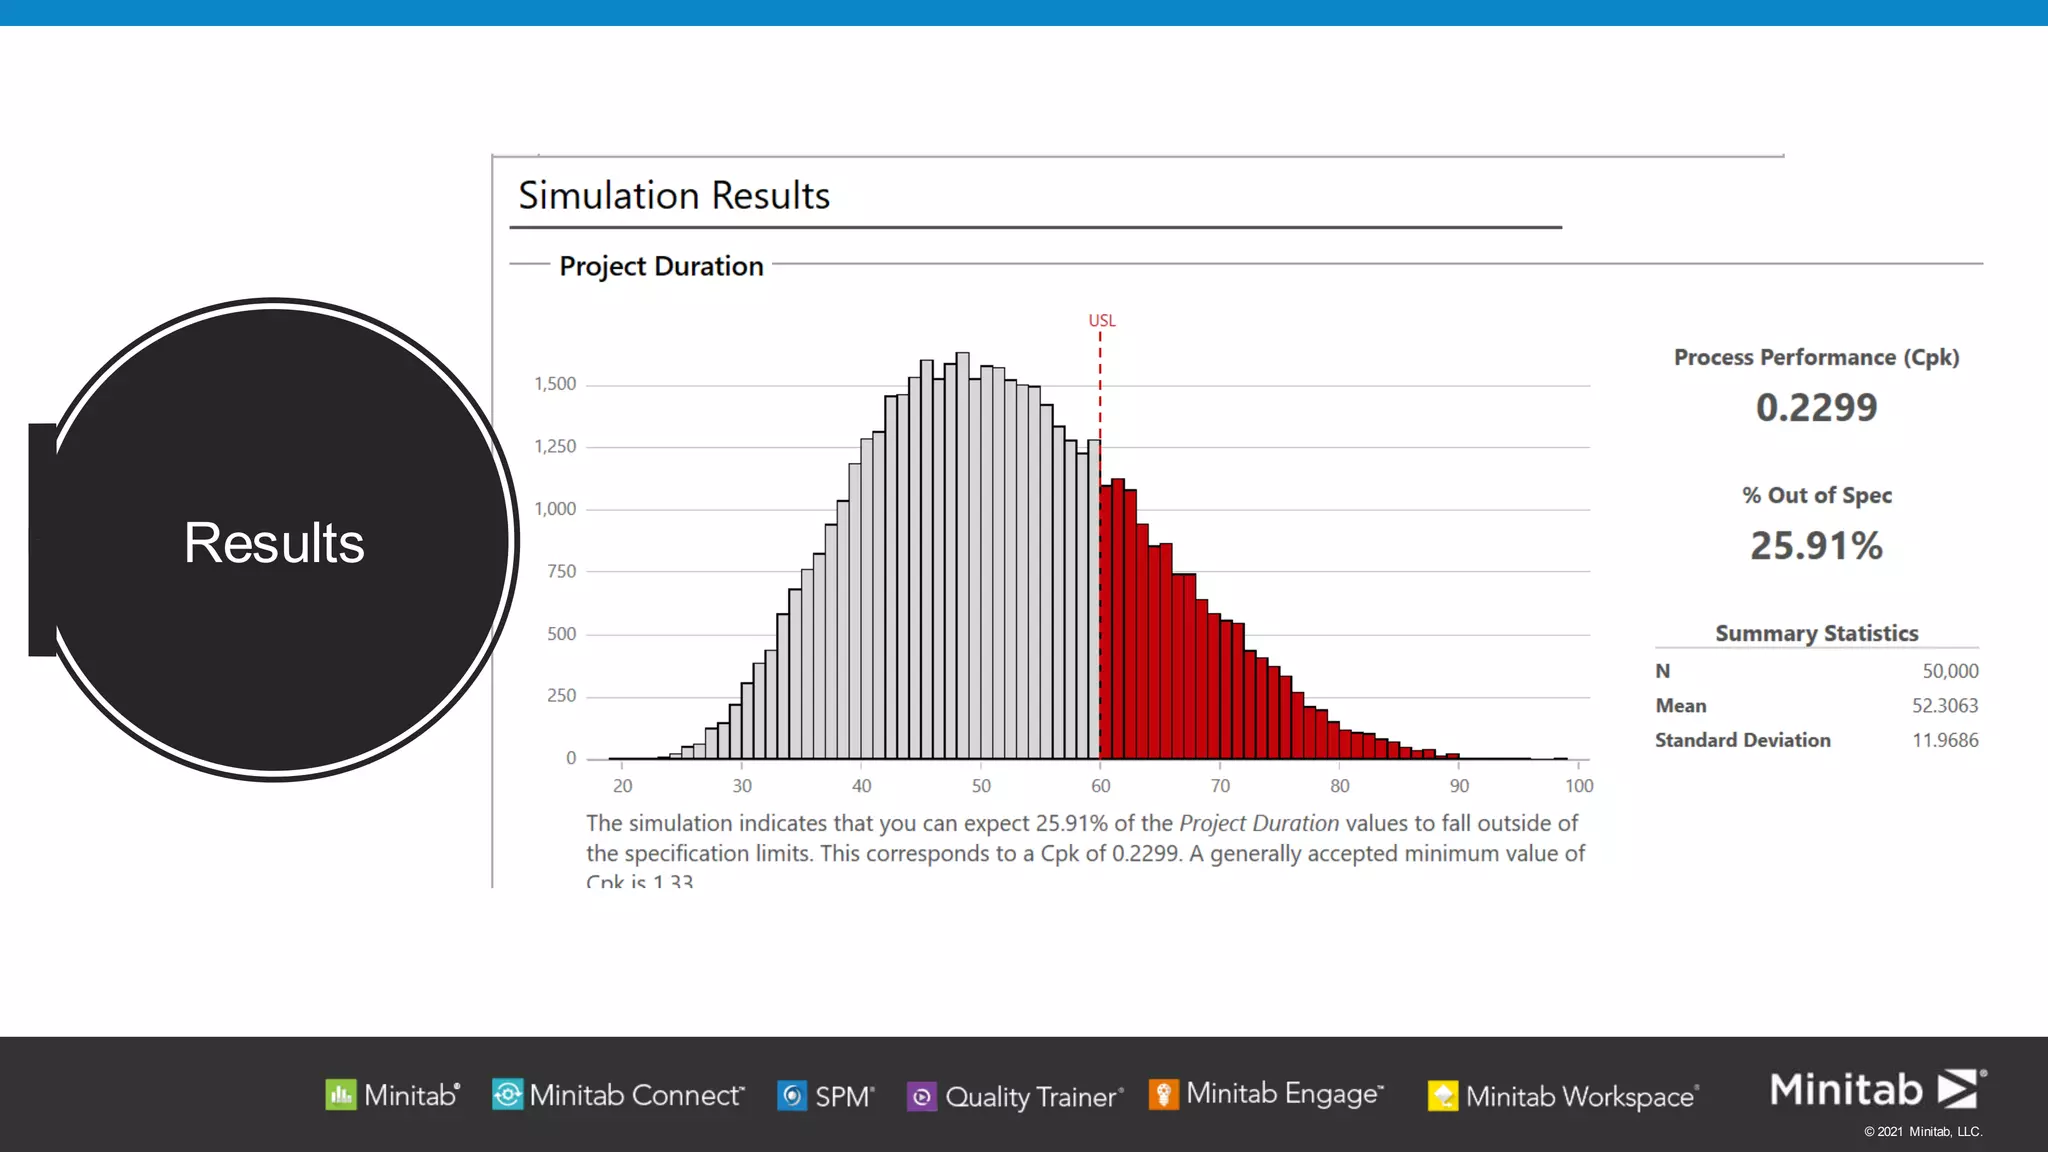
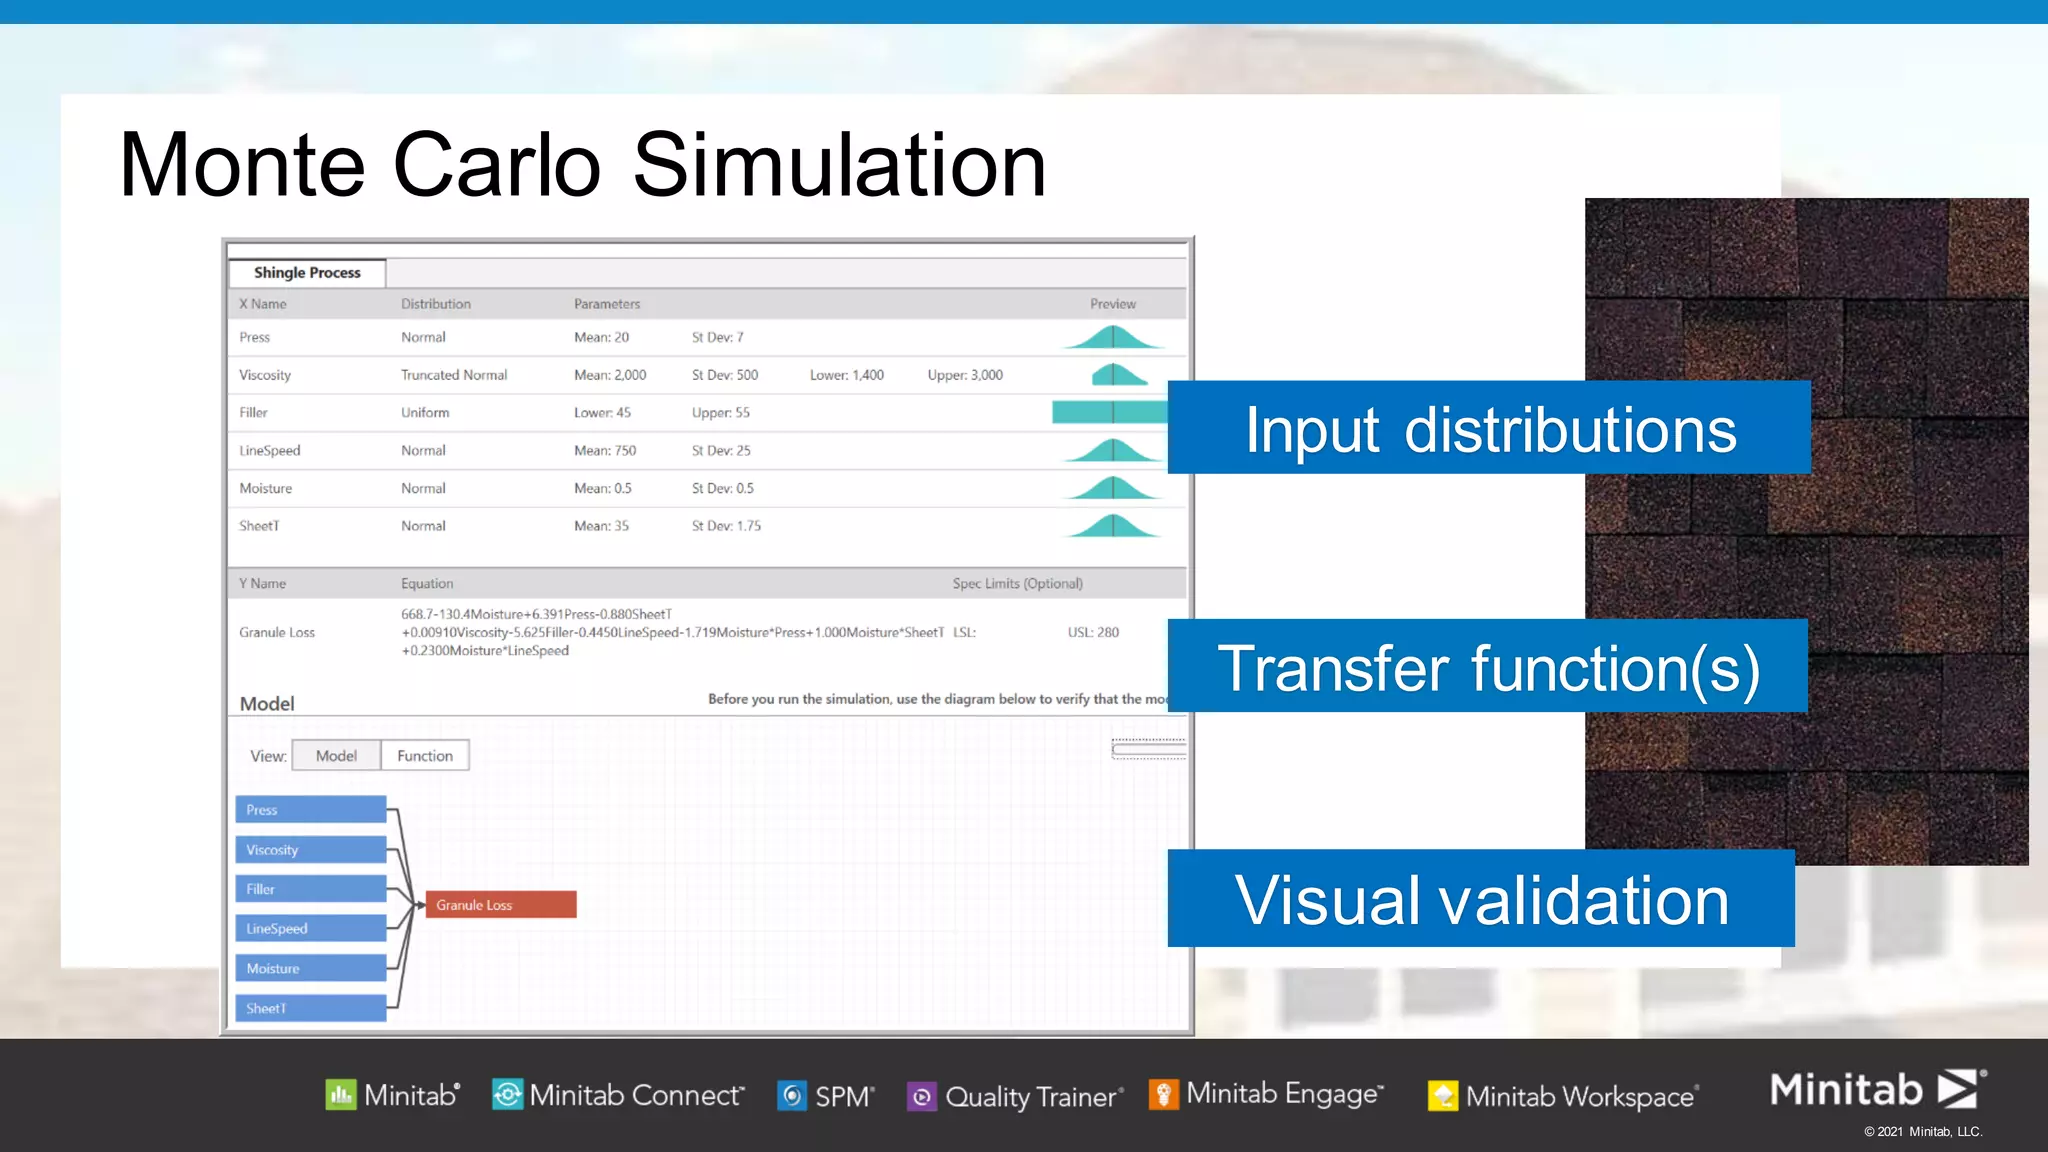
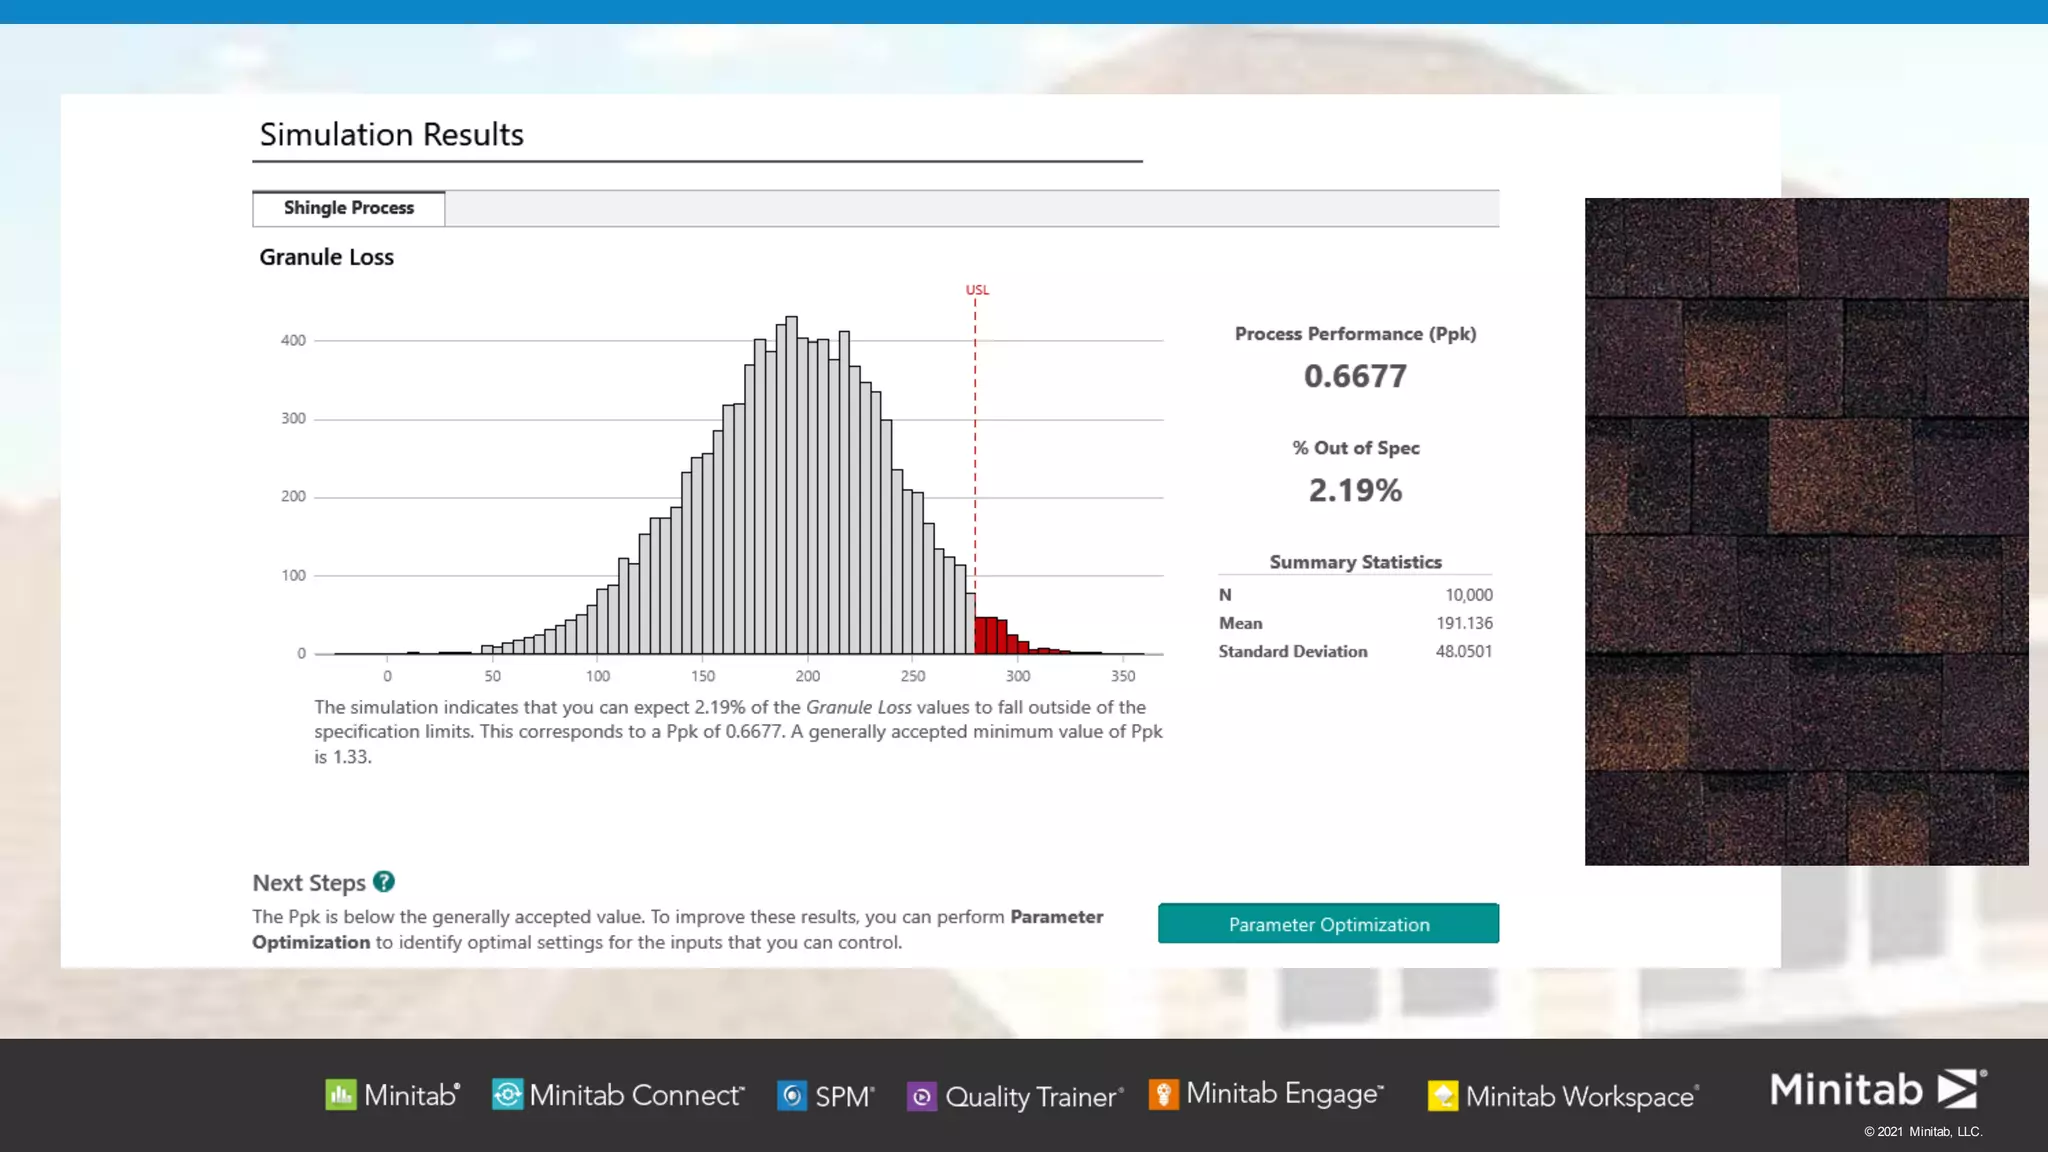
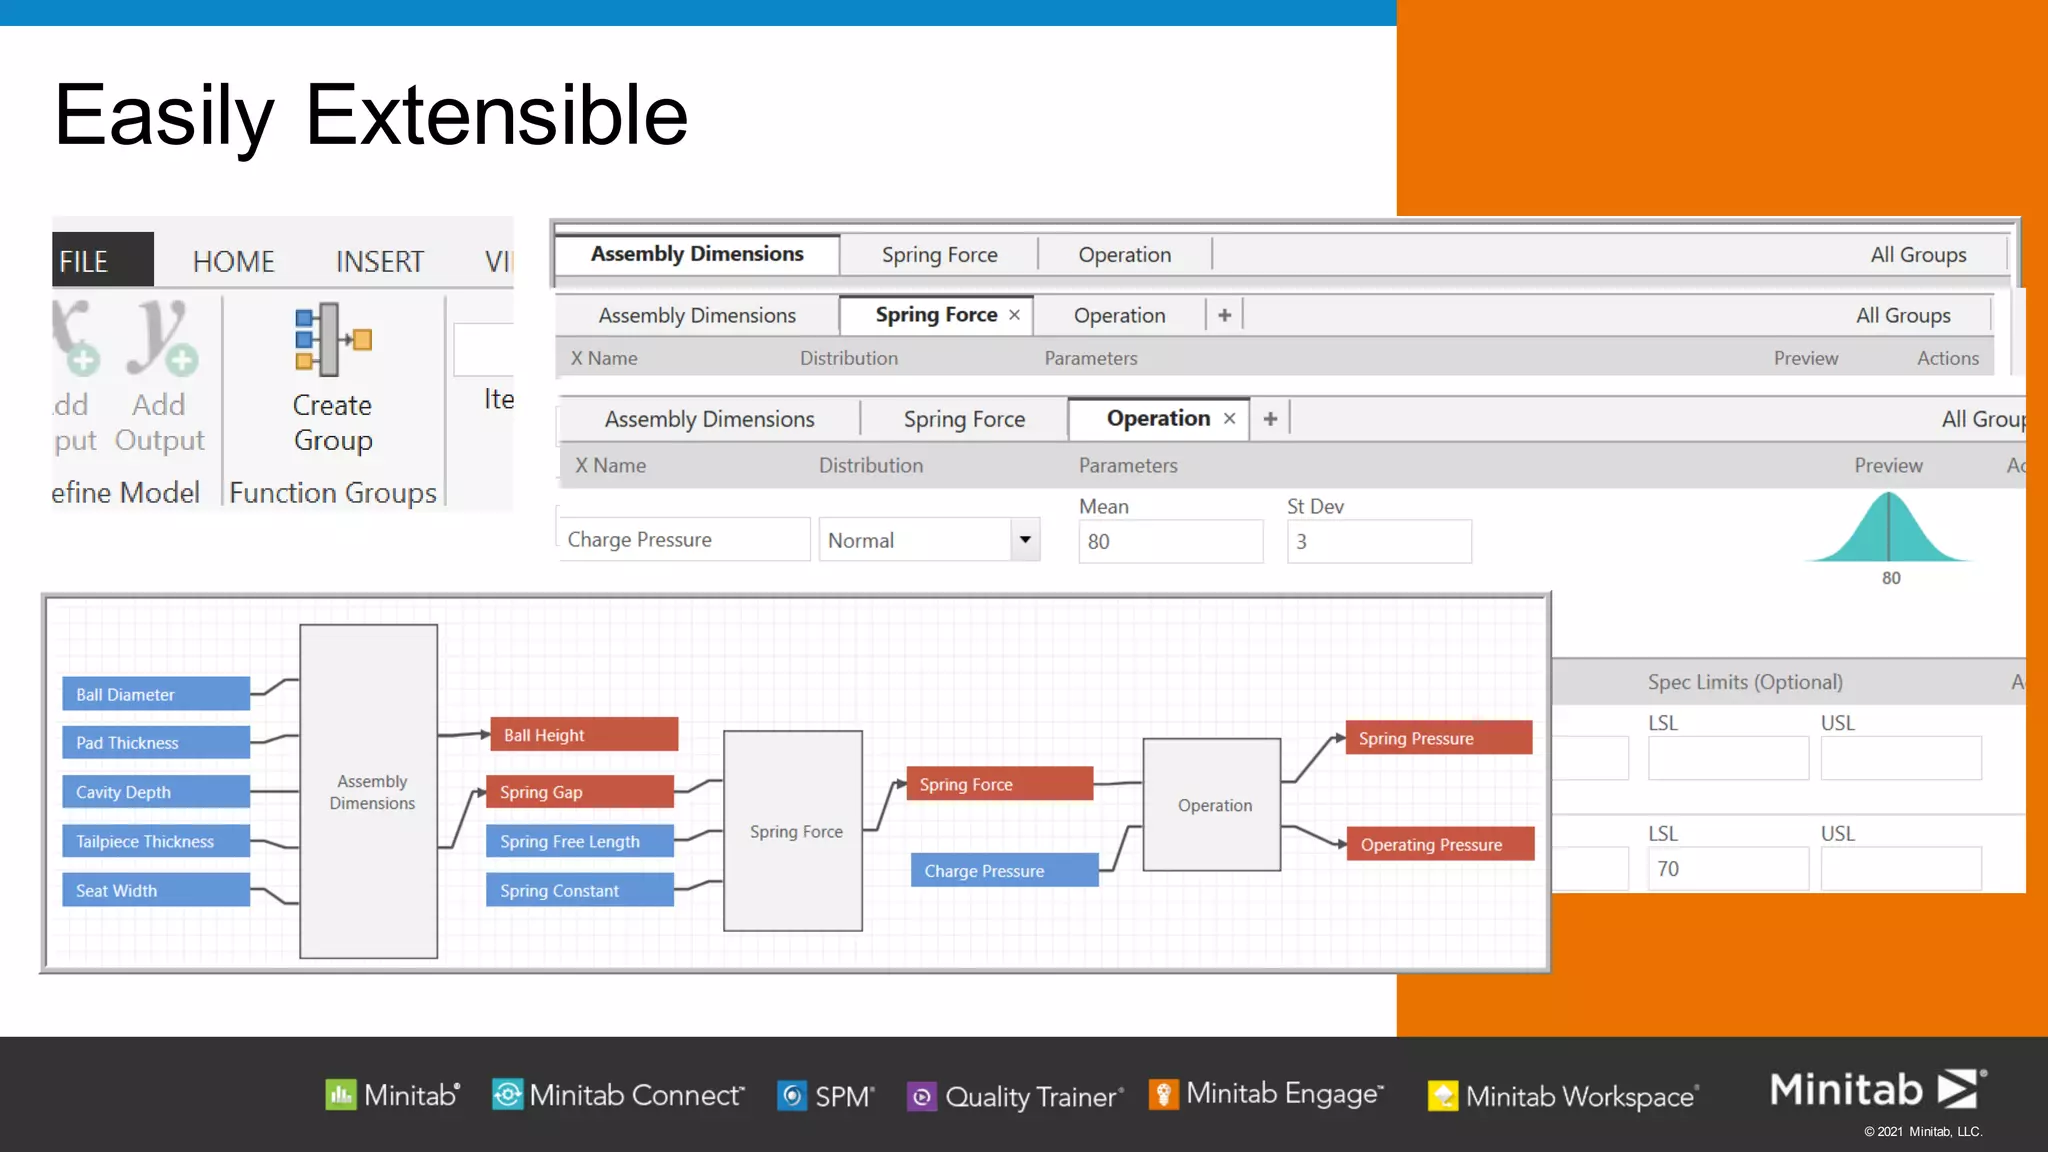
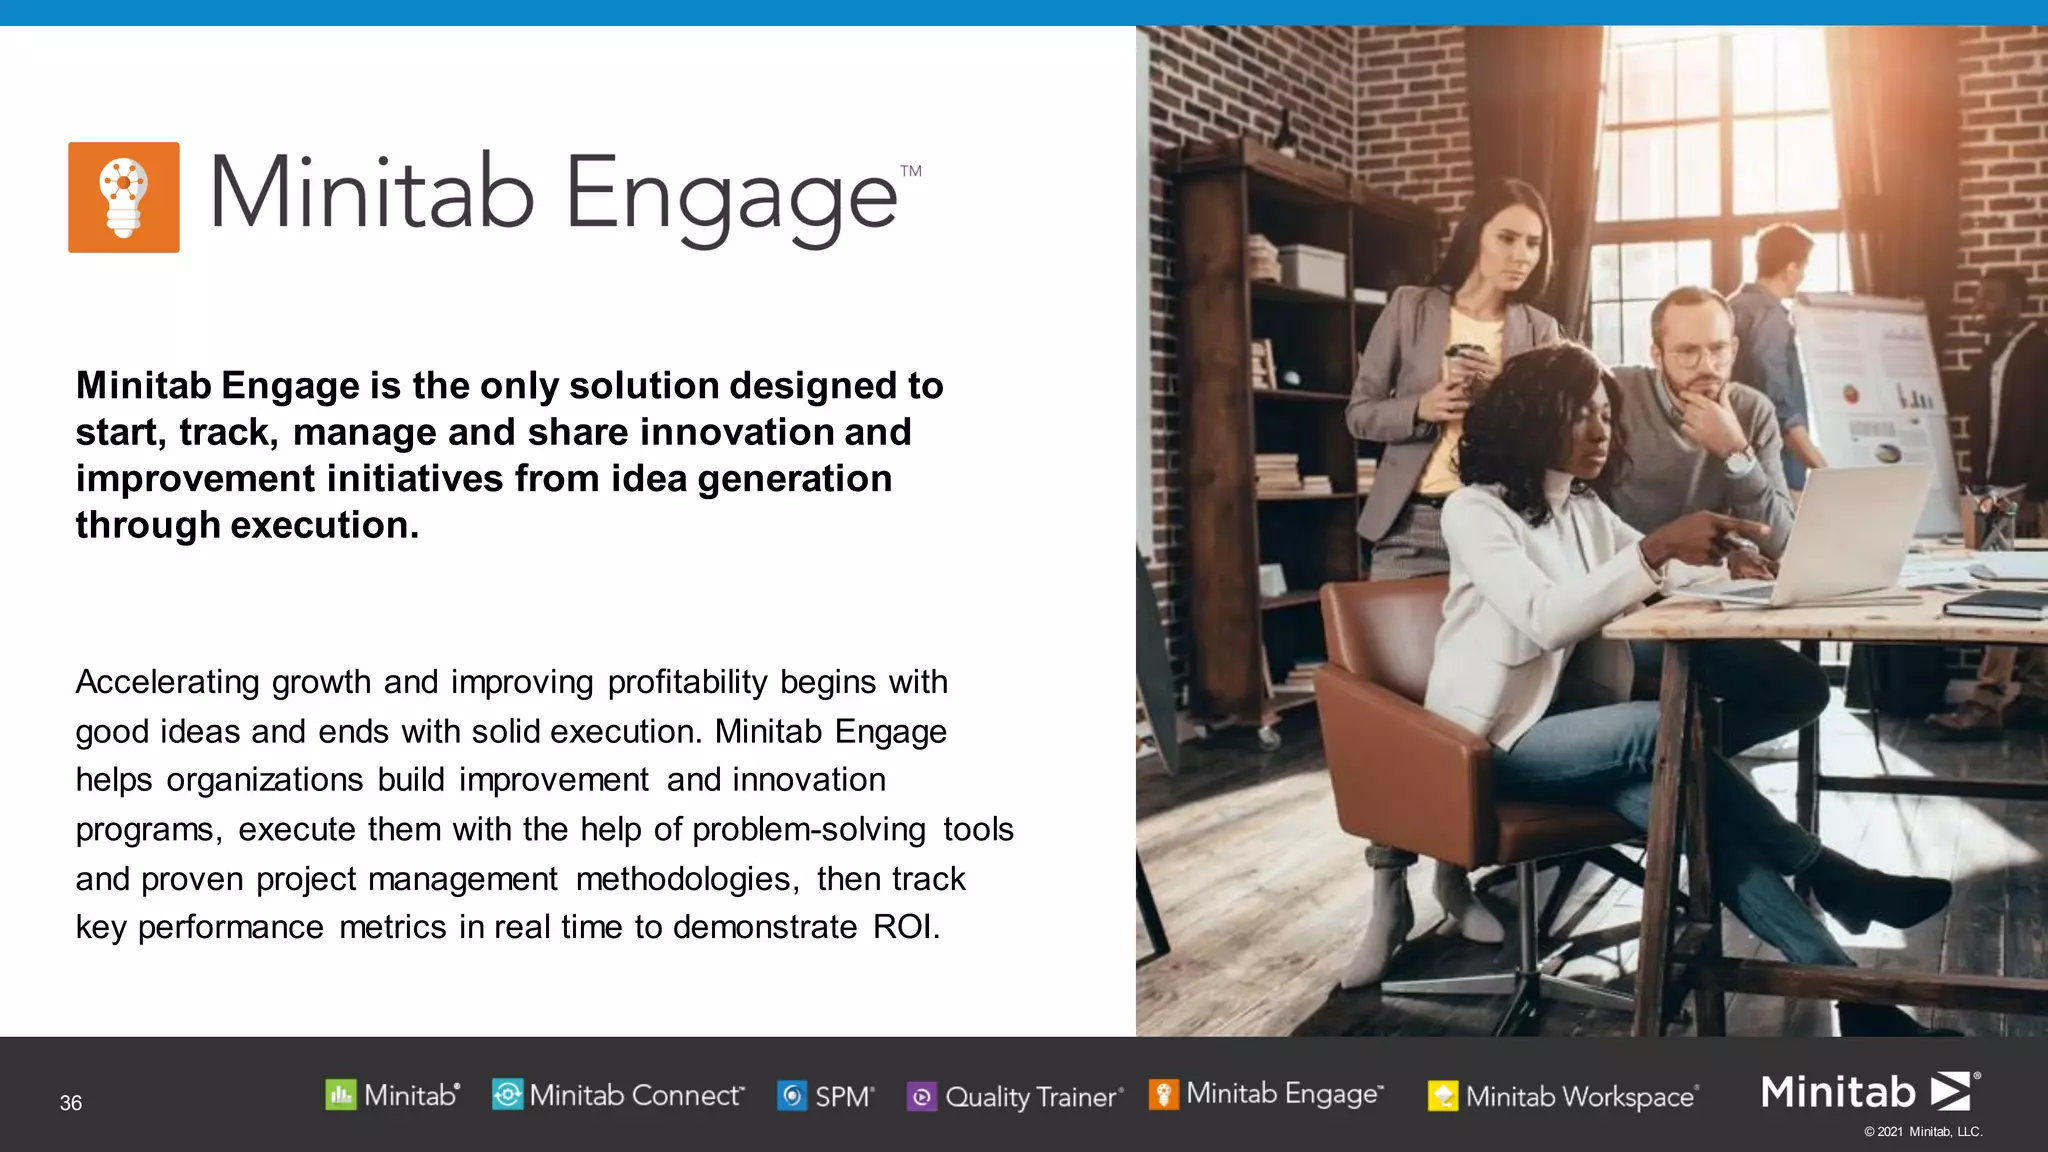
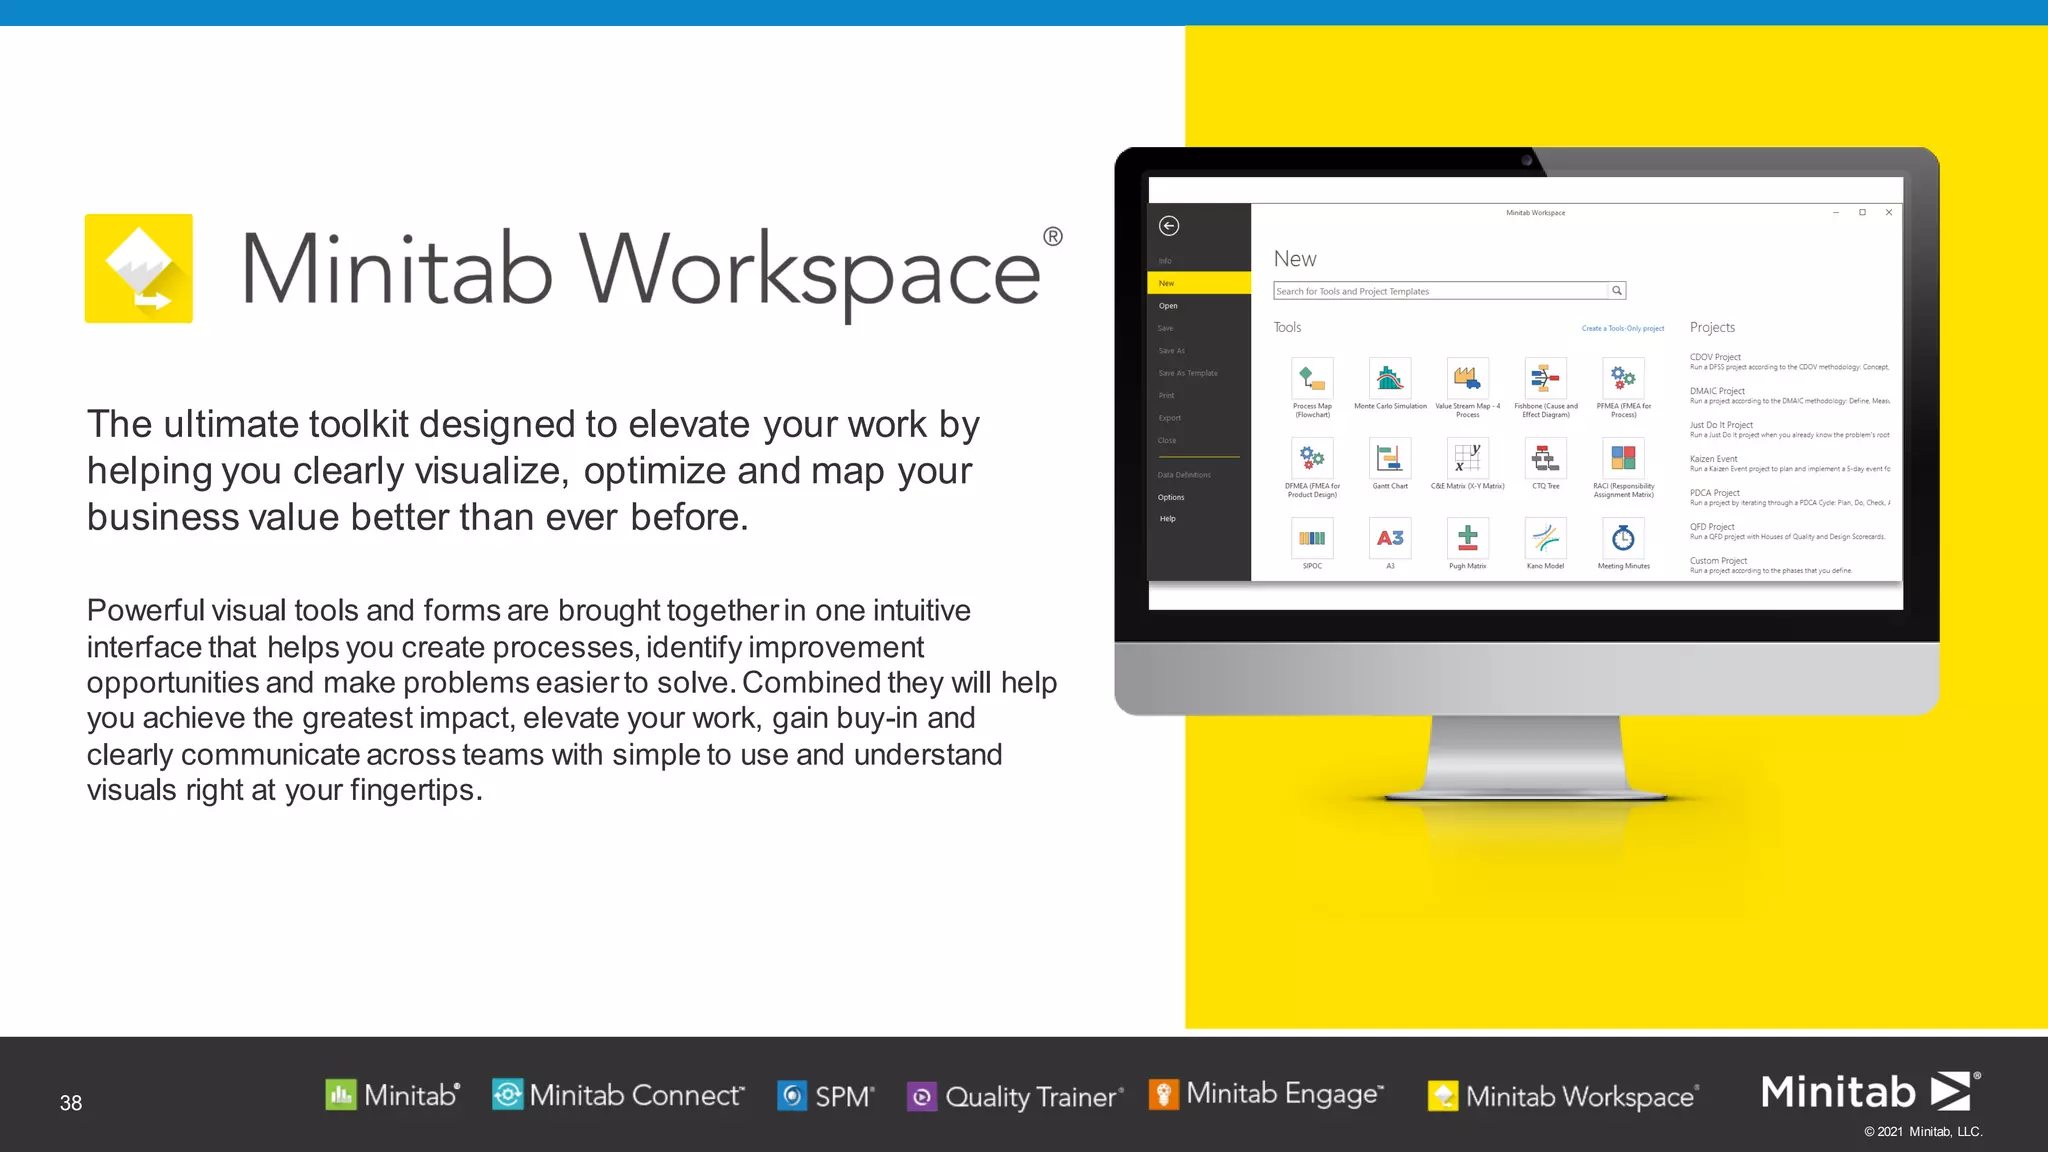
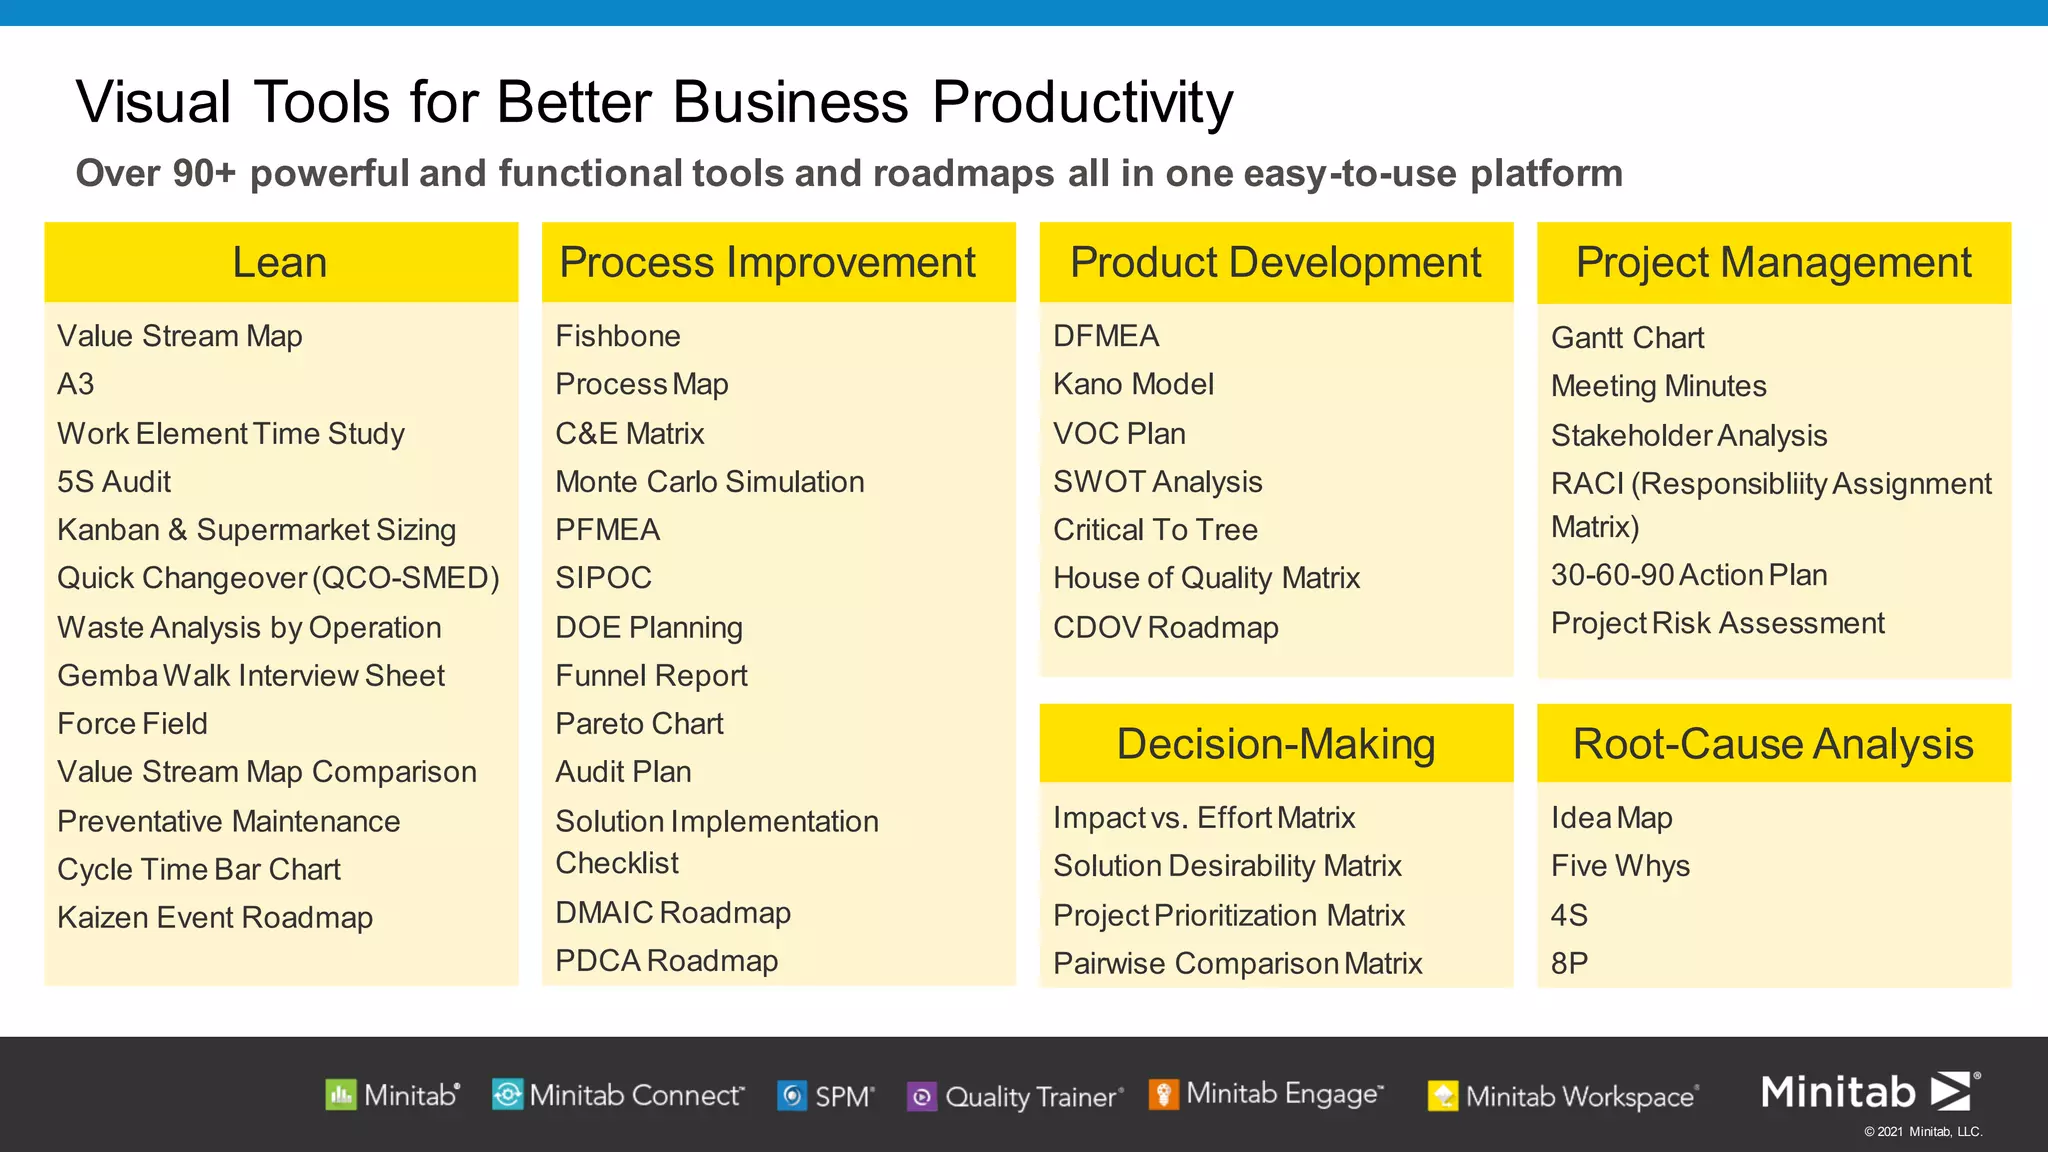
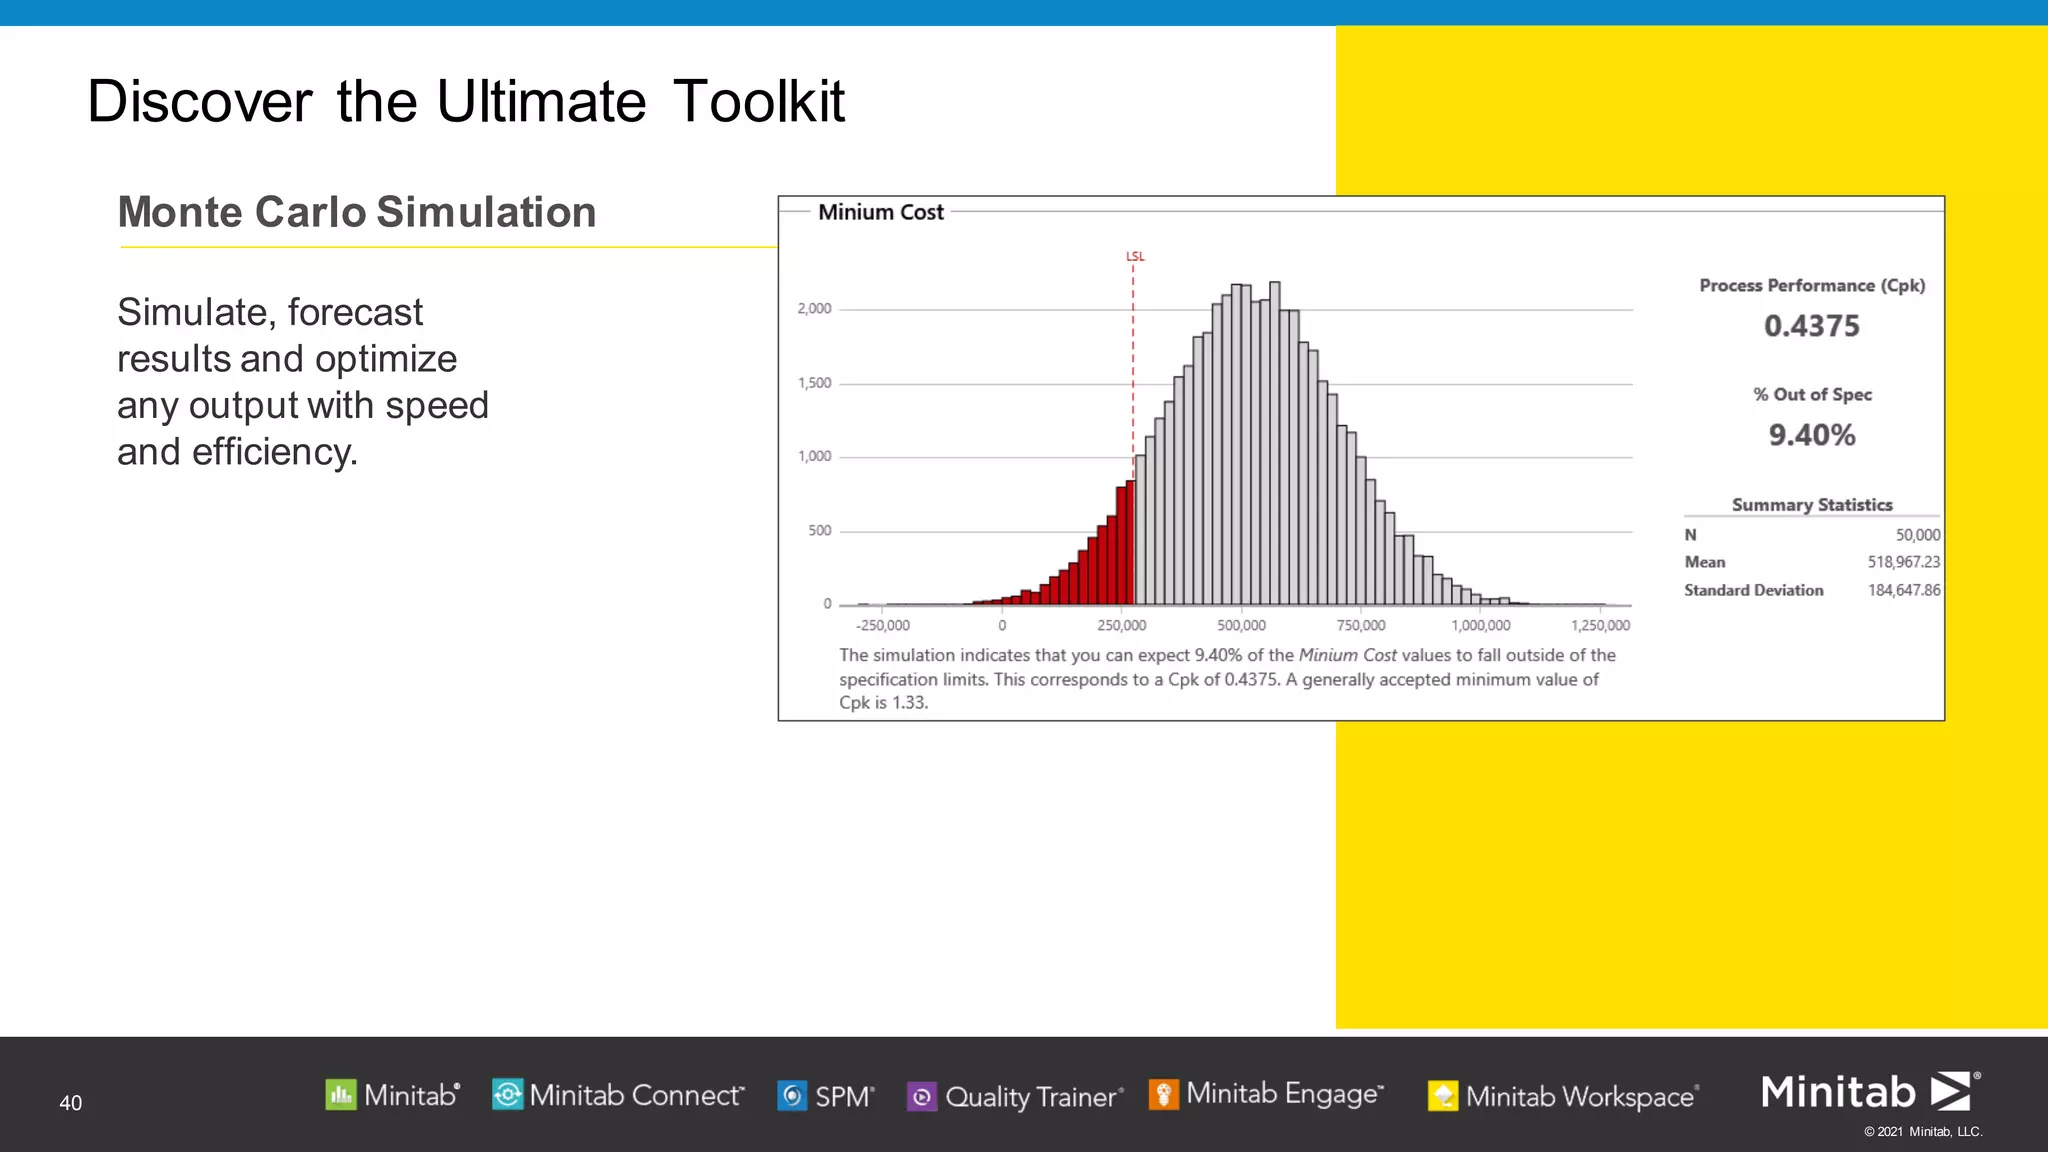
© 2021 Minitab, LLC.
AUDIO WEB: Please ensure you have your computer audio system activated and your speakers turned up.
Jenn Atlas
Global Market
Development
Manager
Daniel Creasap
Senior Marketing
Manager
Visualizations
that Make an Impact:
See What’s New with Minitab
Statistical Software
Welcome. The webinar will begin shortly.
See the Unknown with
Monte Carlo Simulation
© 2021 Minitab, LLC.
Monte Carlo
Simulation
with Process Optimization
Jennifer Atlas
Global Market Development
© 2021 Minitab, LLC.
Jenn studies how organizations solve
analytical problems to ensure that
Minitab delivers on our commitment to
make data analytics easier.
As a classically trained statistician, Jenn
has worked, trained and consulted in the
field of analytics for over 25 years.
Meet the Presenter:
Jennifer Atlas
Global Market DevelopmentManager
© 2021 Minitab, LLC.
Our History
4
2021
Today, Minitab
continues to help
discovery, innovation and
transformation. Thousands
of businesses and
universities worldwide
work with Minitab because
of our unique ability to
uncover insights and drive
change through the power
of data analysis.
1972
Three Penn State
professors created
Minitab Statistical
Software to easily
teach their students
statistics. The software
was rapidly adopted
by other schools and
revolutionized the way
people teach and
conduct data analysis.
50
YEARS
FOR
NEARLY
© 2021 Minitab, LLC.
Our Approach: More Than Business Analytics… Solutions Analytics
Software
Services
Training
Learn first-hand by attending public or
customized trainings in your facilities
according to your requirements.
Statistical Consulting
Personalized help with statistical challenges
from collecting the right data to interpreting
analysis more.
Support
Assistance with installation,
implementation, version updates
and license management.
Master statistics
and Minitab
anywhere with
online training
Machine learning
and predictive
analytics software
Start, track, manage,
and execute
innovation and
improvement initiatives
Powerful
statistical software
everyone can use
Predictive Modeling Visual Business Tools
Project Ideation & Execution
5
Visual tools to
process and product
excellence
Online Training
Solutions analytics is our integrated approach to providing software and services that enable organizations to make better decisions that drive business excellence.
Data Transformation​
Data access,
automation, and
governance for
comprehensive insights​
Data Analysis
© 2021 Minitab, LLC.
Monte Carlo
Monte Carlo represents a broad class of computational algorithms
that rely on repeated random sampling
© 2021 Minitab, LLC.
Monte Carlo Simulation
Accounts for risk in quantitative analysis and decision-making by
providing a range of possible outcomes based on the model
inputs and specifications.
© 2021 Minitab, LLC.
Monte Carlo Simulation
More simply, it provides expected values for a response(s) given a set of
equations.
It considers the uncertainty in the inputs in those equations to provide a
better estimate of the true values that can result for a response.
© 2021 Minitab, LLC.
Quantifying Uncertainty in the Inputs: Probability
Distributions
Normal
Lognormal
Uniform
Triangular
Exponential
Weibull
Poisson
Bernoulli
© 2021 Minitab, LLC.
Application: Assessing Project Schedule Risk
© 2021 Minitab, LLC.
Application: Assessing Project Schedule Risk
10 days
5 days 3 days
10 days 5 days
© 2021 Minitab, LLC.
Project Duration =
Define + Measure + Analyze + Improve + Control
5 days 10 days 5 days 3 days
= 33 days
5 days + 10 days + 10 days + 5 days + 3 days
© 2021 Minitab, LLC.
Project Duration =
Define + Measure + Analyze + Improve + Control
A Triangular Distribution is
defined by a lower bound,
the mode and an upper
bound
In this case: Triangular
(2,5,12)
© 2021 Minitab, LLC.
Define the Variation
© 2021 Minitab, LLC.
Estimate what percentage of
projects are expected to go
over 60 days
© 2021 Minitab, LLC.
Estimate what percentage
of projects are expected to
last longer than 60 days
© 2021 Minitab, LLC.
Results
© 2021 Minitab, LLC.
Better Estimates
Monte Carlo simulation can help with modeling, analyzing and
improving confidence for measurements
© 2021 Minitab, LLC.
Applications
▪ Telecommunications: Evaluate wireless
network performance
▪ Energy: Predict output of a wind farm
▪ Engineering: Predict process capability in a
fuel pump
▪ Consumer Goods: Predict viscosity in the
manufacturing of a dish detergent
▪ Finance: Value a project by estimating future
profits
▪ Healthcare: Predict claims processing times
▪ Accident Reconstruction: Evaluate road
friction to calculate possible speeds
19
© 2021 Minitab, LLC.
Example:
Roofing
Shingles
© 2021 Minitab, LLC.
Response: Granule Loss
A Fractional Factorial Design in 6 factors:
1. Press: Application Pressure (in psi)
2. Moisture: Amount of moisture on the shingle
3. Sheet Tension (in pounds)
4. Coating Viscosity (in centipoise)
5. Percentage of Filler used in the granule mix
6. Line Speed (in feet/minute)
© 2021 Minitab, LLC.
Develop the Transfer Function
© 2021 Minitab, LLC.
Minitab Model Fit
© 2021 Minitab, LLC.
2.5
2.0
1.5
1.0
0.5
20
15
10
5
0
32
24
16
8
16
12
8
4
0
40
38
36
34
32
30
20
15
10
5
0
2800
2400
2000
1600
1200
20
15
10
5
0
54
52
50
48
46
12
9
6
3
0
820
800
780
760
740
720
700
20
15
10
5
0
Moisture
Frequency
Press Sheet Tension
Viscosity Filler Line Speed
Histograms
Input Distributions
© 2021 Minitab, LLC.
Minitab Statistical Software:
Response Optimizer
© 2021 Minitab, LLC.
Monte Carlo Simulation
Input distributions
Transfer function(s)
Visual validation
© 2021 Minitab, LLC.
Results
© 2021 Minitab, LLC.
Identifies settings for the controllable input
parameters that result in a higher capability for the
process using mathematical solutions and genetic
algorithms.
Parameter Optimization
28
© 2021 Minitab, LLC.
Define Parameter Search Ranges
29
© 2021 Minitab, LLC.
Parameter
Optimization
Results
© 2021 Minitab, LLC.
Sensitivity Analysis
Allows you to see the effect of changing the standard deviation
of the X’s on the standard deviation or defect rate of Y.
© 2021 Minitab, LLC.
Sensitivity Analysis
33
© 2021 Minitab, LLC.
Monte Carlo Simulation with Parameter Optimization
and Sensitivity Analysis
33
© 2021 Minitab, LLC.
Easily Extensible
© 2021 Minitab, LLC.
Improve Faster
• Minitab Statistical Software generated the transfer function via a designed
experiment
• Minitab Workspace (and Minitab Engage) simulates
and optimizes product results to ensure they meet specifications. Creating better
estimates is easy with the Monte Carlo Simulation tool.
• The solutions make it easy to utilize y=f(x) equations, combined with the variability
of your inputs to predict process capability and identify the best strategy for
creating defect-free products.
© 2021 Minitab, LLC.
36
Minitab Engage is the only solution designed to
start, track, manage and share innovation and
improvement initiatives from idea generation
through execution.
Accelerating growth and improving profitability begins with
good ideas and ends with solid execution. Minitab Engage
helps organizations build improvement and innovation
programs, execute them with the help of problem-solving tools
and proven project management methodologies, then track
key performance metrics in real time to demonstrate ROI.
© 2021 Minitab, LLC.
Generate presentation-ready reports
Keep stakeholders engaged by easily creating reports and
dashboards
Monitor project status
Real time dashboards empower decision-making and strategic
course correction.
Track KPIs with dynamic dashboards
Visualize project status and performance metrics of your entire
initiative or focus on specific projects, teams or divisions.
Visualize: Deliver Insights That Inspire Action
37
Recognize and replicate success
Inspire teams throughout the organization to replicate successful
initiatives
© 2021 Minitab, LLC.
38
Powerful visual tools and forms are brought togetherin one intuitive
interface that helps you create processes,identify improvement
opportunities and make problems easierto solve.Combined they will help
you achieve the greatest impact, elevate your work, gain buy-in and
clearly communicate across teams with simple to use and understand
visuals right at your fingertips.
The ultimate toolkit designed to elevate your work by
helping you clearly visualize, optimize and map your
business value better than ever before.
© 2021 Minitab, LLC.
Visual Tools for Better Business Productivity
Over 90+ powerful and functional tools and roadmaps all in one easy-to-use platform
Process Improvement
Fishbone
ProcessMap
C&E Matrix
Monte Carlo Simulation
PFMEA
SIPOC
DOE Planning
Funnel Report
Pareto Chart
Audit Plan
Solution Implementation
Checklist
DMAIC Roadmap
PDCA Roadmap
Lean
Value Stream Map
A3
Work ElementTime Study
5S Audit
Kanban & Supermarket Sizing
Quick Changeover(QCO-SMED)
Waste Analysis by Operation
GembaWalk Interview Sheet
Force Field
Value Stream Map Comparison
Preventative Maintenance
Cycle Time Bar Chart
Kaizen Event Roadmap
Project Management
Gantt Chart
Meeting Minutes
StakeholderAnalysis
RACI (ResponsibliityAssignment
Matrix)
30-60-90ActionPlan
ProjectRisk Assessment
Root-Cause Analysis
IdeaMap
Five Whys
4S
8P
Decision-Making
Impactvs. EffortMatrix
Solution Desirability Matrix
ProjectPrioritization Matrix
Pairwise ComparisonMatrix
Product Development
DFMEA
Kano Model
VOC Plan
SWOT Analysis
Critical To Tree
House of Quality Matrix
CDOV Roadmap
© 2021 Minitab, LLC.
Discover the Ultimate Toolkit
40
Monte Carlo Simulation
Simulate, forecast
results and optimize
any output with speed
and efficiency.
42
© 2021 Minitab, LLC.
Thank You!
42
From all of us at

Minitab webinar presentation See the unknown with monte carlo simulation

  • 1.
    © 2021 Minitab,LLC. AUDIO WEB: Please ensure you have your computer audio system activated and your speakers turned up. Jenn Atlas Global Market Development Manager Daniel Creasap Senior Marketing Manager Visualizations that Make an Impact: See What’s New with Minitab Statistical Software Welcome. The webinar will begin shortly. See the Unknown with Monte Carlo Simulation
  • 2.
    © 2021 Minitab,LLC. Monte Carlo Simulation with Process Optimization Jennifer Atlas Global Market Development
  • 3.
    © 2021 Minitab,LLC. Jenn studies how organizations solve analytical problems to ensure that Minitab delivers on our commitment to make data analytics easier. As a classically trained statistician, Jenn has worked, trained and consulted in the field of analytics for over 25 years. Meet the Presenter: Jennifer Atlas Global Market DevelopmentManager
  • 4.
    © 2021 Minitab,LLC. Our History 4 2021 Today, Minitab continues to help discovery, innovation and transformation. Thousands of businesses and universities worldwide work with Minitab because of our unique ability to uncover insights and drive change through the power of data analysis. 1972 Three Penn State professors created Minitab Statistical Software to easily teach their students statistics. The software was rapidly adopted by other schools and revolutionized the way people teach and conduct data analysis. 50 YEARS FOR NEARLY
  • 5.
    © 2021 Minitab,LLC. Our Approach: More Than Business Analytics… Solutions Analytics Software Services Training Learn first-hand by attending public or customized trainings in your facilities according to your requirements. Statistical Consulting Personalized help with statistical challenges from collecting the right data to interpreting analysis more. Support Assistance with installation, implementation, version updates and license management. Master statistics and Minitab anywhere with online training Machine learning and predictive analytics software Start, track, manage, and execute innovation and improvement initiatives Powerful statistical software everyone can use Predictive Modeling Visual Business Tools Project Ideation & Execution 5 Visual tools to process and product excellence Online Training Solutions analytics is our integrated approach to providing software and services that enable organizations to make better decisions that drive business excellence. Data Transformation​ Data access, automation, and governance for comprehensive insights​ Data Analysis
  • 6.
    © 2021 Minitab,LLC. Monte Carlo Monte Carlo represents a broad class of computational algorithms that rely on repeated random sampling
  • 7.
    © 2021 Minitab,LLC. Monte Carlo Simulation Accounts for risk in quantitative analysis and decision-making by providing a range of possible outcomes based on the model inputs and specifications.
  • 8.
    © 2021 Minitab,LLC. Monte Carlo Simulation More simply, it provides expected values for a response(s) given a set of equations. It considers the uncertainty in the inputs in those equations to provide a better estimate of the true values that can result for a response.
  • 9.
    © 2021 Minitab,LLC. Quantifying Uncertainty in the Inputs: Probability Distributions Normal Lognormal Uniform Triangular Exponential Weibull Poisson Bernoulli
  • 10.
    © 2021 Minitab,LLC. Application: Assessing Project Schedule Risk
  • 11.
    © 2021 Minitab,LLC. Application: Assessing Project Schedule Risk 10 days 5 days 3 days 10 days 5 days
  • 12.
    © 2021 Minitab,LLC. Project Duration = Define + Measure + Analyze + Improve + Control 5 days 10 days 5 days 3 days = 33 days 5 days + 10 days + 10 days + 5 days + 3 days
  • 13.
    © 2021 Minitab,LLC. Project Duration = Define + Measure + Analyze + Improve + Control A Triangular Distribution is defined by a lower bound, the mode and an upper bound In this case: Triangular (2,5,12)
  • 14.
    © 2021 Minitab,LLC. Define the Variation
  • 15.
    © 2021 Minitab,LLC. Estimate what percentage of projects are expected to go over 60 days
  • 16.
    © 2021 Minitab,LLC. Estimate what percentage of projects are expected to last longer than 60 days
  • 17.
    © 2021 Minitab,LLC. Results
  • 18.
    © 2021 Minitab,LLC. Better Estimates Monte Carlo simulation can help with modeling, analyzing and improving confidence for measurements
  • 19.
    © 2021 Minitab,LLC. Applications ▪ Telecommunications: Evaluate wireless network performance ▪ Energy: Predict output of a wind farm ▪ Engineering: Predict process capability in a fuel pump ▪ Consumer Goods: Predict viscosity in the manufacturing of a dish detergent ▪ Finance: Value a project by estimating future profits ▪ Healthcare: Predict claims processing times ▪ Accident Reconstruction: Evaluate road friction to calculate possible speeds 19
  • 20.
    © 2021 Minitab,LLC. Example: Roofing Shingles
  • 21.
    © 2021 Minitab,LLC. Response: Granule Loss A Fractional Factorial Design in 6 factors: 1. Press: Application Pressure (in psi) 2. Moisture: Amount of moisture on the shingle 3. Sheet Tension (in pounds) 4. Coating Viscosity (in centipoise) 5. Percentage of Filler used in the granule mix 6. Line Speed (in feet/minute)
  • 22.
    © 2021 Minitab,LLC. Develop the Transfer Function
  • 23.
    © 2021 Minitab,LLC. Minitab Model Fit
  • 24.
    © 2021 Minitab,LLC. 2.5 2.0 1.5 1.0 0.5 20 15 10 5 0 32 24 16 8 16 12 8 4 0 40 38 36 34 32 30 20 15 10 5 0 2800 2400 2000 1600 1200 20 15 10 5 0 54 52 50 48 46 12 9 6 3 0 820 800 780 760 740 720 700 20 15 10 5 0 Moisture Frequency Press Sheet Tension Viscosity Filler Line Speed Histograms Input Distributions
  • 25.
    © 2021 Minitab,LLC. Minitab Statistical Software: Response Optimizer
  • 26.
    © 2021 Minitab,LLC. Monte Carlo Simulation Input distributions Transfer function(s) Visual validation
  • 27.
    © 2021 Minitab,LLC. Results
  • 28.
    © 2021 Minitab,LLC. Identifies settings for the controllable input parameters that result in a higher capability for the process using mathematical solutions and genetic algorithms. Parameter Optimization 28
  • 29.
    © 2021 Minitab,LLC. Define Parameter Search Ranges 29
  • 30.
    © 2021 Minitab,LLC. Parameter Optimization Results
  • 31.
    © 2021 Minitab,LLC. Sensitivity Analysis Allows you to see the effect of changing the standard deviation of the X’s on the standard deviation or defect rate of Y.
  • 32.
    © 2021 Minitab,LLC. Sensitivity Analysis
  • 33.
    33 © 2021 Minitab,LLC. Monte Carlo Simulation with Parameter Optimization and Sensitivity Analysis 33
  • 34.
    © 2021 Minitab,LLC. Easily Extensible
  • 35.
    © 2021 Minitab,LLC. Improve Faster • Minitab Statistical Software generated the transfer function via a designed experiment • Minitab Workspace (and Minitab Engage) simulates and optimizes product results to ensure they meet specifications. Creating better estimates is easy with the Monte Carlo Simulation tool. • The solutions make it easy to utilize y=f(x) equations, combined with the variability of your inputs to predict process capability and identify the best strategy for creating defect-free products.
  • 36.
    © 2021 Minitab,LLC. 36 Minitab Engage is the only solution designed to start, track, manage and share innovation and improvement initiatives from idea generation through execution. Accelerating growth and improving profitability begins with good ideas and ends with solid execution. Minitab Engage helps organizations build improvement and innovation programs, execute them with the help of problem-solving tools and proven project management methodologies, then track key performance metrics in real time to demonstrate ROI.
  • 37.
    © 2021 Minitab,LLC. Generate presentation-ready reports Keep stakeholders engaged by easily creating reports and dashboards Monitor project status Real time dashboards empower decision-making and strategic course correction. Track KPIs with dynamic dashboards Visualize project status and performance metrics of your entire initiative or focus on specific projects, teams or divisions. Visualize: Deliver Insights That Inspire Action 37 Recognize and replicate success Inspire teams throughout the organization to replicate successful initiatives
  • 38.
    © 2021 Minitab,LLC. 38 Powerful visual tools and forms are brought togetherin one intuitive interface that helps you create processes,identify improvement opportunities and make problems easierto solve.Combined they will help you achieve the greatest impact, elevate your work, gain buy-in and clearly communicate across teams with simple to use and understand visuals right at your fingertips. The ultimate toolkit designed to elevate your work by helping you clearly visualize, optimize and map your business value better than ever before.
  • 39.
    © 2021 Minitab,LLC. Visual Tools for Better Business Productivity Over 90+ powerful and functional tools and roadmaps all in one easy-to-use platform Process Improvement Fishbone ProcessMap C&E Matrix Monte Carlo Simulation PFMEA SIPOC DOE Planning Funnel Report Pareto Chart Audit Plan Solution Implementation Checklist DMAIC Roadmap PDCA Roadmap Lean Value Stream Map A3 Work ElementTime Study 5S Audit Kanban & Supermarket Sizing Quick Changeover(QCO-SMED) Waste Analysis by Operation GembaWalk Interview Sheet Force Field Value Stream Map Comparison Preventative Maintenance Cycle Time Bar Chart Kaizen Event Roadmap Project Management Gantt Chart Meeting Minutes StakeholderAnalysis RACI (ResponsibliityAssignment Matrix) 30-60-90ActionPlan ProjectRisk Assessment Root-Cause Analysis IdeaMap Five Whys 4S 8P Decision-Making Impactvs. EffortMatrix Solution Desirability Matrix ProjectPrioritization Matrix Pairwise ComparisonMatrix Product Development DFMEA Kano Model VOC Plan SWOT Analysis Critical To Tree House of Quality Matrix CDOV Roadmap
  • 40.
    © 2021 Minitab,LLC. Discover the Ultimate Toolkit 40 Monte Carlo Simulation Simulate, forecast results and optimize any output with speed and efficiency.
  • 41.
    42 © 2021 Minitab,LLC. Thank You! 42 From all of us at