
Recommended
Recommended
More Related Content
What's hot
What's hot (20)
Similar to Milwaukee Listing Service - Houing Supply Overview April 2017
Similar to Milwaukee Listing Service - Houing Supply Overview April 2017 (20)
Recently uploaded
Recently uploaded (20)
Milwaukee Listing Service - Houing Supply Overview April 2017
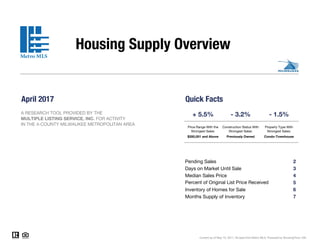
- 1. April 2017 Quick Facts $350,001 and Above Previously Owned Pending Sales 2 Days on Market Until Sale 3 Median Sales Price 4 5 Inventory of Homes for Sale 6 Months Supply of Inventory 7 A RESEARCH TOOL PROVIDED BY THE MULTIPLE LISTING SERVICE, INC. FOR ACTIVITY IN THE 4-COUNTY MILWAUKEE METROPOLITAN AREA Housing Supply Overview Current as of May 10, 2017. All data from Metro MLS. Powered by ShowingTime 10K. + 5.5% - 1.5%- 3.2% Price Range With the Strongest Sales: Construction Status With Strongest Sales: Property Type With Strongest Sales: Condo-Townhouse Percent of Original List Price Received
- 2. Pending Sales By Price Range 4-2016 4-2017 Change 4-2016 4-2017 Change 4-2016 4-2017 Change $100,000 and Below 2,866 2,592 - 9.6% 2,115 1,929 - 8.8% 751 663 - 11.7% $100,001 to $150,000 3,429 3,248 - 5.3% 2,536 2,445 - 3.6% 893 803 - 10.1% $150,001 to $200,000 3,351 3,208 - 4.3% 2,712 2,485 - 8.4% 639 723 + 13.1% $200,001 to $250,000 4,725 4,549 - 3.7% 4,135 3,967 - 4.1% 590 582 - 1.4% $250,001 to $350,000 1,271 1,277 + 0.5% 1,113 1,102 - 1.0% 158 175 + 10.8% $350,001 and Above 2,895 3,054 + 5.5% 2,633 2,758 + 4.7% 262 296 + 13.0% All Price Ranges 18,537 17,930 - 3.3% 15,244 14,688 - 3.6% 3,293 3,242 - 1.5% By Construction Status 4-2016 4-2017 Change 4-2016 4-2017 Change 4-2016 4-2017 Change Previously Owned 17,976 17,397 - 3.2% 14,839 14,301 - 3.6% 3,137 3,096 - 1.3% New Construction 560 532 - 5.0% 405 386 - 4.7% 155 146 - 5.8% All Construction Statuses 18,537 17,930 - 3.3% 15,244 14,688 - 3.6% 3,293 3,242 - 1.5% A count of properties on which offers have been accepted. Based on a rolling 12-month total. All data comes from Metro MLS for activity in the 4-County Milwaukee Metropolitan Area. Powered by ShowingTime 10K. | 2 All Properties Single-Family Condo-Townhouse 2,866 3,429 3,351 4,725 1,271 2,895 2,592 3,248 3,208 4,549 1,277 3,054 $100,000 and Below $100,001 to $150,000 $150,001 to $200,000 $200,001 to $250,000 $250,001 to $350,000 $350,001 and Above By Price Range 4-2016 4-2017 17,976 560 17,397 532 Previously Owned New Construction By Construction Status 4-2016 4-2017 - 9.6% 15,244 3,293 14,688 3,242 Single-Family Condo-Townhouse By Property Type 4-2016 4-2017 - 5.3% - 4.3% + 0.5% + 5.5% - 3.6% - 1.5%- 3.2%- 3.7% - 5.0%
- 3. Days on Market Until Sale By Price Range 4-2016 4-2017 Change 4-2016 4-2017 Change 4-2016 4-2017 Change $100,000 and Below 86 77 - 10.5% 86 77 - 10.5% 87 76 - 12.6% $100,001 to $150,000 77 64 - 16.9% 77 66 - 14.3% 76 60 - 21.1% $150,001 to $200,000 66 53 - 19.7% 65 51 - 21.5% 69 57 - 17.4% $200,001 to $250,000 62 50 - 19.4% 61 49 - 19.7% 76 60 - 21.1% $250,001 to $350,000 73 59 - 19.2% 67 56 - 16.4% 114 85 - 25.4% $350,001 and Above 87 85 - 2.3% 86 85 - 1.2% 100 85 - 15.0% All Price Ranges 74 64 - 13.5% 73 63 - 13.7% 81 66 - 18.5% By Construction Status 4-2016 4-2017 Change 4-2016 4-2017 Change 4-2016 4-2017 Change Previously Owned 72 61 - 15.3% 71 61 - 14.1% 78 63 - 19.2% New Construction 139 148 + 6.5% 137 149 + 8.8% 144 146 + 1.4% All Construction Statuses 74 64 - 13.5% 73 63 - 13.7% 81 66 - 18.5% Average number of days between when a property is listed and when an offer is accepted. Based on a rolling 12-month average. All data comes from Metro MLS for activity in the 4-County Milwaukee Metropolitan Area. Powered by ShowingTime 10K. | 3 All Properties Single-Family Condo-Townhouse 86 77 66 62 73 87 77 64 53 50 59 85 $100,000 and Below $100,001 to $150,000 $150,001 to $200,000 $200,001 to $250,000 $250,001 to $350,000 $350,001 and Above By Price Range 4-2016 4-2017 72 139 61 148 Previously Owned New Construction By Construction Status 4-2016 4-2017 - 10.5% 73 81 63 66 Single-Family Condo-Townhouse By Property Type 4-2016 4-2017 - 16.9% - 19.7% - 19.2% - 2.3% - 13.7% - 18.5%- 15.3%- 19.4% + 6.5%
- 4. Median Sales Price By Construction Status 4-2016 4-2017 Change 4-2016 4-2017 Change 4-2016 4-2017 Change Previously Owned $184,500 $192,000 + 4.1% $198,500 $205,950 + 3.8% $140,000 $153,000 + 9.3% New Construction $352,575 $370,000 + 4.9% $370,000 $385,500 + 4.2% $333,950 $349,900 + 4.8% All Construction Statuses $188,500 $197,050 + 4.5% $202,400 $210,000 + 3.8% $145,000 $156,700 + 8.1% All data comes from Metro MLS for activity in the 4-County Milwaukee Metropolitan Area. Powered by ShowingTime 10K. | 4 Median price point for all closed sales, not accounting for seller concessions. Based on a rolling 12-month median. All Properties Single-Family Condo-Townhouse $184,500 $352,575 $192,000 $370,000 Previously Owned New Construction By Construction Status 4-2016 4-2017 $188,500 $202,400 $145,000 $197,050 $210,000 $156,700 All Properties Single-Family Condo-Townhouse By Property Type 4-2016 4-2017 + 3.8% + 8.1%+ 4.1% + 4.5%+ 4.9%
- 5. Percent of Original List Price Received By Price Range 4-2016 4-2017 Change 4-2016 4-2017 Change 4-2016 4-2017 Change $100,000 and Below 88.2% 89.5% + 1.5% 87.5% 88.8% + 1.5% 90.1% 91.6% + 1.7% $100,001 to $150,000 94.3% 95.5% + 1.3% 94.0% 95.3% + 1.4% 95.0% 96.1% + 1.2% $150,001 to $200,000 95.8% 96.9% + 1.1% 95.8% 96.8% + 1.0% 95.8% 97.2% + 1.5% $200,001 to $250,000 96.6% 97.4% + 0.8% 96.6% 97.4% + 0.8% 96.6% 96.9% + 0.3% $250,001 to $350,000 96.7% 97.4% + 0.7% 96.6% 97.3% + 0.7% 97.4% 98.4% + 1.0% $350,001 and Above 95.4% 96.0% + 0.6% 95.2% 95.6% + 0.4% 97.3% 98.6% + 1.3% All Price Ranges 94.4% 95.5% + 1.2% 94.4% 95.4% + 1.1% 94.4% 95.9% + 1.6% By Construction Status 4-2016 4-2017 Change 4-2016 4-2017 Change 4-2016 4-2017 Change Previously Owned 94.2% 95.4% + 1.3% 94.3% 95.4% + 1.2% 94.0% 95.5% + 1.6% New Construction 99.4% 100.1% + 0.7% 98.5% 98.7% + 0.2% 102.0% 103.7% + 1.7% All Construction Statuses 94.4% 95.5% + 1.2% 94.4% 95.4% + 1.1% 94.4% 95.9% + 1.6% Percentage found when dividing a property’s sales price by its original list price, then taking the average for all properties sold, not accounting for seller concessions. Based on a rolling 12-month average. All data comes from Metro MLS for activity in the 4-County Milwaukee Metropolitan Area. Powered by ShowingTime 10K. | 5 All Properties Single-Family Condo-Townhouse 88.2% 94.3% 95.8% 96.6% 96.7% 95.4% 89.5% 95.5% 96.9% 97.4% 97.4% 96.0% $100,000 and Below $100,001 to $150,000 $150,001 to $200,000 $200,001 to $250,000 $250,001 to $350,000 $350,001 and Above By Price Range 4-2016 4-2017 94.2% 99.4% 95.4% 100.1% Previously Owned New Construction By Construction Status 4-2016 4-2017 + 1.5% 94.4% 94.4% 95.4% 95.9% Single-Family Condo-Townhouse By Property Type 4-2016 4-2017 + 1.3% + 1.1% + 0.7% + 0.6% + 1.1% + 1.6%+ 1.3%+ 0.8% + 0.7%
- 6. Inventory of Homes for Sale The number of properties available for sale in active status at the end of the most recent month. Based on one month of activity. By Price Range 4-2016 4-2017 Change 4-2016 4-2017 Change 4-2016 4-2017 Change $100,000 and Below 994 818 - 17.7% 742 642 - 13.5% 252 176 - 30.2% $100,001 to $150,000 1,059 928 - 12.4% 849 739 - 13.0% 210 189 - 10.0% $150,001 to $200,000 808 872 + 7.9% 598 669 + 11.9% 210 203 - 3.3% $200,001 to $250,000 1,013 1,045 + 3.2% 839 846 + 0.8% 174 199 + 14.4% $250,001 to $350,000 353 406 + 15.0% 273 335 + 22.7% 80 71 - 11.3% $350,001 and Above 1,609 1,696 + 5.4% 1,470 1,546 + 5.2% 139 150 + 7.9% All Price Ranges 5,837 5,765 - 1.2% 4,772 4,777 + 0.1% 1,065 988 - 7.2% By Construction Status 4-2016 4-2017 Change 4-2016 4-2017 Change 4-2016 4-2017 Change Previously Owned 5,478 5,399 - 1.4% 4,508 4,510 + 0.0% 970 889 - 8.4% New Construction 359 366 + 1.9% 264 267 + 1.1% 95 99 + 4.2% All Construction Statuses 5,837 5,765 - 1.2% 4,772 4,777 + 0.1% 1,065 988 - 7.2% All data comes from Metro MLS for activity in the 4-County Milwaukee Metropolitan Area. Powered by ShowingTime 10K. | 6 All Properties Single-Family Condo-Townhouse 994 1,059 808 1,013 353 1,609 818 928 872 1,045 406 1,696 $100,000 and Below $100,001 to $150,000 $150,001 to $200,000 $200,001 to $250,000 $250,001 to $350,000 $350,001 and Above By Price Range 4-2016 4-2017 5,478 359 5,399 366 Previously Owned New Construction By Construction Status 4-2016 4-2017 - 17.7% 4,772 1,065 4,777 988 Single-Family Condo-Townhouse By Property Type 4-2016 4-2017 - 12.4% + 7.9% + 15.0% + 5.4% + 0.1% - 7.2%- 1.4%+ 3.2% + 1.9%
- 7. Months Supply of Inventory The inventory of homes for sale at the end of the most recent month, based on one month of activity, divided by the average monthly pending sales from the last 12 months. By Price Range 4-2016 4-2017 Change 4-2016 4-2017 Change 4-2016 4-2017 Change $100,000 and Below 4.2 3.8 - 9.5% 4.2 4.0 - 4.8% 4.0 3.2 - 20.0% $100,001 to $150,000 3.7 3.4 - 8.1% 4.0 3.6 - 10.0% 2.8 2.8 0.0% $150,001 to $200,000 2.9 3.3 + 13.8% 2.6 3.2 + 23.1% 3.9 3.4 - 12.8% $200,001 to $250,000 2.6 2.8 + 7.7% 2.4 2.6 + 8.3% 3.5 4.1 + 17.1% $250,001 to $350,000 3.3 3.8 + 15.2% 2.9 3.6 + 24.1% 6.1 4.9 - 19.7% $350,001 and Above 6.7 6.7 0.0% 6.7 6.7 0.0% 6.4 6.1 - 4.7% All Price Ranges 3.8 3.9 + 2.6% 3.8 3.9 + 2.6% 3.9 3.7 - 5.1% By Construction Status 4-2016 4-2017 Change 4-2016 4-2017 Change 4-2016 4-2017 Change Previously Owned 4.3 3.3 - 23.3% 4.3 3.3 - 23.3% 4.2 2.9 - 31.0% New Construction 8.6 7.9 - 8.1% 7.5 8.2 + 9.3% 12.0 7.2 - 40.0% All Construction Statuses 3.8 3.9 + 2.6% 3.8 3.9 + 2.6% 3.9 3.7 - 5.1% All data comes from Metro MLS for activity in the 4-County Milwaukee Metropolitan Area. Powered by ShowingTime 10K. | 7 All Properties Single-Family Condo-Townhouse 4.2 3.7 2.9 2.6 3.3 6.7 3.8 3.4 3.3 2.8 3.8 6.7 $100,000 and Below $100,001 to $150,000 $150,001 to $200,000 $200,001 to $250,000 $250,001 to $350,000 $350,001 and Above By Price Range 4-2016 4-2017 4.3 8.6 3.3 7.9 Previously Owned New Construction By Construction Status 4-2016 4-2017 - 9.5% 3.8 3.9 3.9 3.7 Single-Family Condo-Townhouse By Property Type 4-2016 4-2017 - 8.1% + 13.8% + 15.2% 0.0% + 2.6% - 5.1%- 23.3%+ 7.7% - 8.1%