SlideShare a Scribd company logo
1 of 15
Download to read offline
Monthly Indicators
September 2017 Quick Facts
Year-Over-Year
Change in
Year-Over-Year
Change in
Closed Sales Median Sales Price
2
3
4
5
6
7
8
9
10
11
12
13
14
15Months Supply of Homes for Sale
- 3.9% + 9.2% - 17.5%
Year-Over-Year
Change in
Housing Affordability Index
Inventory of Homes for Sale
Current as of October 5, 2017. Data is refreshed regularly to capture changes in market activity. Figures shown may be different than previously
reported. All data from CarolinaMLS, Inc. Report provided by the Charlotte Regional Realtor® Association. Report © 2017 ShowingTime. | 1
Every market is unique, yet the national sentiment has given rise to the notion that
housing markets are stalling. Although desirous buyers are out on an increasing
number of showings, there remains a limited number of desirable listings. And
although mortgage rates have remained enticingly low, home prices have reached
unaffordable levels for many new entrants into the housing pool at exactly the same
time that established owners are proving to be less interested in moving.
New Listings were up in the Charlotte region 3.3 percent to 4,700. Pending Sales
increased 16.4 percent to 4,137. Inventory shrank 17.5 percent to 10,140 units.
Prices moved higher as Median Sales Price was up 9.2 percent to $225,000.
Months Supply of Homes for Sale was down 24.2 percent to 2.5 months, indicating
that demand increased relative to supply.
Last year at this time, the national storyline was about how high demand was
propping up sales and prices despite low inventory and months of supply. That has
actually continued to be a familiar refrain for many months in 2017 and now for the
past couple of years. But with the likes of Hurricanes Harvey and Irma, different
employment outlooks, disparate incomes, varying new construction expectations
and potential housing policy shifts, regional differences are becoming more
prevalent and pronounced.
Pending Sales
Closed Sales
List to Close
Days on Market Until Sale
Cumulative Days on Market Until Sale
Average List Price
Homes for Sale
A research tool provided by the Charlotte Regional Realtor® Association. For
more information, contact a Realtor®. Percent changes are calculated using
rounded figures.
Market Overview
New Listings
Average Sales Price
Median Sales Price
Percent of Original List Price Received
Market Overview
9-2016 9-2017 Percent Change YTD 2016 YTD 2017 Percent Change
+ 6.3% $301,146
+ 6.1% $257,726 $273,186
+ 0.7%
-- --
Percent of Original
List Price Received
96.2% 96.7% + 0.5% 96.3% 97.0%
Months Supply
of Homes for Sale
3.3 2.5 - 24.2% --
- 15.6%
Average List Price $298,173 $316,868
- 16.4%
List to Close 99 90 - 9.1% 108 98
+ 6.0%
Median Sales Price $206,000 $225,000 + 9.2% $206,000 $226,500 + 10.0%
Average Sales Price $256,092 $271,606
Key metrics by report month and for year-to-date (YTD) starting from the first of the year.
New Listings 4,550 4,700 + 3.3% 47,598 + 4.9%
Pending Sales 3,555 4,137 + 16.4% 36,095 38,565 + 6.8%
45,366
Historical SparkbarsKey Metrics
Current as of October 5, 2017. Data is refreshed regularly to capture changes in market activity. Figures shown may be different than previously
reported. All data from CarolinaMLS, Inc. Report provided by the Charlotte Regional Realtor® Association. Report © 2017 ShowingTime. | 2
Note: CarolinaMLS did not include “showable” under contract listings in the “Pending Sales” stats before July 2012. Listing agents report listings as “Under Contract-Show” earlier in the transaction. As a result, the new “Pending Sales” stats trend higher and the new
“Months Supply of Inventory” stats trend lower since July 2012. | Data is refreshed regularly to capture changes in market activity. Figures shown may be different than previously reported.
Closed Sales 4,121 3,960 - 3.9% 34,053 36,127 + 6.1%
$316,232 + 5.0%
Cumulative Days on Market 54 49 - 9.3% 64 54
- 9.3%
Days on Market Until Sale 47 39 - 17.0% 55 46
Housing Affordability Index 117 108 - 7.7% 117 107 - 8.5%
Inventory of Homes for Sale 12,297 10,140 - 17.5% -- -- --
9-2015 9-2016 9-2017
9-2015 9-2016 9-2017
9-2015 9-2016 9-2017
9-2015 9-2016 9-2017
9-2015 9-2016 9-2017
9-2015 9-2016 9-2017
9-2015 9-2016 9-2017
9-2015 9-2016 9-2017
9-2015 9-2016 9-2017
9-2015 9-2016 9-2017
9-2015 9-2016 9-2017
9-2015 9-2016 9-2017
9-2015 9-2016 9-2017
New Listings
Prior Year Percent Change
October 2016 4,205 4,042 +4.0%
November 2016 3,422 3,070 +11.5%
December 2016 2,584 2,428 +6.4%
January 2017 3,986 3,762 +6.0%
February 2017 4,744 4,096 +15.8%
March 2017 6,066 5,649 +7.4%
April 2017 5,580 5,765 -3.2%
May 2017 5,981 5,680 +5.3%
June 2017 5,698 5,652 +0.8%
July 2017 5,442 5,123 +6.2%
August 2017 5,401 5,089 +6.1%
September 2017 4,700 4,550 +3.3%
12-Month Avg 4,817 4,576 +5.3%
Historical New Listings by Month
Current as of October 5, 2017. Data is refreshed regularly to capture changes in market activity. Figures shown may be different than previously
reported. All data from CarolinaMLS, Inc. Report provided by the Charlotte Regional Realtor® Association. Report © 2017 ShowingTime. | 3
A count of the properties that have been newly listed on the market in a given month.
New Listings
4,385 4,550 4,700
2015 2016 2017
September
2,000
3,000
4,000
5,000
6,000
7,000
8,000
1-2004 1-2005 1-2006 1-2007 1-2008 1-2009 1-2010 1-2011 1-2012 1-2013 1-2014 1-2015 1-2016 1-2017
44,046 45,366
47,598
2015 2016 2017
Year to Date
+ 4.9%+ 3.8% + 3.3% + 3.0%+ 4.7% + 2.9%
Pending Sales
Prior Year Percent Change
October 2016 3,617 3,149 +14.9%
November 2016 3,048 2,658 +14.7%
December 2016 2,499 2,232 +12.0%
January 2017 3,273 3,018 +8.4%
February 2017 3,822 3,570 +7.1%
March 2017 4,680 4,404 +6.3%
April 2017 4,567 4,620 -1.1%
May 2017 4,737 4,477 +5.8%
June 2017 4,596 4,268 +7.7%
July 2017 4,329 4,067 +6.4%
August 2017 4,424 4,116 +7.5%
September 2017 4,137 3,555 +16.4%
12-Month Avg 3,977 3,678 +8.1%
Historical Pending Sales by Month
Current as of October 5, 2017. Data is refreshed regularly to capture changes in market activity. Figures shown may be different than previously
reported. All data from CarolinaMLS, Inc. Report provided by the Charlotte Regional Realtor® Association. Report © 2017 ShowingTime. | 4
A count of the properties on which contracts have been accepted in a given month.
Pending contracts include "Under Contract-Show" and "Under Contract-No Show" statuses.
Pending Sales
3,297
3,555
4,137
2015 2016 2017
September
1,000
2,000
3,000
4,000
5,000
1-2004 1-2005 1-2006 1-2007 1-2008 1-2009 1-2010 1-2011 1-2012 1-2013 1-2014 1-2015 1-2016 1-2017
33,233
36,095
38,565
2015 2016 2017
Year to Date
+ 6.8%+ 7.8% + 16.4% + 8.6%+ 11.0% + 15.9%
Closed Sales
Prior Year Percent Change
October 2016 3,572 3,306 +8.0%
November 2016 3,387 2,655 +27.6%
December 2016 3,720 3,333 +11.6%
January 2017 2,617 2,170 +20.6%
February 2017 2,739 2,557 +7.1%
March 2017 4,211 3,558 +18.4%
April 2017 3,824 3,868 -1.1%
May 2017 4,562 4,290 +6.3%
June 2017 5,189 4,903 +5.8%
July 2017 4,416 4,119 +7.2%
August 2017 4,609 4,467 +3.2%
September 2017 3,960 4,121 -3.9%
12-Month Avg 3,901 3,612 +8.0%
Historical Closed Sales by Month
Current as of October 5, 2017. Data is refreshed regularly to capture changes in market activity. Figures shown may be different than previously
reported. All data from CarolinaMLS, Inc. Report provided by the Charlotte Regional Realtor® Association. Report © 2017 ShowingTime. | 5
A count of the actual sales that closed in a given month.
Closed Sales
3,721
4,121 3,960
2015 2016 2017
September
1,000
2,000
3,000
4,000
5,000
6,000
1-2004 1-2005 1-2006 1-2007 1-2008 1-2009 1-2010 1-2011 1-2012 1-2013 1-2014 1-2015 1-2016 1-2017
31,644
34,053
36,127
2015 2016 2017
Year to Date
+ 6.1%+ 10.7% - 3.9% + 7.6%+ 14.9% + 15.4%
List to Close
Prior Year Percent Change
October 2016 104 113 -8.0%
November 2016 104 116 -10.3%
December 2016 111 120 -7.5%
January 2017 115 121 -5.0%
February 2017 113 126 -10.3%
March 2017 105 122 -13.9%
April 2017 97 113 -14.2%
May 2017 97 106 -8.5%
June 2017 94 102 -7.8%
July 2017 91 101 -9.9%
August 2017 91 98 -7.1%
September 2017 90 99 -9.1%
12-Month Avg* 100 110 -9.1%
Historical List to Close by Month
Current as of October 5, 2017. Data is refreshed regularly to capture changes in market activity. Figures shown may be different than previously
reported. All data from CarolinaMLS, Inc. Report provided by the Charlotte Regional Realtor® Association. Report © 2017 ShowingTime. | 6
List to Close provides the total number of days specific to the MLS number from "Listing Date" to "Sold Date."
List to Close
* List to Close for all properties from October 2016 through September 2017. This is
not the average of the individual figures above.
112
99
90
2015 2016 2017
September
80
100
120
140
160
180
1-2004 1-2005 1-2006 1-2007 1-2008 1-2009 1-2010 1-2011 1-2012 1-2013 1-2014 1-2015 1-2016 1-2017
117
108
98
2015 2016 2017
Year to Date
- 9.3%- 11.6% - 9.1% - 7.7%- 9.7% - 6.4%
Days on Market Until Sale
Prior Year Percent Change
October 2016 51 61 -16.4%
November 2016 49 62 -21.0%
December 2016 54 63 -14.3%
January 2017 55 66 -16.7%
February 2017 57 71 -19.7%
March 2017 55 69 -20.3%
April 2017 46 60 -23.3%
May 2017 44 54 -18.5%
June 2017 41 47 -12.8%
July 2017 40 48 -16.7%
August 2017 42 46 -8.7%
September 2017 39 47 -17.0%
12-Month Avg* 47 56 -16.1%
Historical Days on Market Until Sale by Month
Current as of October 5, 2017. Data is refreshed regularly to capture changes in market activity. Figures shown may be different than previously
reported. All data from CarolinaMLS, Inc. Report provided by the Charlotte Regional Realtor® Association. Report © 2017 ShowingTime. | 7
Days on Market (DOM) tracks the days on market for a property specific to the MLS number. DOM accrues for "Active" and "Under
Contract-Show" statuses. DOM does not include any days that the listing is in "Under Contract-No Show," "Temporarily off Market,"
"Closed/Sold," "Expired" and "Withdrawn" statuses.
Days on Market
* Days on Market for all properties from October 2016 through September 2017.
This is not the average of the individual figures above.
61
47
39
2015 2016 2017
September
20
40
60
80
100
120
140
1-2004 1-2005 1-2006 1-2007 1-2008 1-2009 1-2010 1-2011 1-2012 1-2013 1-2014 1-2015 1-2016 1-2017
66
55
46
2015 2016 2017
Year to Date
- 16.4%- 23.0% - 17.0% - 16.7%- 16.4% - 20.5%
Cumulative Days on Market Until Sale
Prior Year Percent Change
October 2016 60 73 -17.8%
November 2016 60 72 -16.7%
December 2016 64 74 -13.5%
January 2017 64 77 -16.9%
February 2017 67 84 -20.2%
March 2017 65 80 -18.8%
April 2017 56 73 -23.3%
May 2017 51 63 -19.0%
June 2017 49 55 -10.9%
July 2017 47 58 -19.0%
August 2017 51 54 -5.6%
September 2017 49 54 -9.3%
12-Month Avg* 56 66 -15.2%
Historical Cumulative Days on Market Until Sale by Month
Current as of October 5, 2017. Data is refreshed regularly to capture changes in market activity. Figures shown may be different than previously
reported. All data from CarolinaMLS, Inc. Report provided by the Charlotte Regional Realtor® Association. Report © 2017 ShowingTime. | 8
Cumulative Days on Market (CDOM) functions like DOM; however, CDOM tracks the days on market for a property over multiple listings
on the property. When a new listing is entered, the CDOM only resets to zero if the previous listing closed (as in sold) or if the previous
listing has been off market (expired or withdrawn) for more than 90 days.
Cumulative Days on Market
* Cumulative Days on Market for all properties from October 2016 through
September 2017. This is not the average of the individual figures above.
72
54
49
2015 2016 2017
September
25
50
75
100
125
150
175
200
1-2004 1-2005 1-2006 1-2007 1-2008 1-2009 1-2010 1-2011 1-2012 1-2013 1-2014 1-2015 1-2016 1-2017
80
64
54
2015 2016 2017
Year to Date
- 15.6%- 25.0% - 9.3% - 20.0%- 15.3% - 20.8%
Average List Price
Prior Year Percent Change
October 2016 $290,729 $269,274 +8.0%
November 2016 $275,869 $265,155 +4.0%
December 2016 $280,834 $250,445 +12.1%
January 2017 $303,281 $286,300 +5.9%
February 2017 $316,316 $301,754 +4.8%
March 2017 $332,556 $309,444 +7.5%
April 2017 $326,365 $319,070 +2.3%
May 2017 $323,060 $314,031 +2.9%
June 2017 $314,294 $295,554 +6.3%
July 2017 $308,427 $295,697 +4.3%
August 2017 $298,726 $282,161 +5.9%
September 2017 $316,868 $298,173 +6.3%
12-Month Avg* $310,405 $294,546 +5.4%
Historical Average List Price by Month
Current as of October 5, 2017. Data is refreshed regularly to capture changes in market activity. Figures shown may be different than previously
reported. All data from CarolinaMLS, Inc. Report provided by the Charlotte Regional Realtor® Association. Report © 2017 ShowingTime. | 9
Average list price for all homes that have been newly listed on the market in a given month.
Average List Price
* Average List Price for all properties from October 2016 through September 2017.
This is not the average of the individual figures above.
$282,499
$298,173
$316,868
2015 2016 2017
September
$175,000
$200,000
$225,000
$250,000
$275,000
$300,000
$325,000
$350,000
1-2004 1-2005 1-2006 1-2007 1-2008 1-2009 1-2010 1-2011 1-2012 1-2013 1-2014 1-2015 1-2016 1-2017
$280,242
$301,146
$316,232
2015 2016 2017
Year to Date
+ 5.0%+ 5.5% + 6.3% + 7.5%+ 10.8% + 3.7%
Average Sales Price
Prior Year Percent Change
October 2016 $256,812 $238,573 +7.6%
November 2016 $258,674 $239,925 +7.8%
December 2016 $259,648 $238,495 +8.9%
January 2017 $259,498 $230,088 +12.8%
February 2017 $245,044 $229,845 +6.6%
March 2017 $271,048 $245,881 +10.2%
April 2017 $274,330 $251,288 +9.2%
May 2017 $274,221 $257,940 +6.3%
June 2017 $289,162 $279,220 +3.6%
July 2017 $280,462 $267,356 +4.9%
August 2017 $274,060 $270,920 +1.2%
September 2017 $271,606 $256,092 +6.1%
12-Month Avg* $269,810 $253,699 +6.4%
Historical Average Sales Price by Month
Current as of October 5, 2017. Data is refreshed regularly to capture changes in market activity. Figures shown may be different than previously
reported. All data from CarolinaMLS, Inc. Report provided by the Charlotte Regional Realtor® Association. Report © 2017 ShowingTime. | 10
Average sales price for all closed sales, not accounting for seller concessions, in a given month.
Average Sales Price
* Average Sales Price for all properties from October 2016 through September
2017. This is not the average of the individual figures above.
$239,239
$256,092
$271,606
2015 2016 2017
September
$180,000
$200,000
$220,000
$240,000
$260,000
$280,000
$300,000
1-2004 1-2005 1-2006 1-2007 1-2008 1-2009 1-2010 1-2011 1-2012 1-2013 1-2014 1-2015 1-2016 1-2017
$242,988
$257,726
$273,186
2015 2016 2017
Year to Date
+ 6.0%+ 7.0% + 6.1% + 6.1%+ 5.4% + 4.5%
Median Sales Price
Prior Year Percent Change
October 2016 $210,000 $186,000 +12.9%
November 2016 $210,000 $195,050 +7.7%
December 2016 $210,000 $189,900 +10.6%
January 2017 $204,600 $179,000 +14.3%
February 2017 $200,000 $180,075 +11.1%
March 2017 $220,215 $198,000 +11.2%
April 2017 $226,000 $202,000 +11.9%
May 2017 $227,050 $210,000 +8.1%
June 2017 $245,000 $225,000 +8.9%
July 2017 $236,500 $215,000 +10.0%
August 2017 $229,900 $219,000 +5.0%
September 2017 $225,000 $206,000 +9.2%
12-Month Avg* $223,505 $202,450 +10.4%
Historical Median Sales Price by Month
Current as of October 5, 2017. Data is refreshed regularly to capture changes in market activity. Figures shown may be different than previously
reported. All data from CarolinaMLS, Inc. Report provided by the Charlotte Regional Realtor® Association. Report © 2017 ShowingTime. | 11
Point at which half of the sales sold for more and half sold for less, not accounting for seller concessions, in a given month.
Median Sales Price
* Median Sales Price for all properties from October 2016 through September 2017.
This is not the average of the individual figures above.
$189,750
$206,000
$225,000
2015 2016 2017
September
$120,000
$140,000
$160,000
$180,000
$200,000
$220,000
$240,000
$260,000
1-2004 1-2005 1-2006 1-2007 1-2008 1-2009 1-2010 1-2011 1-2012 1-2013 1-2014 1-2015 1-2016 1-2017
$194,000
$206,000
$226,500
2015 2016 2017
Year to Date
+ 10.0%+ 8.6% + 9.2% + 6.2%+ 5.4% + 6.6%
Percent of Original List Price Received
Prior Year Percent Change
October 2016 96.2% 94.7% +1.6%
November 2016 96.2% 95.0% +1.3%
December 2016 95.8% 95.1% +0.7%
January 2017 96.0% 94.7% +1.4%
February 2017 96.3% 95.0% +1.4%
March 2017 96.9% 95.6% +1.4%
April 2017 97.3% 96.3% +1.0%
May 2017 97.3% 96.8% +0.5%
June 2017 97.5% 96.8% +0.7%
July 2017 97.2% 96.7% +0.5%
August 2017 97.1% 96.6% +0.5%
September 2017 96.7% 96.2% +0.5%
12-Month Avg* 96.8% 96.0% +0.8%
Historical Percent of Original List Price Received by Month
Current as of October 5, 2017. Data is refreshed regularly to capture changes in market activity. Figures shown may be different than previously
reported. All data from CarolinaMLS, Inc. Report provided by the Charlotte Regional Realtor® Association. Report © 2017 ShowingTime. | 12
Percentage found when dividing a property’s sales price by its original list price, then taking the average for all properties sold
in a given month, not accounting for seller concessions.
Pct. of Orig. Price Received
* Pct. of Orig. Price Received for all properties from October 2016 through
September 2017. This is not the average of the individual figures above.
95.2% 96.2% 96.7%
2015 2016 2017
September
86.0%
88.0%
90.0%
92.0%
94.0%
96.0%
98.0%
1-2004 1-2005 1-2006 1-2007 1-2008 1-2009 1-2010 1-2011 1-2012 1-2013 1-2014 1-2015 1-2016 1-2017
95.0% 96.3% 97.0%
2015 2016 2017
Year to Date
+ 0.7%+ 1.1% + 0.5% + 1.4%+ 1.1% + 0.8%
Housing Affordability Index
Prior Year Percent Change
October 2016 115 123 -6.5%
November 2016 111 117 -5.1%
December 2016 108 121 -10.7%
January 2017 112 128 -12.5%
February 2017 115 128 -10.2%
March 2017 105 116 -9.5%
April 2017 104 115 -9.6%
May 2017 105 112 -6.3%
June 2017 99 105 -5.7%
July 2017 103 110 -6.4%
August 2017 106 108 -1.9%
September 2017 108 117 -7.7%
12-Month Avg 108 117 -7.7%
Historical Housing Affordability Index by Month
Current as of October 5, 2017. Data is refreshed regularly to capture changes in market activity. Figures shown may be different than previously
reported. All data from CarolinaMLS, Inc. Report provided by the Charlotte Regional Realtor® Association. Report © 2017 ShowingTime. | 13
This index measures housing affordability for the region. For example, an index of 120 means the median household income is 120% of
what is necessary to qualify for the median-priced home under prevailing interest rates. A higher number means greater affordability.
Affordability Index
121 117
108
2015 2016 2017
September
80
100
120
140
160
180
1-2004 1-2005 1-2006 1-2007 1-2008 1-2009 1-2010 1-2011 1-2012 1-2013 1-2014 1-2015 1-2016 1-2017
118 117
107
2015 2016 2017
Year to Date
- 8.5%- 3.3% - 7.7% - 0.8%- 0.8% - 2.5%
Inventory of Homes for Sale
Prior Year Percent Change
October 2016 11,753 13,780 -14.7%
November 2016 11,005 13,041 -15.6%
December 2016 9,923 11,809 -16.0%
January 2017 9,742 11,548 -15.6%
February 2017 9,929 11,236 -11.6%
March 2017 10,394 11,583 -10.3%
April 2017 10,658 11,934 -10.7%
May 2017 10,967 12,277 -10.7%
June 2017 11,039 12,602 -12.4%
July 2017 11,037 12,694 -13.1%
August 2017 10,824 12,484 -13.3%
September 2017 10,140 12,297 -17.5%
12-Month Avg 10,618 12,274 -13.5%
Historical Inventory of Homes for Sale by Month
Current as of October 5, 2017. Data is refreshed regularly to capture changes in market activity. Figures shown may be different than previously
reported. All data from CarolinaMLS, Inc. Report provided by the Charlotte Regional Realtor® Association. Report © 2017 ShowingTime. | 14
The number of properties available for sale in active status at the end of a given month.
Homes for Sale
14,220
12,297
10,140
2015 2016 2017
September
5,000
10,000
15,000
20,000
25,000
30,000
1-2004 1-2005 1-2006 1-2007 1-2008 1-2009 1-2010 1-2011 1-2012 1-2013 1-2014 1-2015 1-2016 1-2017
- 13.5% - 17.5%- 13.3%
Months Supply of Homes for Sale
Prior Year Percent Change
October 2016 3.2 4.0 -20.0%
November 2016 2.9 3.8 -23.7%
December 2016 2.6 3.4 -23.5%
January 2017 2.6 3.4 -23.5%
February 2017 2.6 3.2 -18.8%
March 2017 2.7 3.3 -18.2%
April 2017 2.8 3.4 -17.6%
May 2017 2.8 3.4 -17.6%
June 2017 2.8 3.5 -20.0%
July 2017 2.8 3.5 -20.0%
August 2017 2.8 3.4 -17.6%
September 2017 2.5 3.3 -24.2%
12-Month Avg* 2.8 3.5 -20.0%
Historical Months Supply of Homes for Sale by Month
Current as of October 5, 2017. Data is refreshed regularly to capture changes in market activity. Figures shown may be different than previously
reported. All data from CarolinaMLS, Inc. Report provided by the Charlotte Regional Realtor® Association. Report © 2017 ShowingTime. | 15
The inventory of homes for sale at the end of a given month, divided by the average monthly pending sales from the last 12 months.
Months Supply
* Months Supply for all properties from October 2016 through September 2017.
This is not the average of the individual figures above.
4.2
3.3
2.5
2015 2016 2017
September
2.0
4.0
6.0
8.0
10.0
12.0
14.0
16.0
1-2005 1-2006 1-2007 1-2008 1-2009 1-2010 1-2011 1-2012 1-2013 1-2014 1-2015 1-2016 1-2017
- 21.4% - 24.2%- 23.6%

More Related Content

What's hot

What's hot (20)

Jacksonville real estate market report June 2017
Jacksonville real estate market report June 2017Jacksonville real estate market report June 2017
Jacksonville real estate market report June 2017
 
August 2017 - Bouncing back from the bottom: Toronto real estate market charts
August 2017 - Bouncing back from the bottom: Toronto real estate market chartsAugust 2017 - Bouncing back from the bottom: Toronto real estate market charts
August 2017 - Bouncing back from the bottom: Toronto real estate market charts
 
September 2017 - All braced for nothing: Toronto real estate market charts
September 2017 - All braced for nothing: Toronto real estate market chartsSeptember 2017 - All braced for nothing: Toronto real estate market charts
September 2017 - All braced for nothing: Toronto real estate market charts
 
Georgia Housing Market Snapshot For July. Gar mmi 2018-07
Georgia Housing Market Snapshot For July. Gar mmi 2018-07Georgia Housing Market Snapshot For July. Gar mmi 2018-07
Georgia Housing Market Snapshot For July. Gar mmi 2018-07
 
Market Report: MSA Market Detail - Single Family - 3rd Quarter 2017
Market Report: MSA Market Detail - Single Family - 3rd Quarter 2017Market Report: MSA Market Detail - Single Family - 3rd Quarter 2017
Market Report: MSA Market Detail - Single Family - 3rd Quarter 2017
 
August 2019: Condos heating up? - Toronto real estate market charts
August 2019: Condos heating up? - Toronto real estate market chartsAugust 2019: Condos heating up? - Toronto real estate market charts
August 2019: Condos heating up? - Toronto real estate market charts
 
January 2019: Slow start - Toronto real estate market charts
January 2019: Slow start - Toronto real estate market chartsJanuary 2019: Slow start - Toronto real estate market charts
January 2019: Slow start - Toronto real estate market charts
 
May 2018 - Continued conflicting signs: Toronto real estate market charts
May 2018 - Continued conflicting signs: Toronto real estate market chartsMay 2018 - Continued conflicting signs: Toronto real estate market charts
May 2018 - Continued conflicting signs: Toronto real estate market charts
 
Georgia Real Estate Market Trends
Georgia Real Estate Market TrendsGeorgia Real Estate Market Trends
Georgia Real Estate Market Trends
 
September 2018 - Mirroring 2017 Toronto real estate market charts
September 2018 - Mirroring 2017 Toronto real estate market chartsSeptember 2018 - Mirroring 2017 Toronto real estate market charts
September 2018 - Mirroring 2017 Toronto real estate market charts
 
TRENDS 2017 Houston Slides
TRENDS 2017 Houston SlidesTRENDS 2017 Houston Slides
TRENDS 2017 Houston Slides
 
May 2019: Stress test, schmess test - Toronto real estate market charts
May 2019: Stress test, schmess test - Toronto real estate market chartsMay 2019: Stress test, schmess test - Toronto real estate market charts
May 2019: Stress test, schmess test - Toronto real estate market charts
 
February 2019: TREB wants a boost - Toronto real estate market charts
February 2019: TREB wants a boost - Toronto real estate market chartsFebruary 2019: TREB wants a boost - Toronto real estate market charts
February 2019: TREB wants a boost - Toronto real estate market charts
 
Colliers International Houston Trends 2017
Colliers International Houston Trends 2017Colliers International Houston Trends 2017
Colliers International Houston Trends 2017
 
TRENDS 2017 Houston Slides
TRENDS 2017 Houston SlidesTRENDS 2017 Houston Slides
TRENDS 2017 Houston Slides
 
October 2017 - Another mixed bag month: Toronto real estate market charts
October 2017 - Another mixed bag month: Toronto real estate market chartsOctober 2017 - Another mixed bag month: Toronto real estate market charts
October 2017 - Another mixed bag month: Toronto real estate market charts
 
October 2019: Climbing back to 2017 peaks - Toronto real estate market charts
October 2019: Climbing back to 2017 peaks - Toronto real estate market chartsOctober 2019: Climbing back to 2017 peaks - Toronto real estate market charts
October 2019: Climbing back to 2017 peaks - Toronto real estate market charts
 
Georgia Housing Market Snapshot For March 2019
Georgia Housing Market Snapshot For March 2019Georgia Housing Market Snapshot For March 2019
Georgia Housing Market Snapshot For March 2019
 
#HomeSalesShow Nov 2017 Market Reports
#HomeSalesShow Nov 2017 Market Reports#HomeSalesShow Nov 2017 Market Reports
#HomeSalesShow Nov 2017 Market Reports
 
San Francisco Market Focus Report July
San Francisco Market Focus Report JulySan Francisco Market Focus Report July
San Francisco Market Focus Report July
 

Similar to Charlotte Real Estate Market Overview

October 2014 Greater Boston Real Estate Market Trends Report
October 2014 Greater Boston Real Estate Market Trends ReportOctober 2014 Greater Boston Real Estate Market Trends Report
October 2014 Greater Boston Real Estate Market Trends Report
Unit Realty Group
 

Similar to Charlotte Real Estate Market Overview (20)

December 2016 Greater Boston Real Estate Market Trends
December 2016 Greater Boston Real Estate Market TrendsDecember 2016 Greater Boston Real Estate Market Trends
December 2016 Greater Boston Real Estate Market Trends
 
Georgia Housing Market Snapshot For September 2018
Georgia Housing Market Snapshot For September 2018Georgia Housing Market Snapshot For September 2018
Georgia Housing Market Snapshot For September 2018
 
GBAR Monthly Housing Market Data November 2016
GBAR Monthly Housing Market Data November 2016GBAR Monthly Housing Market Data November 2016
GBAR Monthly Housing Market Data November 2016
 
September 2016 Boston Real Estate Market Trends
September 2016 Boston Real Estate Market TrendsSeptember 2016 Boston Real Estate Market Trends
September 2016 Boston Real Estate Market Trends
 
Georgia Housing Market Snapshot For November 2018
Georgia Housing Market Snapshot For November 2018Georgia Housing Market Snapshot For November 2018
Georgia Housing Market Snapshot For November 2018
 
Greater Boston Association of Realtors Monthly Housing Data: October 2016
Greater Boston Association of Realtors Monthly Housing Data: October 2016Greater Boston Association of Realtors Monthly Housing Data: October 2016
Greater Boston Association of Realtors Monthly Housing Data: October 2016
 
Georgia Housing Market Snapshot For October 2018
Georgia Housing Market Snapshot For October 2018Georgia Housing Market Snapshot For October 2018
Georgia Housing Market Snapshot For October 2018
 
San Francisco Market Focus May 2017
San Francisco Market Focus May 2017San Francisco Market Focus May 2017
San Francisco Market Focus May 2017
 
San Francisco Market Focus Sept 2017
San Francisco Market Focus Sept 2017San Francisco Market Focus Sept 2017
San Francisco Market Focus Sept 2017
 
October 2014 Greater Boston Real Estate Market Trends Report
October 2014 Greater Boston Real Estate Market Trends ReportOctober 2014 Greater Boston Real Estate Market Trends Report
October 2014 Greater Boston Real Estate Market Trends Report
 
Georgia Housing Market Snapshot: June 2018. Courtesy of the Georgia Associat...
Georgia Housing Market Snapshot: June 2018.  Courtesy of the Georgia Associat...Georgia Housing Market Snapshot: June 2018.  Courtesy of the Georgia Associat...
Georgia Housing Market Snapshot: June 2018. Courtesy of the Georgia Associat...
 
San Francisco Market Focus June 2017
San Francisco Market Focus June 2017San Francisco Market Focus June 2017
San Francisco Market Focus June 2017
 
Charlotte Region Weekly Real Estate Market Activity Report
Charlotte Region Weekly Real Estate Market Activity ReportCharlotte Region Weekly Real Estate Market Activity Report
Charlotte Region Weekly Real Estate Market Activity Report
 
August 2016 Boston Real Estate Market Trends
August 2016 Boston Real Estate Market TrendsAugust 2016 Boston Real Estate Market Trends
August 2016 Boston Real Estate Market Trends
 
August 2016 Boston Real Estate Market Trends
August 2016 Boston Real Estate Market TrendsAugust 2016 Boston Real Estate Market Trends
August 2016 Boston Real Estate Market Trends
 
San Francisco Market Focus October 2017
San Francisco Market Focus October 2017San Francisco Market Focus October 2017
San Francisco Market Focus October 2017
 
Charlotte, North Carolina Real Estate Update August
Charlotte, North Carolina Real Estate Update AugustCharlotte, North Carolina Real Estate Update August
Charlotte, North Carolina Real Estate Update August
 
San Francisco Market Focus August 2017
San Francisco Market Focus August 2017San Francisco Market Focus August 2017
San Francisco Market Focus August 2017
 
San Francisco Market Focus August 2017
San Francisco Market Focus August 2017San Francisco Market Focus August 2017
San Francisco Market Focus August 2017
 
October 2015 Greater Boston Real Estate Market Trends Report
October 2015 Greater Boston Real Estate Market Trends ReportOctober 2015 Greater Boston Real Estate Market Trends Report
October 2015 Greater Boston Real Estate Market Trends Report
 

More from Scott Browder

More from Scott Browder (20)

Market report Charlotte NC Last 365
Market report Charlotte NC Last 365Market report Charlotte NC Last 365
Market report Charlotte NC Last 365
 
Charlotte Region Weekly Market Activity Report
Charlotte Region Weekly Market Activity ReportCharlotte Region Weekly Market Activity Report
Charlotte Region Weekly Market Activity Report
 
Charlotte region weekly market activity report
Charlotte region weekly market activity reportCharlotte region weekly market activity report
Charlotte region weekly market activity report
 
Scott Browder 2018 Real Estate Year in Review - Wilkinson ERA Real Estate
Scott Browder 2018 Real Estate Year in Review - Wilkinson ERA Real EstateScott Browder 2018 Real Estate Year in Review - Wilkinson ERA Real Estate
Scott Browder 2018 Real Estate Year in Review - Wilkinson ERA Real Estate
 
Real Estate Weekly Market Activity Report
Real Estate Weekly Market Activity ReportReal Estate Weekly Market Activity Report
Real Estate Weekly Market Activity Report
 
THE POWER OF STAGING YOUR HOME
THE POWER OF STAGING YOUR HOMETHE POWER OF STAGING YOUR HOME
THE POWER OF STAGING YOUR HOME
 
The Southend Vision Plan Final 2018
The Southend Vision Plan Final 2018The Southend Vision Plan Final 2018
The Southend Vision Plan Final 2018
 
Zoning Ordinance Chapter 9 - GENERAL DISTRICTS
Zoning Ordinance Chapter 9 - GENERAL DISTRICTSZoning Ordinance Chapter 9 - GENERAL DISTRICTS
Zoning Ordinance Chapter 9 - GENERAL DISTRICTS
 
Our Real Estate Value in the Charlotte Market
Our Real Estate Value in the Charlotte MarketOur Real Estate Value in the Charlotte Market
Our Real Estate Value in the Charlotte Market
 
Longview Market Update
Longview Market UpdateLongview Market Update
Longview Market Update
 
Eastover Neighborhood Real Estate Update
Eastover Neighborhood Real Estate UpdateEastover Neighborhood Real Estate Update
Eastover Neighborhood Real Estate Update
 
Madison park
Madison parkMadison park
Madison park
 
Madison park
Madison parkMadison park
Madison park
 
Foxcroft East Real Estate Data
Foxcroft East Real Estate DataFoxcroft East Real Estate Data
Foxcroft East Real Estate Data
 
Oakhurst Neighborhood Charlotte NC
Oakhurst Neighborhood Charlotte NCOakhurst Neighborhood Charlotte NC
Oakhurst Neighborhood Charlotte NC
 
Touchstone Neighborhood Charlotte NC
Touchstone Neighborhood Charlotte NCTouchstone Neighborhood Charlotte NC
Touchstone Neighborhood Charlotte NC
 
Chestnut Neighborhood in Matthews NC
Chestnut Neighborhood in Matthews NCChestnut Neighborhood in Matthews NC
Chestnut Neighborhood in Matthews NC
 
Ballantyne Country Club Active and Sold Homes
Ballantyne Country Club Active and Sold HomesBallantyne Country Club Active and Sold Homes
Ballantyne Country Club Active and Sold Homes
 
Myers park market report April 2016
Myers park market report April 2016Myers park market report April 2016
Myers park market report April 2016
 
Charlotte Real Estate Market
Charlotte Real Estate MarketCharlotte Real Estate Market
Charlotte Real Estate Market
 

Recently uploaded

Low Rate ✨➥9582086666▻✨Call Girls In Gurgaon Sector 22 (Gurgaon)
Low Rate ✨➥9582086666▻✨Call Girls In Gurgaon Sector 22 (Gurgaon)Low Rate ✨➥9582086666▻✨Call Girls In Gurgaon Sector 22 (Gurgaon)
Low Rate ✨➥9582086666▻✨Call Girls In Gurgaon Sector 22 (Gurgaon)
delhi24hrs1
 
Low Rate ✨➥9582086666▻✨Call Girls In Gurgaon Sector 23 (Gurgaon)
Low Rate ✨➥9582086666▻✨Call Girls In Gurgaon Sector 23 (Gurgaon)Low Rate ✨➥9582086666▻✨Call Girls In Gurgaon Sector 23 (Gurgaon)
Low Rate ✨➥9582086666▻✨Call Girls In Gurgaon Sector 23 (Gurgaon)
delhi24hrs1
 
Low Rate ✨➥9711108085▻✨Call Girls In East Of Kailash (E.K) (Delhi)
Low Rate ✨➥9711108085▻✨Call Girls In East Of Kailash (E.K) (Delhi)Low Rate ✨➥9711108085▻✨Call Girls In East Of Kailash (E.K) (Delhi)
Low Rate ✨➥9711108085▻✨Call Girls In East Of Kailash (E.K) (Delhi)
delhi24hrs1
 
Cheap Rate ✨➥9711108085▻✨Call Girls In Connaught Place (Delhi)
Cheap Rate ✨➥9711108085▻✨Call Girls In Connaught Place (Delhi)Cheap Rate ✨➥9711108085▻✨Call Girls In Connaught Place (Delhi)
Cheap Rate ✨➥9711108085▻✨Call Girls In Connaught Place (Delhi)
delhi24hrs1
 
Listing Turkey - 2024 - May Featured Portfolio
Listing Turkey - 2024 - May Featured PortfolioListing Turkey - 2024 - May Featured Portfolio
Listing Turkey - 2024 - May Featured Portfolio
Listing Turkey
 
Call Girl In Delhi West Patel Nagar @8447779280乂EscorT ServiCe In Delhi NCR
Call Girl In Delhi West Patel Nagar @8447779280乂EscorT ServiCe In Delhi NCRCall Girl In Delhi West Patel Nagar @8447779280乂EscorT ServiCe In Delhi NCR
Call Girl In Delhi West Patel Nagar @8447779280乂EscorT ServiCe In Delhi NCR
asmaqueen5
 
MEQ Mainstreet Equity Corp Q2 2024 Investor Presentation
MEQ Mainstreet Equity Corp Q2 2024 Investor PresentationMEQ Mainstreet Equity Corp Q2 2024 Investor Presentation
MEQ Mainstreet Equity Corp Q2 2024 Investor Presentation
MEQ - Mainstreet Equity Corp.
 
Low rate ↬Call girls in Sabzi Mandi Delhi | 8447779280}Escort Service In All ...
Low rate ↬Call girls in Sabzi Mandi Delhi | 8447779280}Escort Service In All ...Low rate ↬Call girls in Sabzi Mandi Delhi | 8447779280}Escort Service In All ...
Low rate ↬Call girls in Sabzi Mandi Delhi | 8447779280}Escort Service In All ...
asmaqueen5
 
Escort—>Call GiRls In Mori Gate Delhi —>8447779280—Service Escorts In South D...
Escort—>Call GiRls In Mori Gate Delhi —>8447779280—Service Escorts In South D...Escort—>Call GiRls In Mori Gate Delhi —>8447779280—Service Escorts In South D...
Escort—>Call GiRls In Mori Gate Delhi —>8447779280—Service Escorts In South D...
asmaqueen5
 
Call girls in Shakti Nagar Delhi~8447779280°/=@/ Short 1500 Night 6000}ESCORT...
Call girls in Shakti Nagar Delhi~8447779280°/=@/ Short 1500 Night 6000}ESCORT...Call girls in Shakti Nagar Delhi~8447779280°/=@/ Short 1500 Night 6000}ESCORT...
Call girls in Shakti Nagar Delhi~8447779280°/=@/ Short 1500 Night 6000}ESCORT...
asmaqueen5
 
Cheap Rate ✨➥9582086666▻✨Call Girls In Gurgaon Sector 16 (Gurgaon)
Cheap Rate ✨➥9582086666▻✨Call Girls In Gurgaon Sector 16 (Gurgaon)Cheap Rate ✨➥9582086666▻✨Call Girls In Gurgaon Sector 16 (Gurgaon)
Cheap Rate ✨➥9582086666▻✨Call Girls In Gurgaon Sector 16 (Gurgaon)
delhi24hrs1
 
Low Rate Call girls in Sant Nagar{Delhi }8447779280} Service Escorts In South...
Low Rate Call girls in Sant Nagar{Delhi }8447779280} Service Escorts In South...Low Rate Call girls in Sant Nagar{Delhi }8447779280} Service Escorts In South...
Low Rate Call girls in Sant Nagar{Delhi }8447779280} Service Escorts In South...
asmaqueen5
 

Recently uploaded (20)

Low Rate ✨➥9582086666▻✨Call Girls In Gurgaon Sector 22 (Gurgaon)
Low Rate ✨➥9582086666▻✨Call Girls In Gurgaon Sector 22 (Gurgaon)Low Rate ✨➥9582086666▻✨Call Girls In Gurgaon Sector 22 (Gurgaon)
Low Rate ✨➥9582086666▻✨Call Girls In Gurgaon Sector 22 (Gurgaon)
 
Kohinoor Courtyard One Wakad Pune | Elegant Living Spaces
Kohinoor Courtyard One Wakad Pune | Elegant Living SpacesKohinoor Courtyard One Wakad Pune | Elegant Living Spaces
Kohinoor Courtyard One Wakad Pune | Elegant Living Spaces
 
Low Rate ✨➥9582086666▻✨Call Girls In Gurgaon Sector 23 (Gurgaon)
Low Rate ✨➥9582086666▻✨Call Girls In Gurgaon Sector 23 (Gurgaon)Low Rate ✨➥9582086666▻✨Call Girls In Gurgaon Sector 23 (Gurgaon)
Low Rate ✨➥9582086666▻✨Call Girls In Gurgaon Sector 23 (Gurgaon)
 
Explore Dual Citizenship in Africa | Citizenship Benefits & Requirements
Explore Dual Citizenship in Africa | Citizenship Benefits & RequirementsExplore Dual Citizenship in Africa | Citizenship Benefits & Requirements
Explore Dual Citizenship in Africa | Citizenship Benefits & Requirements
 
Low Rate ✨➥9711108085▻✨Call Girls In East Of Kailash (E.K) (Delhi)
Low Rate ✨➥9711108085▻✨Call Girls In East Of Kailash (E.K) (Delhi)Low Rate ✨➥9711108085▻✨Call Girls In East Of Kailash (E.K) (Delhi)
Low Rate ✨➥9711108085▻✨Call Girls In East Of Kailash (E.K) (Delhi)
 
Eldeco Dwarka Project In Delhi-brochure.pdf.pdf
Eldeco Dwarka Project In Delhi-brochure.pdf.pdfEldeco Dwarka Project In Delhi-brochure.pdf.pdf
Eldeco Dwarka Project In Delhi-brochure.pdf.pdf
 
Cheap Rate ✨➥9711108085▻✨Call Girls In Connaught Place (Delhi)
Cheap Rate ✨➥9711108085▻✨Call Girls In Connaught Place (Delhi)Cheap Rate ✨➥9711108085▻✨Call Girls In Connaught Place (Delhi)
Cheap Rate ✨➥9711108085▻✨Call Girls In Connaught Place (Delhi)
 
Listing Turkey - 2024 - May Featured Portfolio
Listing Turkey - 2024 - May Featured PortfolioListing Turkey - 2024 - May Featured Portfolio
Listing Turkey - 2024 - May Featured Portfolio
 
Call Girl In Delhi West Patel Nagar @8447779280乂EscorT ServiCe In Delhi NCR
Call Girl In Delhi West Patel Nagar @8447779280乂EscorT ServiCe In Delhi NCRCall Girl In Delhi West Patel Nagar @8447779280乂EscorT ServiCe In Delhi NCR
Call Girl In Delhi West Patel Nagar @8447779280乂EscorT ServiCe In Delhi NCR
 
Nyati Elite NIBM Road Pune E Brochure.pdf
Nyati Elite NIBM Road Pune E Brochure.pdfNyati Elite NIBM Road Pune E Brochure.pdf
Nyati Elite NIBM Road Pune E Brochure.pdf
 
MEQ Mainstreet Equity Corp Q2 2024 Investor Presentation
MEQ Mainstreet Equity Corp Q2 2024 Investor PresentationMEQ Mainstreet Equity Corp Q2 2024 Investor Presentation
MEQ Mainstreet Equity Corp Q2 2024 Investor Presentation
 
Low rate ↬Call girls in Sabzi Mandi Delhi | 8447779280}Escort Service In All ...
Low rate ↬Call girls in Sabzi Mandi Delhi | 8447779280}Escort Service In All ...Low rate ↬Call girls in Sabzi Mandi Delhi | 8447779280}Escort Service In All ...
Low rate ↬Call girls in Sabzi Mandi Delhi | 8447779280}Escort Service In All ...
 
Escort—>Call GiRls In Mori Gate Delhi —>8447779280—Service Escorts In South D...
Escort—>Call GiRls In Mori Gate Delhi —>8447779280—Service Escorts In South D...Escort—>Call GiRls In Mori Gate Delhi —>8447779280—Service Escorts In South D...
Escort—>Call GiRls In Mori Gate Delhi —>8447779280—Service Escorts In South D...
 
Call girls in Shakti Nagar Delhi~8447779280°/=@/ Short 1500 Night 6000}ESCORT...
Call girls in Shakti Nagar Delhi~8447779280°/=@/ Short 1500 Night 6000}ESCORT...Call girls in Shakti Nagar Delhi~8447779280°/=@/ Short 1500 Night 6000}ESCORT...
Call girls in Shakti Nagar Delhi~8447779280°/=@/ Short 1500 Night 6000}ESCORT...
 
Vanam At Purva Soukhyam Guduvanchery.pdf.pdf
Vanam At Purva Soukhyam Guduvanchery.pdf.pdfVanam At Purva Soukhyam Guduvanchery.pdf.pdf
Vanam At Purva Soukhyam Guduvanchery.pdf.pdf
 
Cheap Rate ✨➥9582086666▻✨Call Girls In Gurgaon Sector 16 (Gurgaon)
Cheap Rate ✨➥9582086666▻✨Call Girls In Gurgaon Sector 16 (Gurgaon)Cheap Rate ✨➥9582086666▻✨Call Girls In Gurgaon Sector 16 (Gurgaon)
Cheap Rate ✨➥9582086666▻✨Call Girls In Gurgaon Sector 16 (Gurgaon)
 
Unveiling the Veil: The Top Challenges with Estate Agents?
Unveiling the Veil: The Top Challenges with Estate Agents?Unveiling the Veil: The Top Challenges with Estate Agents?
Unveiling the Veil: The Top Challenges with Estate Agents?
 
Yedi Mavi TOBB Zeytinburnu - Listing Turkey
Yedi Mavi TOBB Zeytinburnu - Listing TurkeyYedi Mavi TOBB Zeytinburnu - Listing Turkey
Yedi Mavi TOBB Zeytinburnu - Listing Turkey
 
Low Rate Call girls in Sant Nagar{Delhi }8447779280} Service Escorts In South...
Low Rate Call girls in Sant Nagar{Delhi }8447779280} Service Escorts In South...Low Rate Call girls in Sant Nagar{Delhi }8447779280} Service Escorts In South...
Low Rate Call girls in Sant Nagar{Delhi }8447779280} Service Escorts In South...
 
SVN Live 5.13.24 Weekly Property Broadcast
SVN Live 5.13.24 Weekly Property BroadcastSVN Live 5.13.24 Weekly Property Broadcast
SVN Live 5.13.24 Weekly Property Broadcast
 

Charlotte Real Estate Market Overview

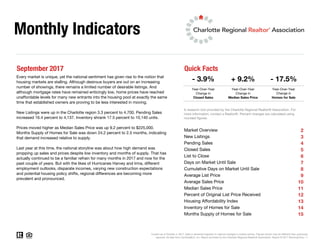
  • 1. Monthly Indicators September 2017 Quick Facts Year-Over-Year Change in Year-Over-Year Change in Closed Sales Median Sales Price 2 3 4 5 6 7 8 9 10 11 12 13 14 15Months Supply of Homes for Sale - 3.9% + 9.2% - 17.5% Year-Over-Year Change in Housing Affordability Index Inventory of Homes for Sale Current as of October 5, 2017. Data is refreshed regularly to capture changes in market activity. Figures shown may be different than previously reported. All data from CarolinaMLS, Inc. Report provided by the Charlotte Regional Realtor® Association. Report © 2017 ShowingTime. | 1 Every market is unique, yet the national sentiment has given rise to the notion that housing markets are stalling. Although desirous buyers are out on an increasing number of showings, there remains a limited number of desirable listings. And although mortgage rates have remained enticingly low, home prices have reached unaffordable levels for many new entrants into the housing pool at exactly the same time that established owners are proving to be less interested in moving. New Listings were up in the Charlotte region 3.3 percent to 4,700. Pending Sales increased 16.4 percent to 4,137. Inventory shrank 17.5 percent to 10,140 units. Prices moved higher as Median Sales Price was up 9.2 percent to $225,000. Months Supply of Homes for Sale was down 24.2 percent to 2.5 months, indicating that demand increased relative to supply. Last year at this time, the national storyline was about how high demand was propping up sales and prices despite low inventory and months of supply. That has actually continued to be a familiar refrain for many months in 2017 and now for the past couple of years. But with the likes of Hurricanes Harvey and Irma, different employment outlooks, disparate incomes, varying new construction expectations and potential housing policy shifts, regional differences are becoming more prevalent and pronounced. Pending Sales Closed Sales List to Close Days on Market Until Sale Cumulative Days on Market Until Sale Average List Price Homes for Sale A research tool provided by the Charlotte Regional Realtor® Association. For more information, contact a Realtor®. Percent changes are calculated using rounded figures. Market Overview New Listings Average Sales Price Median Sales Price Percent of Original List Price Received
  • 2. Market Overview 9-2016 9-2017 Percent Change YTD 2016 YTD 2017 Percent Change + 6.3% $301,146 + 6.1% $257,726 $273,186 + 0.7% -- -- Percent of Original List Price Received 96.2% 96.7% + 0.5% 96.3% 97.0% Months Supply of Homes for Sale 3.3 2.5 - 24.2% -- - 15.6% Average List Price $298,173 $316,868 - 16.4% List to Close 99 90 - 9.1% 108 98 + 6.0% Median Sales Price $206,000 $225,000 + 9.2% $206,000 $226,500 + 10.0% Average Sales Price $256,092 $271,606 Key metrics by report month and for year-to-date (YTD) starting from the first of the year. New Listings 4,550 4,700 + 3.3% 47,598 + 4.9% Pending Sales 3,555 4,137 + 16.4% 36,095 38,565 + 6.8% 45,366 Historical SparkbarsKey Metrics Current as of October 5, 2017. Data is refreshed regularly to capture changes in market activity. Figures shown may be different than previously reported. All data from CarolinaMLS, Inc. Report provided by the Charlotte Regional Realtor® Association. Report © 2017 ShowingTime. | 2 Note: CarolinaMLS did not include “showable” under contract listings in the “Pending Sales” stats before July 2012. Listing agents report listings as “Under Contract-Show” earlier in the transaction. As a result, the new “Pending Sales” stats trend higher and the new “Months Supply of Inventory” stats trend lower since July 2012. | Data is refreshed regularly to capture changes in market activity. Figures shown may be different than previously reported. Closed Sales 4,121 3,960 - 3.9% 34,053 36,127 + 6.1% $316,232 + 5.0% Cumulative Days on Market 54 49 - 9.3% 64 54 - 9.3% Days on Market Until Sale 47 39 - 17.0% 55 46 Housing Affordability Index 117 108 - 7.7% 117 107 - 8.5% Inventory of Homes for Sale 12,297 10,140 - 17.5% -- -- -- 9-2015 9-2016 9-2017 9-2015 9-2016 9-2017 9-2015 9-2016 9-2017 9-2015 9-2016 9-2017 9-2015 9-2016 9-2017 9-2015 9-2016 9-2017 9-2015 9-2016 9-2017 9-2015 9-2016 9-2017 9-2015 9-2016 9-2017 9-2015 9-2016 9-2017 9-2015 9-2016 9-2017 9-2015 9-2016 9-2017 9-2015 9-2016 9-2017
  • 3. New Listings Prior Year Percent Change October 2016 4,205 4,042 +4.0% November 2016 3,422 3,070 +11.5% December 2016 2,584 2,428 +6.4% January 2017 3,986 3,762 +6.0% February 2017 4,744 4,096 +15.8% March 2017 6,066 5,649 +7.4% April 2017 5,580 5,765 -3.2% May 2017 5,981 5,680 +5.3% June 2017 5,698 5,652 +0.8% July 2017 5,442 5,123 +6.2% August 2017 5,401 5,089 +6.1% September 2017 4,700 4,550 +3.3% 12-Month Avg 4,817 4,576 +5.3% Historical New Listings by Month Current as of October 5, 2017. Data is refreshed regularly to capture changes in market activity. Figures shown may be different than previously reported. All data from CarolinaMLS, Inc. Report provided by the Charlotte Regional Realtor® Association. Report © 2017 ShowingTime. | 3 A count of the properties that have been newly listed on the market in a given month. New Listings 4,385 4,550 4,700 2015 2016 2017 September 2,000 3,000 4,000 5,000 6,000 7,000 8,000 1-2004 1-2005 1-2006 1-2007 1-2008 1-2009 1-2010 1-2011 1-2012 1-2013 1-2014 1-2015 1-2016 1-2017 44,046 45,366 47,598 2015 2016 2017 Year to Date + 4.9%+ 3.8% + 3.3% + 3.0%+ 4.7% + 2.9%
  • 4. Pending Sales Prior Year Percent Change October 2016 3,617 3,149 +14.9% November 2016 3,048 2,658 +14.7% December 2016 2,499 2,232 +12.0% January 2017 3,273 3,018 +8.4% February 2017 3,822 3,570 +7.1% March 2017 4,680 4,404 +6.3% April 2017 4,567 4,620 -1.1% May 2017 4,737 4,477 +5.8% June 2017 4,596 4,268 +7.7% July 2017 4,329 4,067 +6.4% August 2017 4,424 4,116 +7.5% September 2017 4,137 3,555 +16.4% 12-Month Avg 3,977 3,678 +8.1% Historical Pending Sales by Month Current as of October 5, 2017. Data is refreshed regularly to capture changes in market activity. Figures shown may be different than previously reported. All data from CarolinaMLS, Inc. Report provided by the Charlotte Regional Realtor® Association. Report © 2017 ShowingTime. | 4 A count of the properties on which contracts have been accepted in a given month. Pending contracts include "Under Contract-Show" and "Under Contract-No Show" statuses. Pending Sales 3,297 3,555 4,137 2015 2016 2017 September 1,000 2,000 3,000 4,000 5,000 1-2004 1-2005 1-2006 1-2007 1-2008 1-2009 1-2010 1-2011 1-2012 1-2013 1-2014 1-2015 1-2016 1-2017 33,233 36,095 38,565 2015 2016 2017 Year to Date + 6.8%+ 7.8% + 16.4% + 8.6%+ 11.0% + 15.9%
  • 5. Closed Sales Prior Year Percent Change October 2016 3,572 3,306 +8.0% November 2016 3,387 2,655 +27.6% December 2016 3,720 3,333 +11.6% January 2017 2,617 2,170 +20.6% February 2017 2,739 2,557 +7.1% March 2017 4,211 3,558 +18.4% April 2017 3,824 3,868 -1.1% May 2017 4,562 4,290 +6.3% June 2017 5,189 4,903 +5.8% July 2017 4,416 4,119 +7.2% August 2017 4,609 4,467 +3.2% September 2017 3,960 4,121 -3.9% 12-Month Avg 3,901 3,612 +8.0% Historical Closed Sales by Month Current as of October 5, 2017. Data is refreshed regularly to capture changes in market activity. Figures shown may be different than previously reported. All data from CarolinaMLS, Inc. Report provided by the Charlotte Regional Realtor® Association. Report © 2017 ShowingTime. | 5 A count of the actual sales that closed in a given month. Closed Sales 3,721 4,121 3,960 2015 2016 2017 September 1,000 2,000 3,000 4,000 5,000 6,000 1-2004 1-2005 1-2006 1-2007 1-2008 1-2009 1-2010 1-2011 1-2012 1-2013 1-2014 1-2015 1-2016 1-2017 31,644 34,053 36,127 2015 2016 2017 Year to Date + 6.1%+ 10.7% - 3.9% + 7.6%+ 14.9% + 15.4%
  • 6. List to Close Prior Year Percent Change October 2016 104 113 -8.0% November 2016 104 116 -10.3% December 2016 111 120 -7.5% January 2017 115 121 -5.0% February 2017 113 126 -10.3% March 2017 105 122 -13.9% April 2017 97 113 -14.2% May 2017 97 106 -8.5% June 2017 94 102 -7.8% July 2017 91 101 -9.9% August 2017 91 98 -7.1% September 2017 90 99 -9.1% 12-Month Avg* 100 110 -9.1% Historical List to Close by Month Current as of October 5, 2017. Data is refreshed regularly to capture changes in market activity. Figures shown may be different than previously reported. All data from CarolinaMLS, Inc. Report provided by the Charlotte Regional Realtor® Association. Report © 2017 ShowingTime. | 6 List to Close provides the total number of days specific to the MLS number from "Listing Date" to "Sold Date." List to Close * List to Close for all properties from October 2016 through September 2017. This is not the average of the individual figures above. 112 99 90 2015 2016 2017 September 80 100 120 140 160 180 1-2004 1-2005 1-2006 1-2007 1-2008 1-2009 1-2010 1-2011 1-2012 1-2013 1-2014 1-2015 1-2016 1-2017 117 108 98 2015 2016 2017 Year to Date - 9.3%- 11.6% - 9.1% - 7.7%- 9.7% - 6.4%
  • 7. Days on Market Until Sale Prior Year Percent Change October 2016 51 61 -16.4% November 2016 49 62 -21.0% December 2016 54 63 -14.3% January 2017 55 66 -16.7% February 2017 57 71 -19.7% March 2017 55 69 -20.3% April 2017 46 60 -23.3% May 2017 44 54 -18.5% June 2017 41 47 -12.8% July 2017 40 48 -16.7% August 2017 42 46 -8.7% September 2017 39 47 -17.0% 12-Month Avg* 47 56 -16.1% Historical Days on Market Until Sale by Month Current as of October 5, 2017. Data is refreshed regularly to capture changes in market activity. Figures shown may be different than previously reported. All data from CarolinaMLS, Inc. Report provided by the Charlotte Regional Realtor® Association. Report © 2017 ShowingTime. | 7 Days on Market (DOM) tracks the days on market for a property specific to the MLS number. DOM accrues for "Active" and "Under Contract-Show" statuses. DOM does not include any days that the listing is in "Under Contract-No Show," "Temporarily off Market," "Closed/Sold," "Expired" and "Withdrawn" statuses. Days on Market * Days on Market for all properties from October 2016 through September 2017. This is not the average of the individual figures above. 61 47 39 2015 2016 2017 September 20 40 60 80 100 120 140 1-2004 1-2005 1-2006 1-2007 1-2008 1-2009 1-2010 1-2011 1-2012 1-2013 1-2014 1-2015 1-2016 1-2017 66 55 46 2015 2016 2017 Year to Date - 16.4%- 23.0% - 17.0% - 16.7%- 16.4% - 20.5%
  • 8. Cumulative Days on Market Until Sale Prior Year Percent Change October 2016 60 73 -17.8% November 2016 60 72 -16.7% December 2016 64 74 -13.5% January 2017 64 77 -16.9% February 2017 67 84 -20.2% March 2017 65 80 -18.8% April 2017 56 73 -23.3% May 2017 51 63 -19.0% June 2017 49 55 -10.9% July 2017 47 58 -19.0% August 2017 51 54 -5.6% September 2017 49 54 -9.3% 12-Month Avg* 56 66 -15.2% Historical Cumulative Days on Market Until Sale by Month Current as of October 5, 2017. Data is refreshed regularly to capture changes in market activity. Figures shown may be different than previously reported. All data from CarolinaMLS, Inc. Report provided by the Charlotte Regional Realtor® Association. Report © 2017 ShowingTime. | 8 Cumulative Days on Market (CDOM) functions like DOM; however, CDOM tracks the days on market for a property over multiple listings on the property. When a new listing is entered, the CDOM only resets to zero if the previous listing closed (as in sold) or if the previous listing has been off market (expired or withdrawn) for more than 90 days. Cumulative Days on Market * Cumulative Days on Market for all properties from October 2016 through September 2017. This is not the average of the individual figures above. 72 54 49 2015 2016 2017 September 25 50 75 100 125 150 175 200 1-2004 1-2005 1-2006 1-2007 1-2008 1-2009 1-2010 1-2011 1-2012 1-2013 1-2014 1-2015 1-2016 1-2017 80 64 54 2015 2016 2017 Year to Date - 15.6%- 25.0% - 9.3% - 20.0%- 15.3% - 20.8%
  • 9. Average List Price Prior Year Percent Change October 2016 $290,729 $269,274 +8.0% November 2016 $275,869 $265,155 +4.0% December 2016 $280,834 $250,445 +12.1% January 2017 $303,281 $286,300 +5.9% February 2017 $316,316 $301,754 +4.8% March 2017 $332,556 $309,444 +7.5% April 2017 $326,365 $319,070 +2.3% May 2017 $323,060 $314,031 +2.9% June 2017 $314,294 $295,554 +6.3% July 2017 $308,427 $295,697 +4.3% August 2017 $298,726 $282,161 +5.9% September 2017 $316,868 $298,173 +6.3% 12-Month Avg* $310,405 $294,546 +5.4% Historical Average List Price by Month Current as of October 5, 2017. Data is refreshed regularly to capture changes in market activity. Figures shown may be different than previously reported. All data from CarolinaMLS, Inc. Report provided by the Charlotte Regional Realtor® Association. Report © 2017 ShowingTime. | 9 Average list price for all homes that have been newly listed on the market in a given month. Average List Price * Average List Price for all properties from October 2016 through September 2017. This is not the average of the individual figures above. $282,499 $298,173 $316,868 2015 2016 2017 September $175,000 $200,000 $225,000 $250,000 $275,000 $300,000 $325,000 $350,000 1-2004 1-2005 1-2006 1-2007 1-2008 1-2009 1-2010 1-2011 1-2012 1-2013 1-2014 1-2015 1-2016 1-2017 $280,242 $301,146 $316,232 2015 2016 2017 Year to Date + 5.0%+ 5.5% + 6.3% + 7.5%+ 10.8% + 3.7%
  • 10. Average Sales Price Prior Year Percent Change October 2016 $256,812 $238,573 +7.6% November 2016 $258,674 $239,925 +7.8% December 2016 $259,648 $238,495 +8.9% January 2017 $259,498 $230,088 +12.8% February 2017 $245,044 $229,845 +6.6% March 2017 $271,048 $245,881 +10.2% April 2017 $274,330 $251,288 +9.2% May 2017 $274,221 $257,940 +6.3% June 2017 $289,162 $279,220 +3.6% July 2017 $280,462 $267,356 +4.9% August 2017 $274,060 $270,920 +1.2% September 2017 $271,606 $256,092 +6.1% 12-Month Avg* $269,810 $253,699 +6.4% Historical Average Sales Price by Month Current as of October 5, 2017. Data is refreshed regularly to capture changes in market activity. Figures shown may be different than previously reported. All data from CarolinaMLS, Inc. Report provided by the Charlotte Regional Realtor® Association. Report © 2017 ShowingTime. | 10 Average sales price for all closed sales, not accounting for seller concessions, in a given month. Average Sales Price * Average Sales Price for all properties from October 2016 through September 2017. This is not the average of the individual figures above. $239,239 $256,092 $271,606 2015 2016 2017 September $180,000 $200,000 $220,000 $240,000 $260,000 $280,000 $300,000 1-2004 1-2005 1-2006 1-2007 1-2008 1-2009 1-2010 1-2011 1-2012 1-2013 1-2014 1-2015 1-2016 1-2017 $242,988 $257,726 $273,186 2015 2016 2017 Year to Date + 6.0%+ 7.0% + 6.1% + 6.1%+ 5.4% + 4.5%
  • 11. Median Sales Price Prior Year Percent Change October 2016 $210,000 $186,000 +12.9% November 2016 $210,000 $195,050 +7.7% December 2016 $210,000 $189,900 +10.6% January 2017 $204,600 $179,000 +14.3% February 2017 $200,000 $180,075 +11.1% March 2017 $220,215 $198,000 +11.2% April 2017 $226,000 $202,000 +11.9% May 2017 $227,050 $210,000 +8.1% June 2017 $245,000 $225,000 +8.9% July 2017 $236,500 $215,000 +10.0% August 2017 $229,900 $219,000 +5.0% September 2017 $225,000 $206,000 +9.2% 12-Month Avg* $223,505 $202,450 +10.4% Historical Median Sales Price by Month Current as of October 5, 2017. Data is refreshed regularly to capture changes in market activity. Figures shown may be different than previously reported. All data from CarolinaMLS, Inc. Report provided by the Charlotte Regional Realtor® Association. Report © 2017 ShowingTime. | 11 Point at which half of the sales sold for more and half sold for less, not accounting for seller concessions, in a given month. Median Sales Price * Median Sales Price for all properties from October 2016 through September 2017. This is not the average of the individual figures above. $189,750 $206,000 $225,000 2015 2016 2017 September $120,000 $140,000 $160,000 $180,000 $200,000 $220,000 $240,000 $260,000 1-2004 1-2005 1-2006 1-2007 1-2008 1-2009 1-2010 1-2011 1-2012 1-2013 1-2014 1-2015 1-2016 1-2017 $194,000 $206,000 $226,500 2015 2016 2017 Year to Date + 10.0%+ 8.6% + 9.2% + 6.2%+ 5.4% + 6.6%
  • 12. Percent of Original List Price Received Prior Year Percent Change October 2016 96.2% 94.7% +1.6% November 2016 96.2% 95.0% +1.3% December 2016 95.8% 95.1% +0.7% January 2017 96.0% 94.7% +1.4% February 2017 96.3% 95.0% +1.4% March 2017 96.9% 95.6% +1.4% April 2017 97.3% 96.3% +1.0% May 2017 97.3% 96.8% +0.5% June 2017 97.5% 96.8% +0.7% July 2017 97.2% 96.7% +0.5% August 2017 97.1% 96.6% +0.5% September 2017 96.7% 96.2% +0.5% 12-Month Avg* 96.8% 96.0% +0.8% Historical Percent of Original List Price Received by Month Current as of October 5, 2017. Data is refreshed regularly to capture changes in market activity. Figures shown may be different than previously reported. All data from CarolinaMLS, Inc. Report provided by the Charlotte Regional Realtor® Association. Report © 2017 ShowingTime. | 12 Percentage found when dividing a property’s sales price by its original list price, then taking the average for all properties sold in a given month, not accounting for seller concessions. Pct. of Orig. Price Received * Pct. of Orig. Price Received for all properties from October 2016 through September 2017. This is not the average of the individual figures above. 95.2% 96.2% 96.7% 2015 2016 2017 September 86.0% 88.0% 90.0% 92.0% 94.0% 96.0% 98.0% 1-2004 1-2005 1-2006 1-2007 1-2008 1-2009 1-2010 1-2011 1-2012 1-2013 1-2014 1-2015 1-2016 1-2017 95.0% 96.3% 97.0% 2015 2016 2017 Year to Date + 0.7%+ 1.1% + 0.5% + 1.4%+ 1.1% + 0.8%
  • 13. Housing Affordability Index Prior Year Percent Change October 2016 115 123 -6.5% November 2016 111 117 -5.1% December 2016 108 121 -10.7% January 2017 112 128 -12.5% February 2017 115 128 -10.2% March 2017 105 116 -9.5% April 2017 104 115 -9.6% May 2017 105 112 -6.3% June 2017 99 105 -5.7% July 2017 103 110 -6.4% August 2017 106 108 -1.9% September 2017 108 117 -7.7% 12-Month Avg 108 117 -7.7% Historical Housing Affordability Index by Month Current as of October 5, 2017. Data is refreshed regularly to capture changes in market activity. Figures shown may be different than previously reported. All data from CarolinaMLS, Inc. Report provided by the Charlotte Regional Realtor® Association. Report © 2017 ShowingTime. | 13 This index measures housing affordability for the region. For example, an index of 120 means the median household income is 120% of what is necessary to qualify for the median-priced home under prevailing interest rates. A higher number means greater affordability. Affordability Index 121 117 108 2015 2016 2017 September 80 100 120 140 160 180 1-2004 1-2005 1-2006 1-2007 1-2008 1-2009 1-2010 1-2011 1-2012 1-2013 1-2014 1-2015 1-2016 1-2017 118 117 107 2015 2016 2017 Year to Date - 8.5%- 3.3% - 7.7% - 0.8%- 0.8% - 2.5%
  • 14. Inventory of Homes for Sale Prior Year Percent Change October 2016 11,753 13,780 -14.7% November 2016 11,005 13,041 -15.6% December 2016 9,923 11,809 -16.0% January 2017 9,742 11,548 -15.6% February 2017 9,929 11,236 -11.6% March 2017 10,394 11,583 -10.3% April 2017 10,658 11,934 -10.7% May 2017 10,967 12,277 -10.7% June 2017 11,039 12,602 -12.4% July 2017 11,037 12,694 -13.1% August 2017 10,824 12,484 -13.3% September 2017 10,140 12,297 -17.5% 12-Month Avg 10,618 12,274 -13.5% Historical Inventory of Homes for Sale by Month Current as of October 5, 2017. Data is refreshed regularly to capture changes in market activity. Figures shown may be different than previously reported. All data from CarolinaMLS, Inc. Report provided by the Charlotte Regional Realtor® Association. Report © 2017 ShowingTime. | 14 The number of properties available for sale in active status at the end of a given month. Homes for Sale 14,220 12,297 10,140 2015 2016 2017 September 5,000 10,000 15,000 20,000 25,000 30,000 1-2004 1-2005 1-2006 1-2007 1-2008 1-2009 1-2010 1-2011 1-2012 1-2013 1-2014 1-2015 1-2016 1-2017 - 13.5% - 17.5%- 13.3%
  • 15. Months Supply of Homes for Sale Prior Year Percent Change October 2016 3.2 4.0 -20.0% November 2016 2.9 3.8 -23.7% December 2016 2.6 3.4 -23.5% January 2017 2.6 3.4 -23.5% February 2017 2.6 3.2 -18.8% March 2017 2.7 3.3 -18.2% April 2017 2.8 3.4 -17.6% May 2017 2.8 3.4 -17.6% June 2017 2.8 3.5 -20.0% July 2017 2.8 3.5 -20.0% August 2017 2.8 3.4 -17.6% September 2017 2.5 3.3 -24.2% 12-Month Avg* 2.8 3.5 -20.0% Historical Months Supply of Homes for Sale by Month Current as of October 5, 2017. Data is refreshed regularly to capture changes in market activity. Figures shown may be different than previously reported. All data from CarolinaMLS, Inc. Report provided by the Charlotte Regional Realtor® Association. Report © 2017 ShowingTime. | 15 The inventory of homes for sale at the end of a given month, divided by the average monthly pending sales from the last 12 months. Months Supply * Months Supply for all properties from October 2016 through September 2017. This is not the average of the individual figures above. 4.2 3.3 2.5 2015 2016 2017 September 2.0 4.0 6.0 8.0 10.0 12.0 14.0 16.0 1-2005 1-2006 1-2007 1-2008 1-2009 1-2010 1-2011 1-2012 1-2013 1-2014 1-2015 1-2016 1-2017 - 21.4% - 24.2%- 23.6%