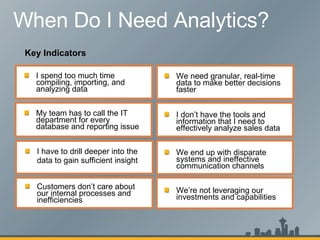
Downloaded 298 times
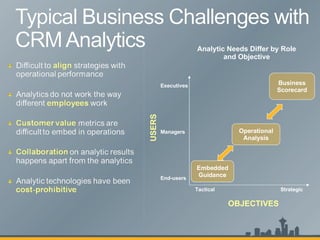
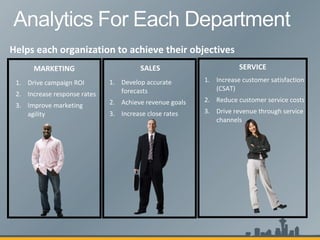
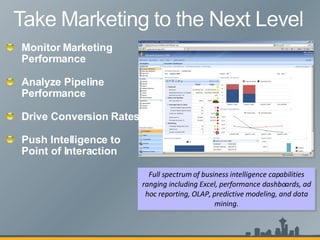
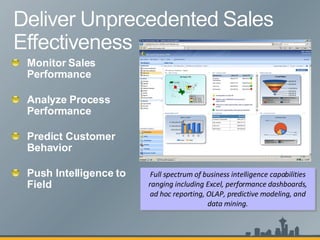
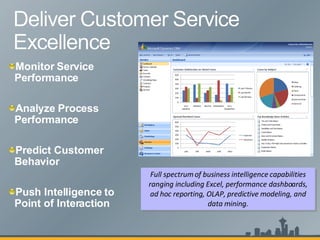
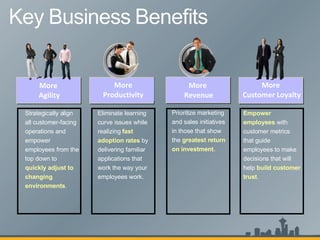
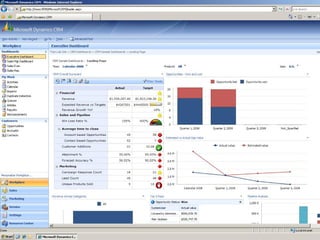
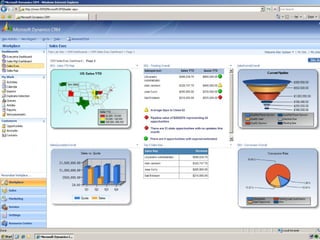
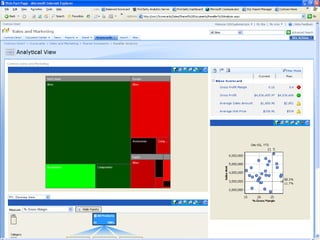
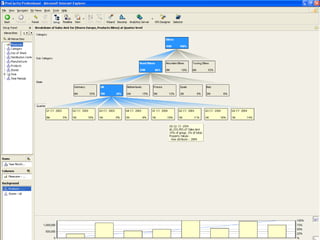
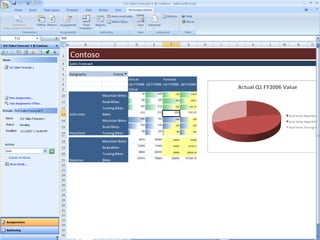
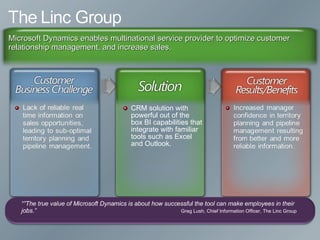
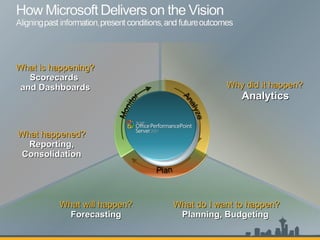

The document discusses business intelligence and analytics solutions from Microsoft. It outlines how different roles like executives, managers, and end-users have varying objectives that analytics can help achieve. It then describes Microsoft's full spectrum of BI capabilities, which range from Excel and dashboards to predictive modeling and data mining. These solutions can help organizations by providing more agility, loyalty, revenue, and productivity.