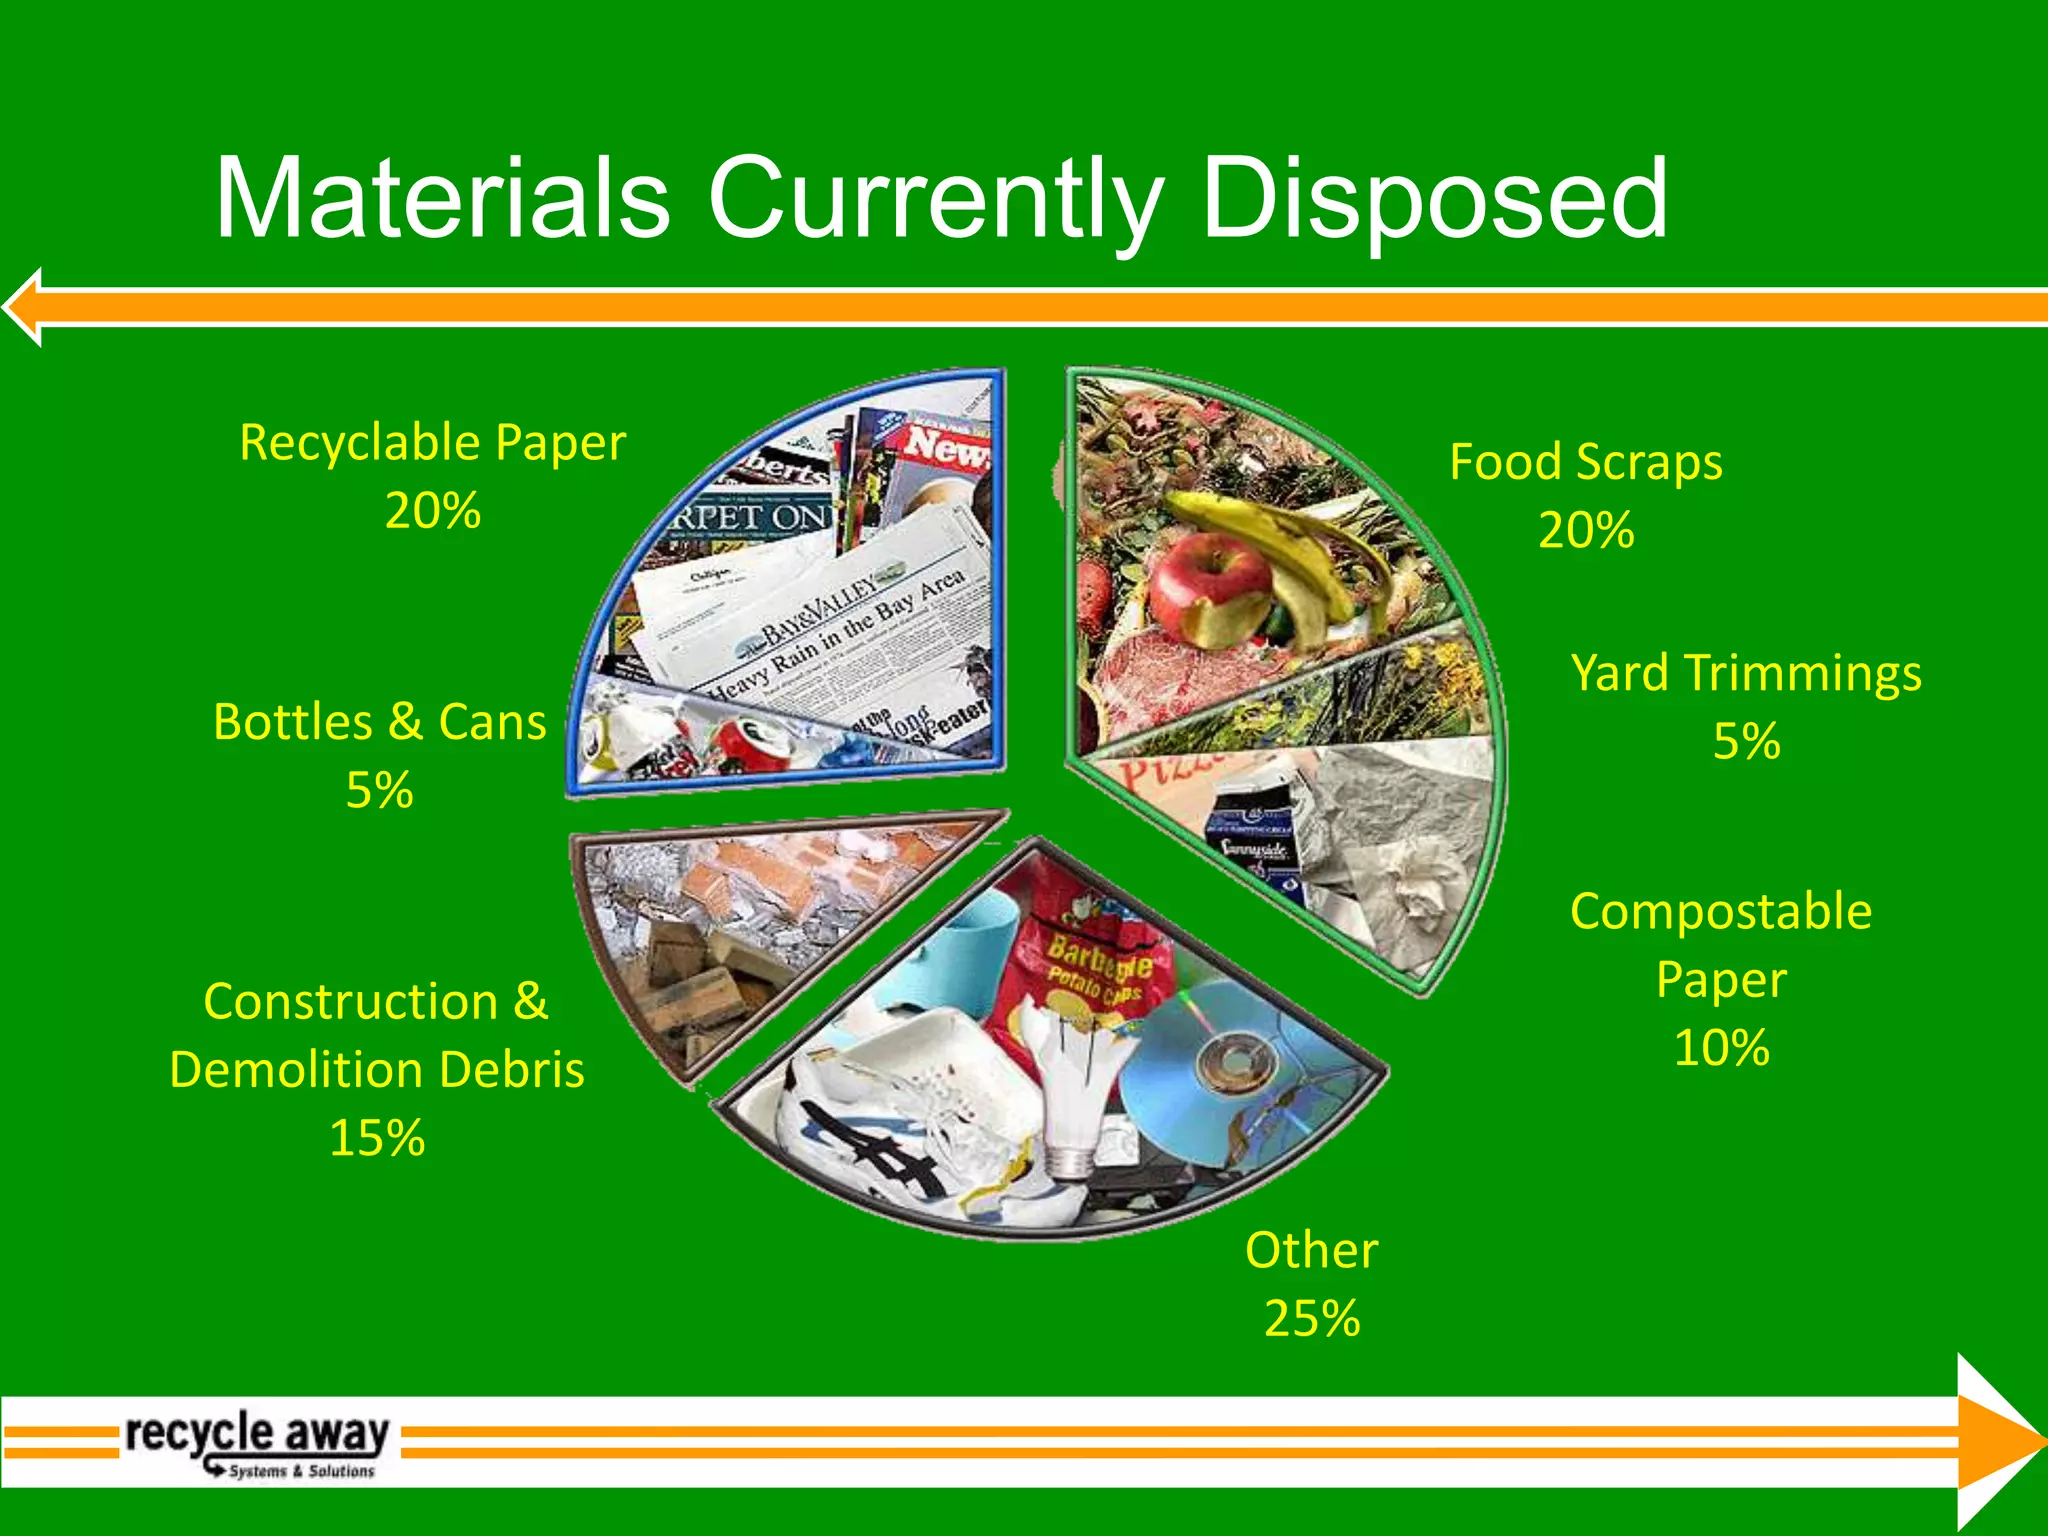
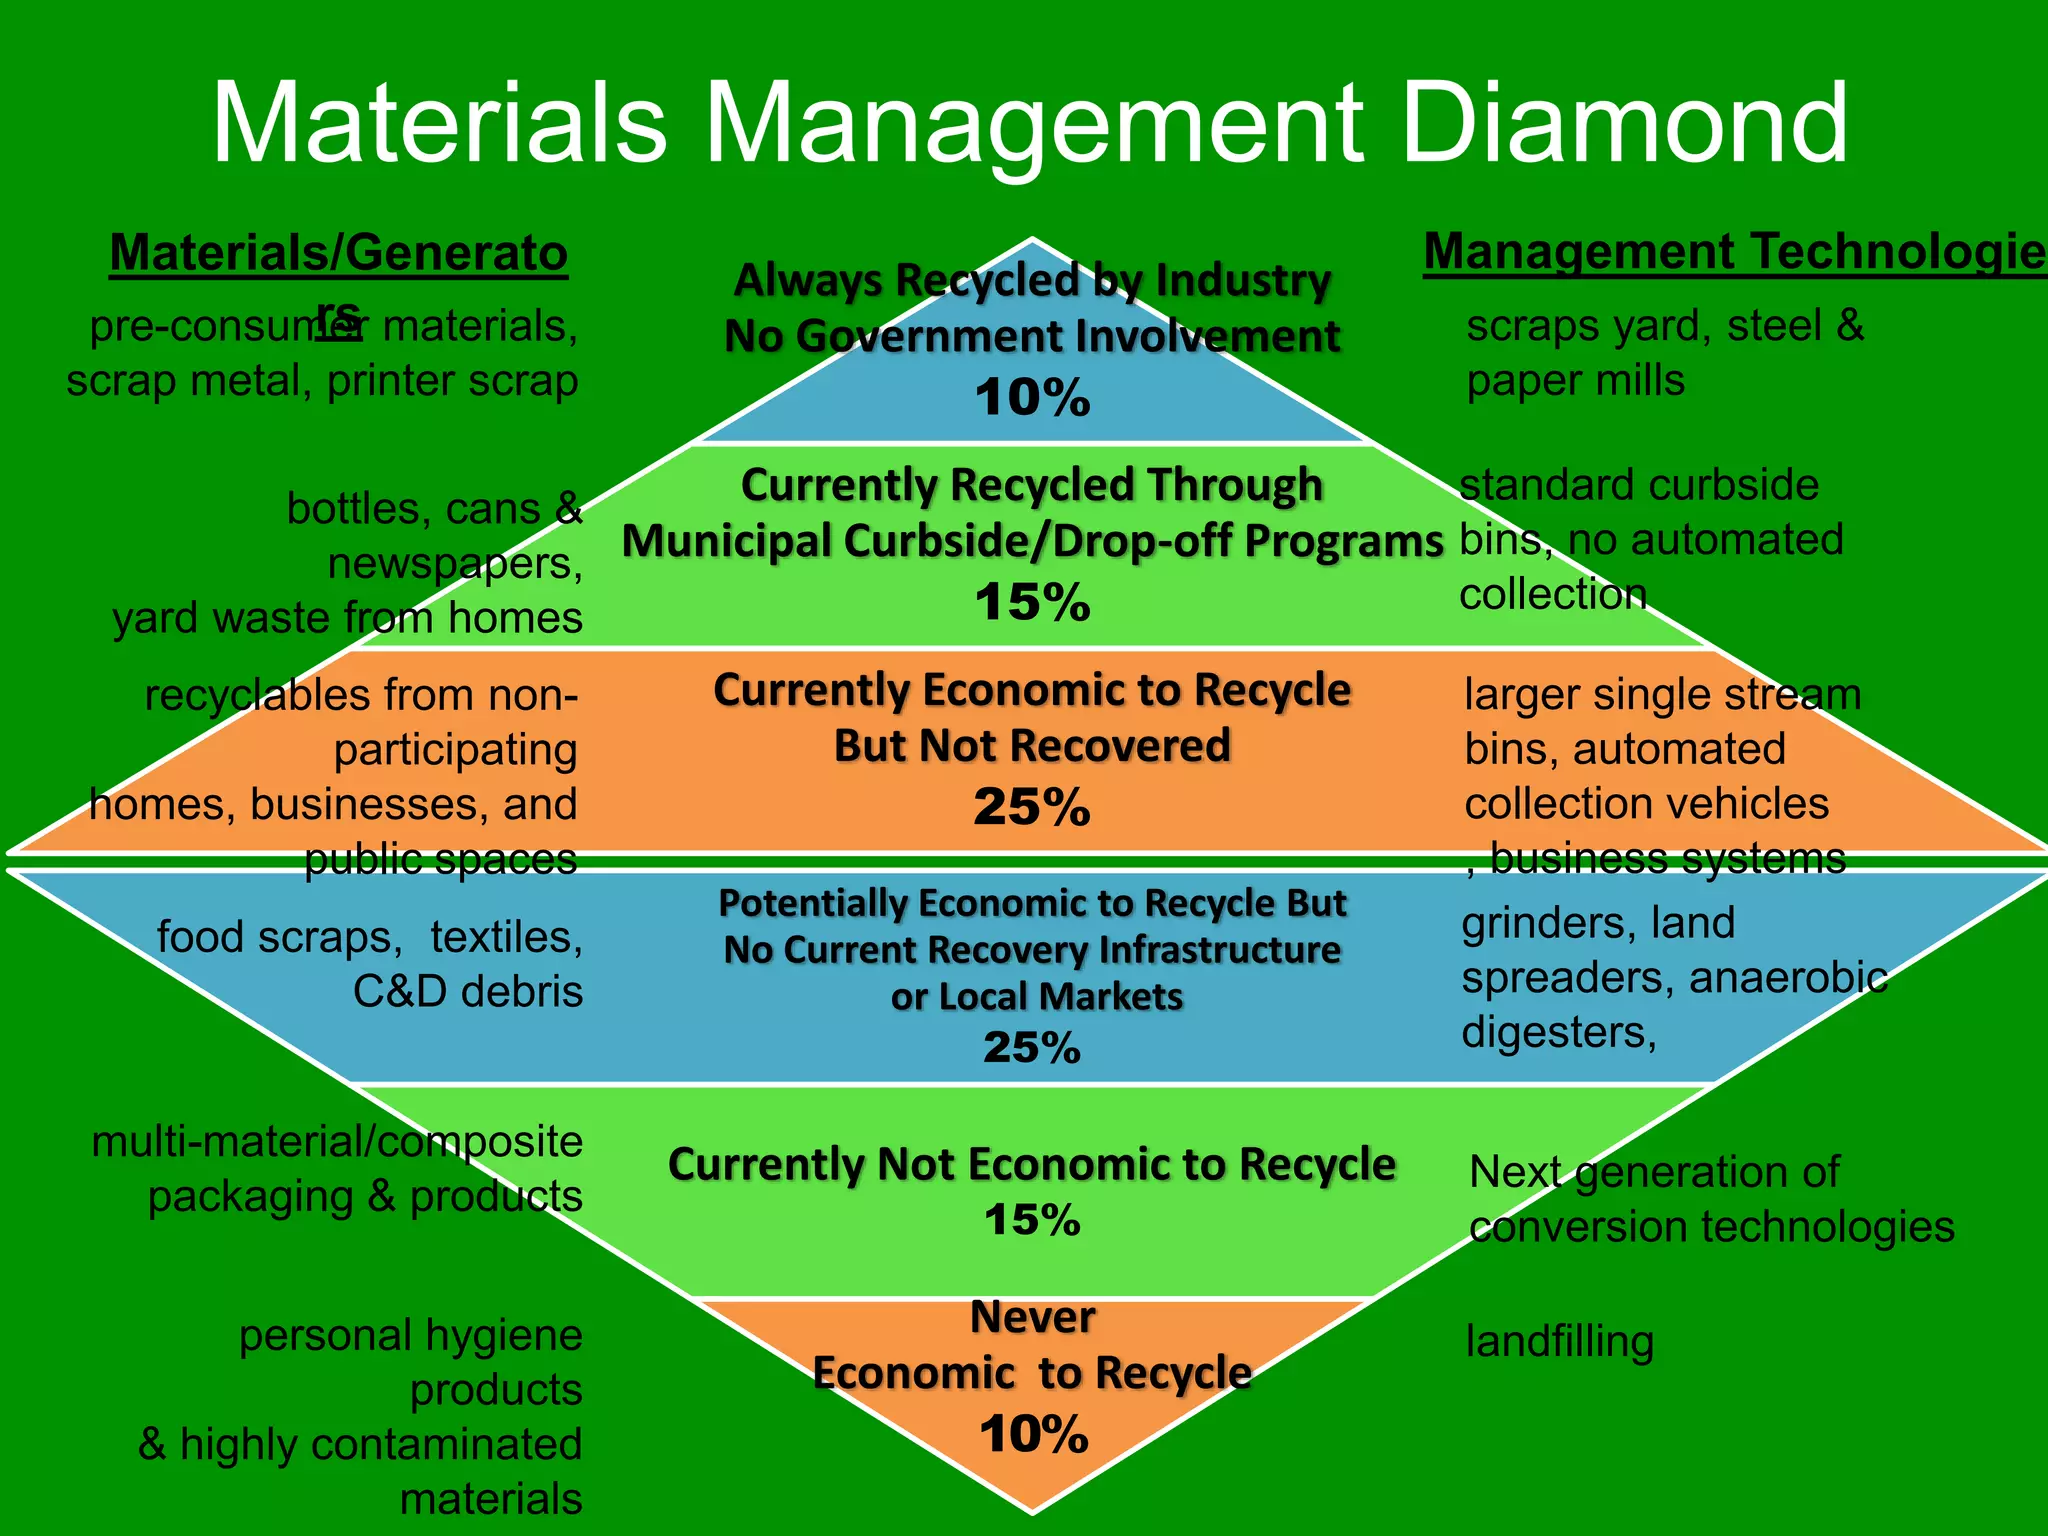
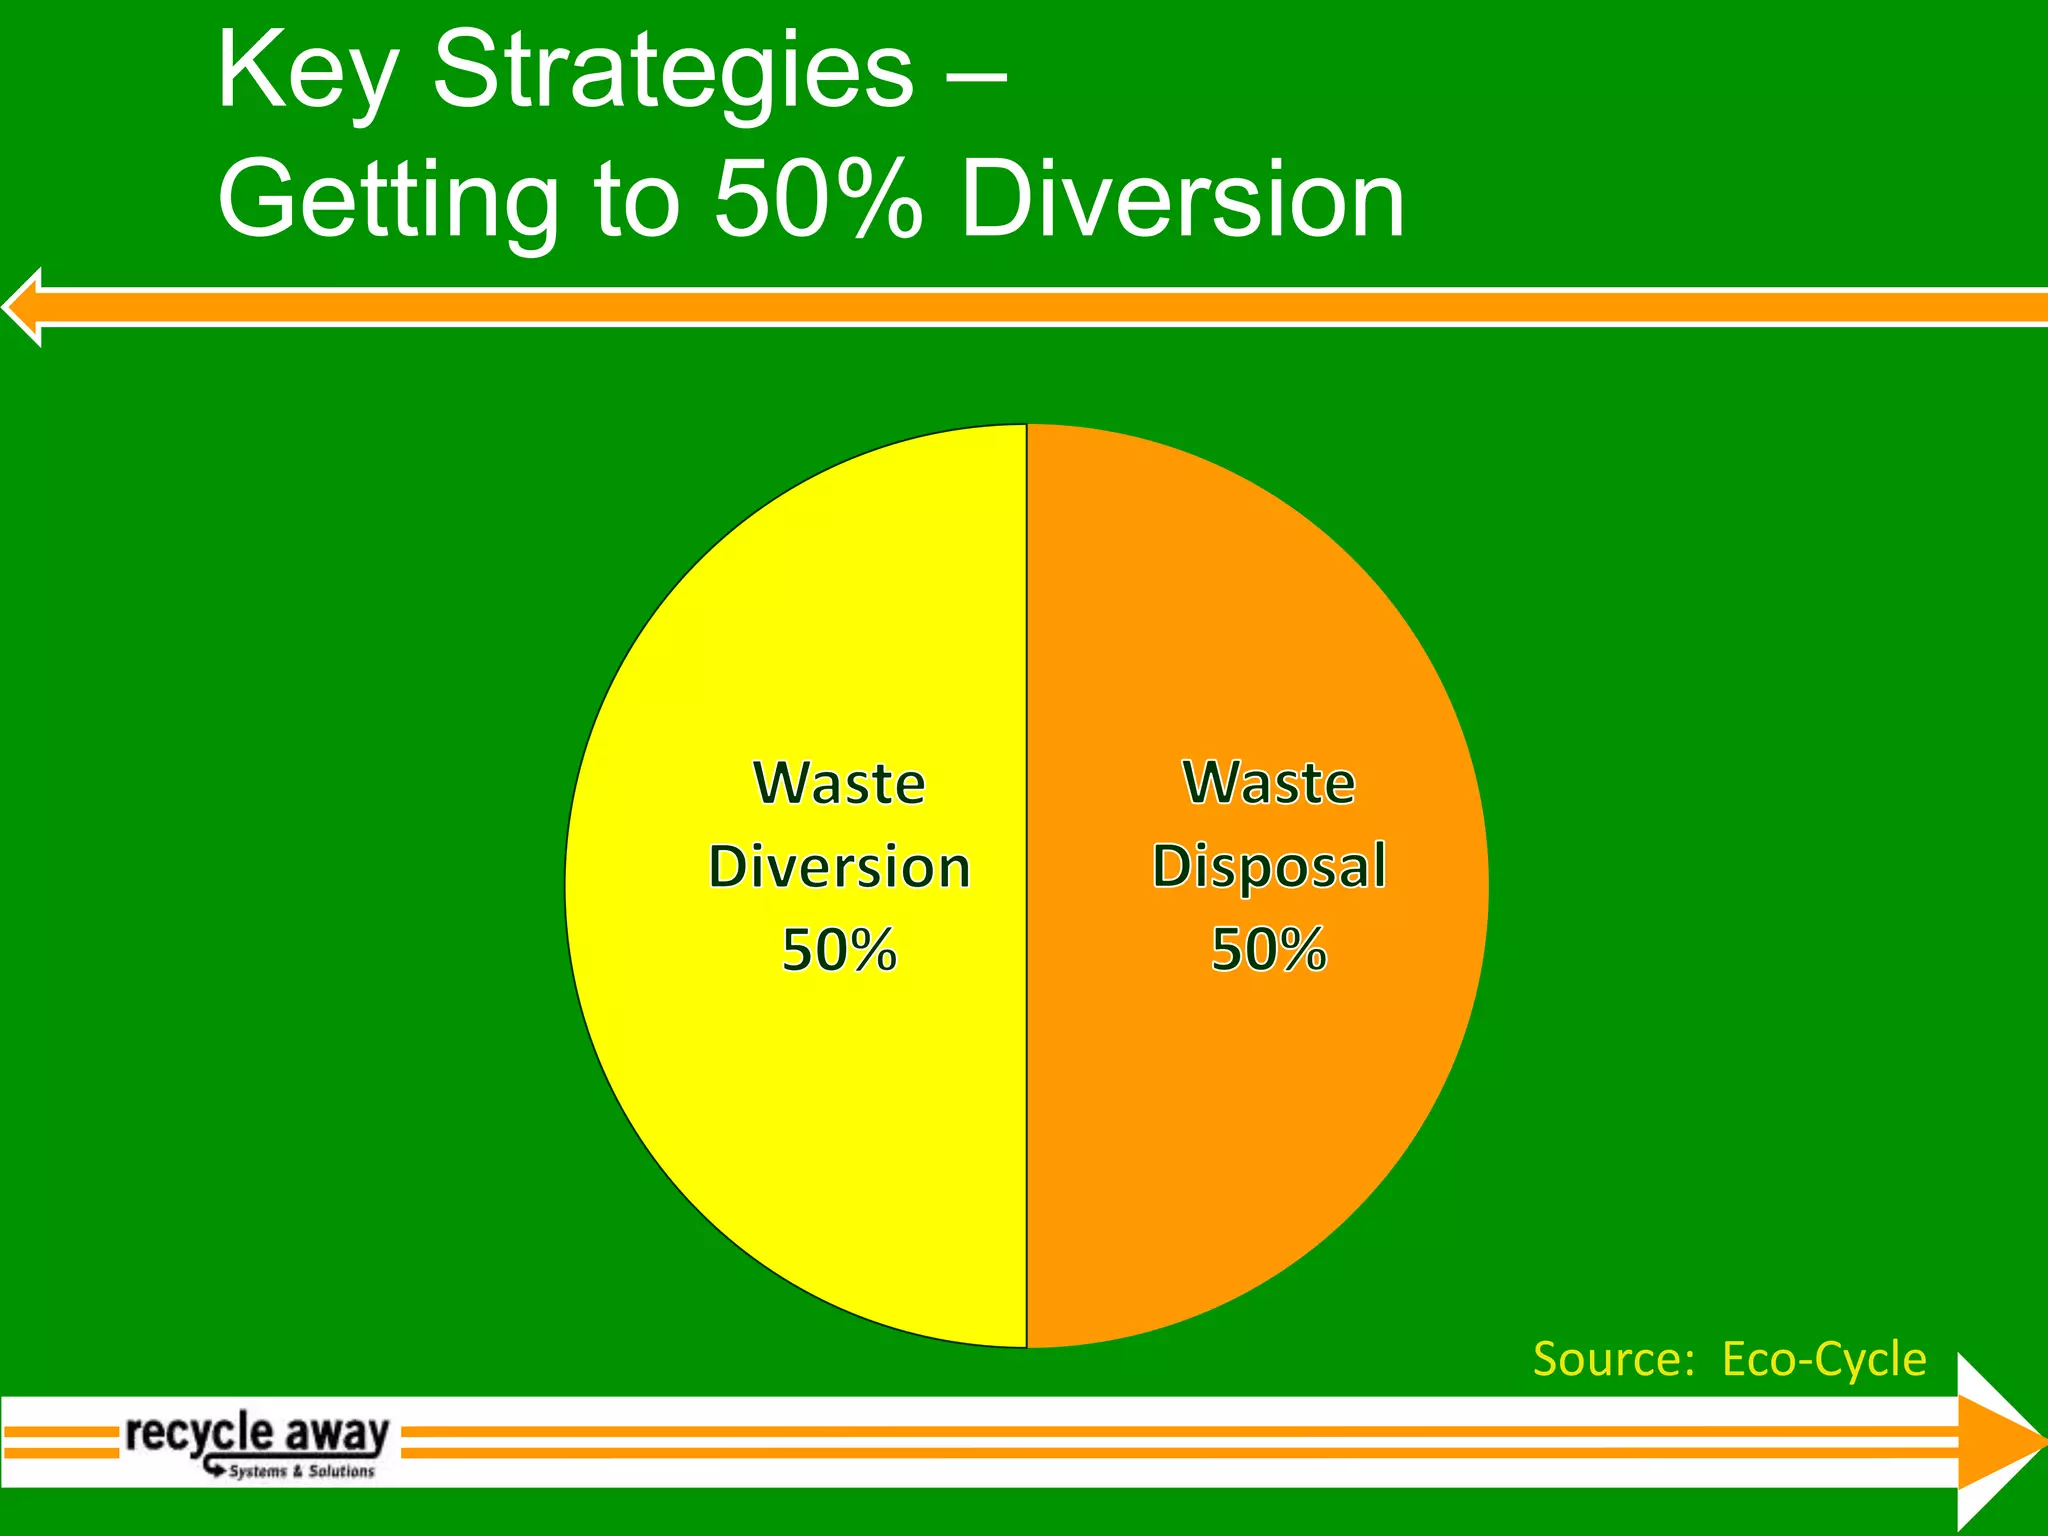
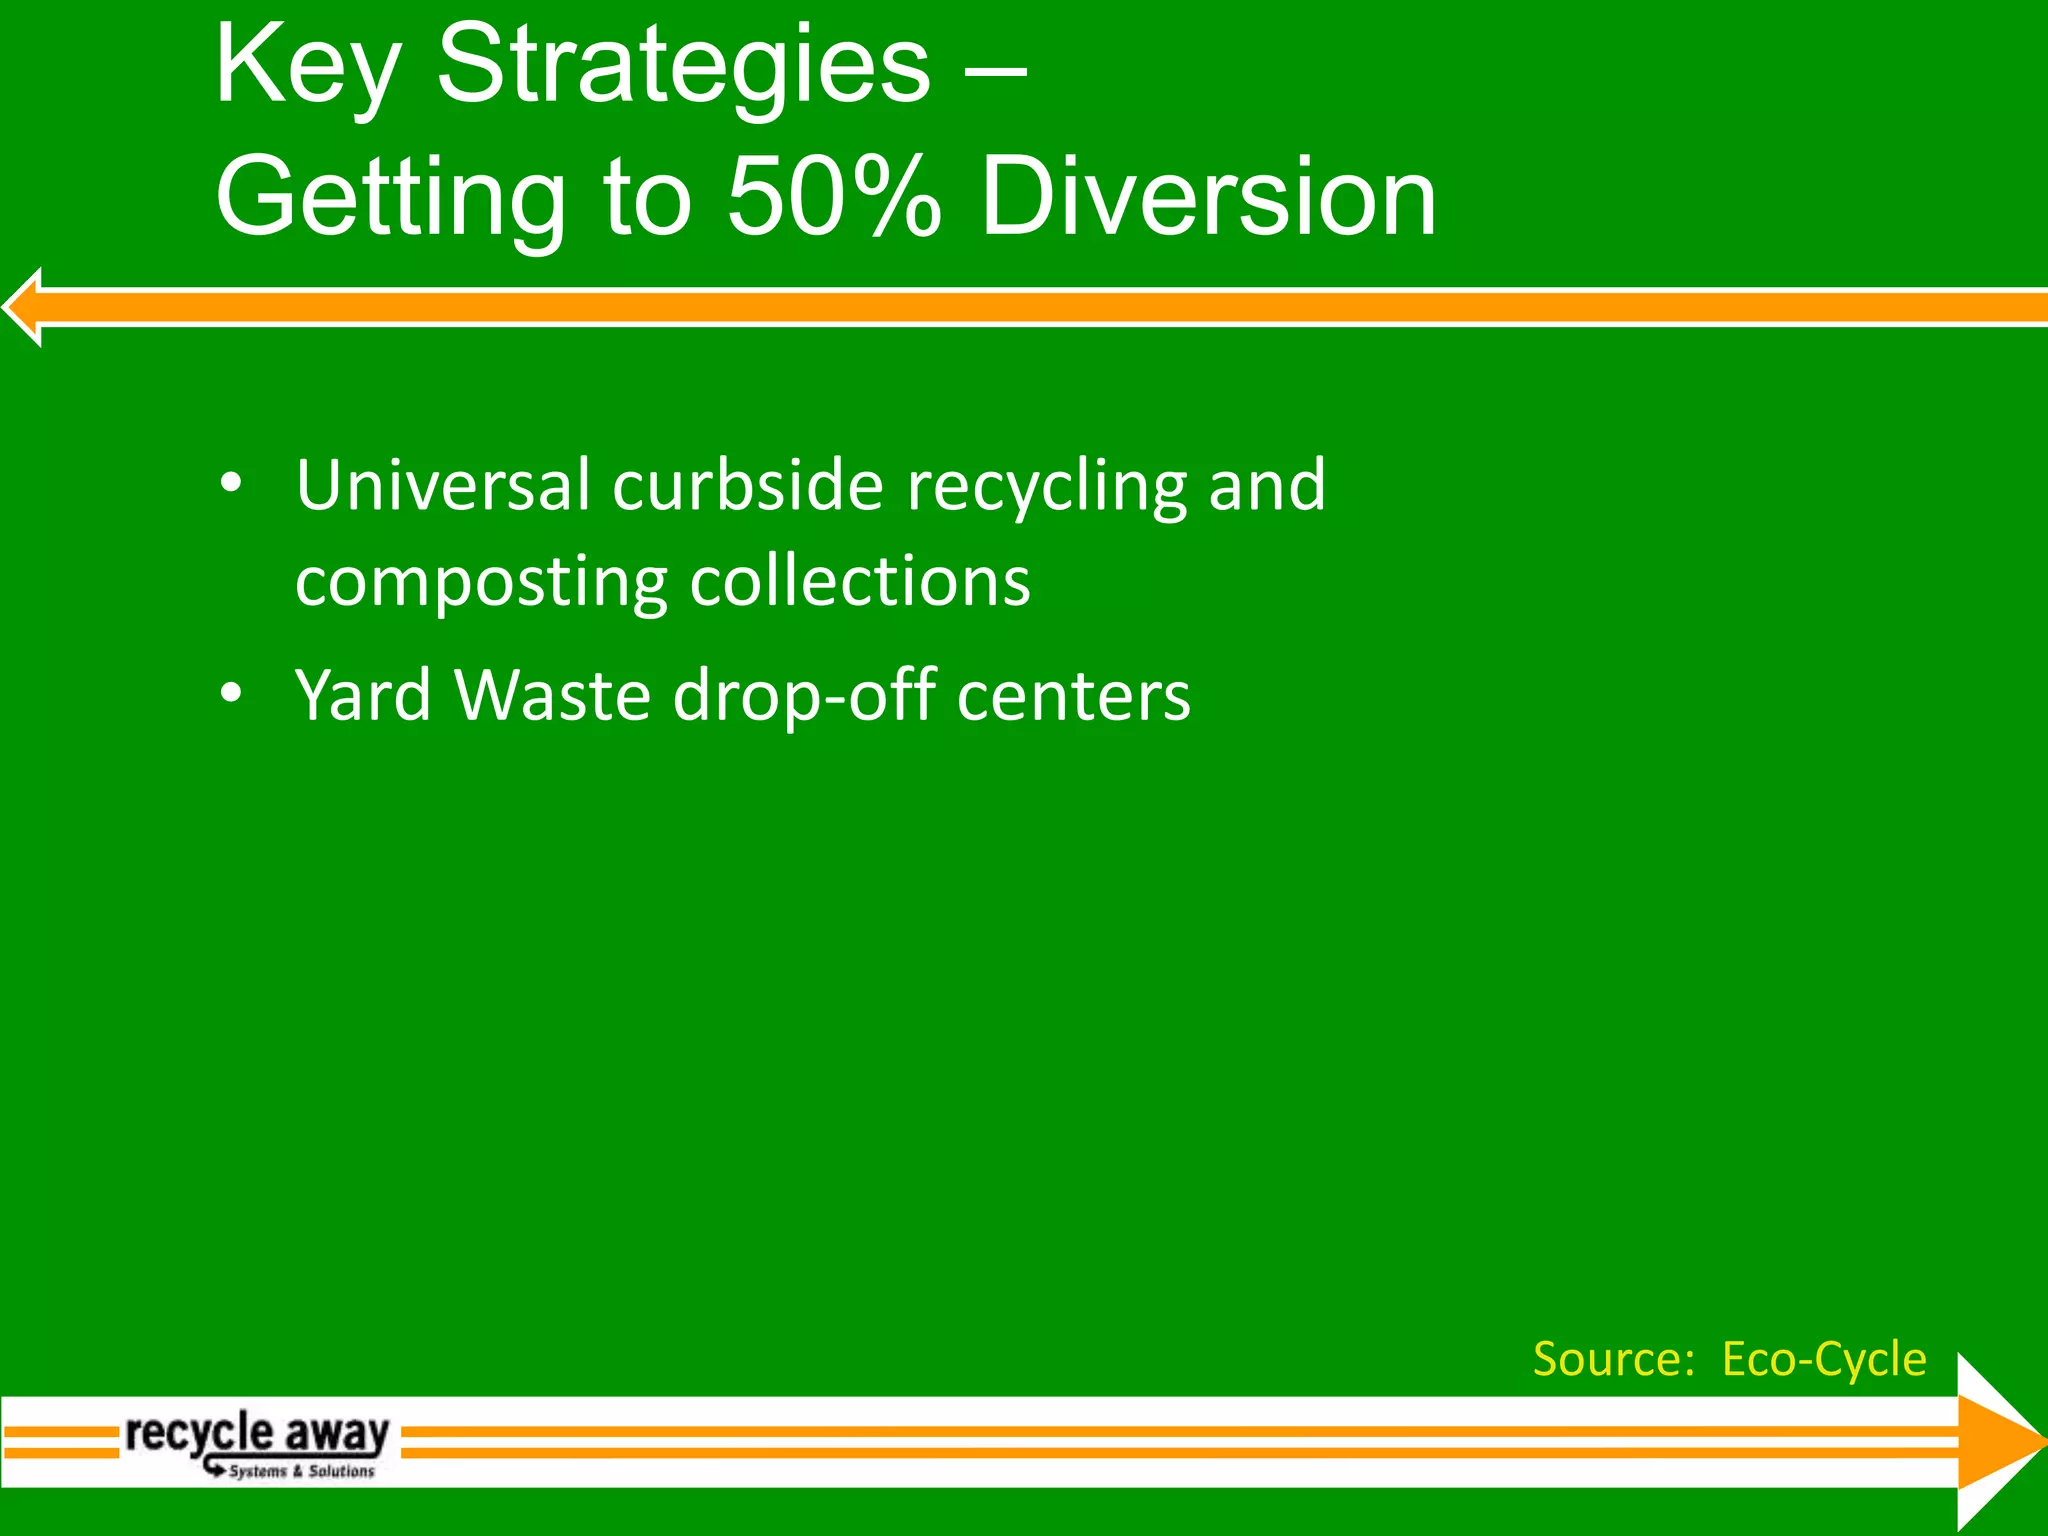
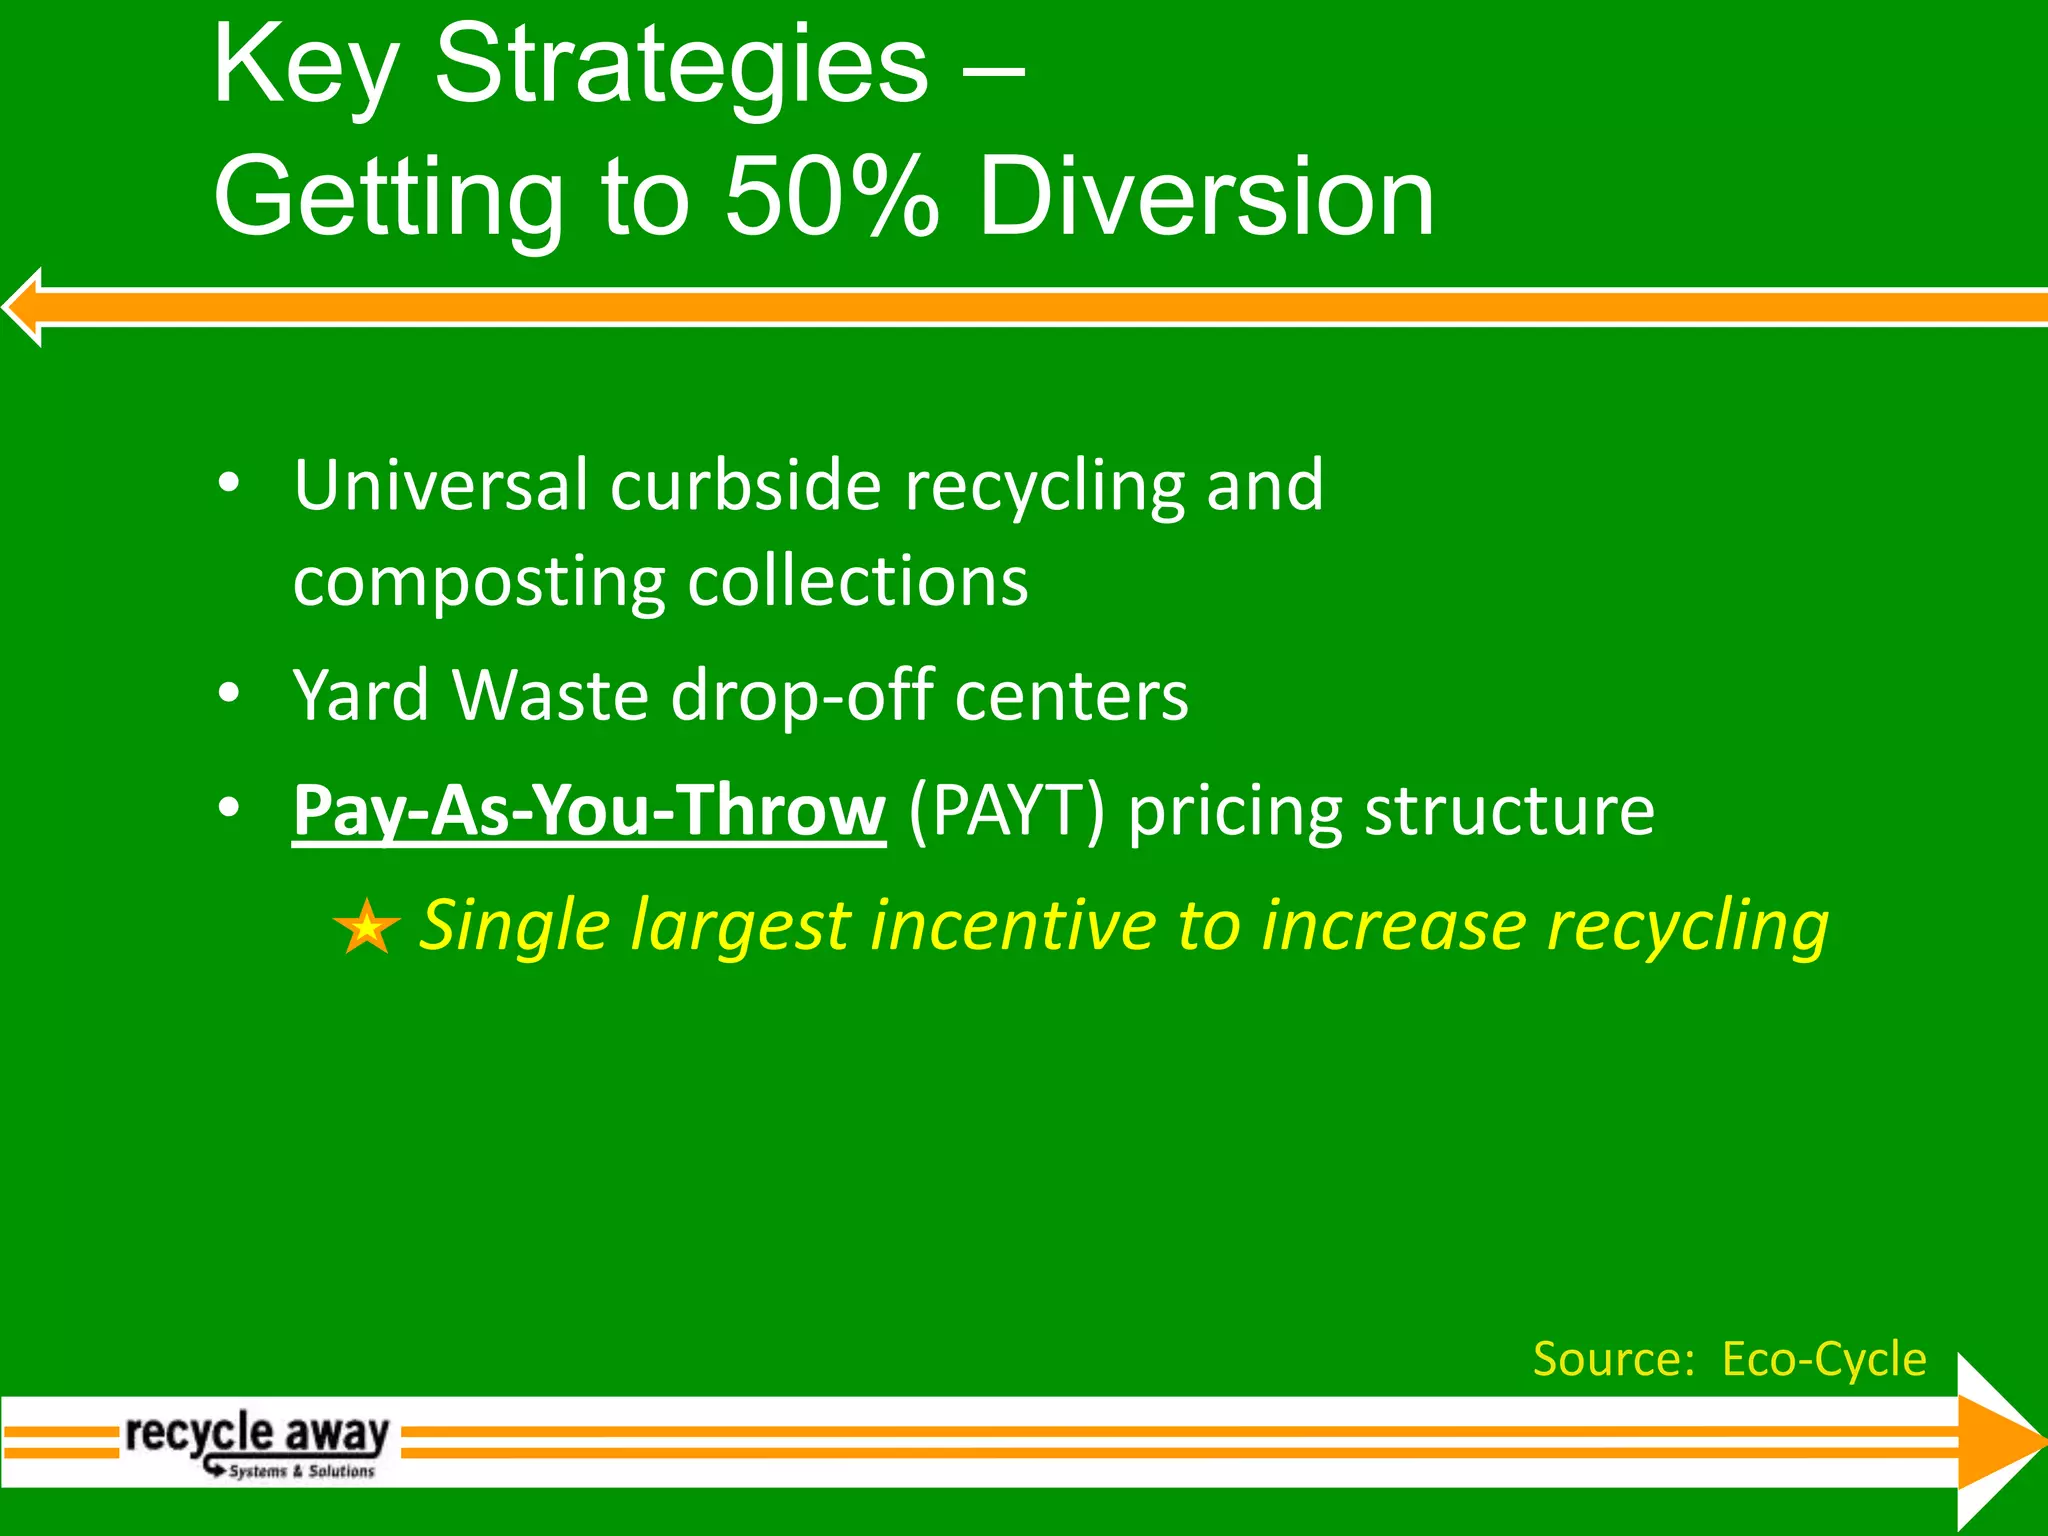
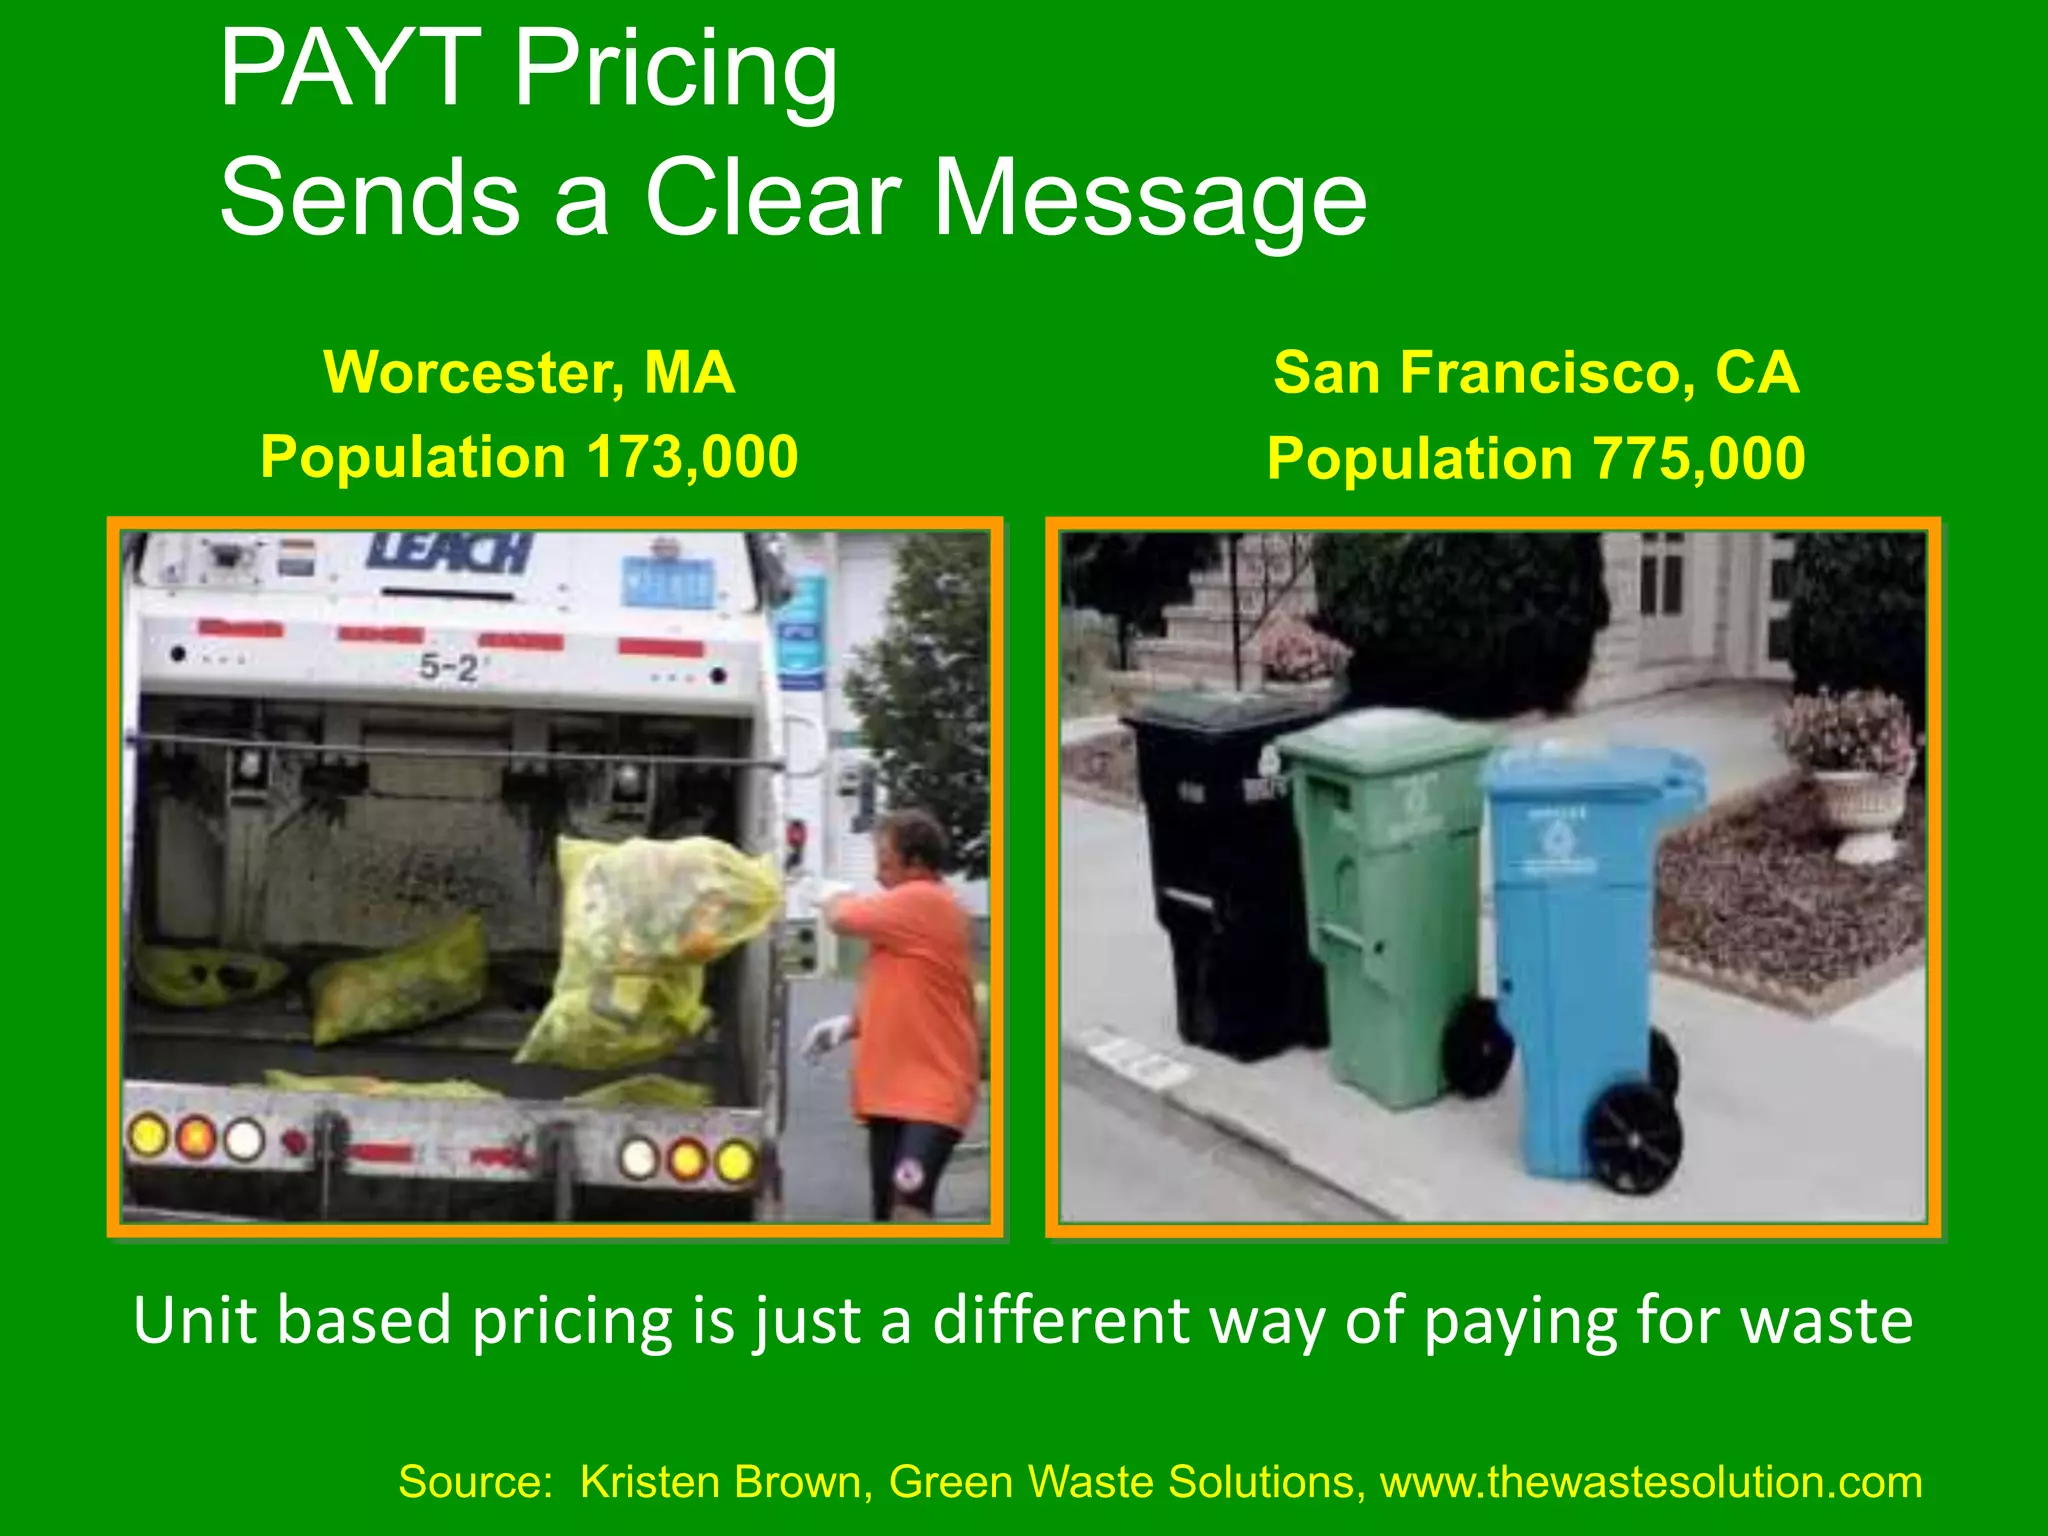
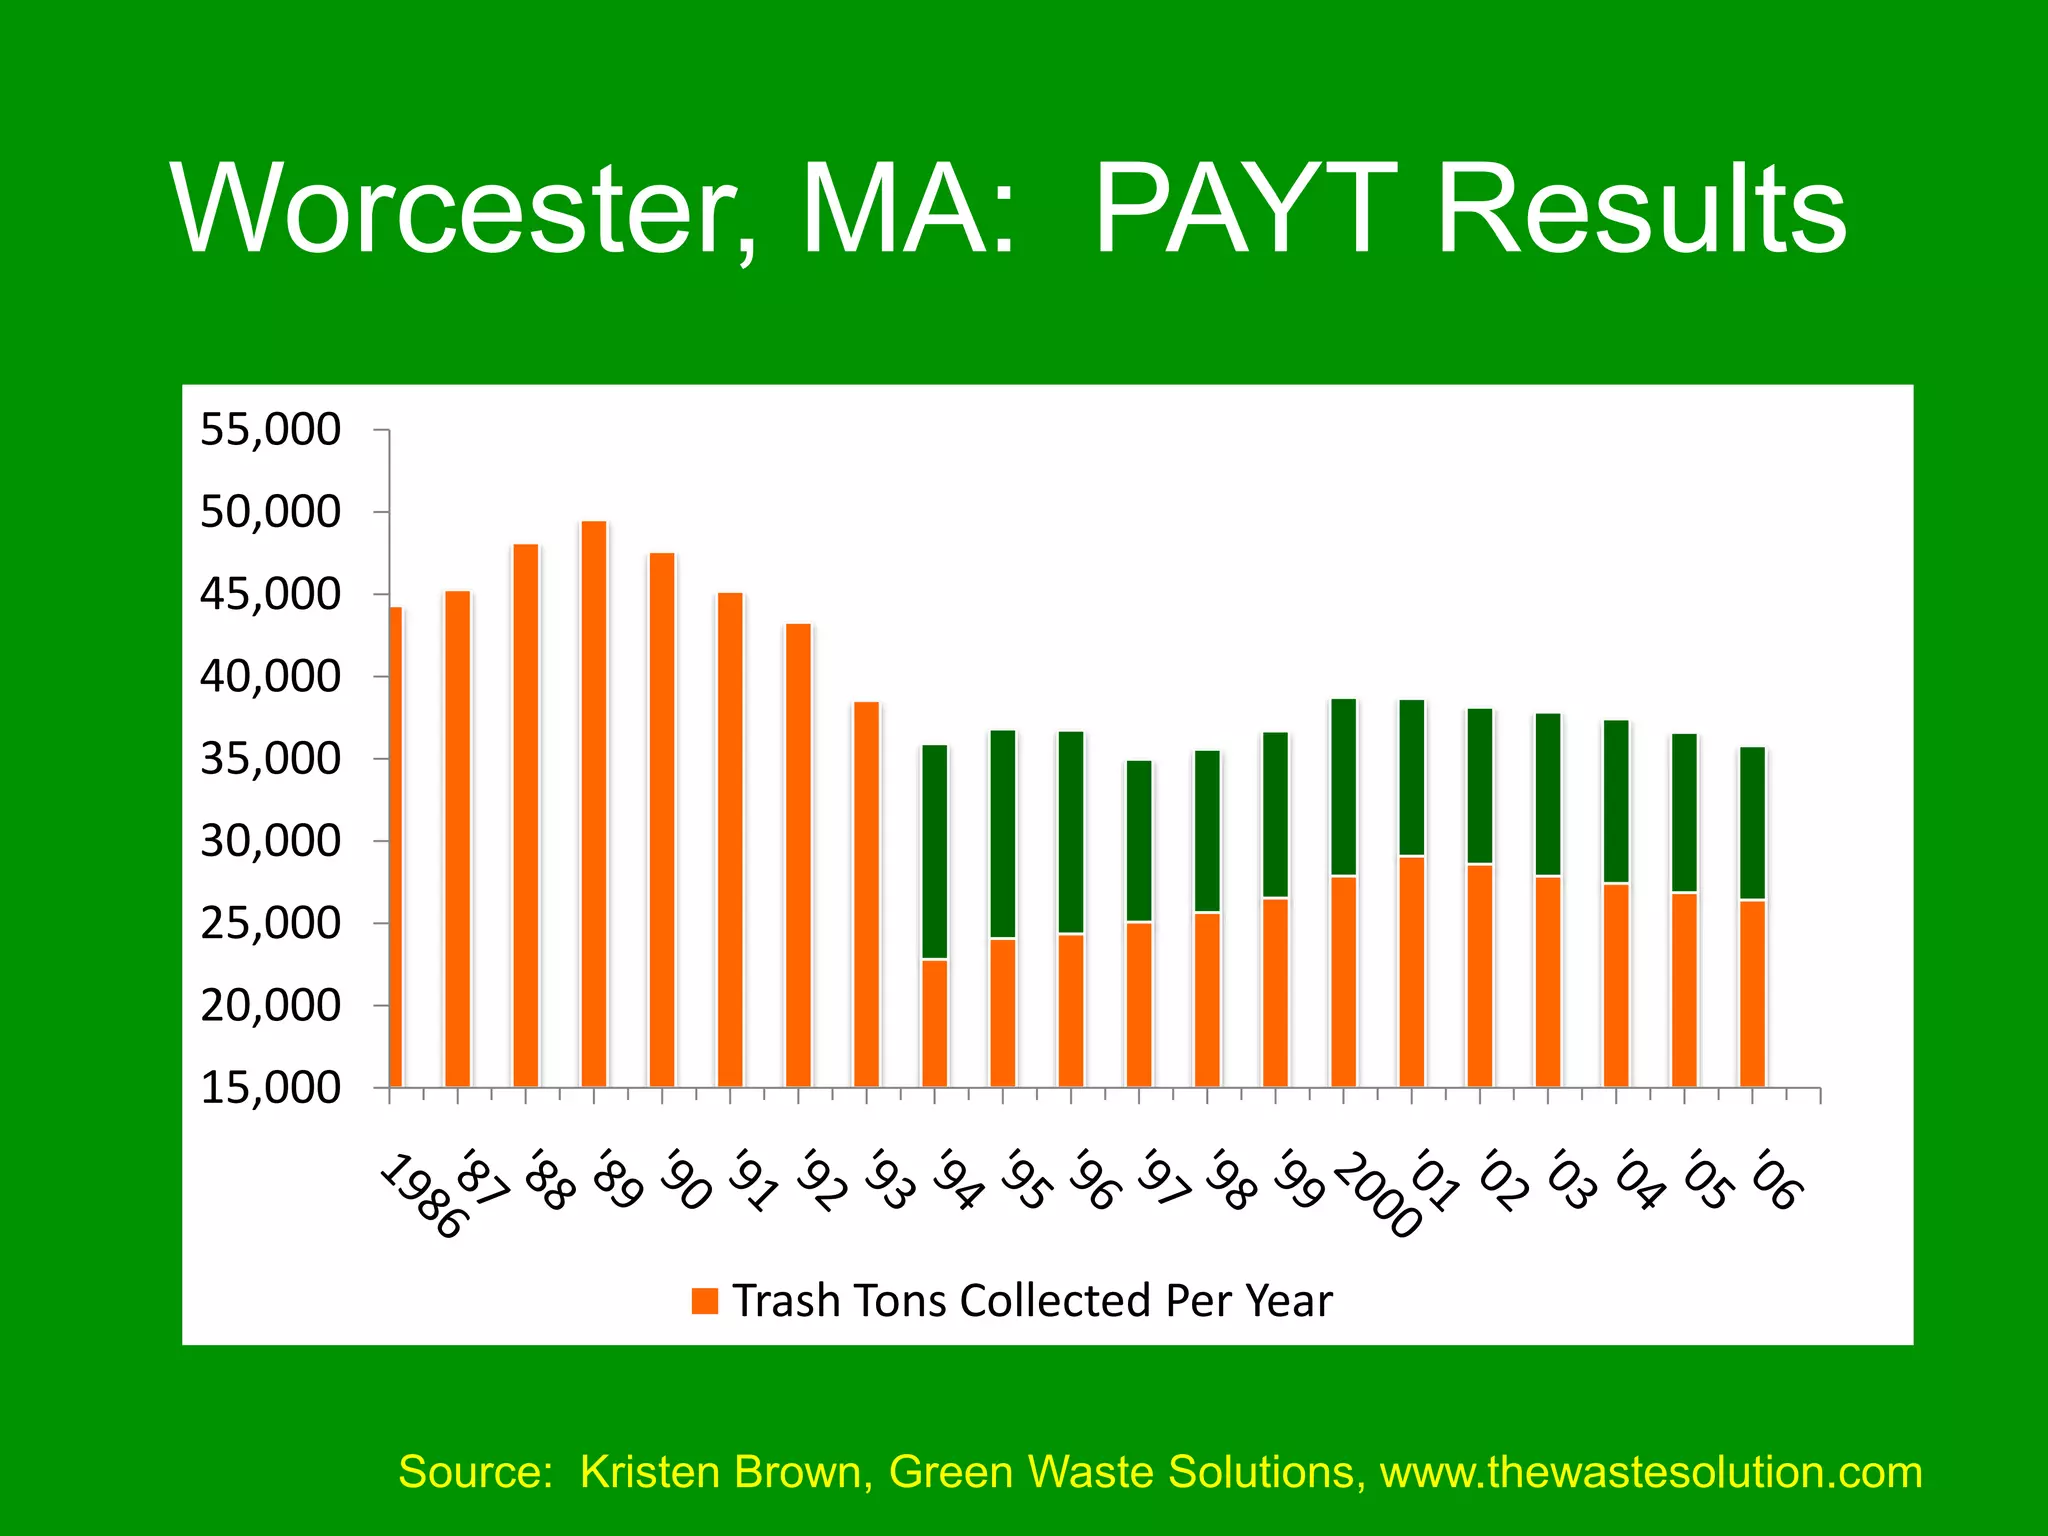
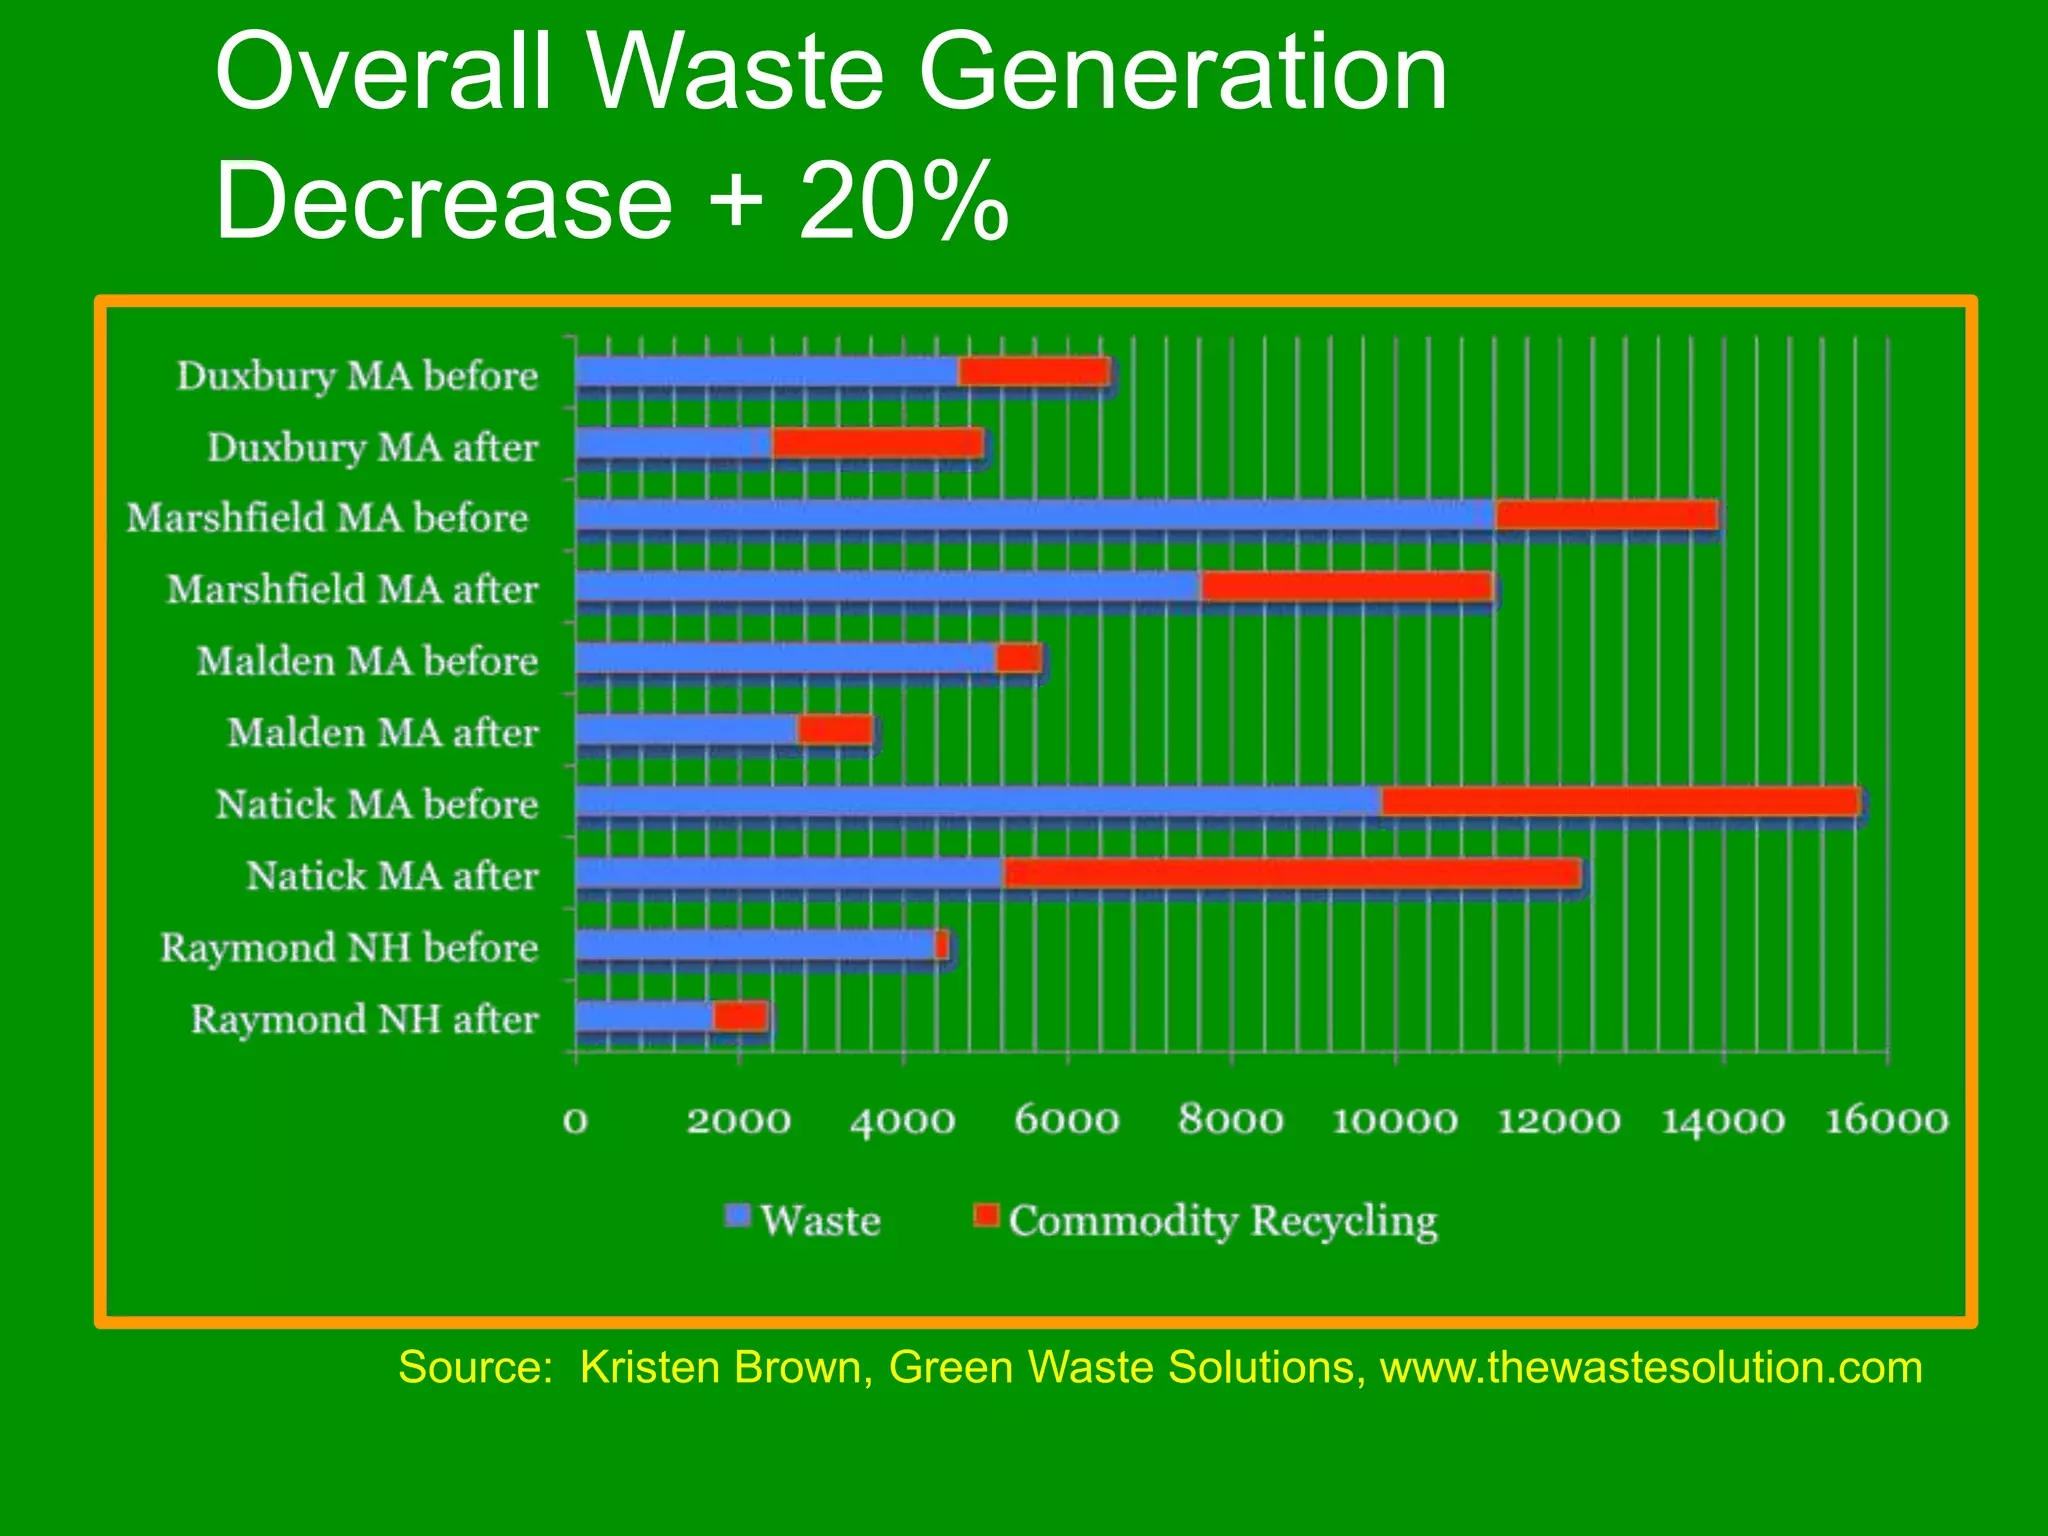
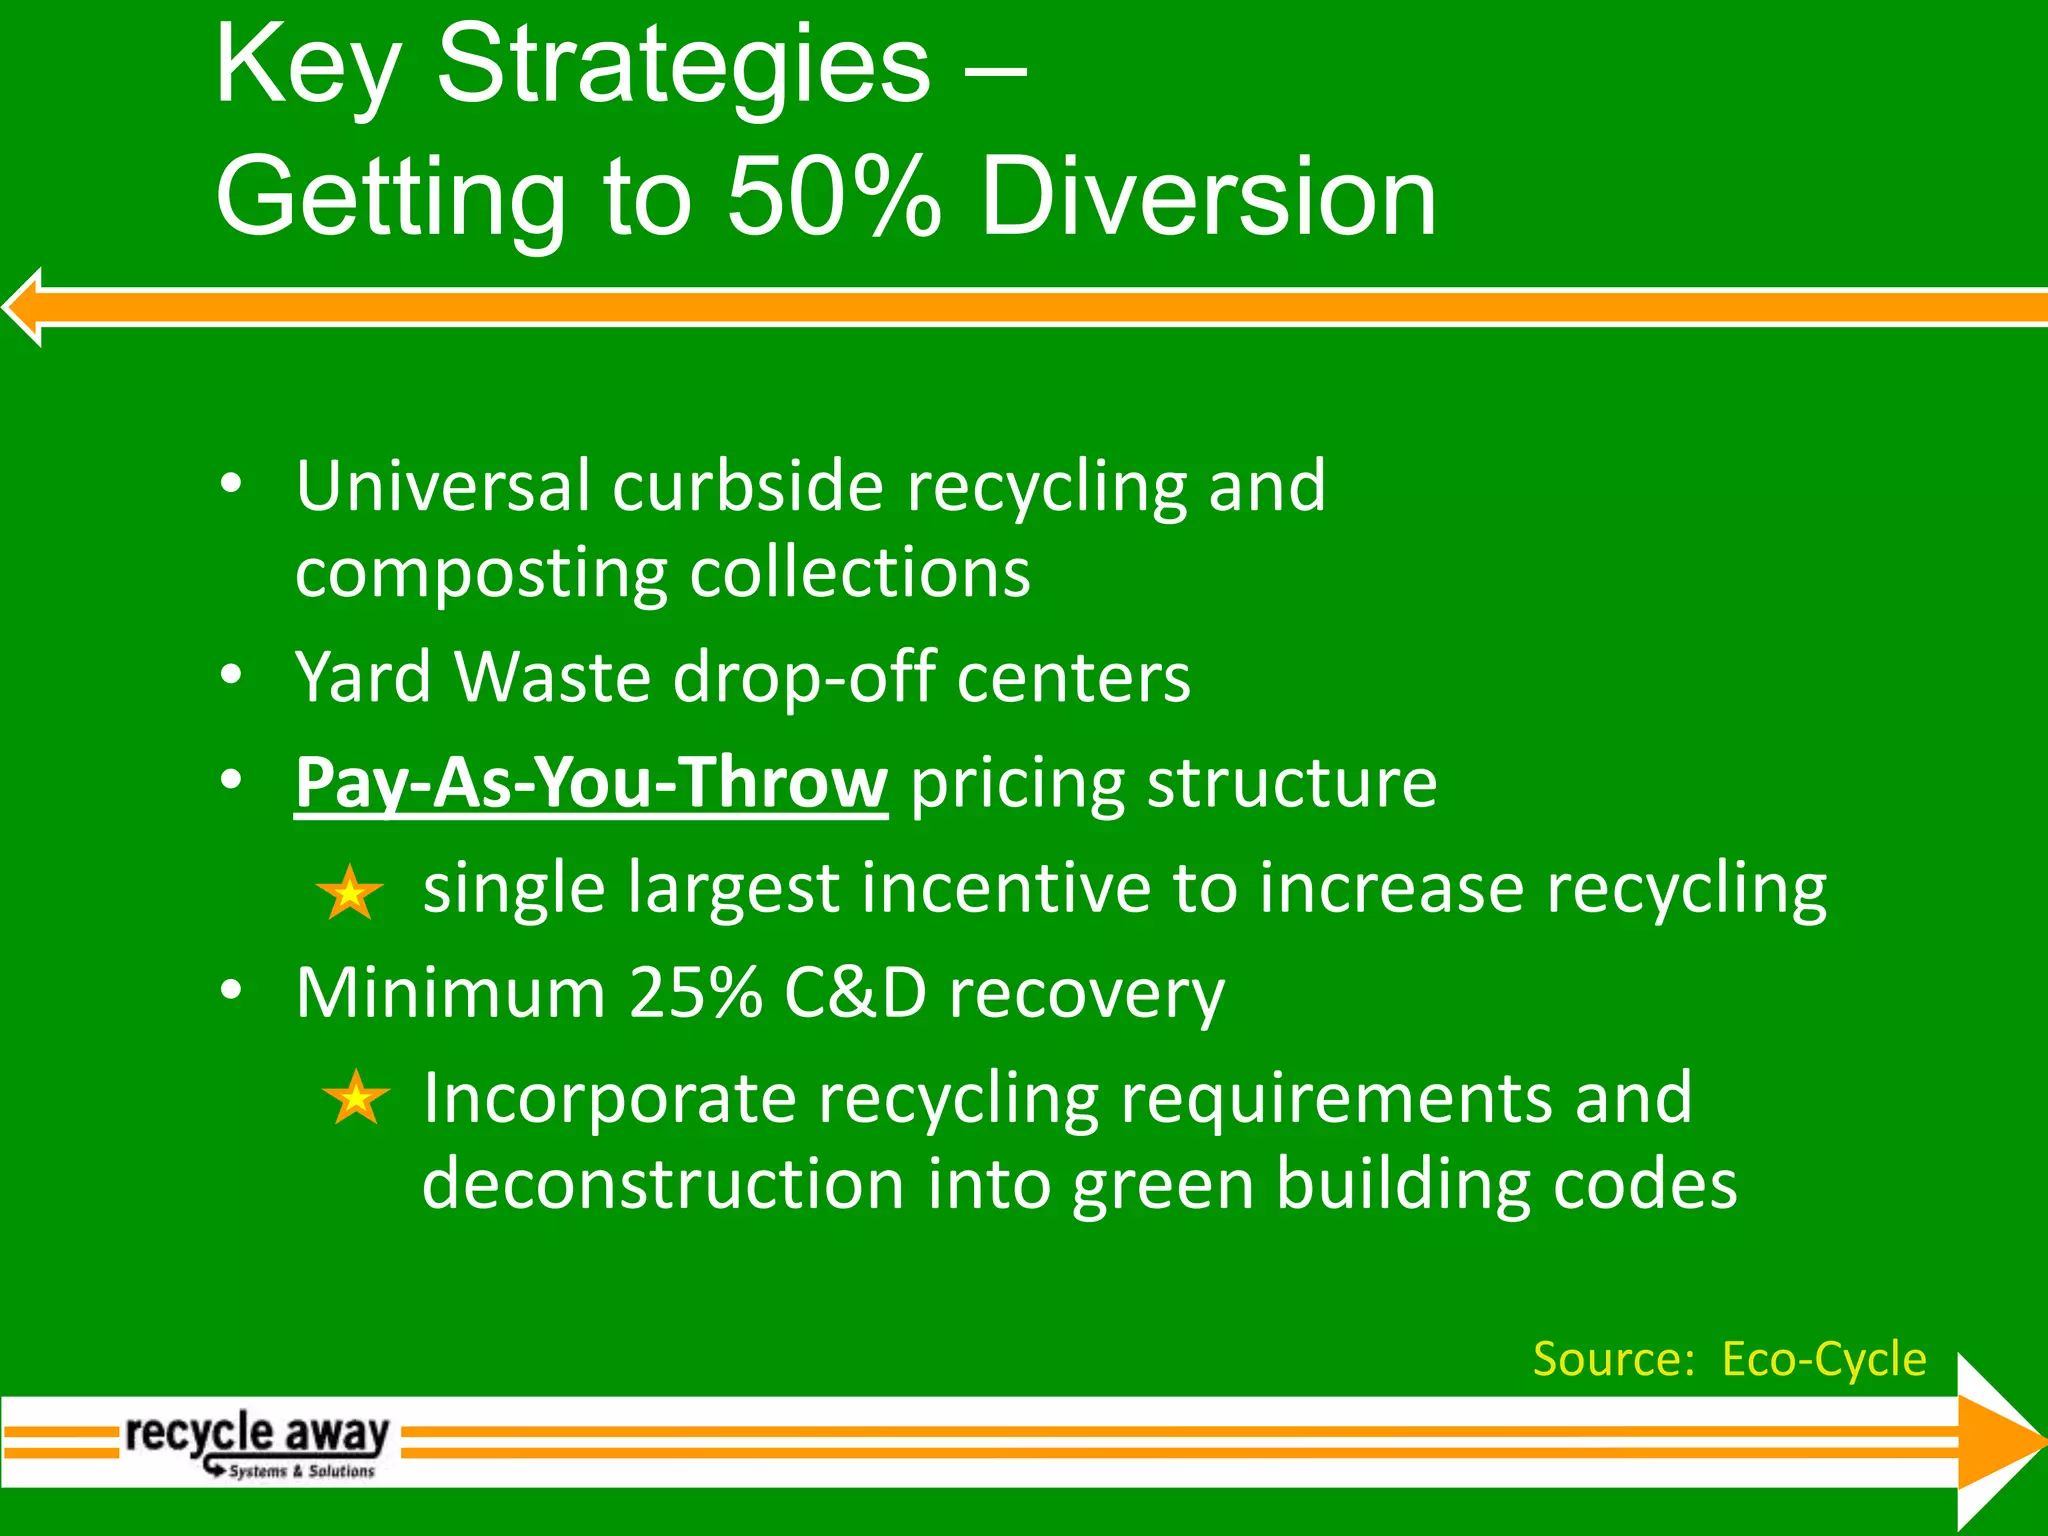
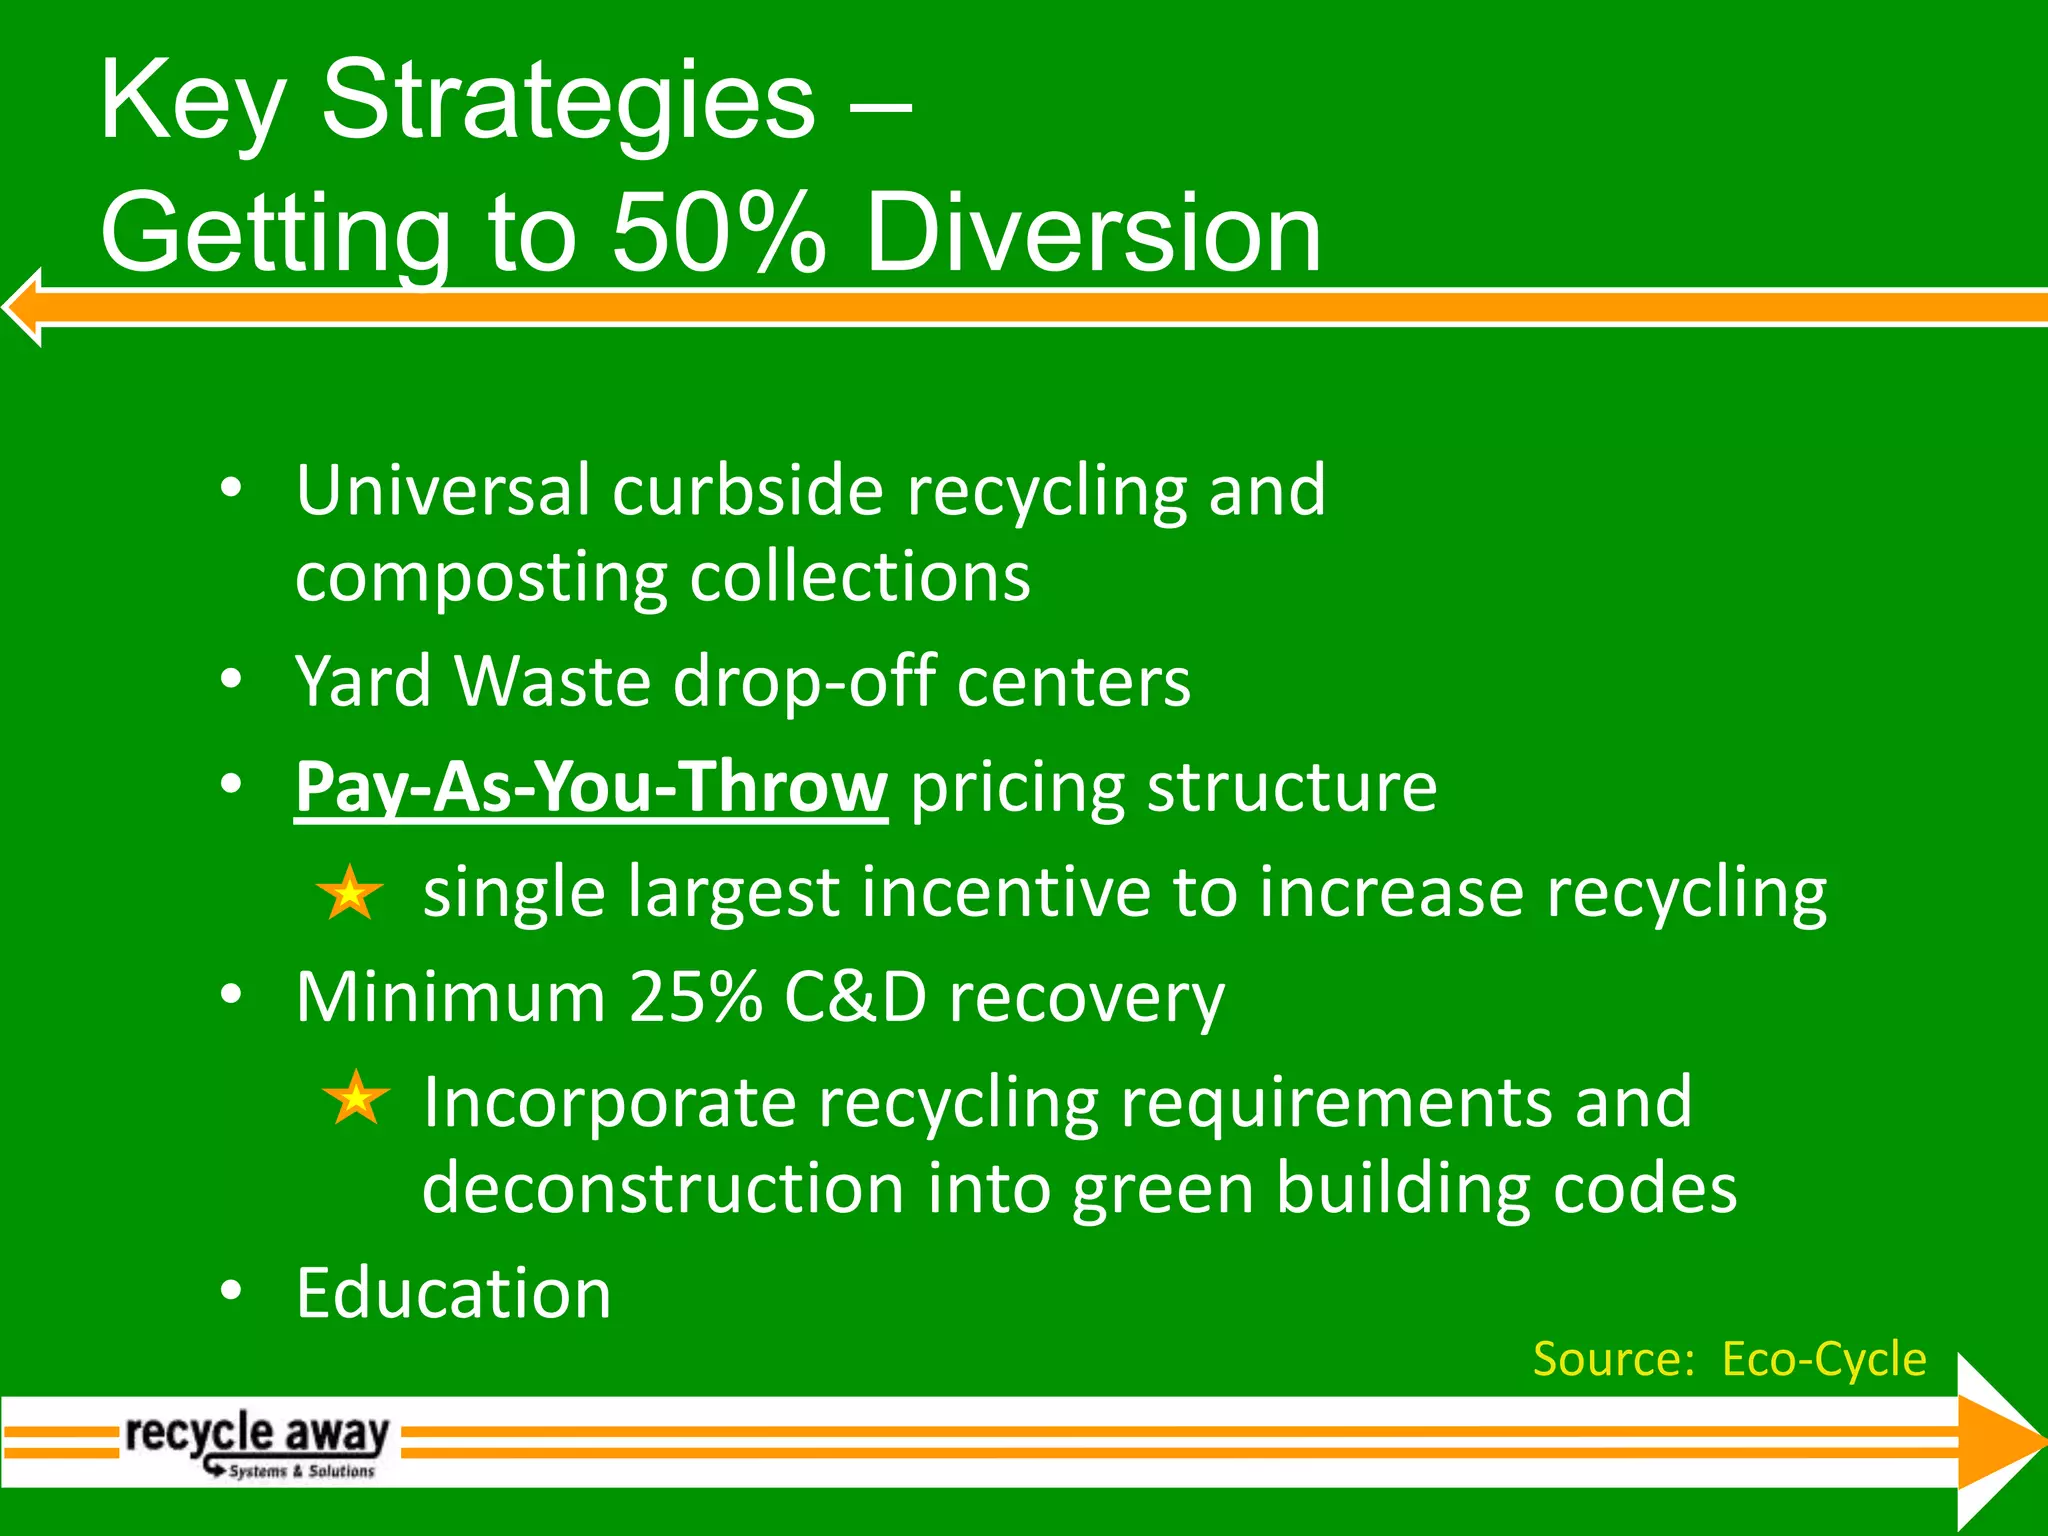
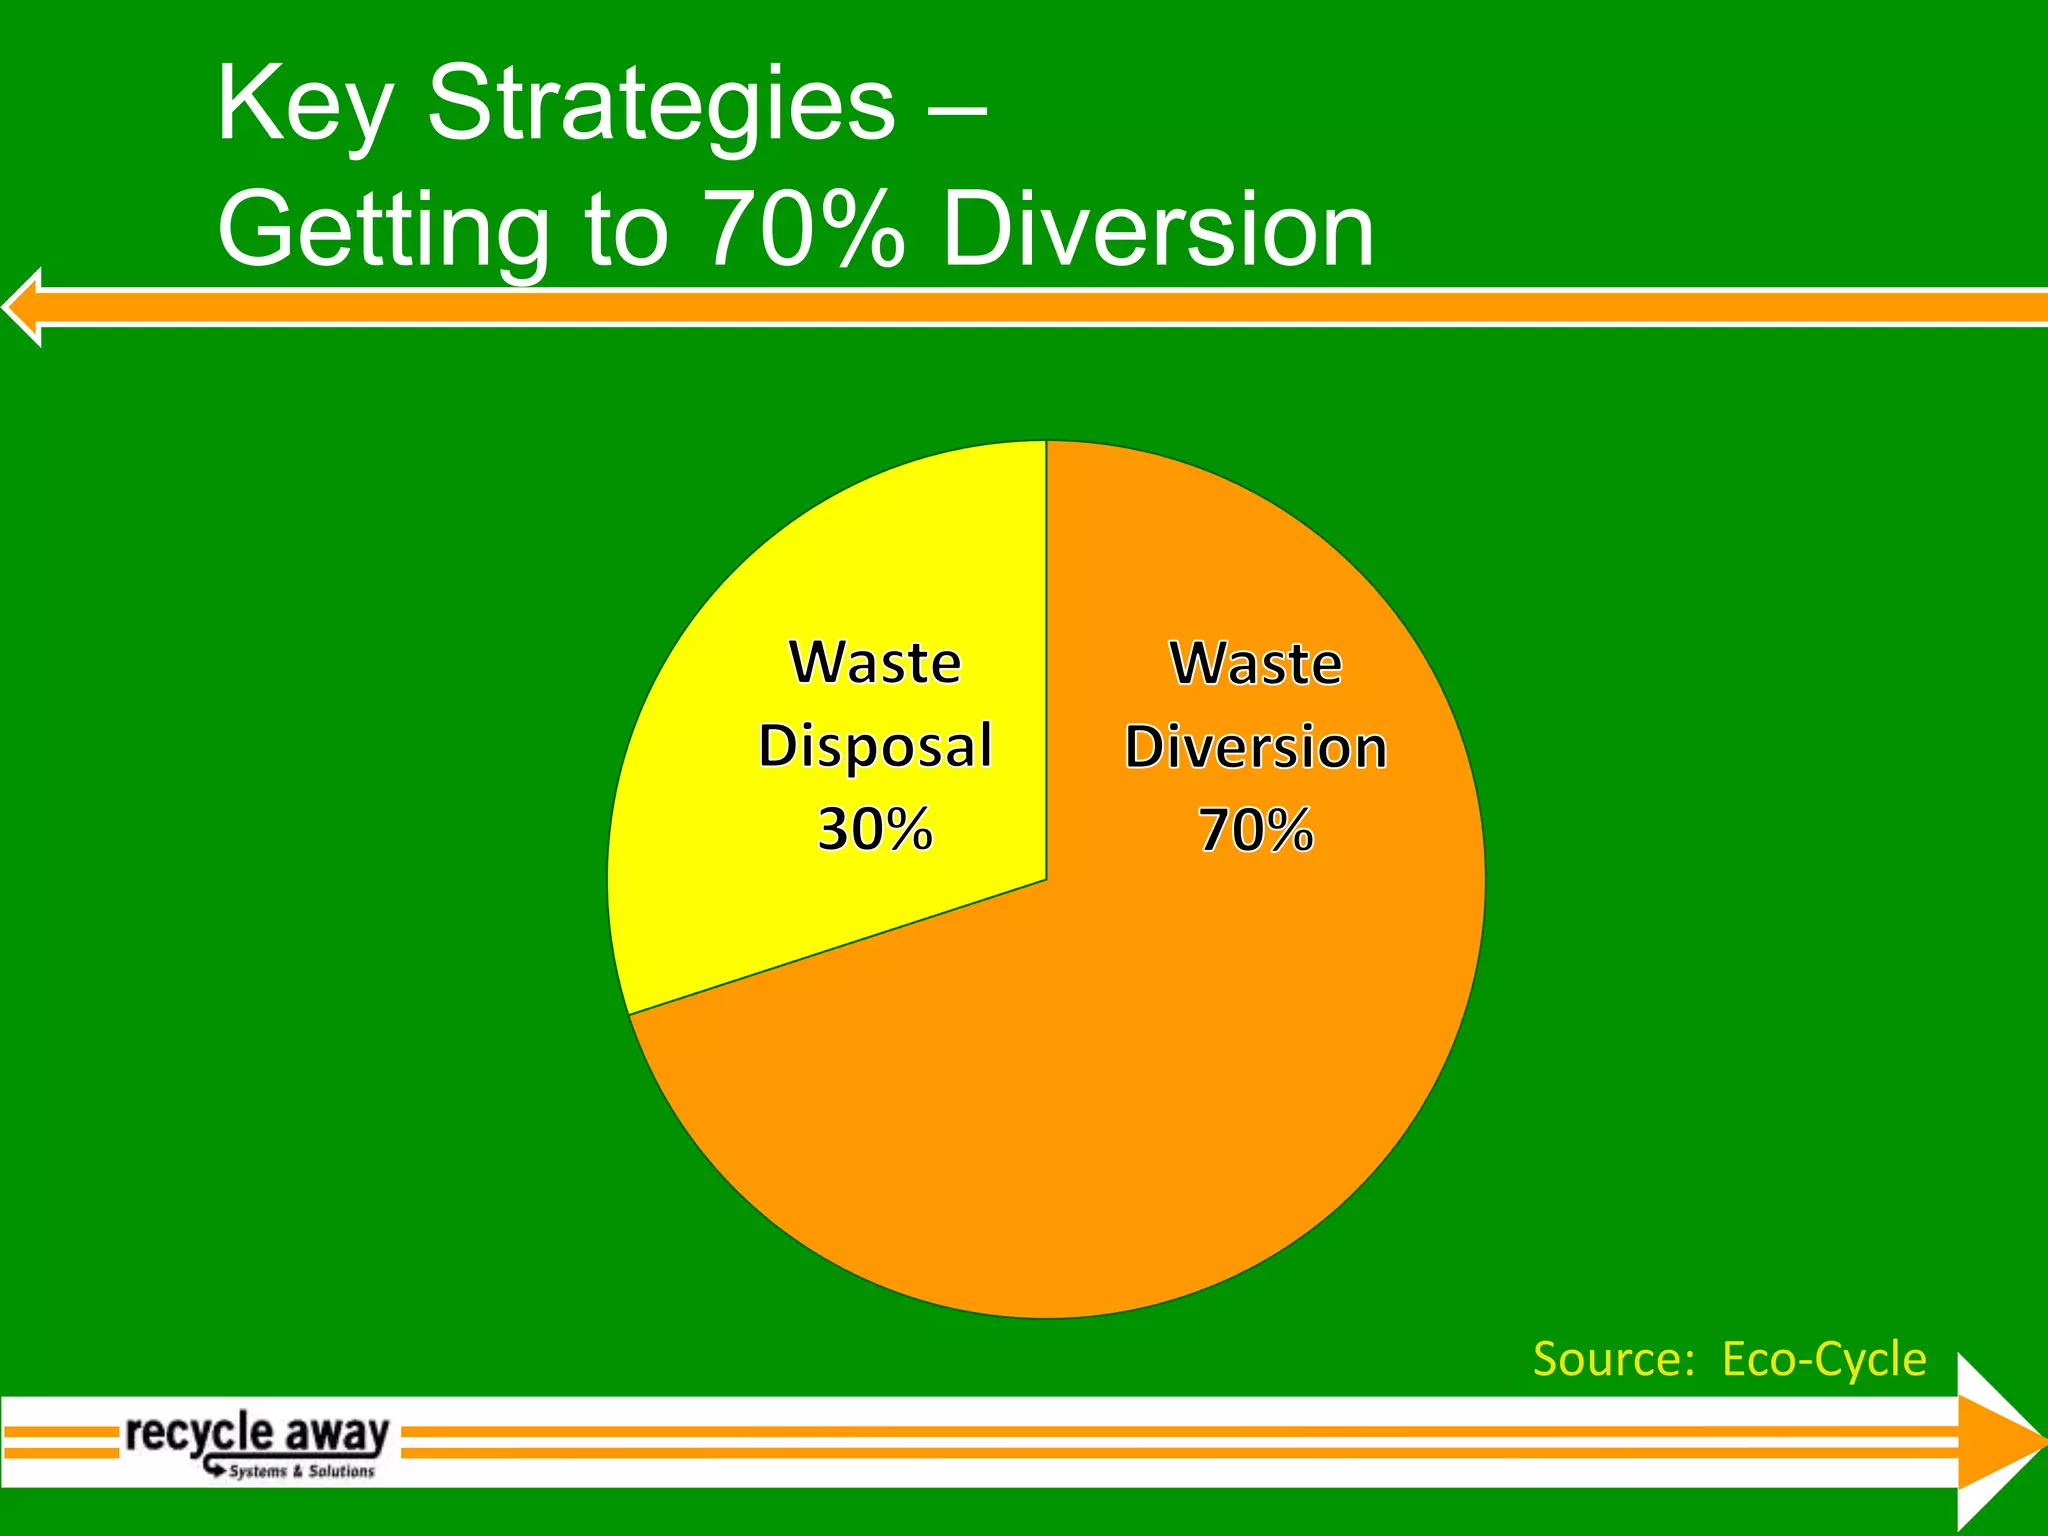
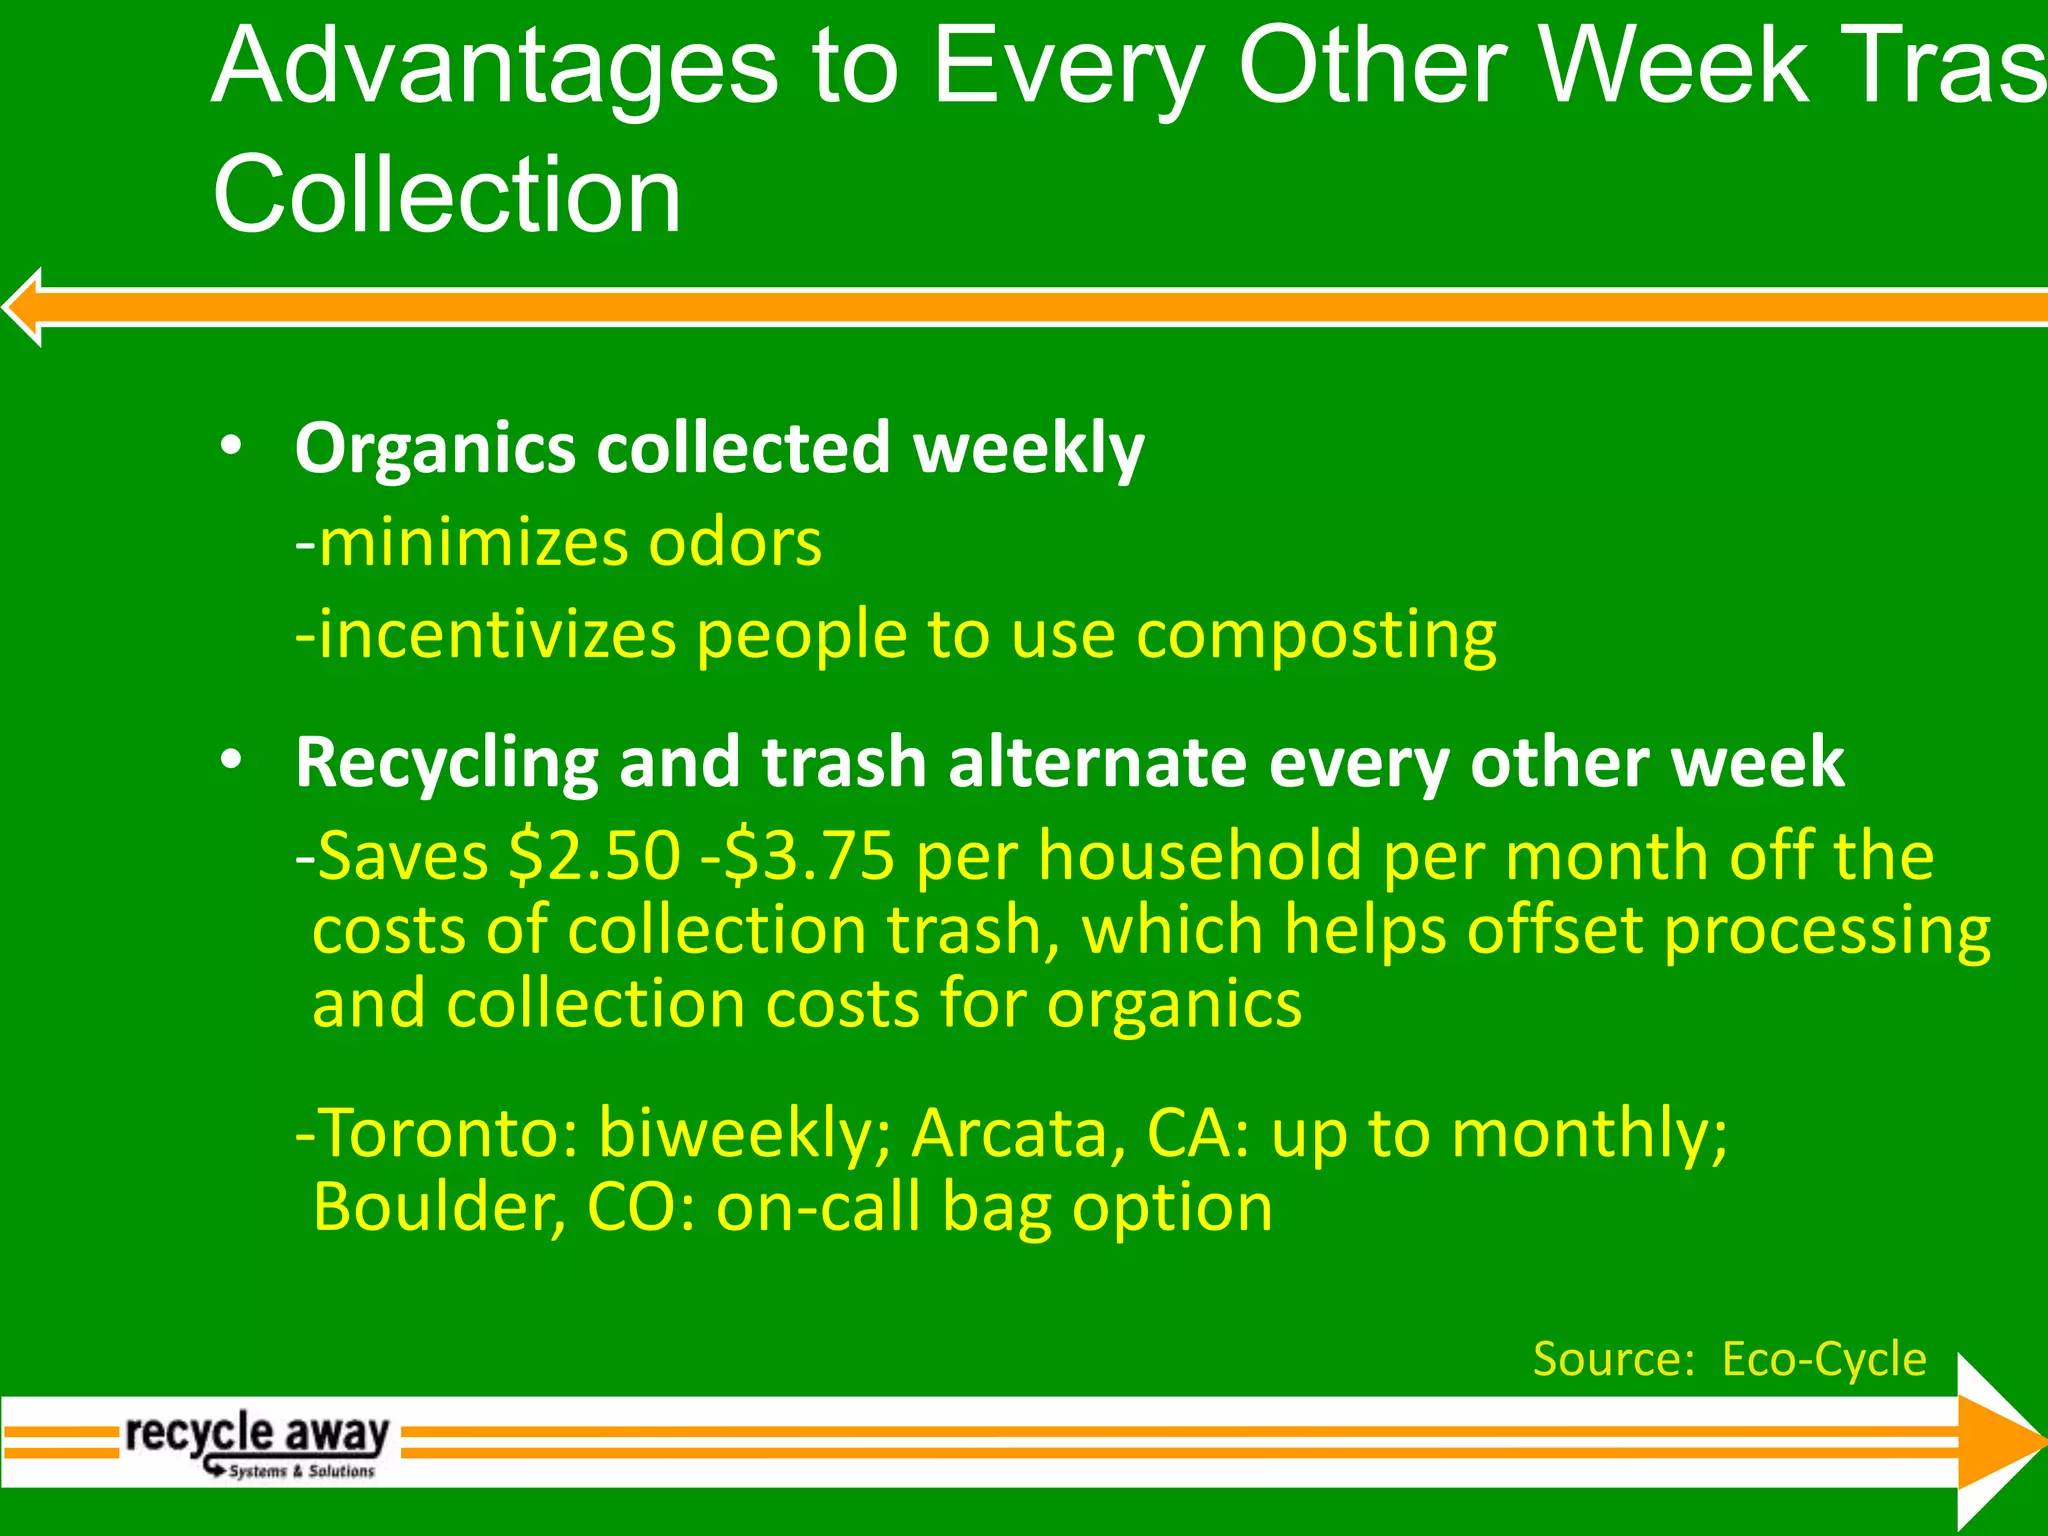
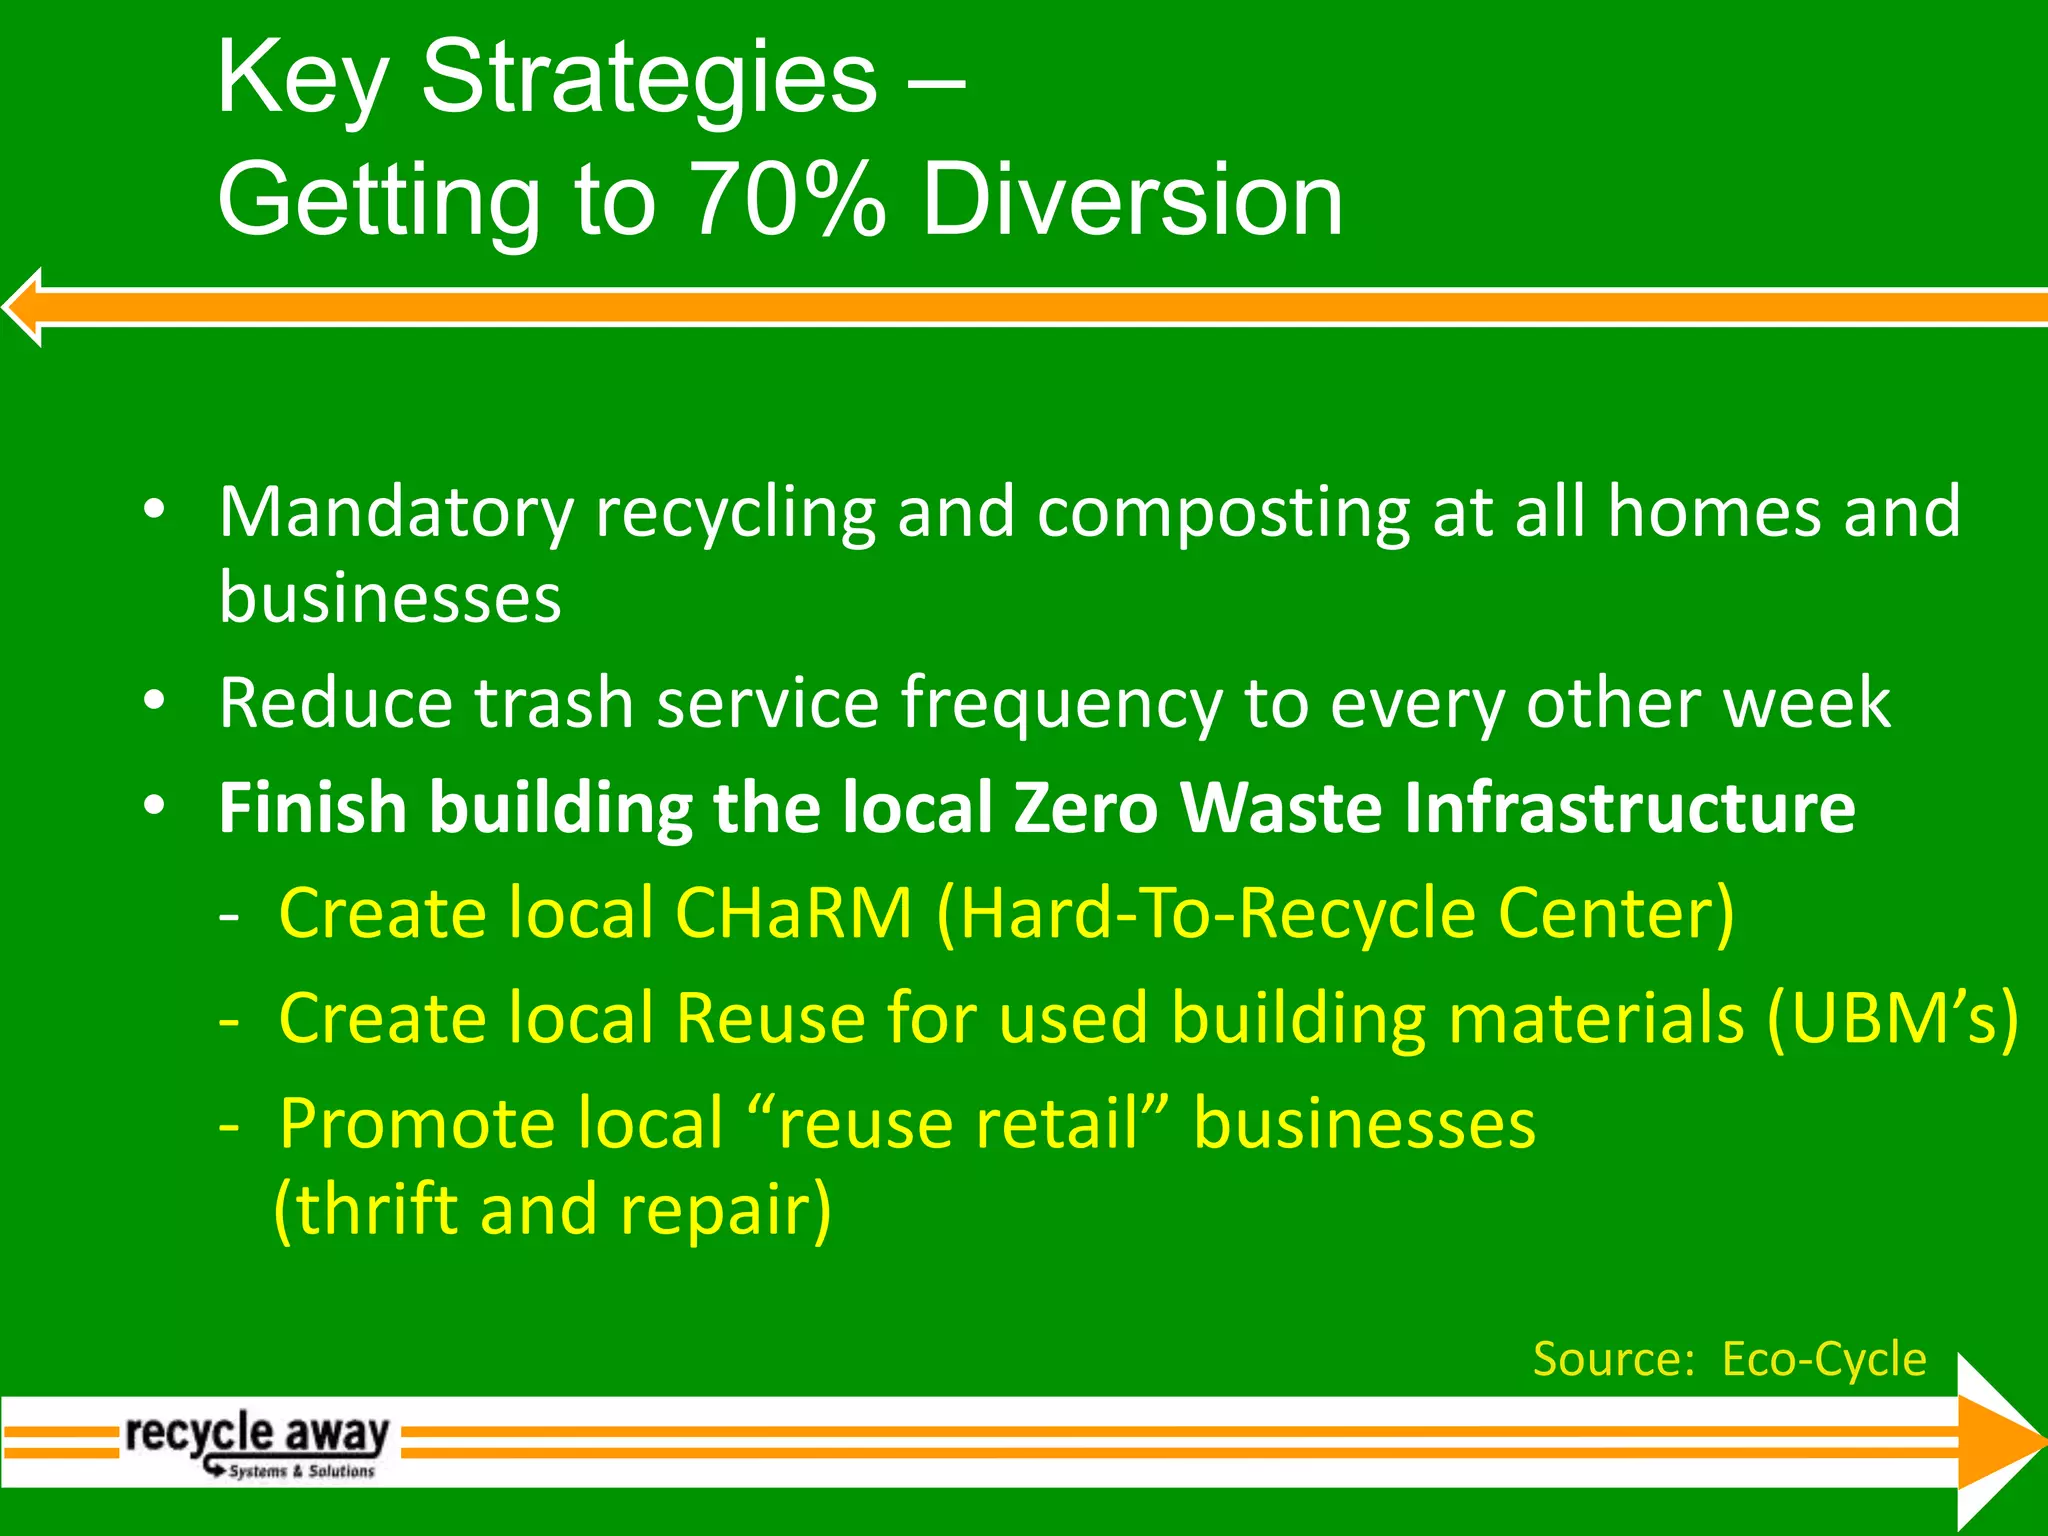
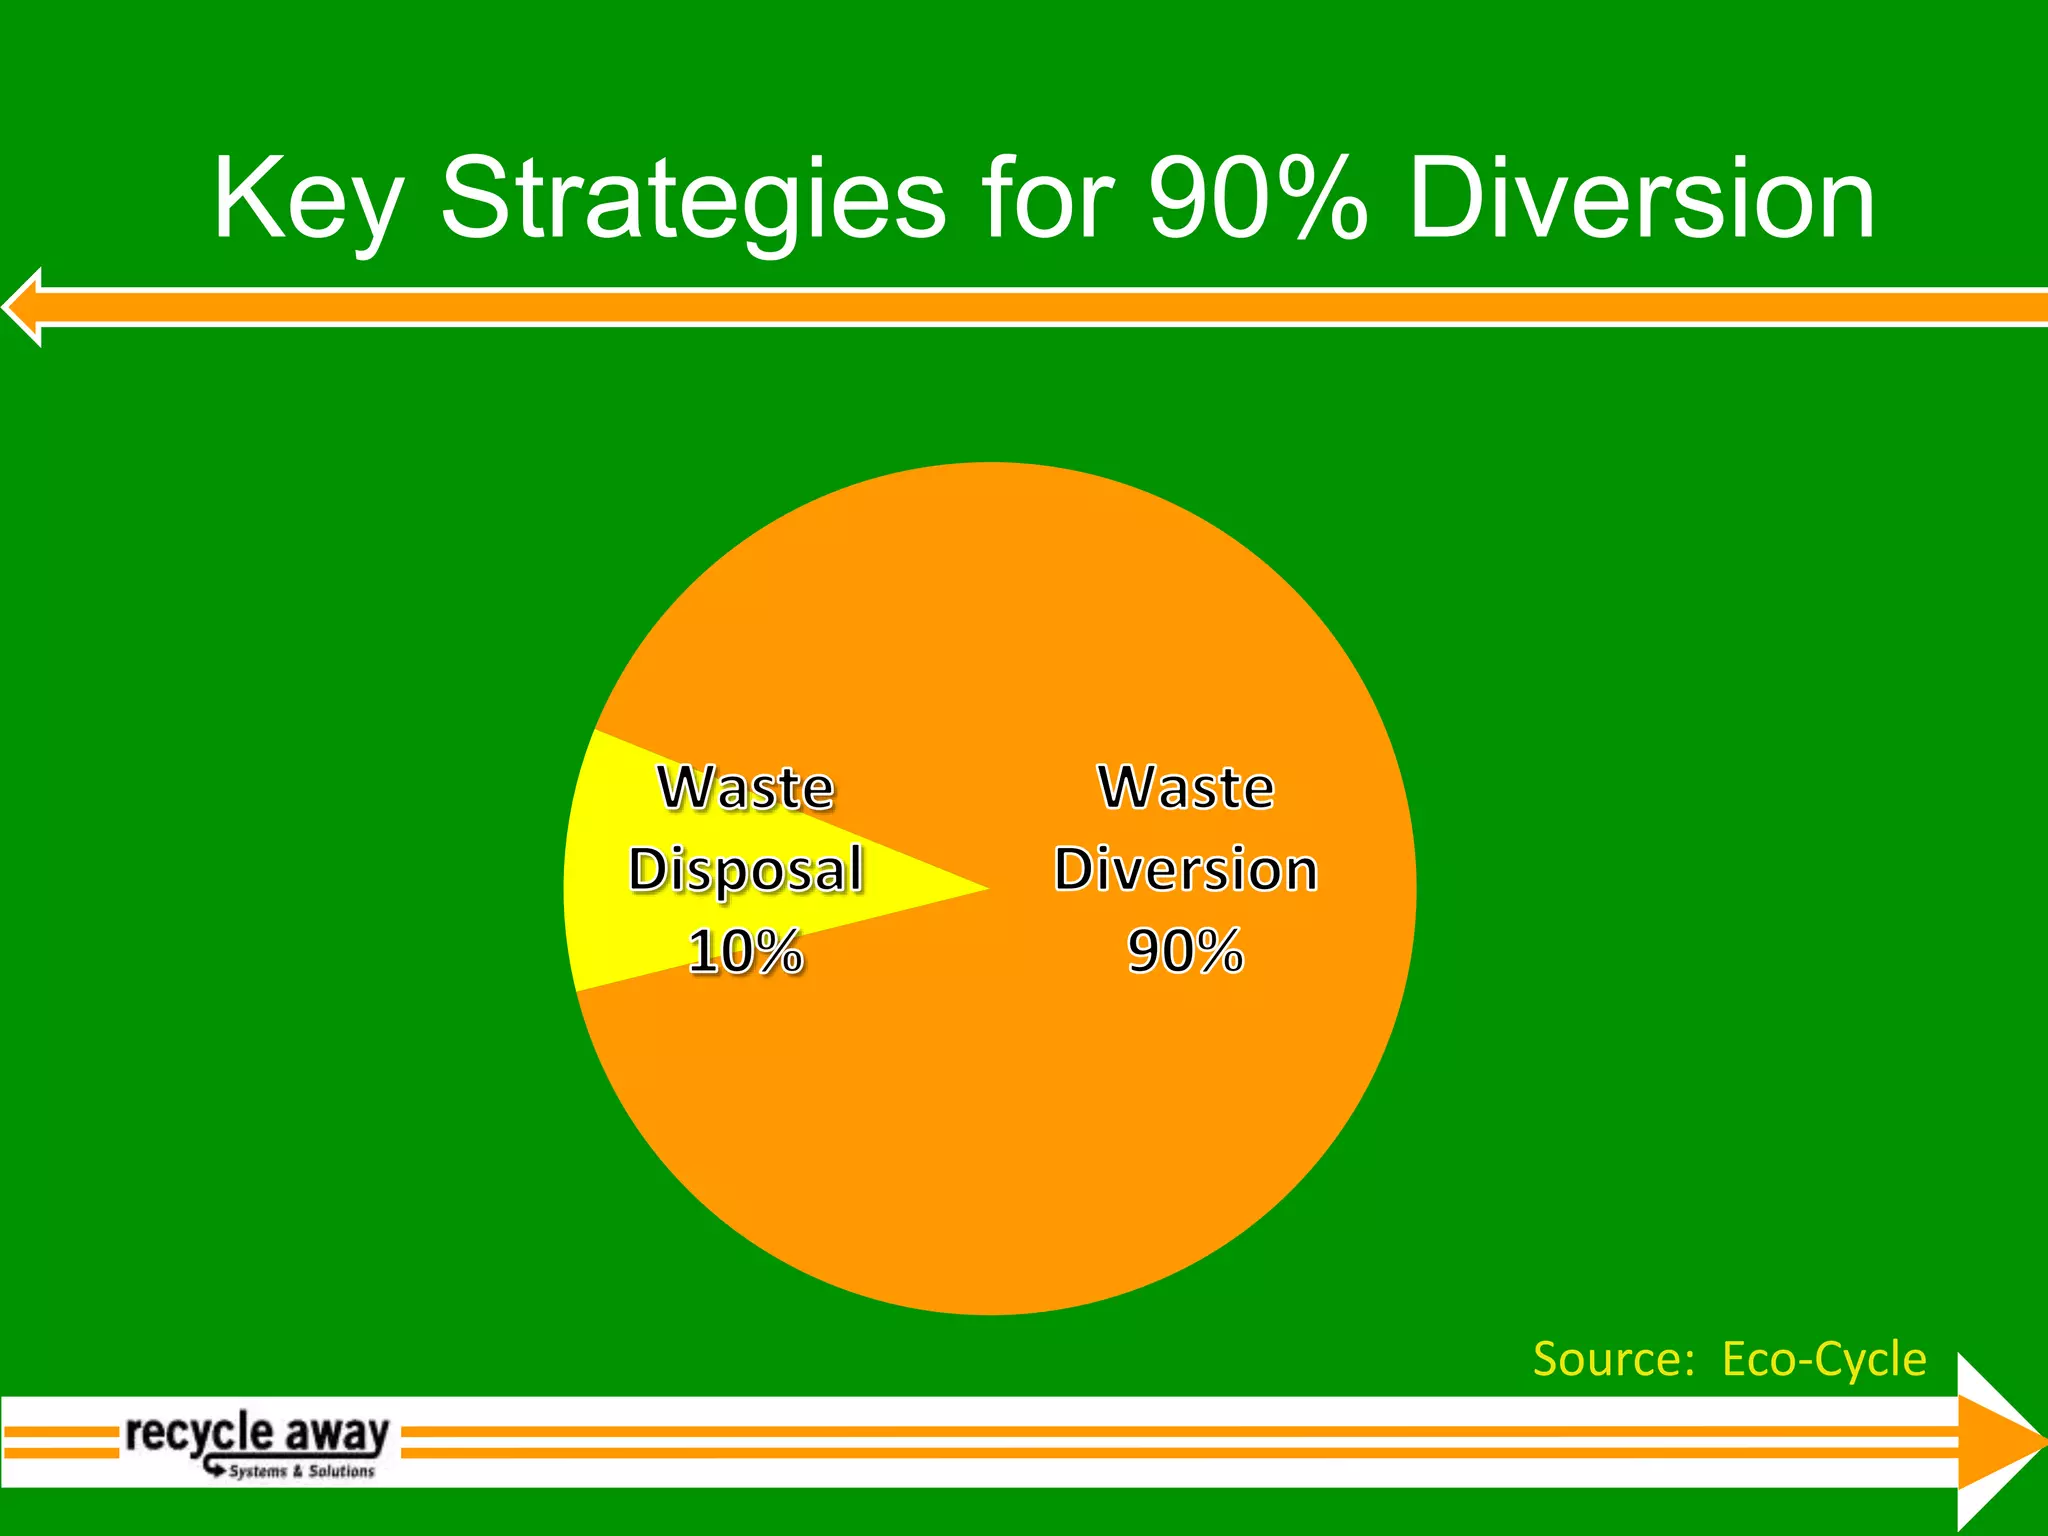
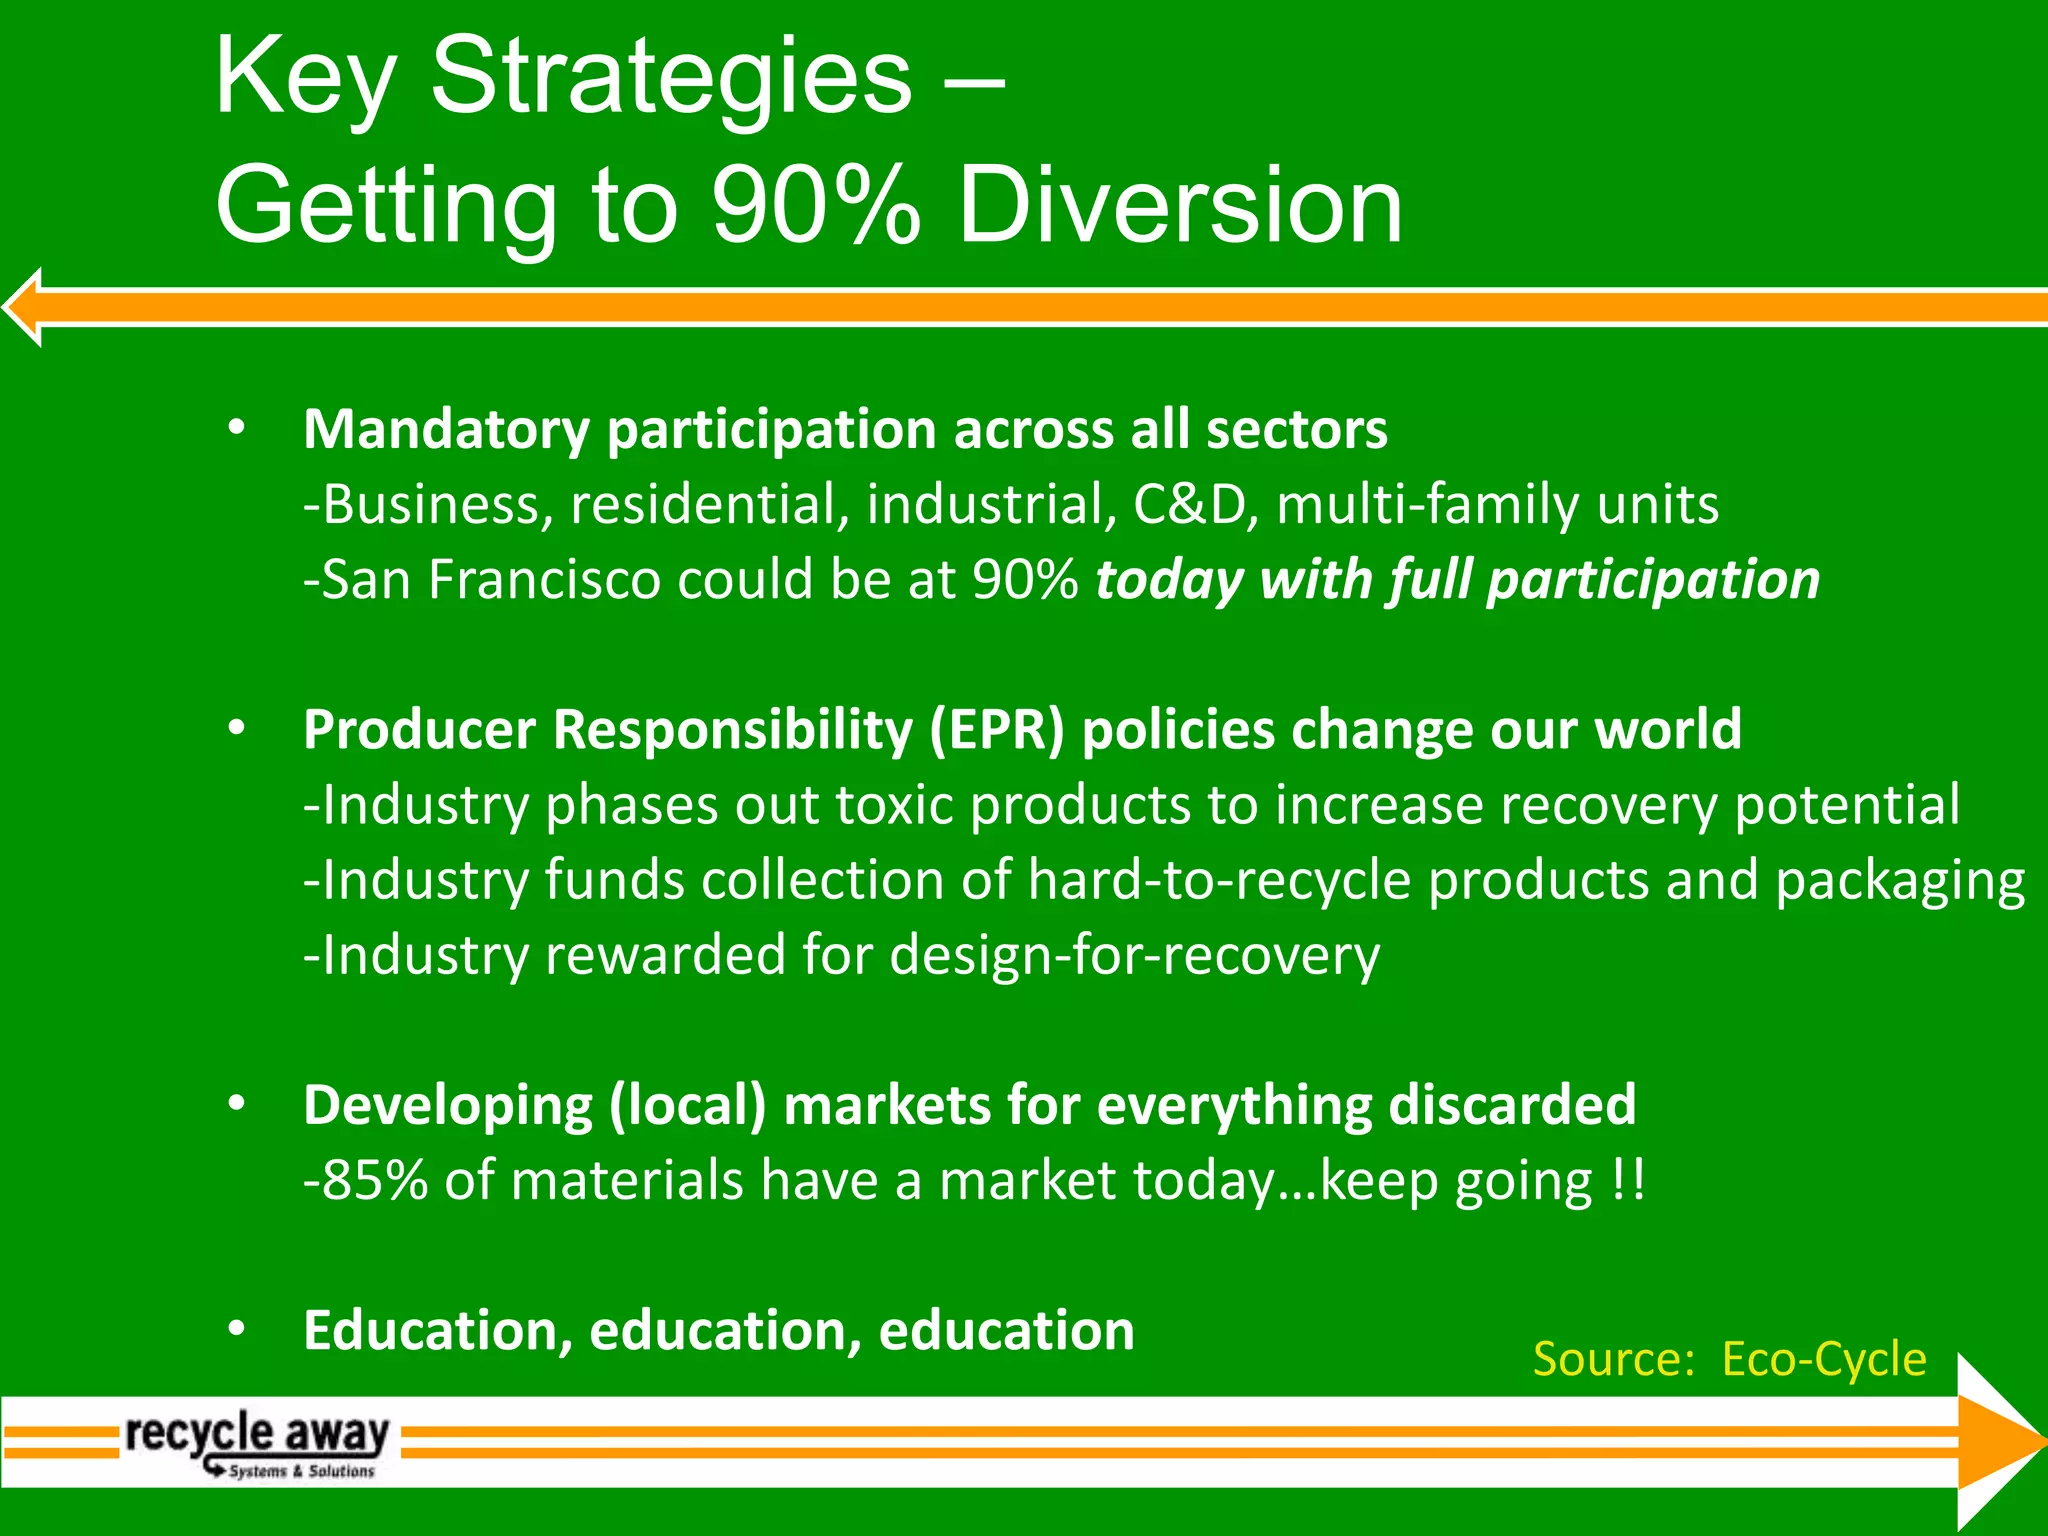
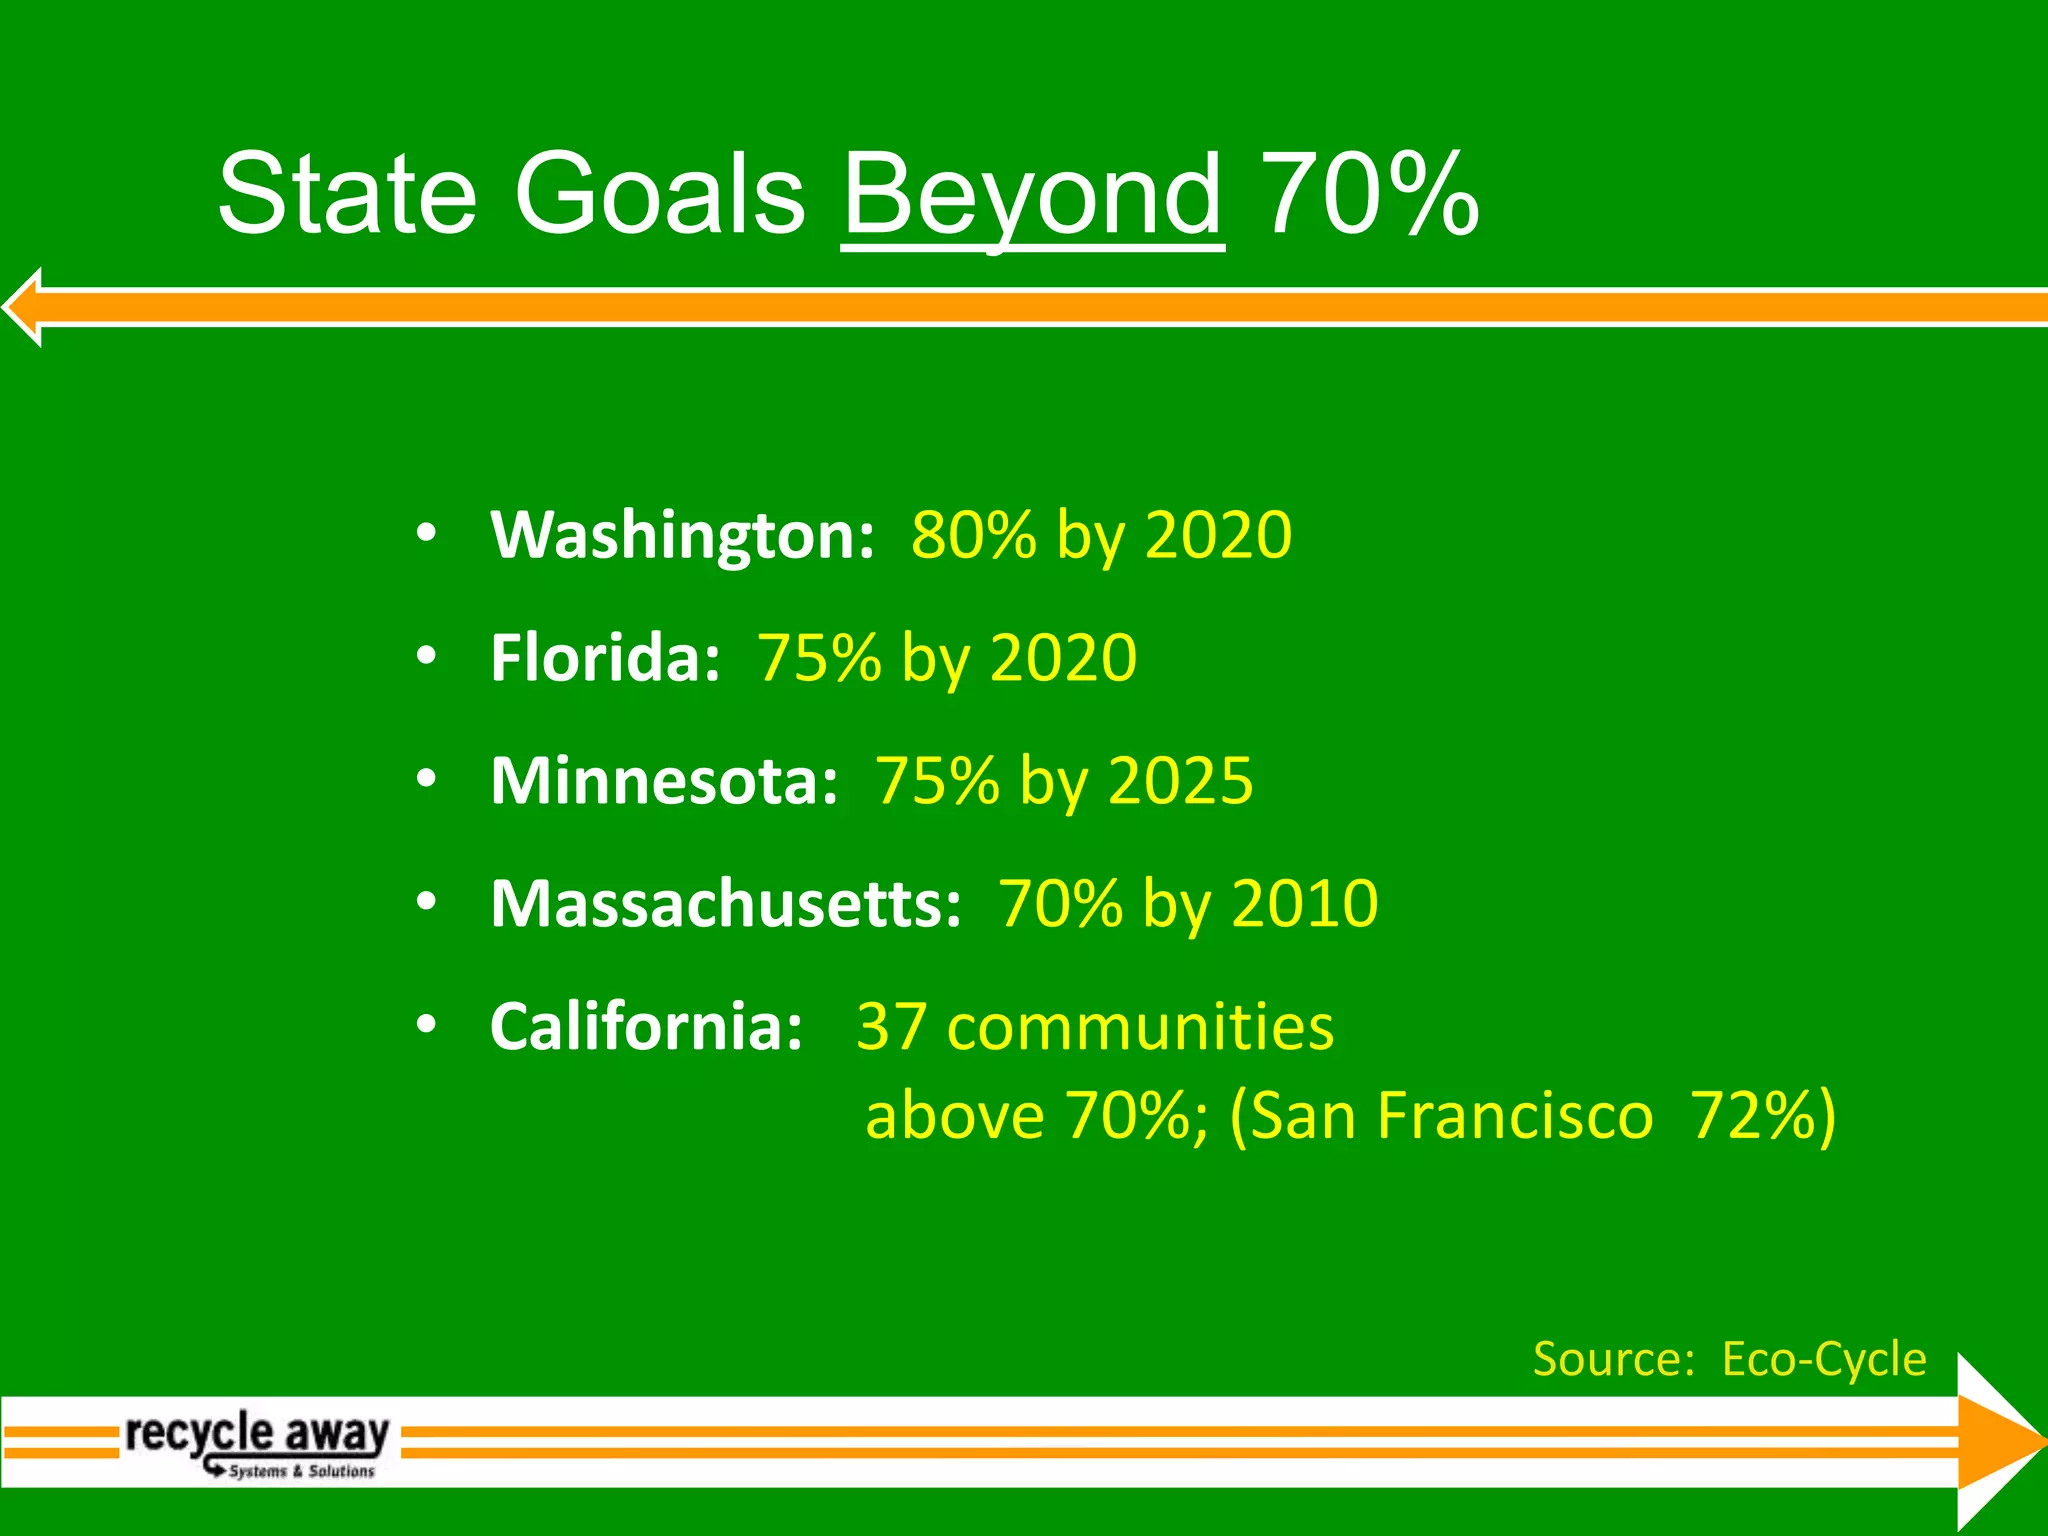
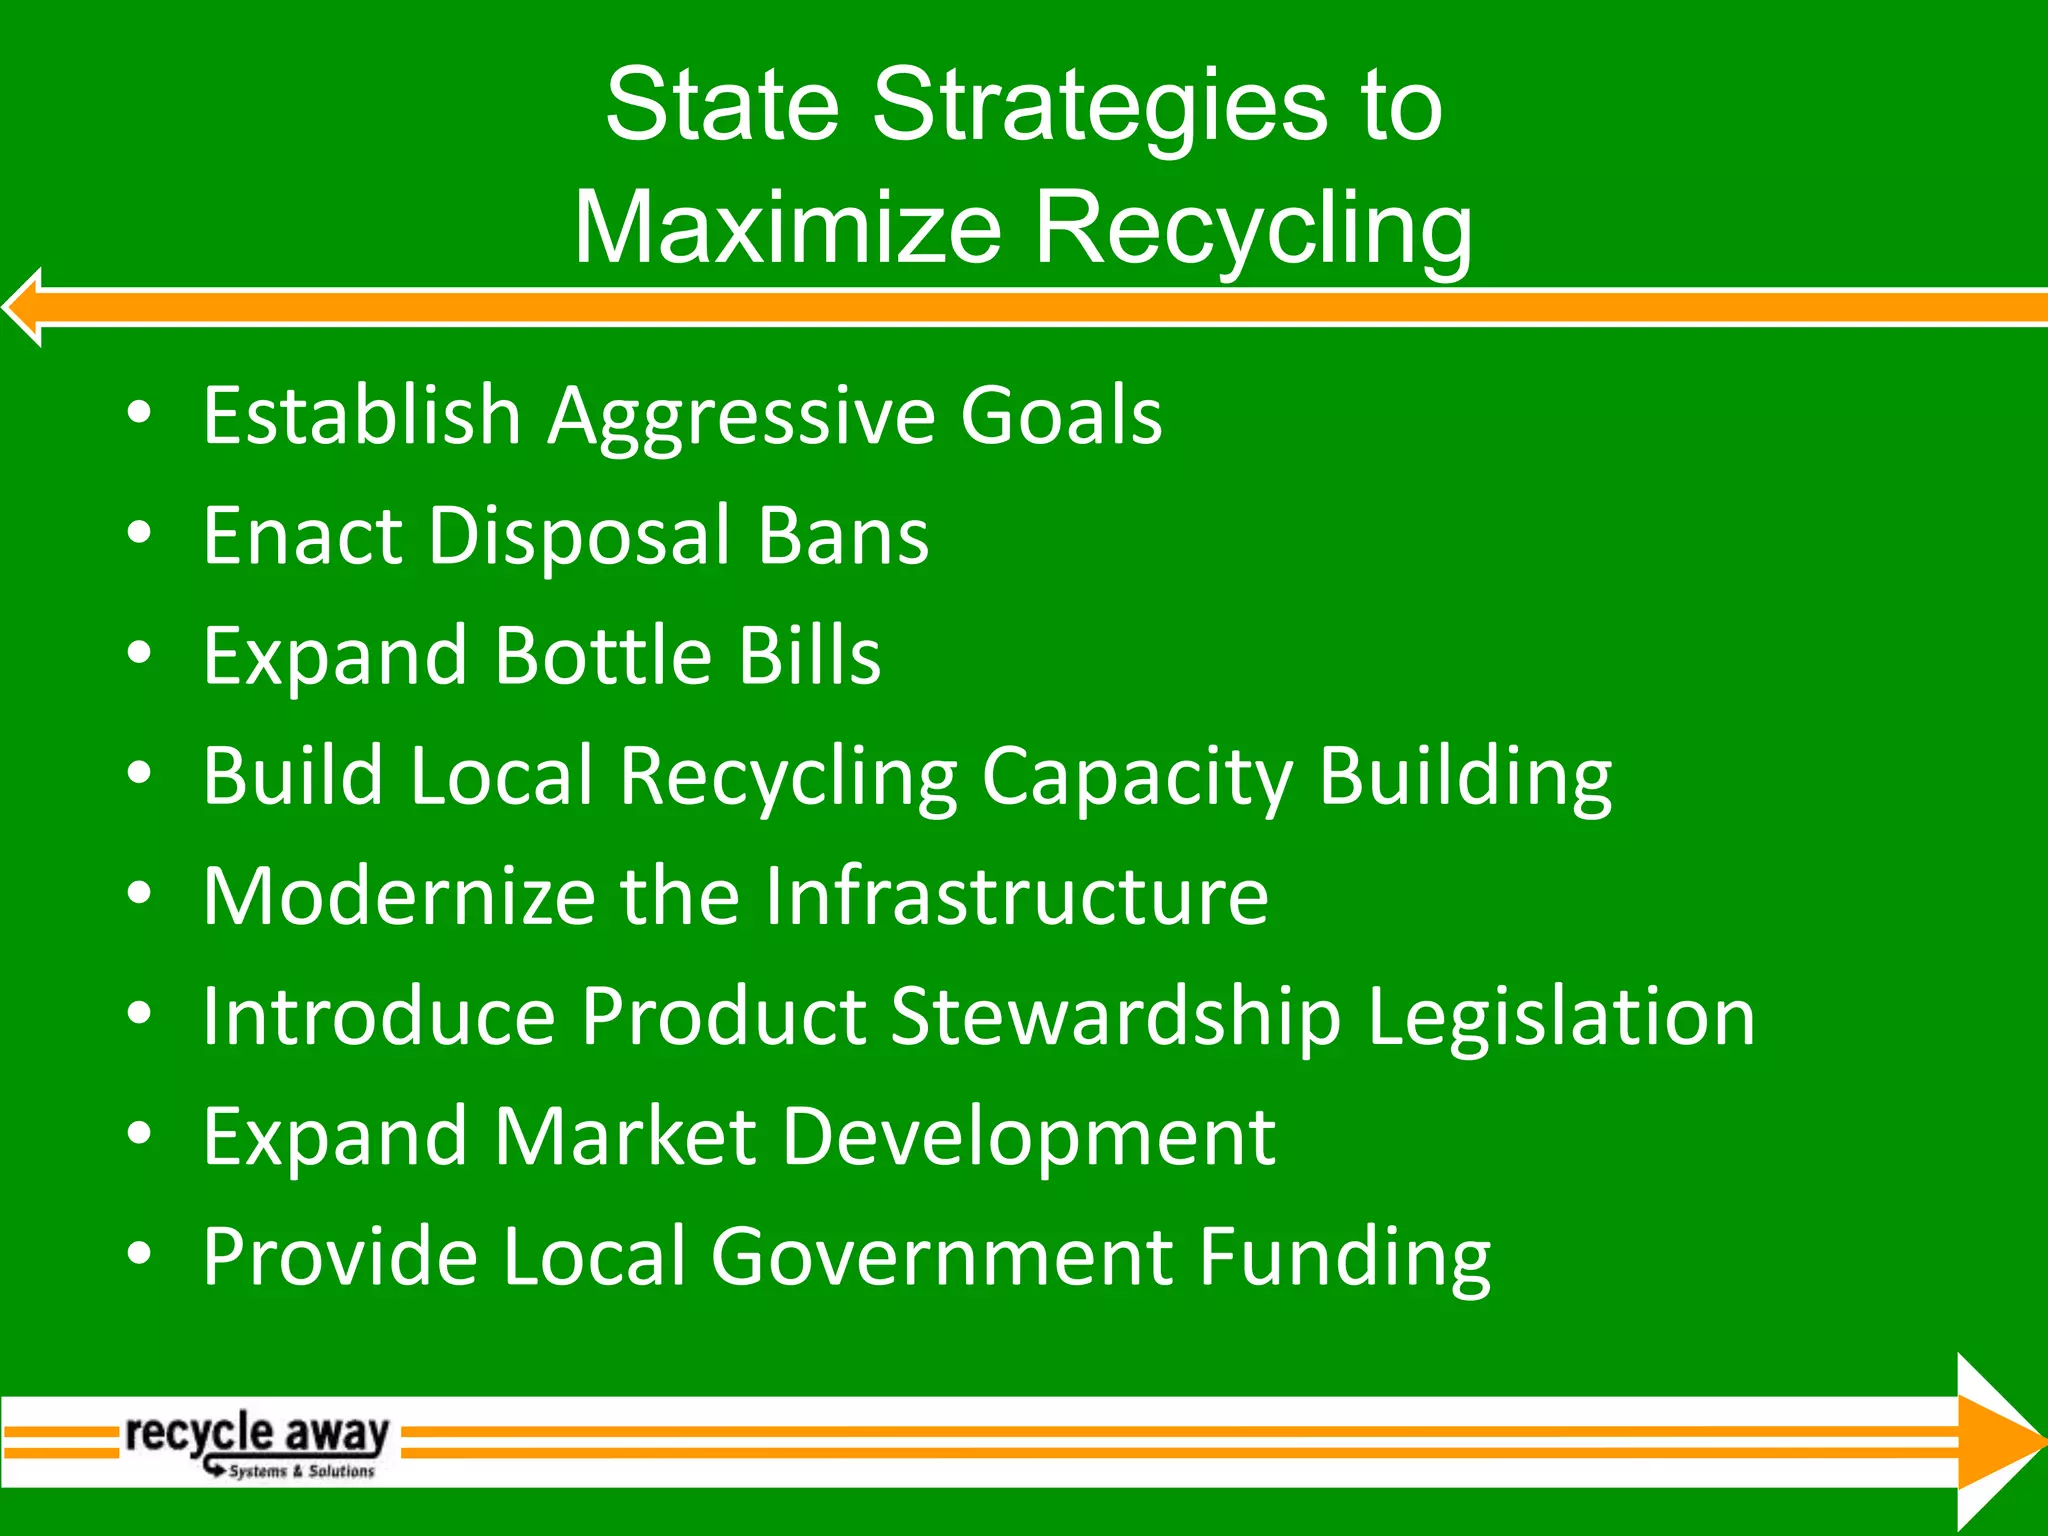
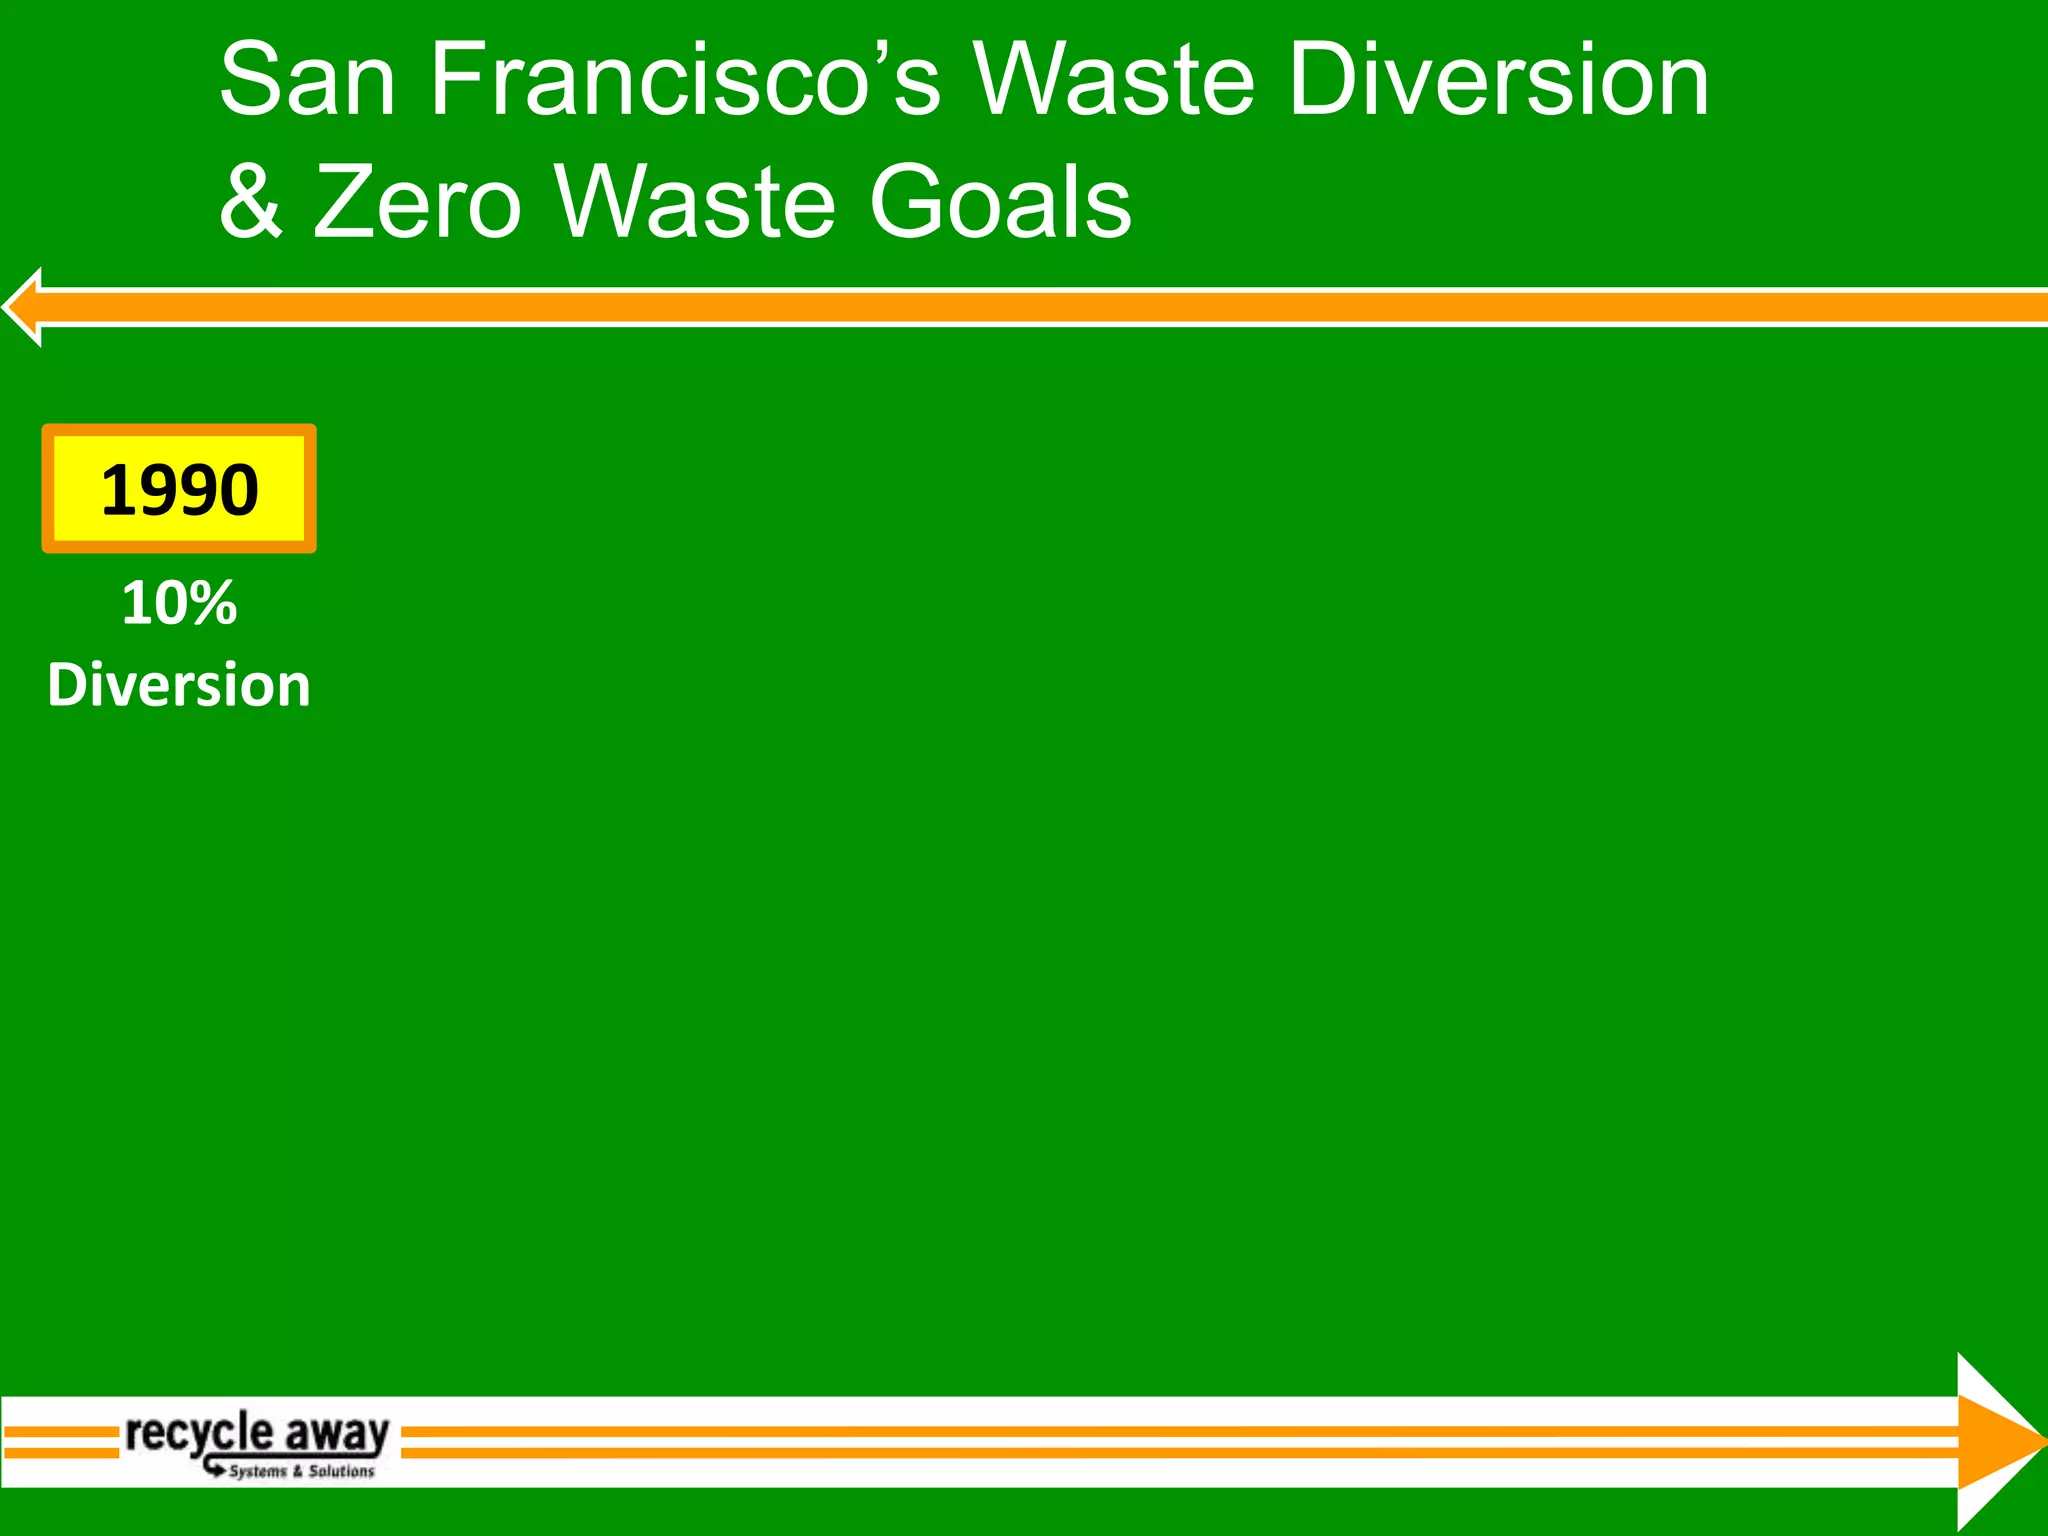
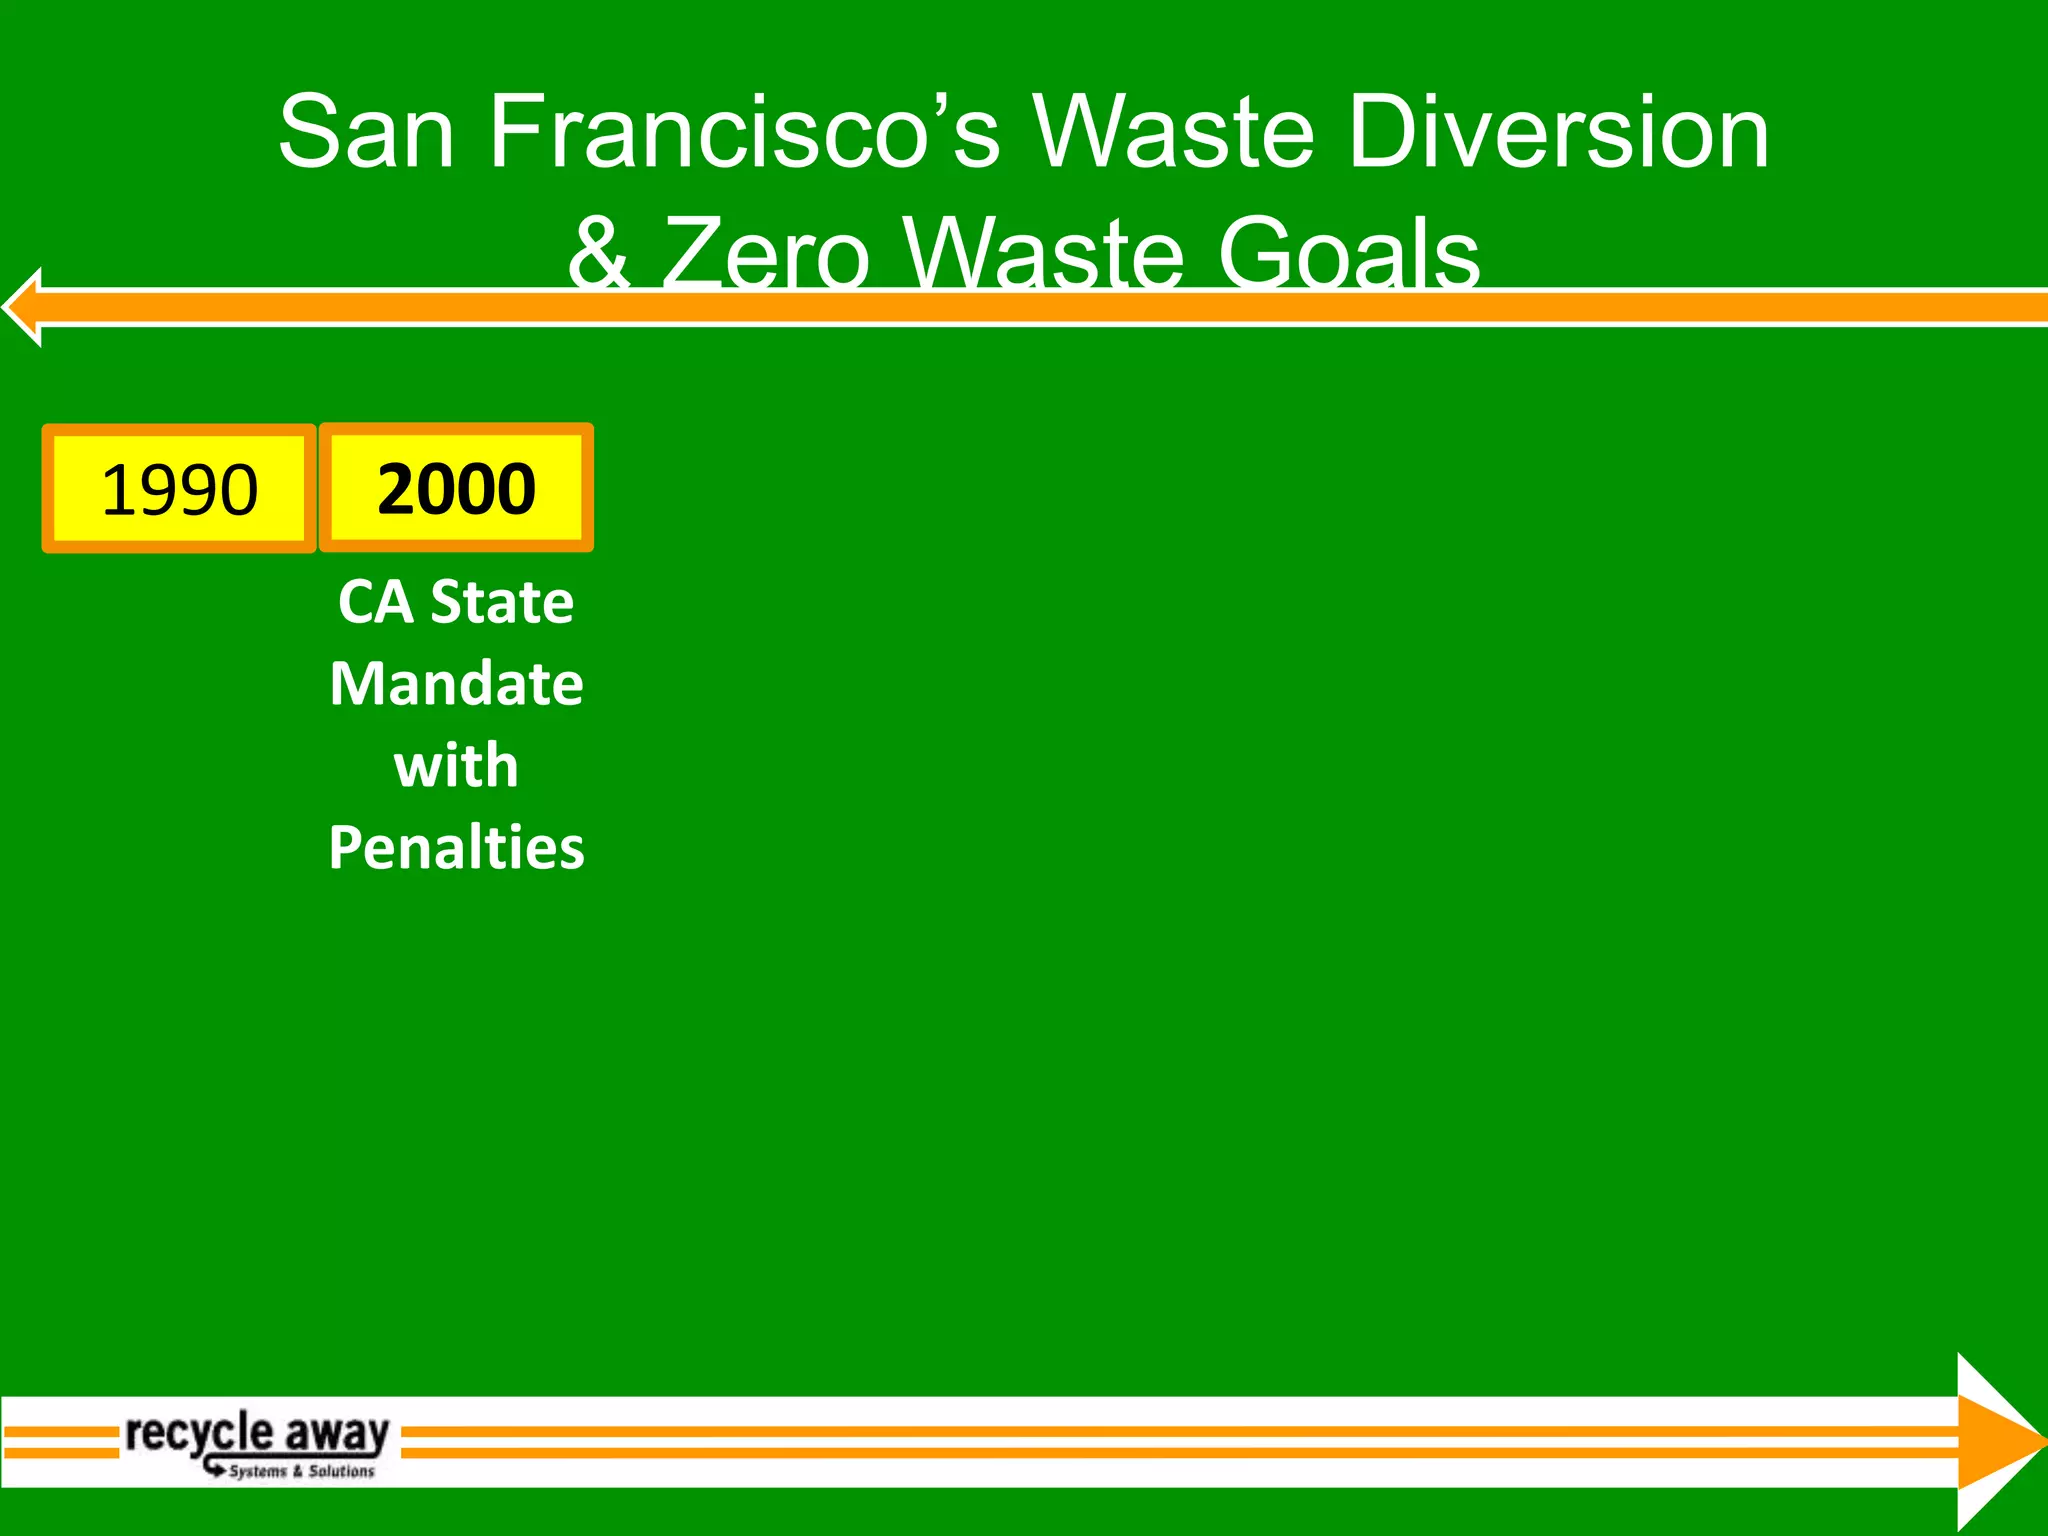
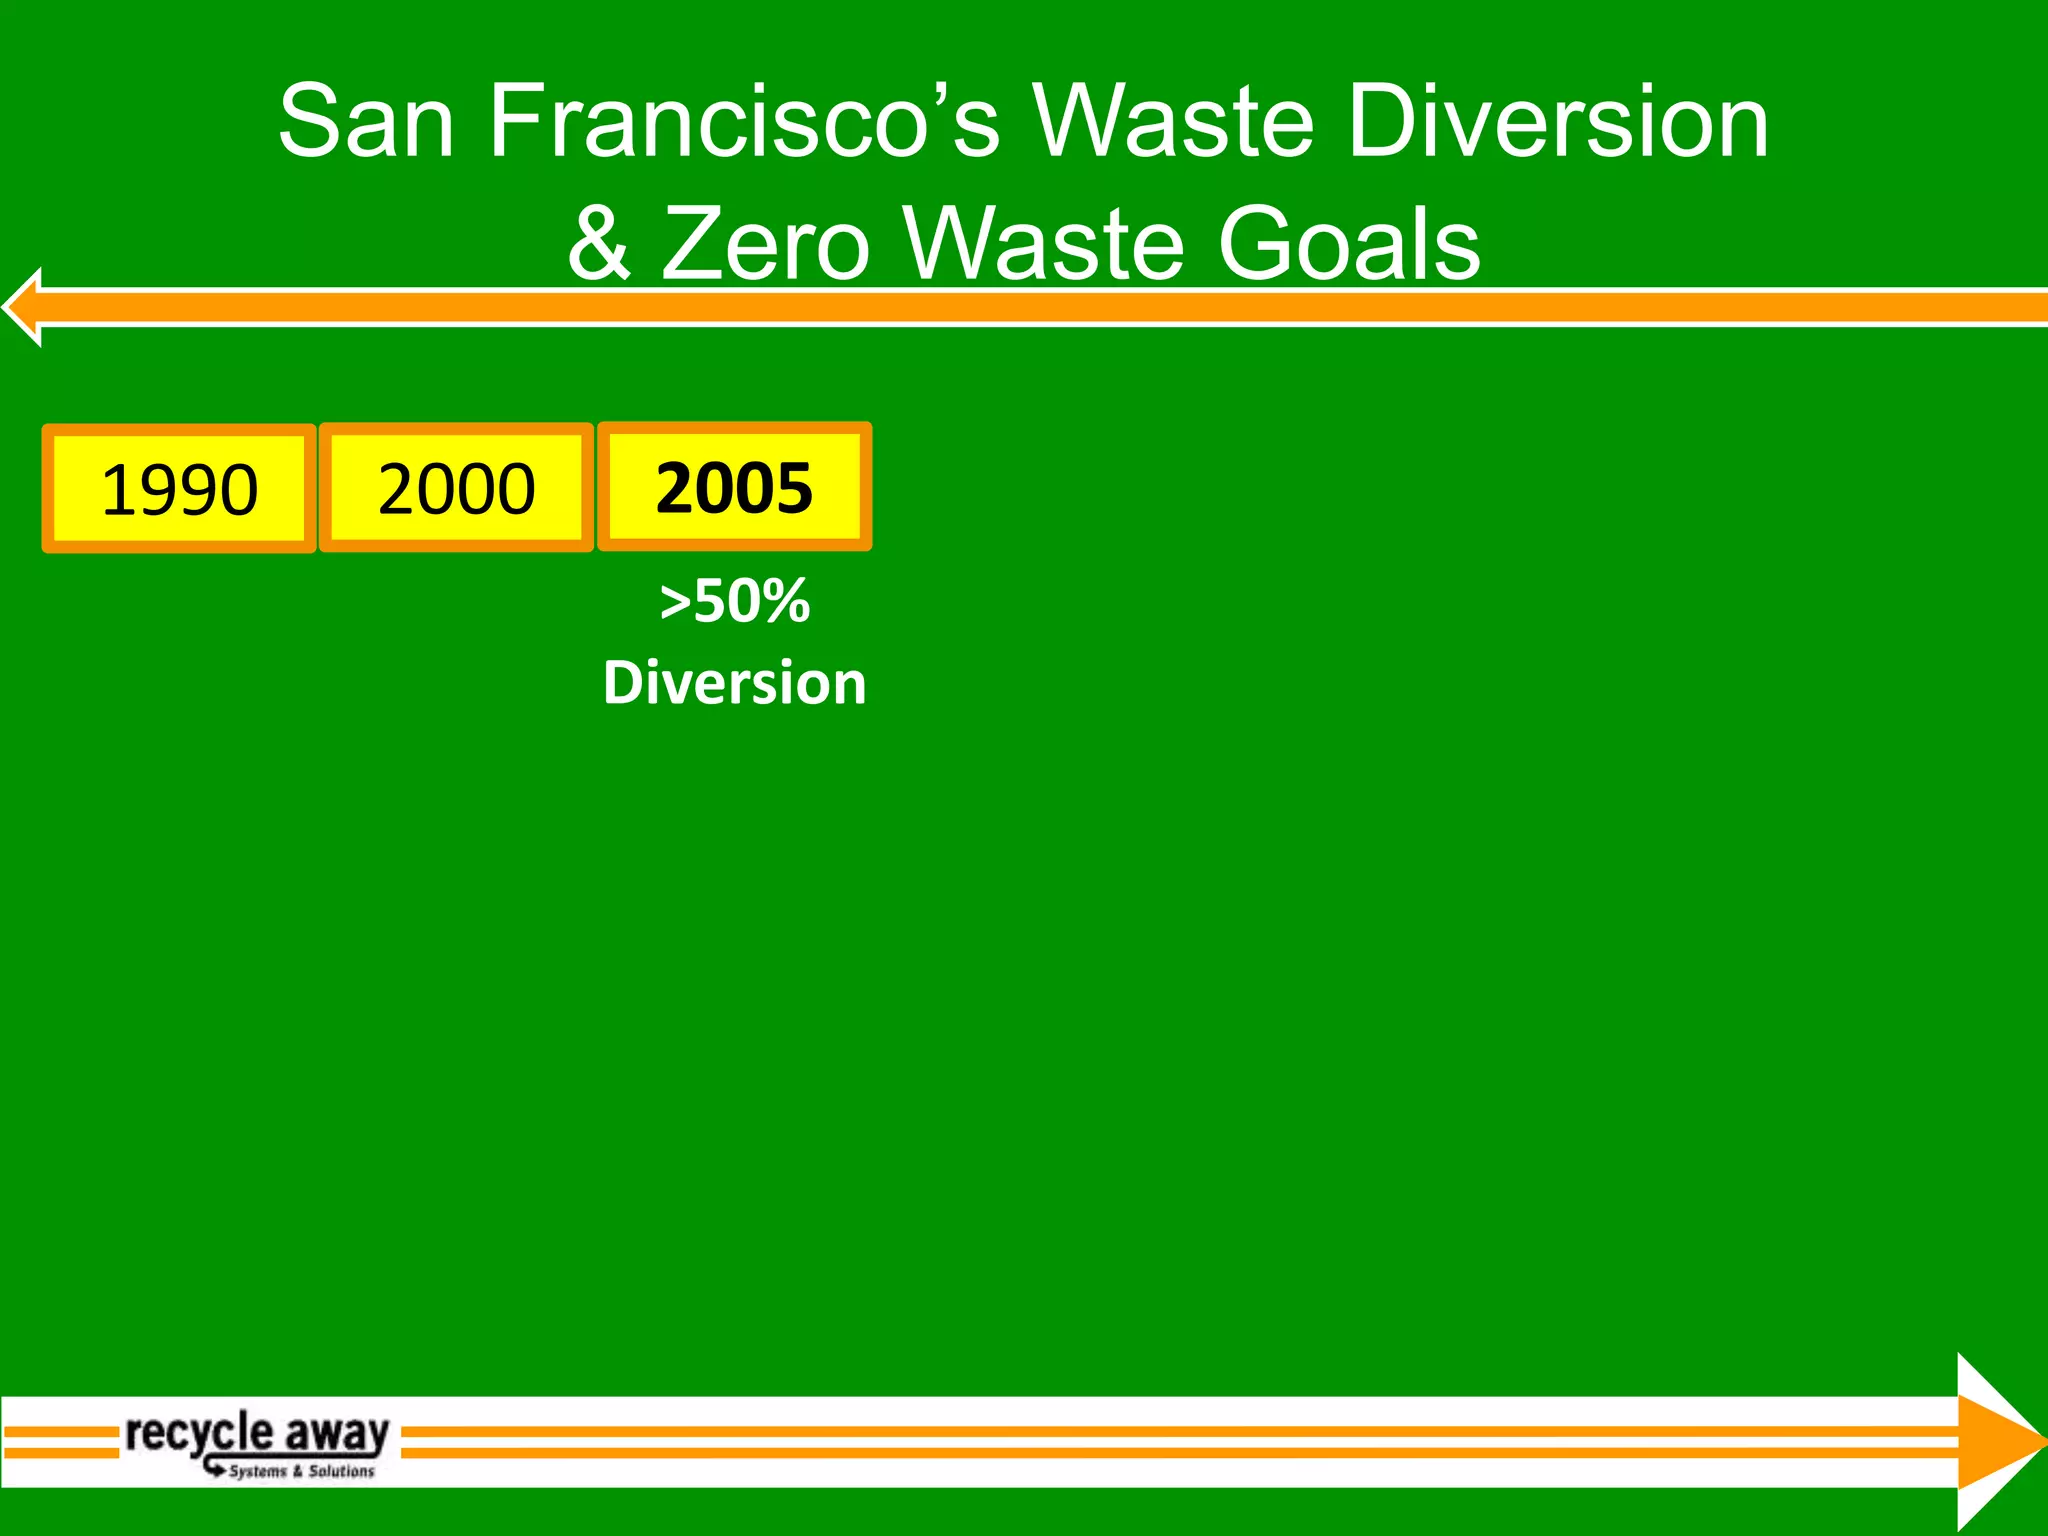
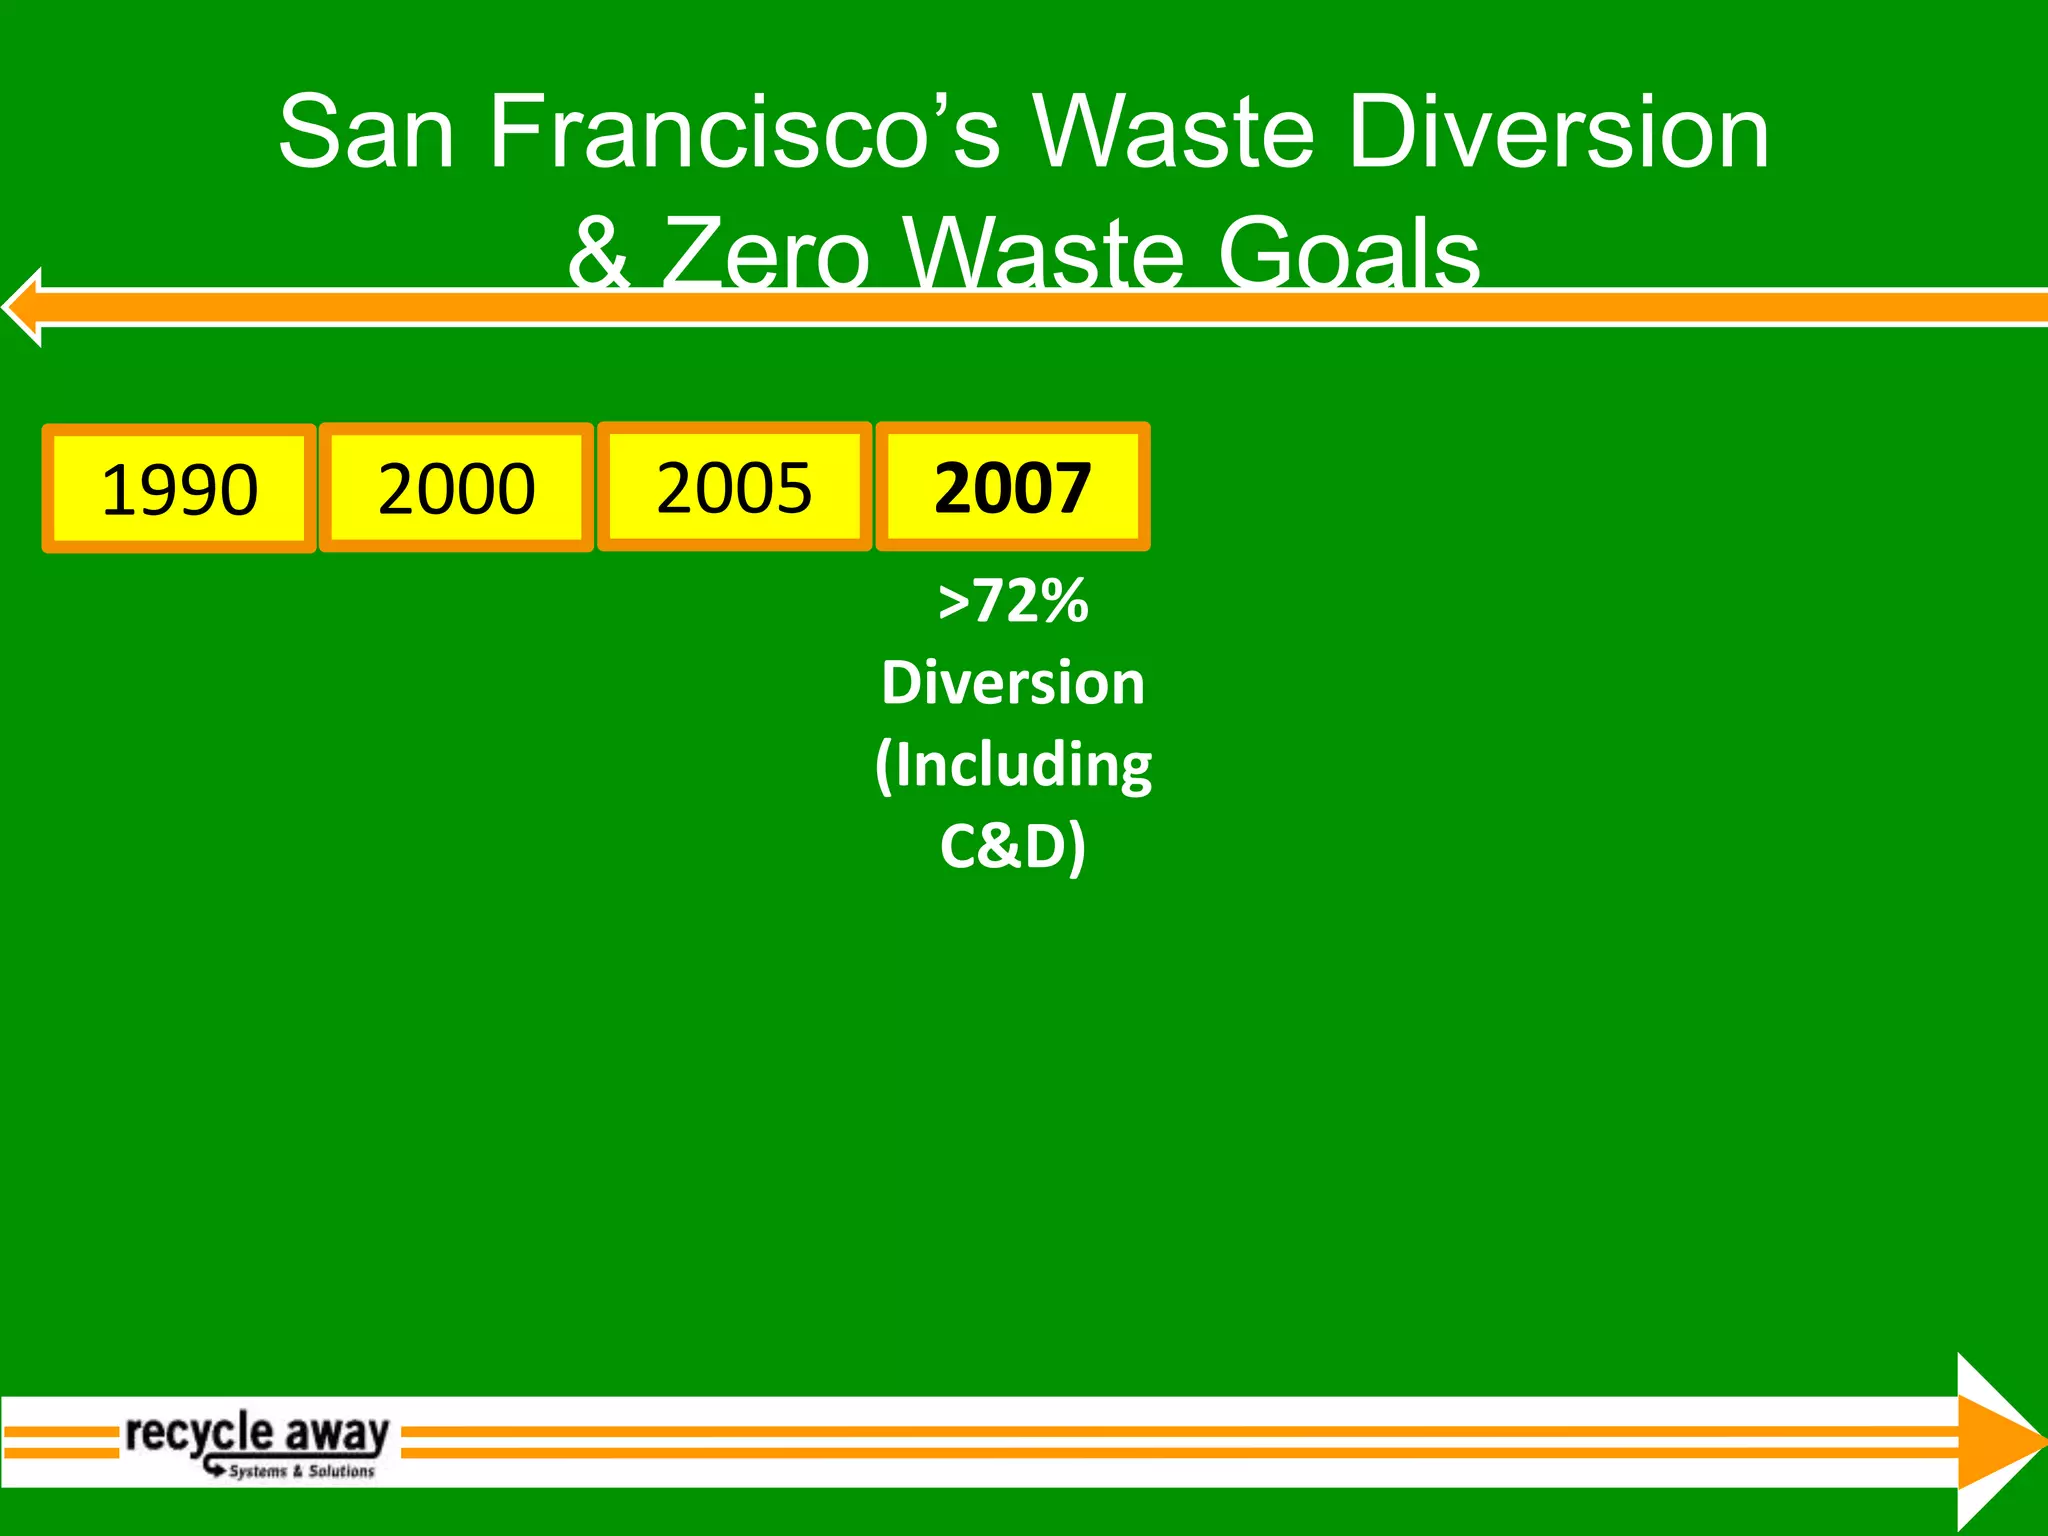
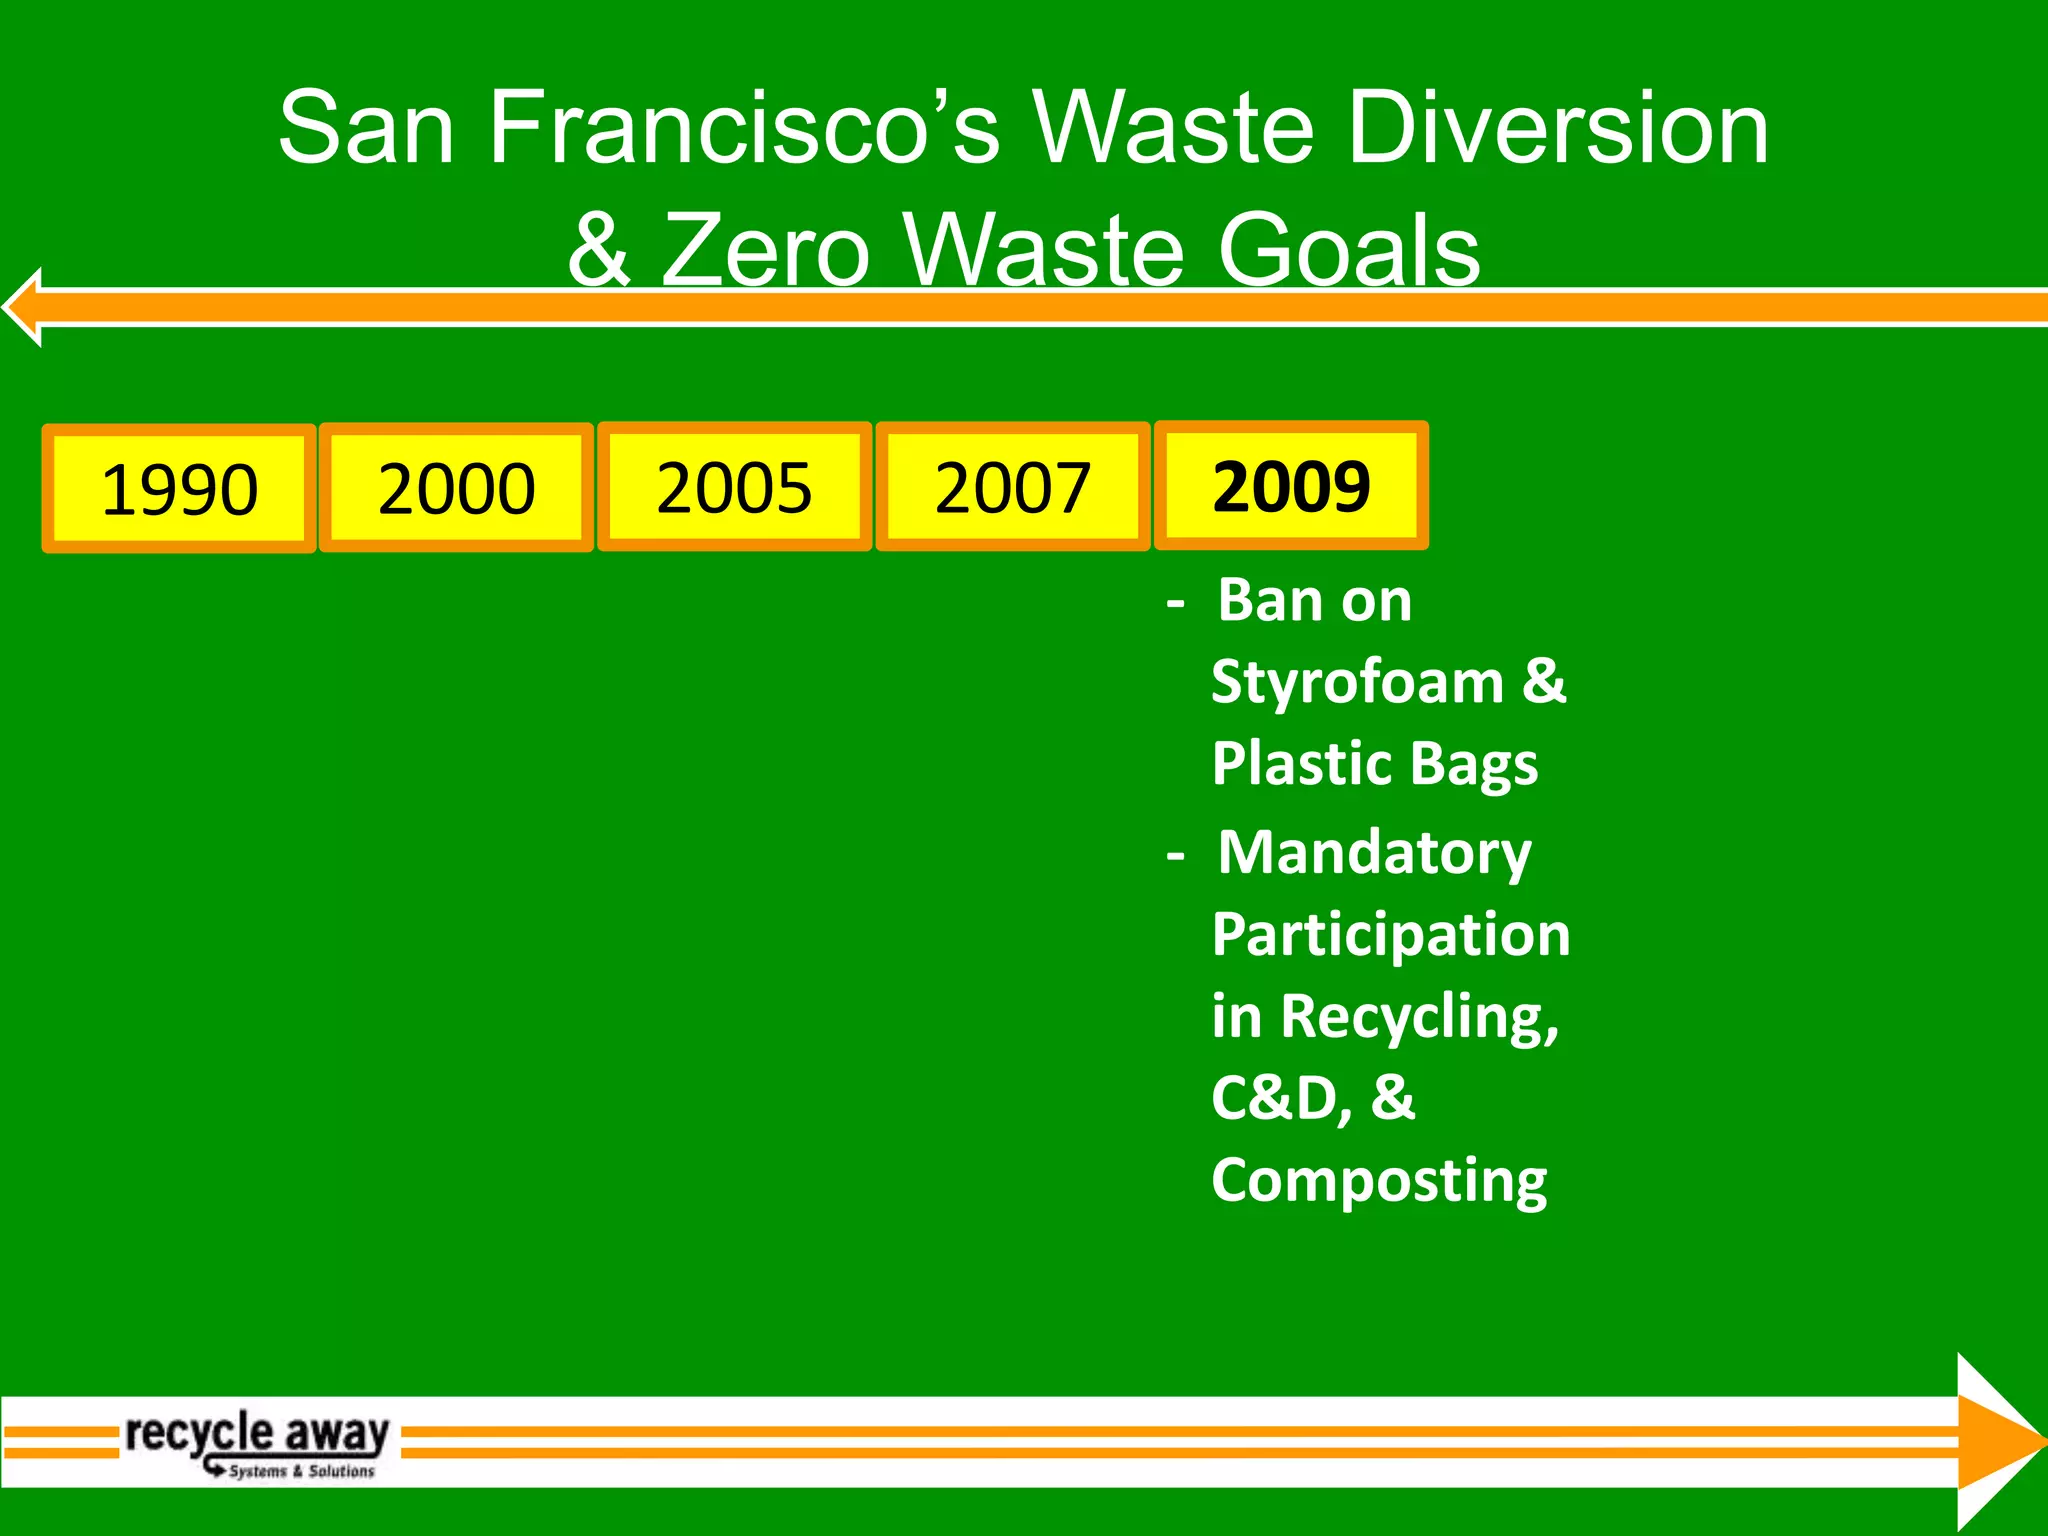
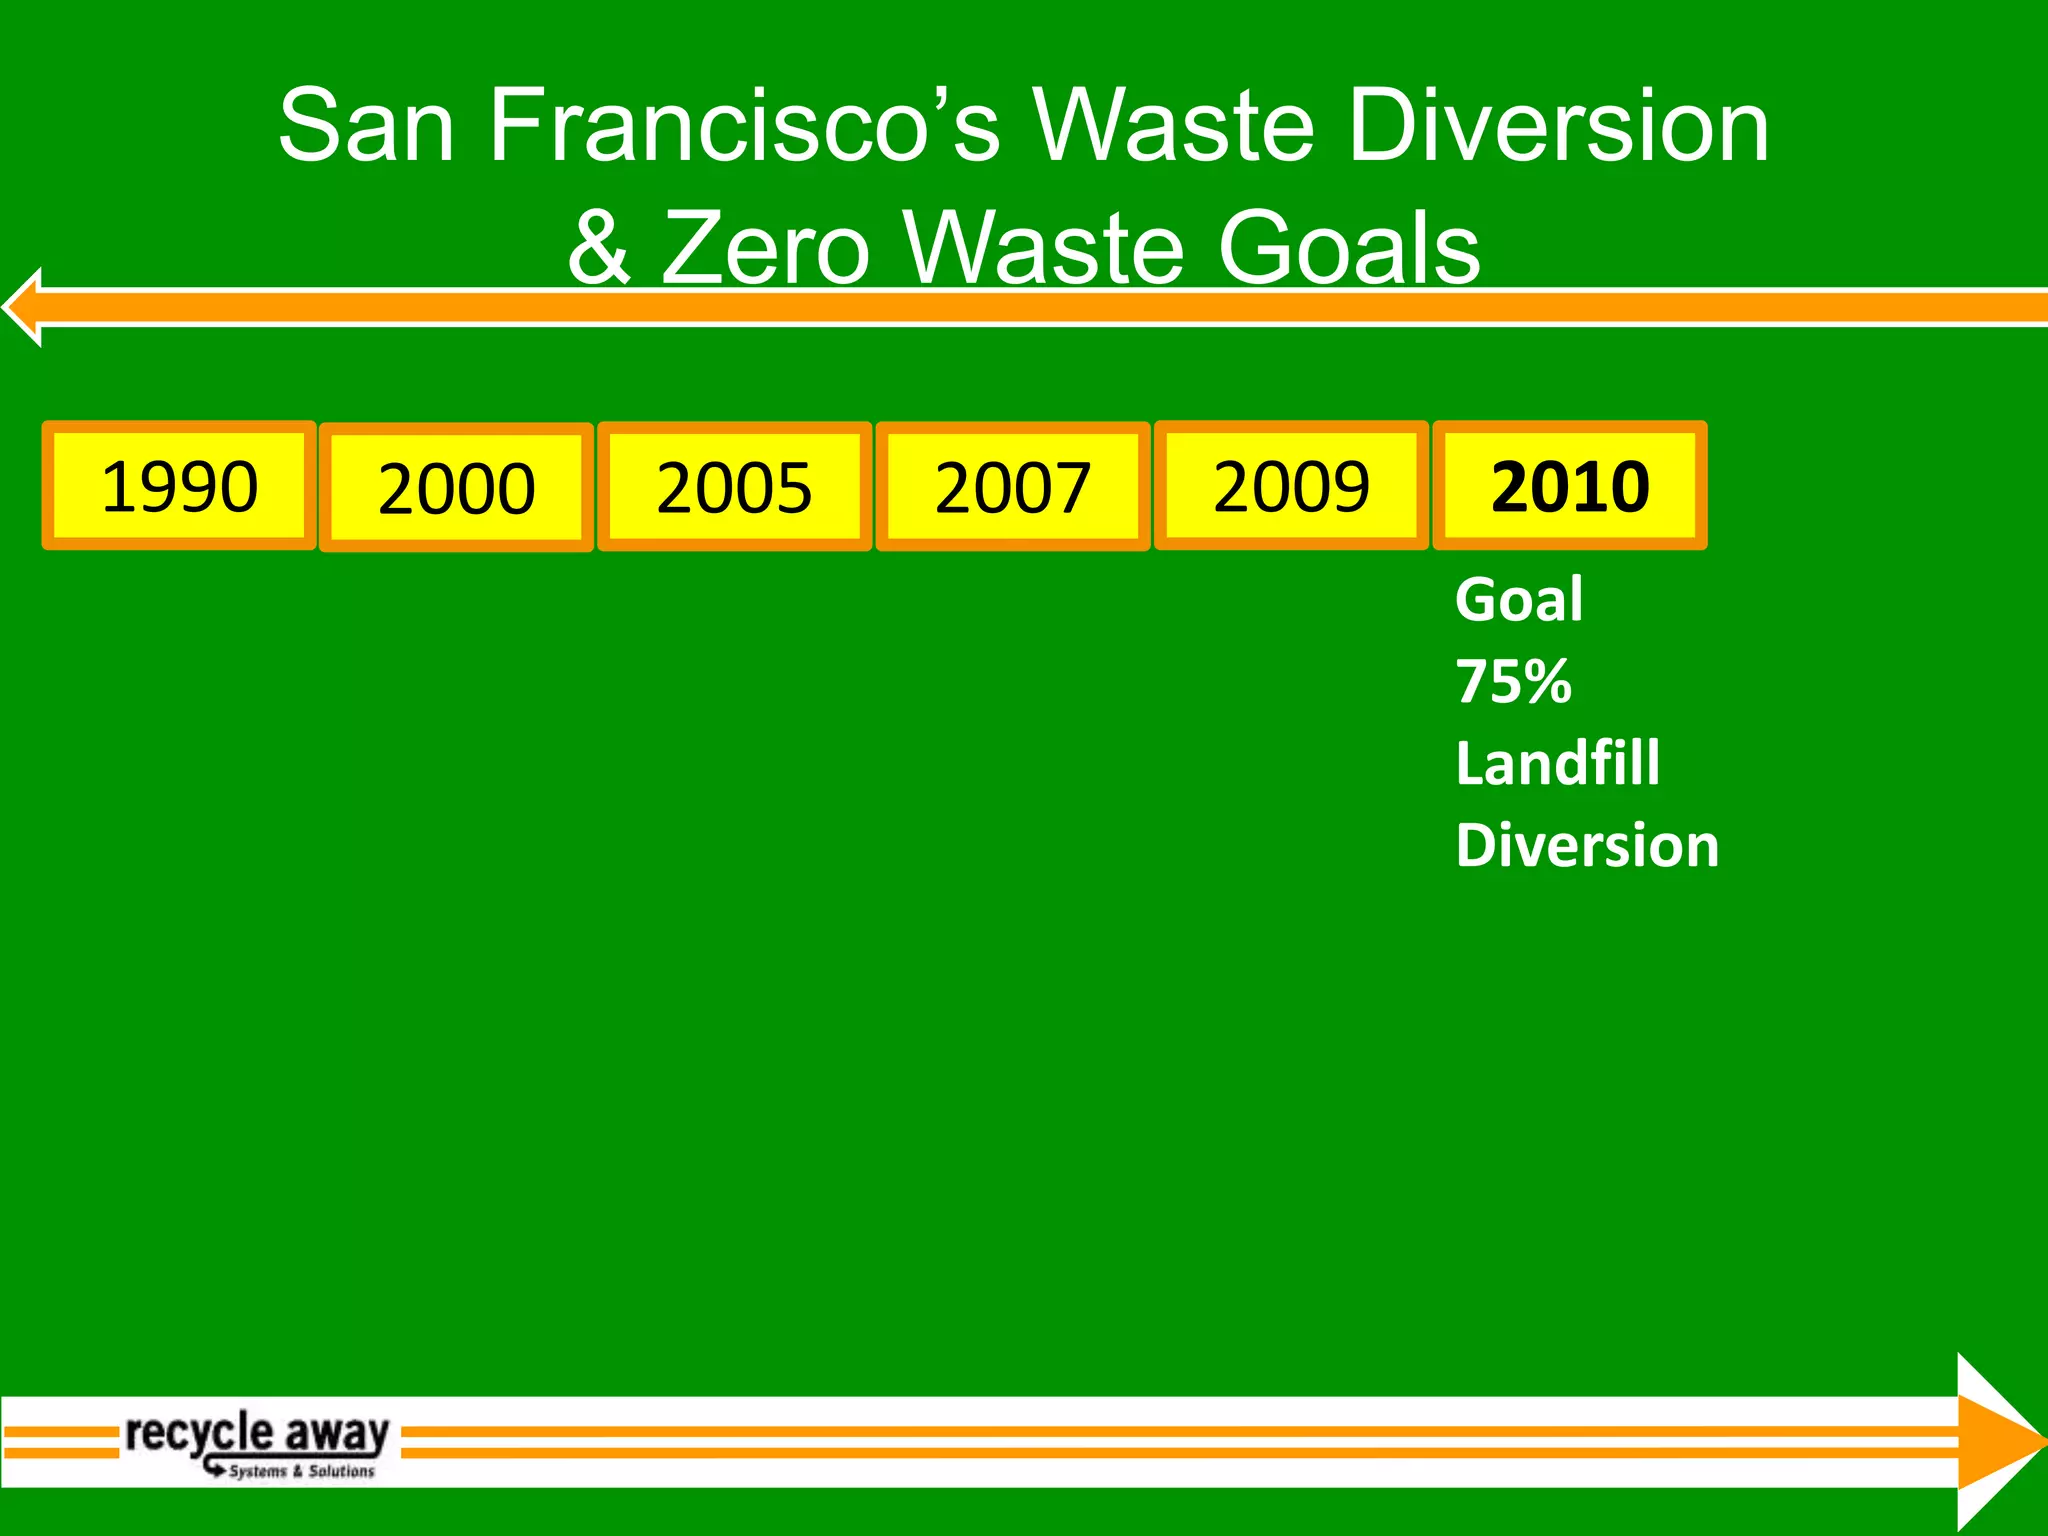
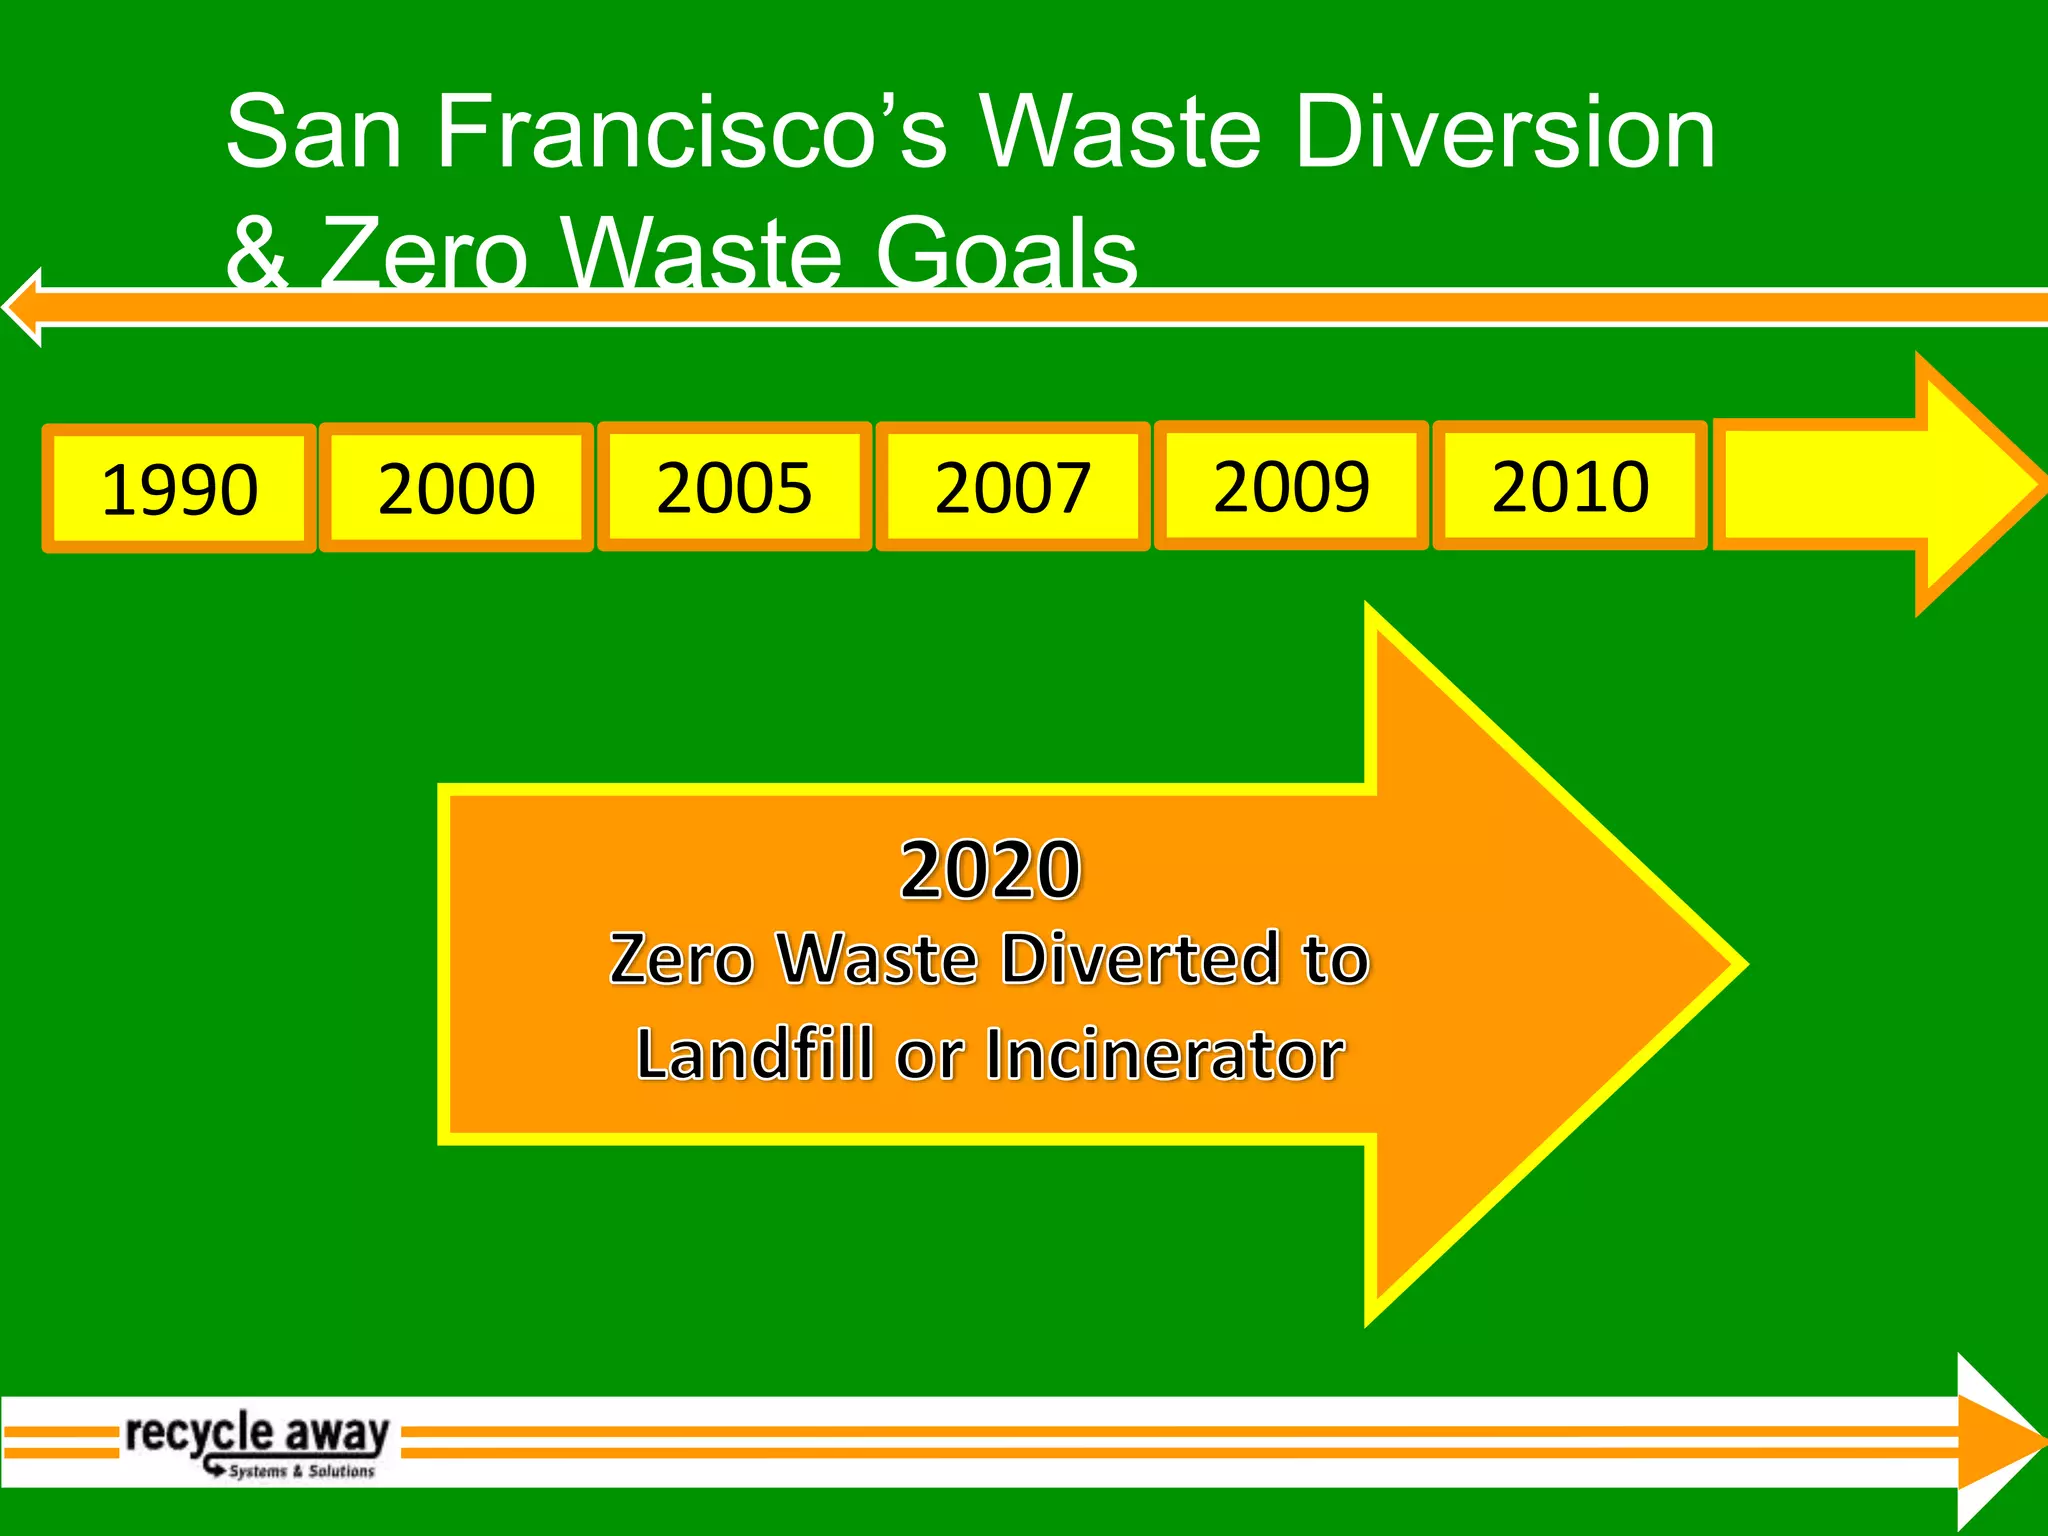
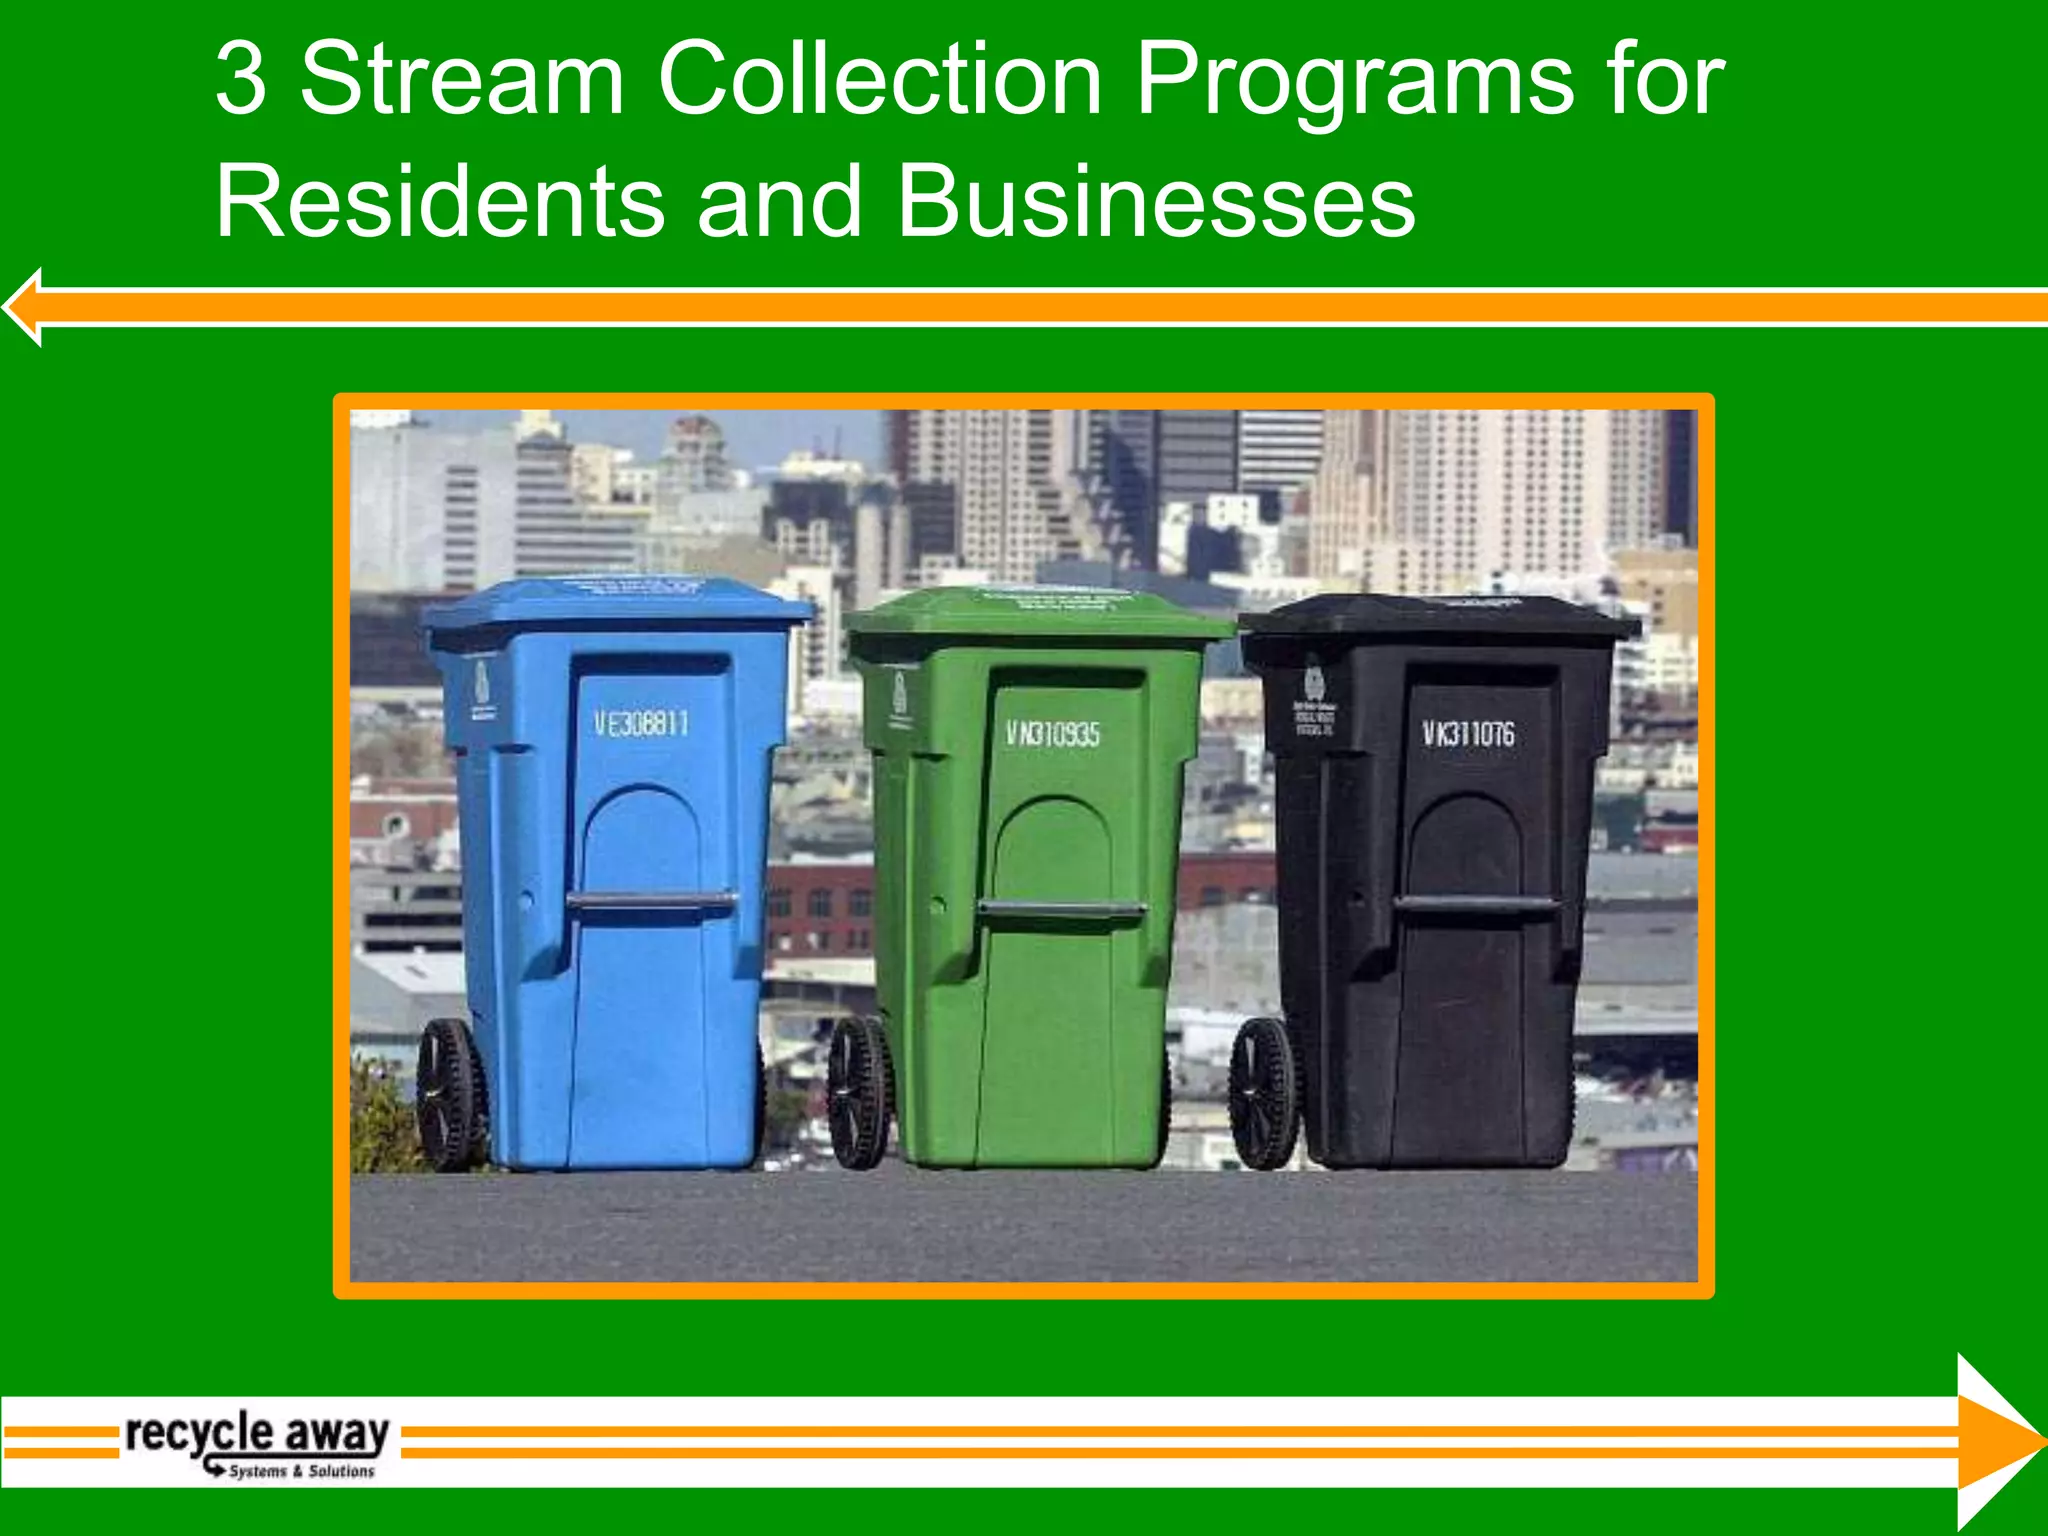
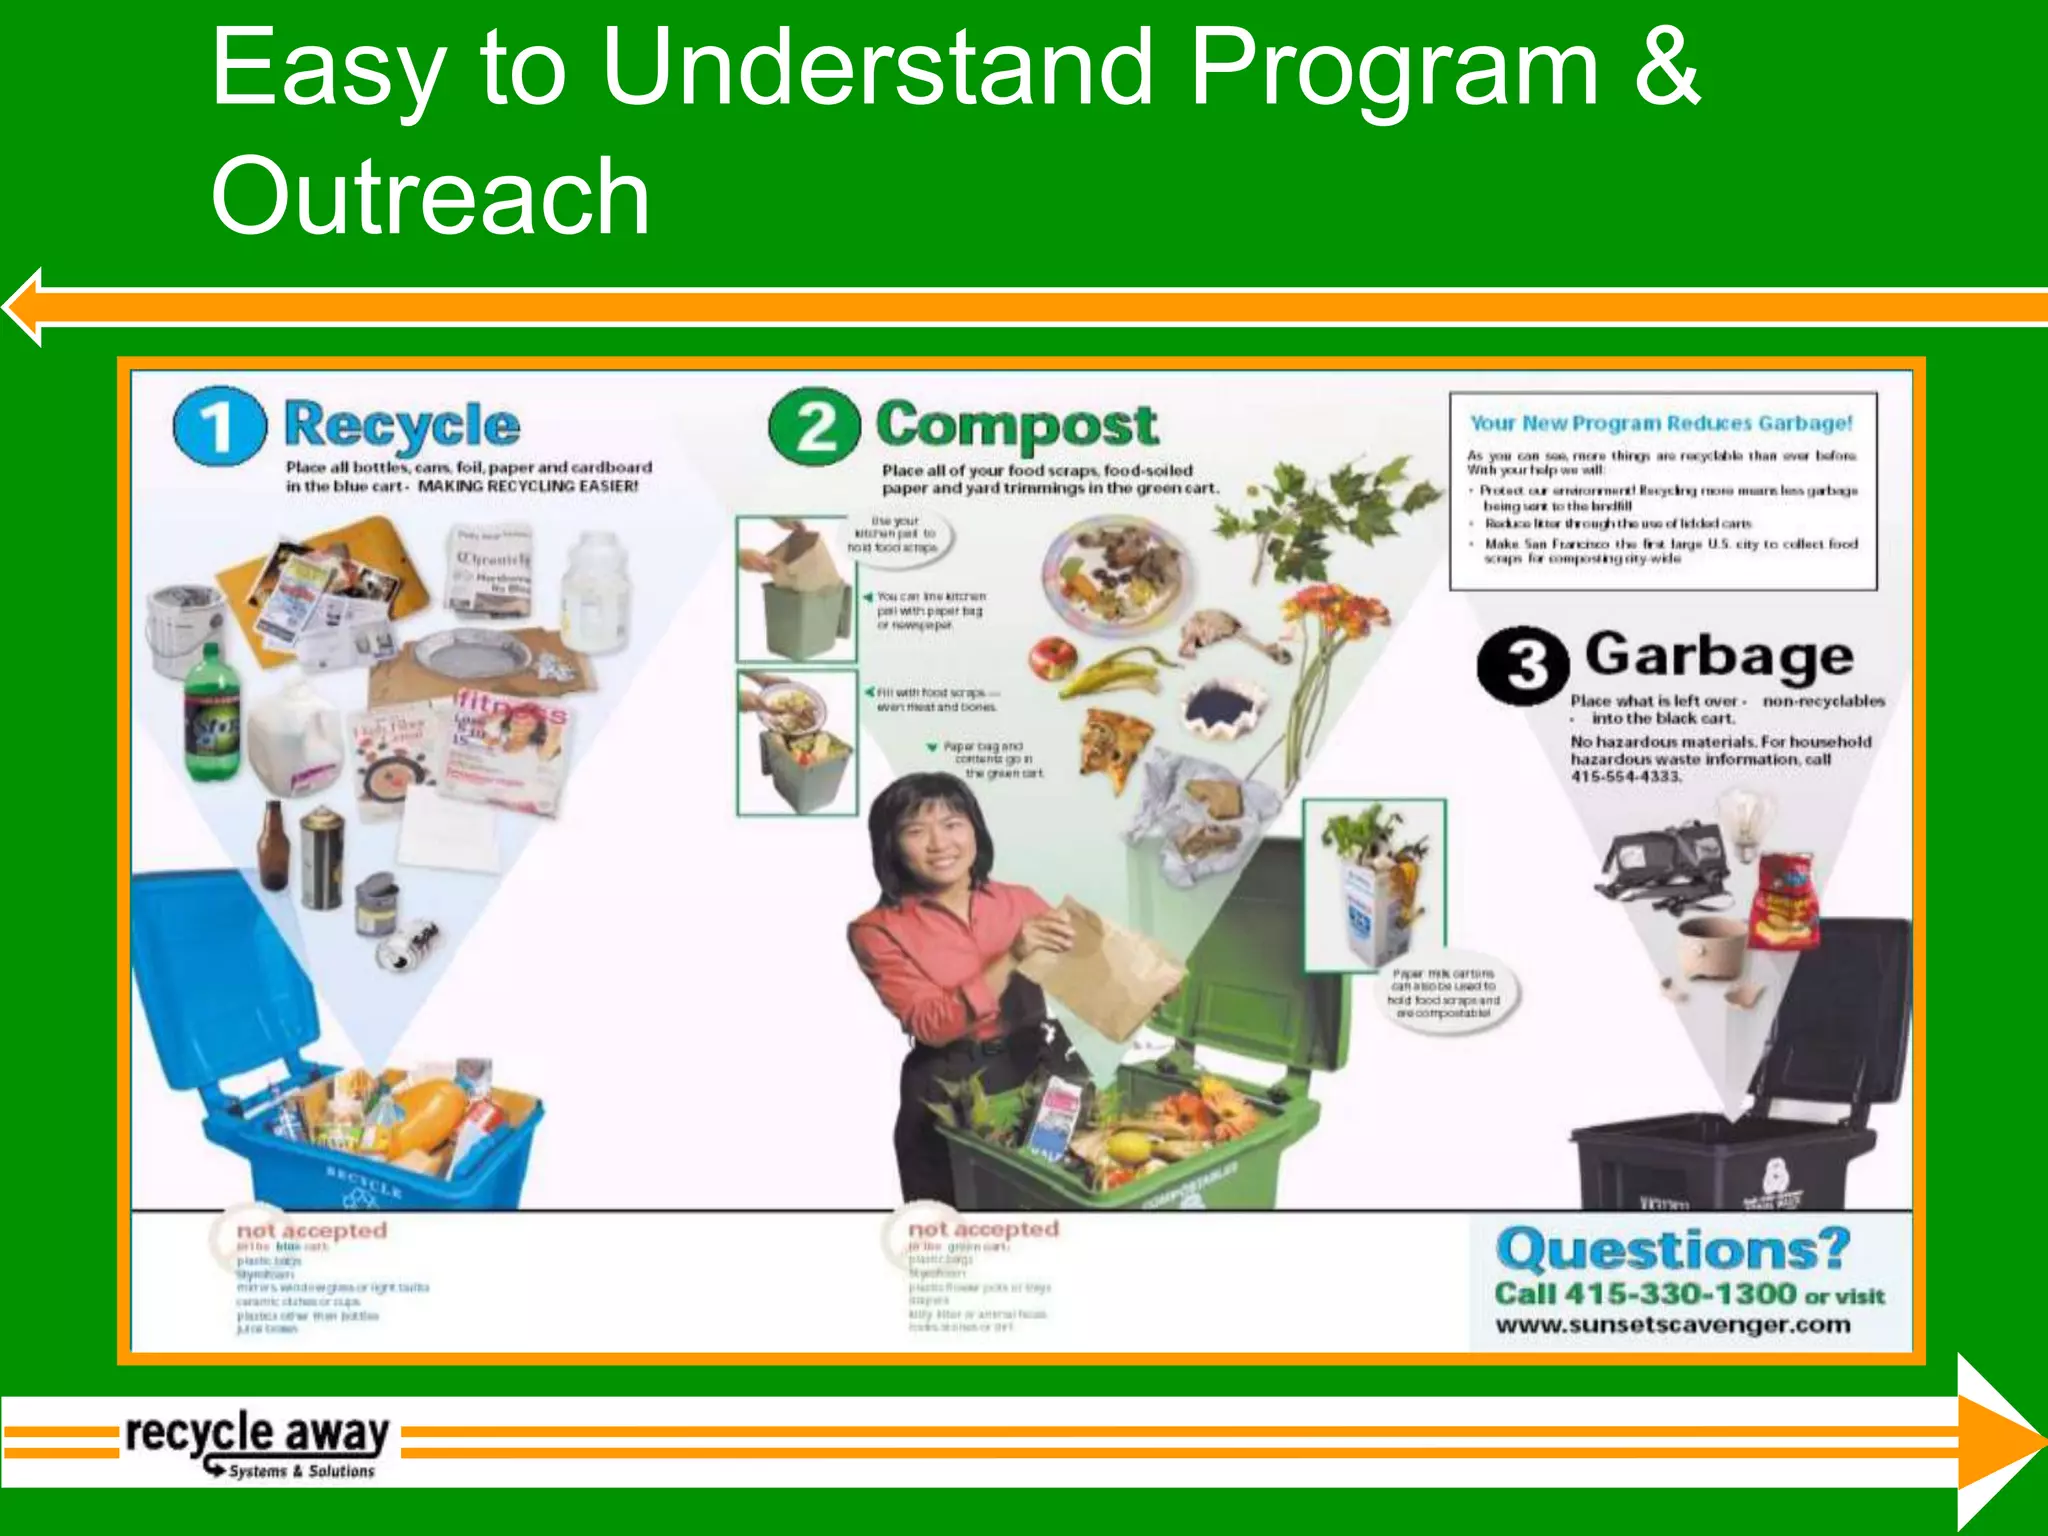
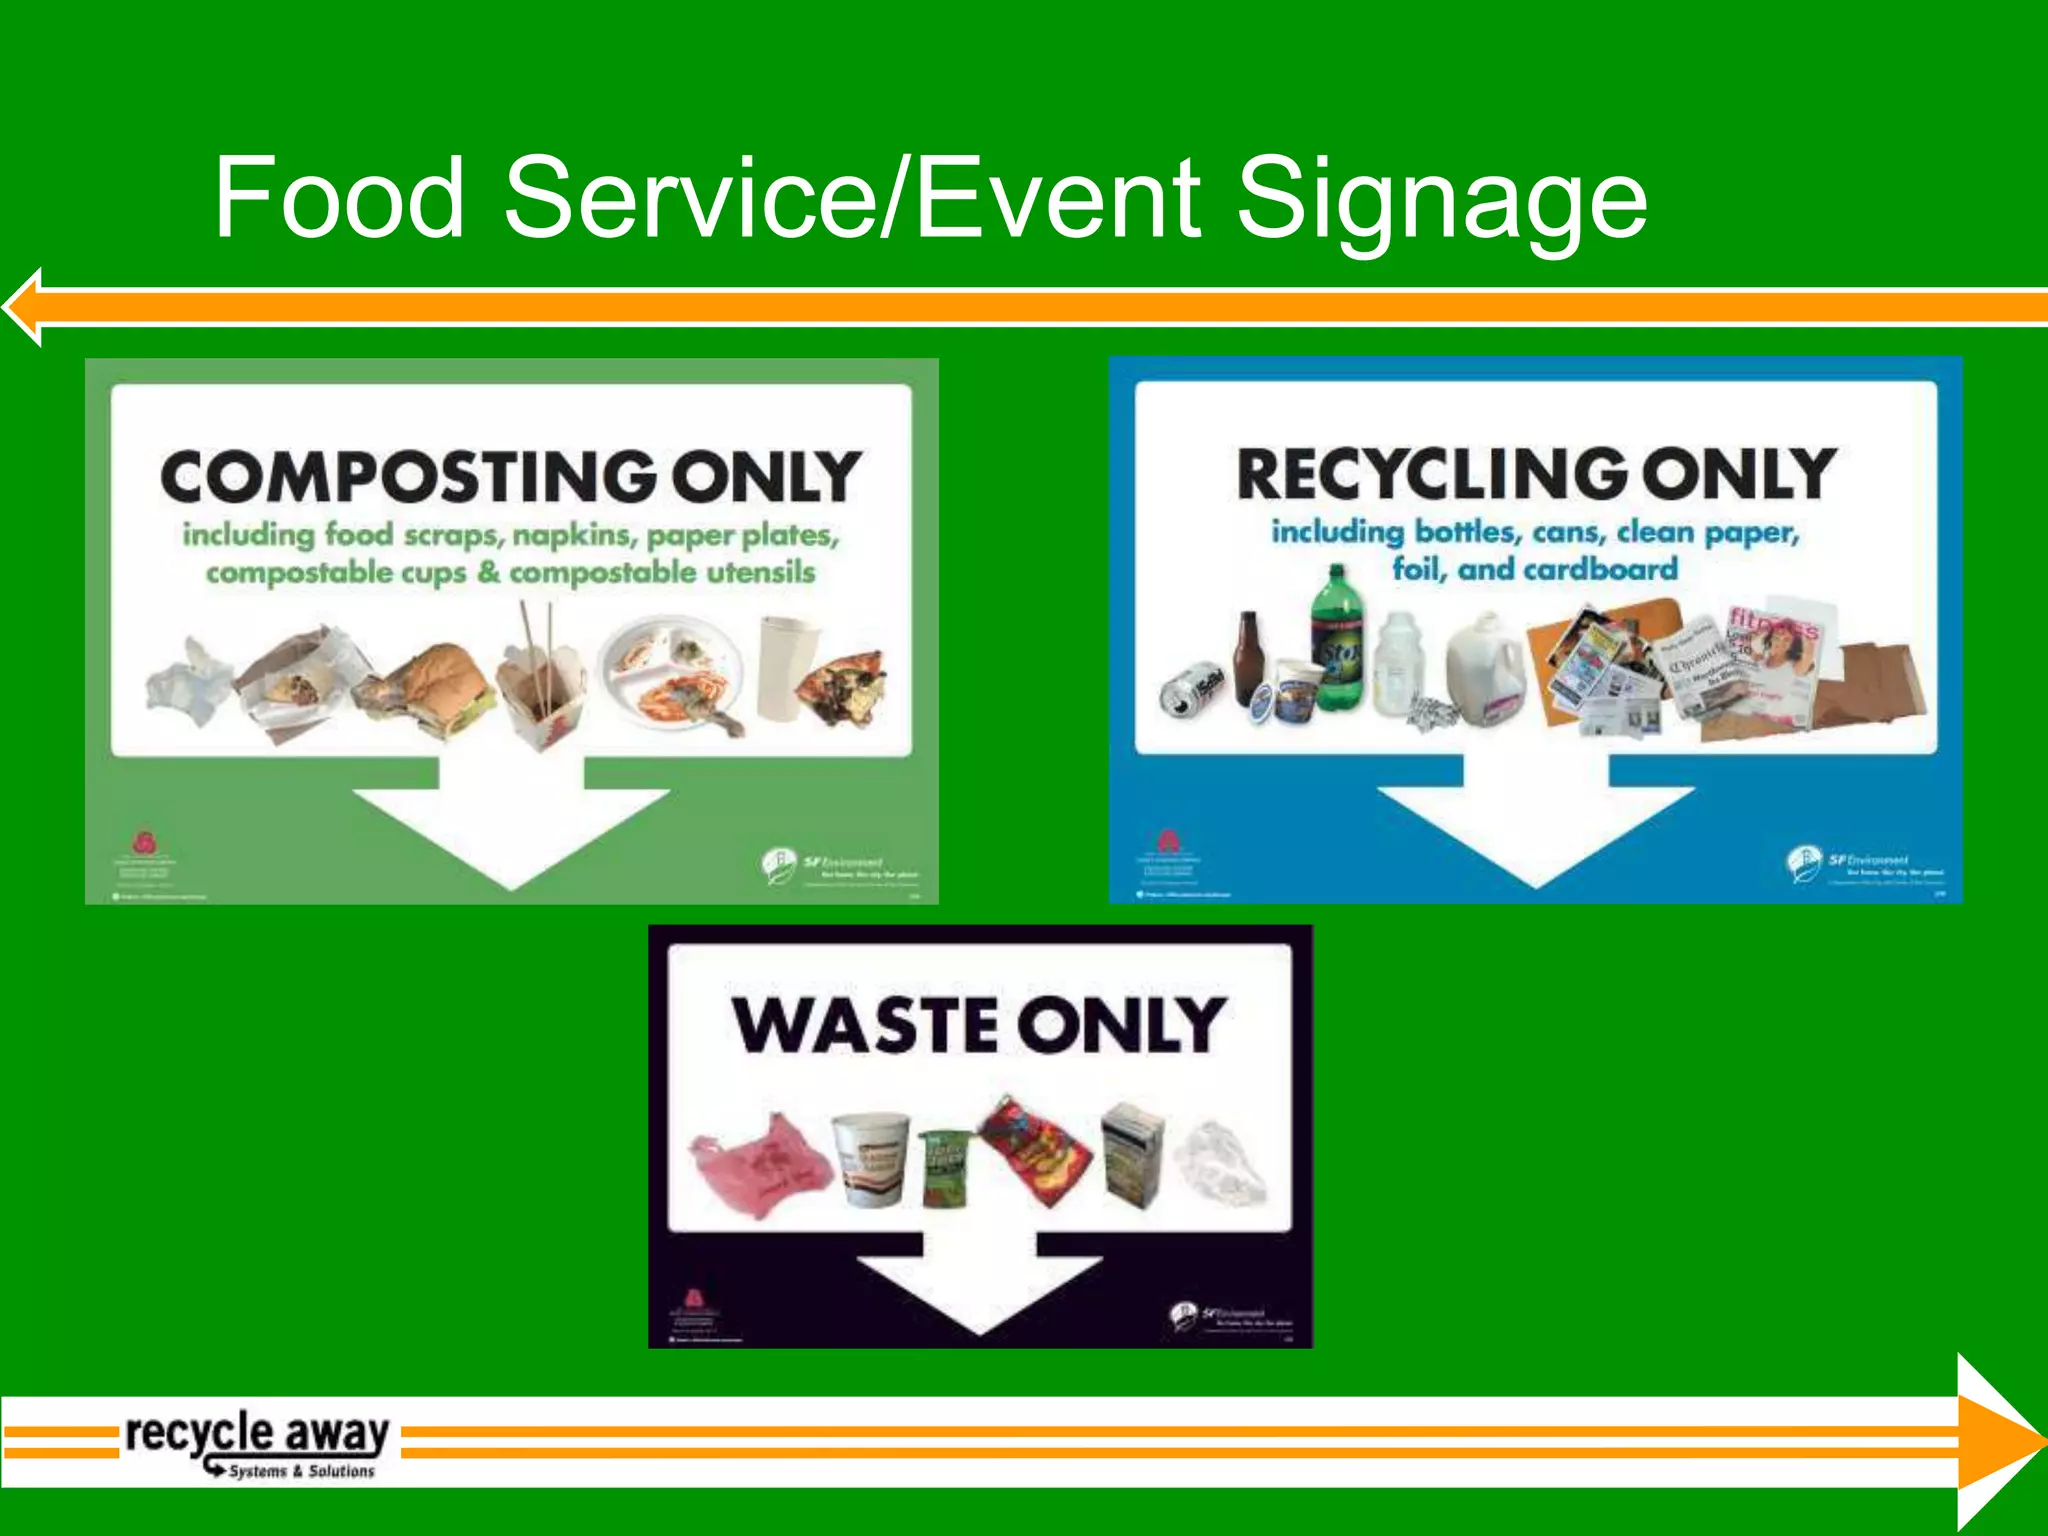
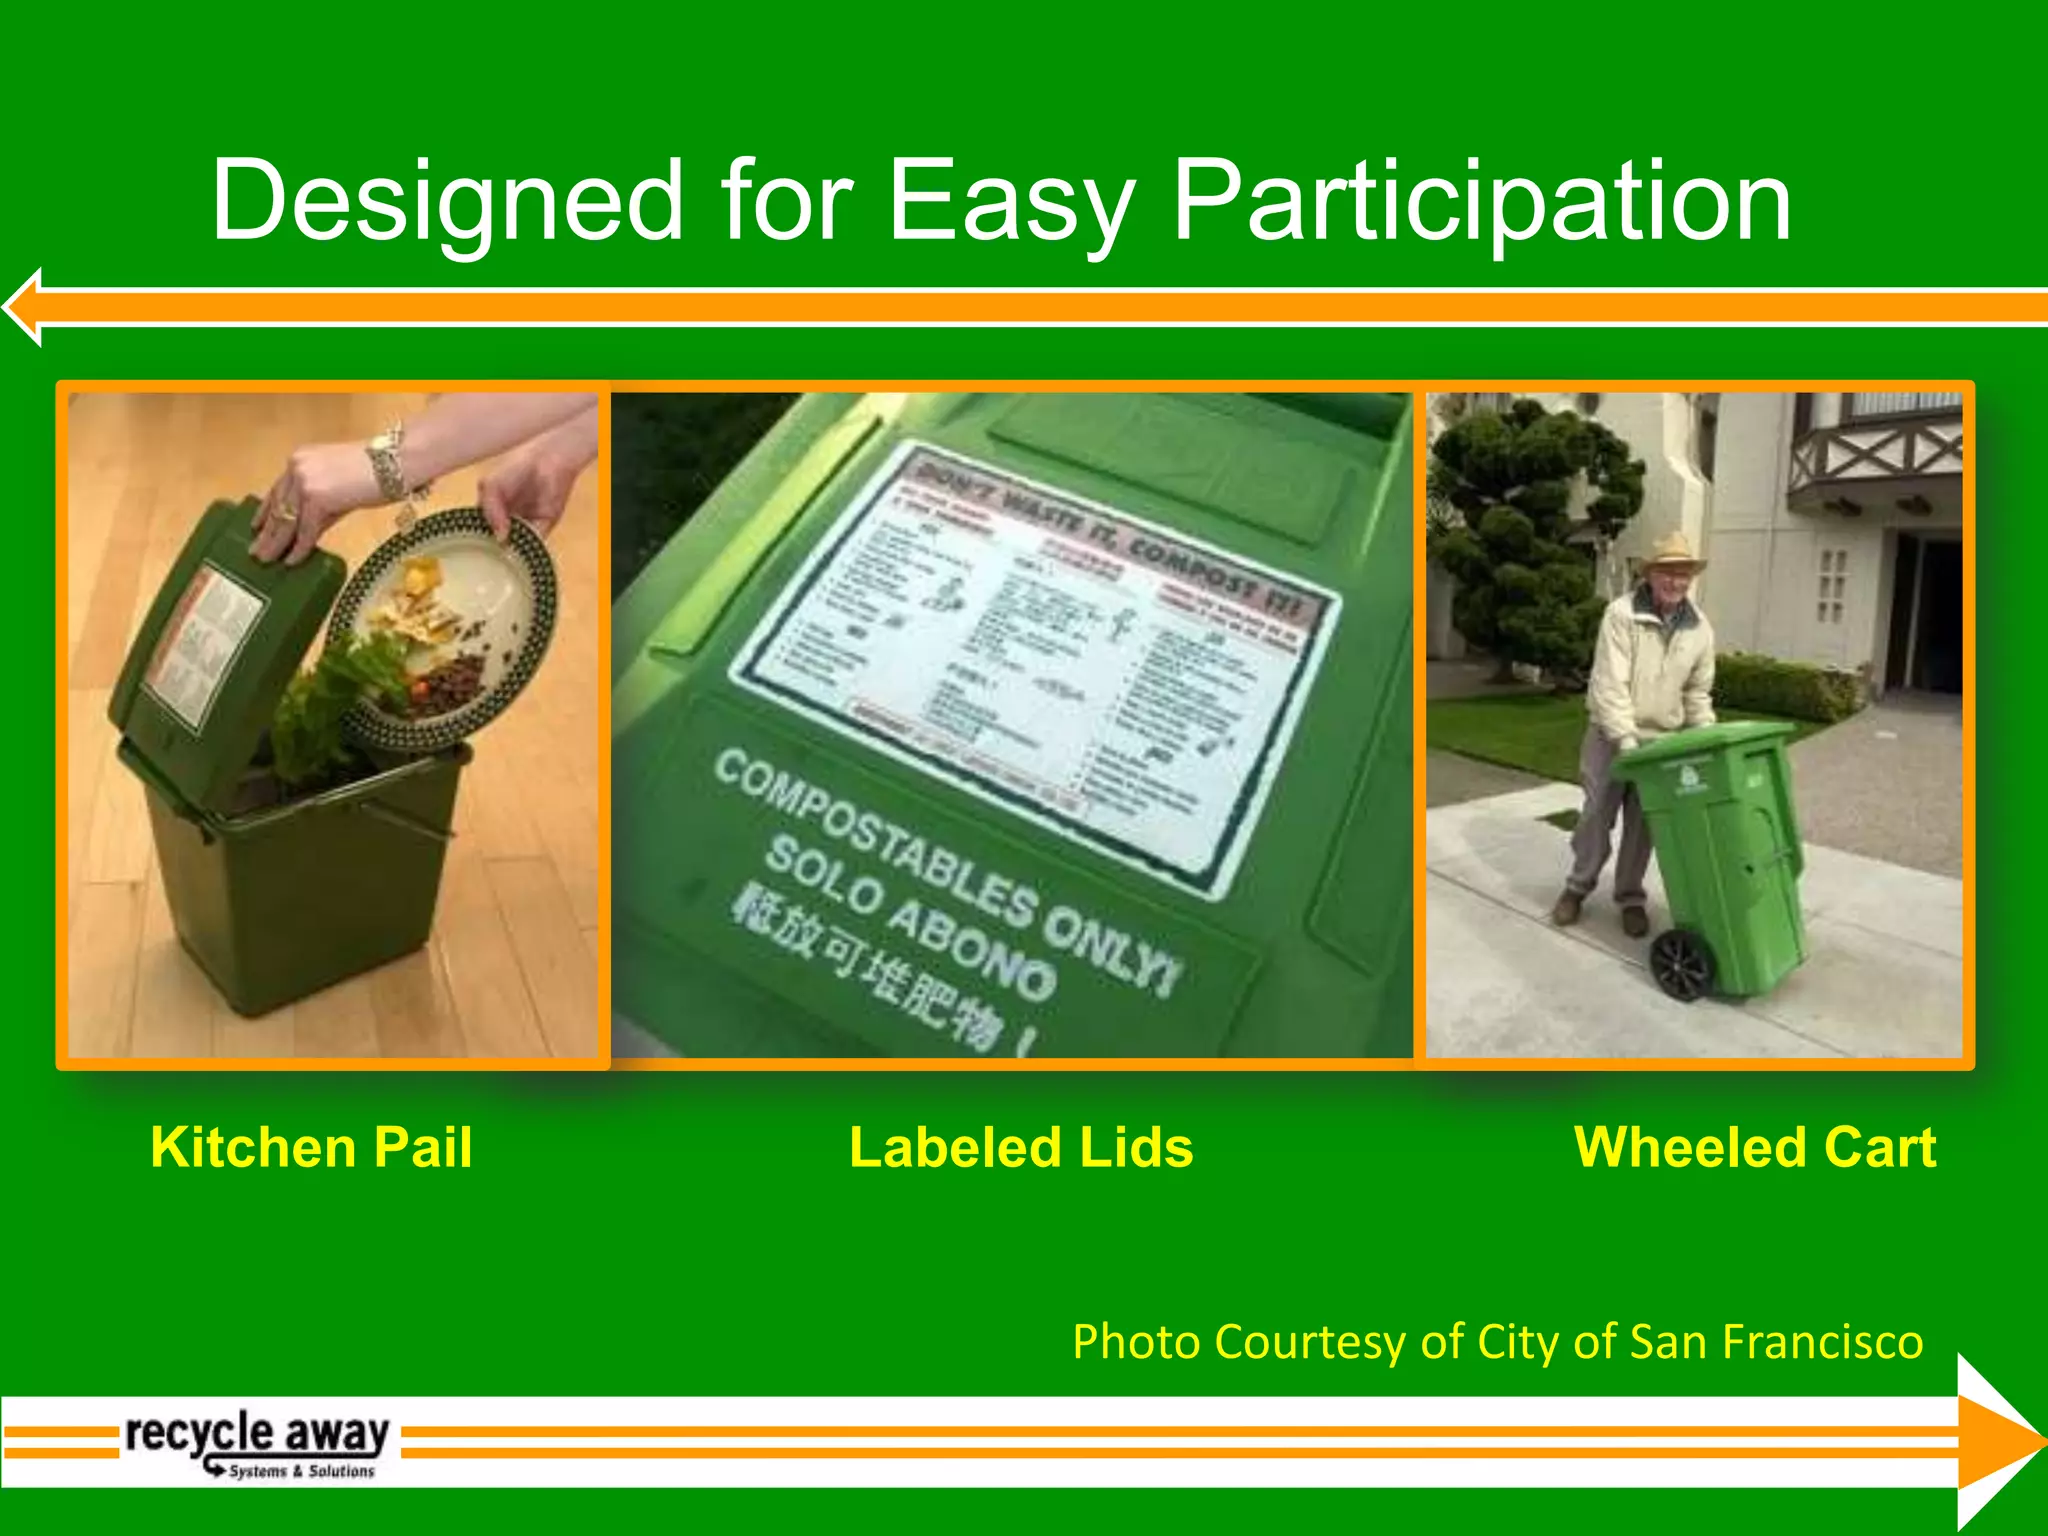
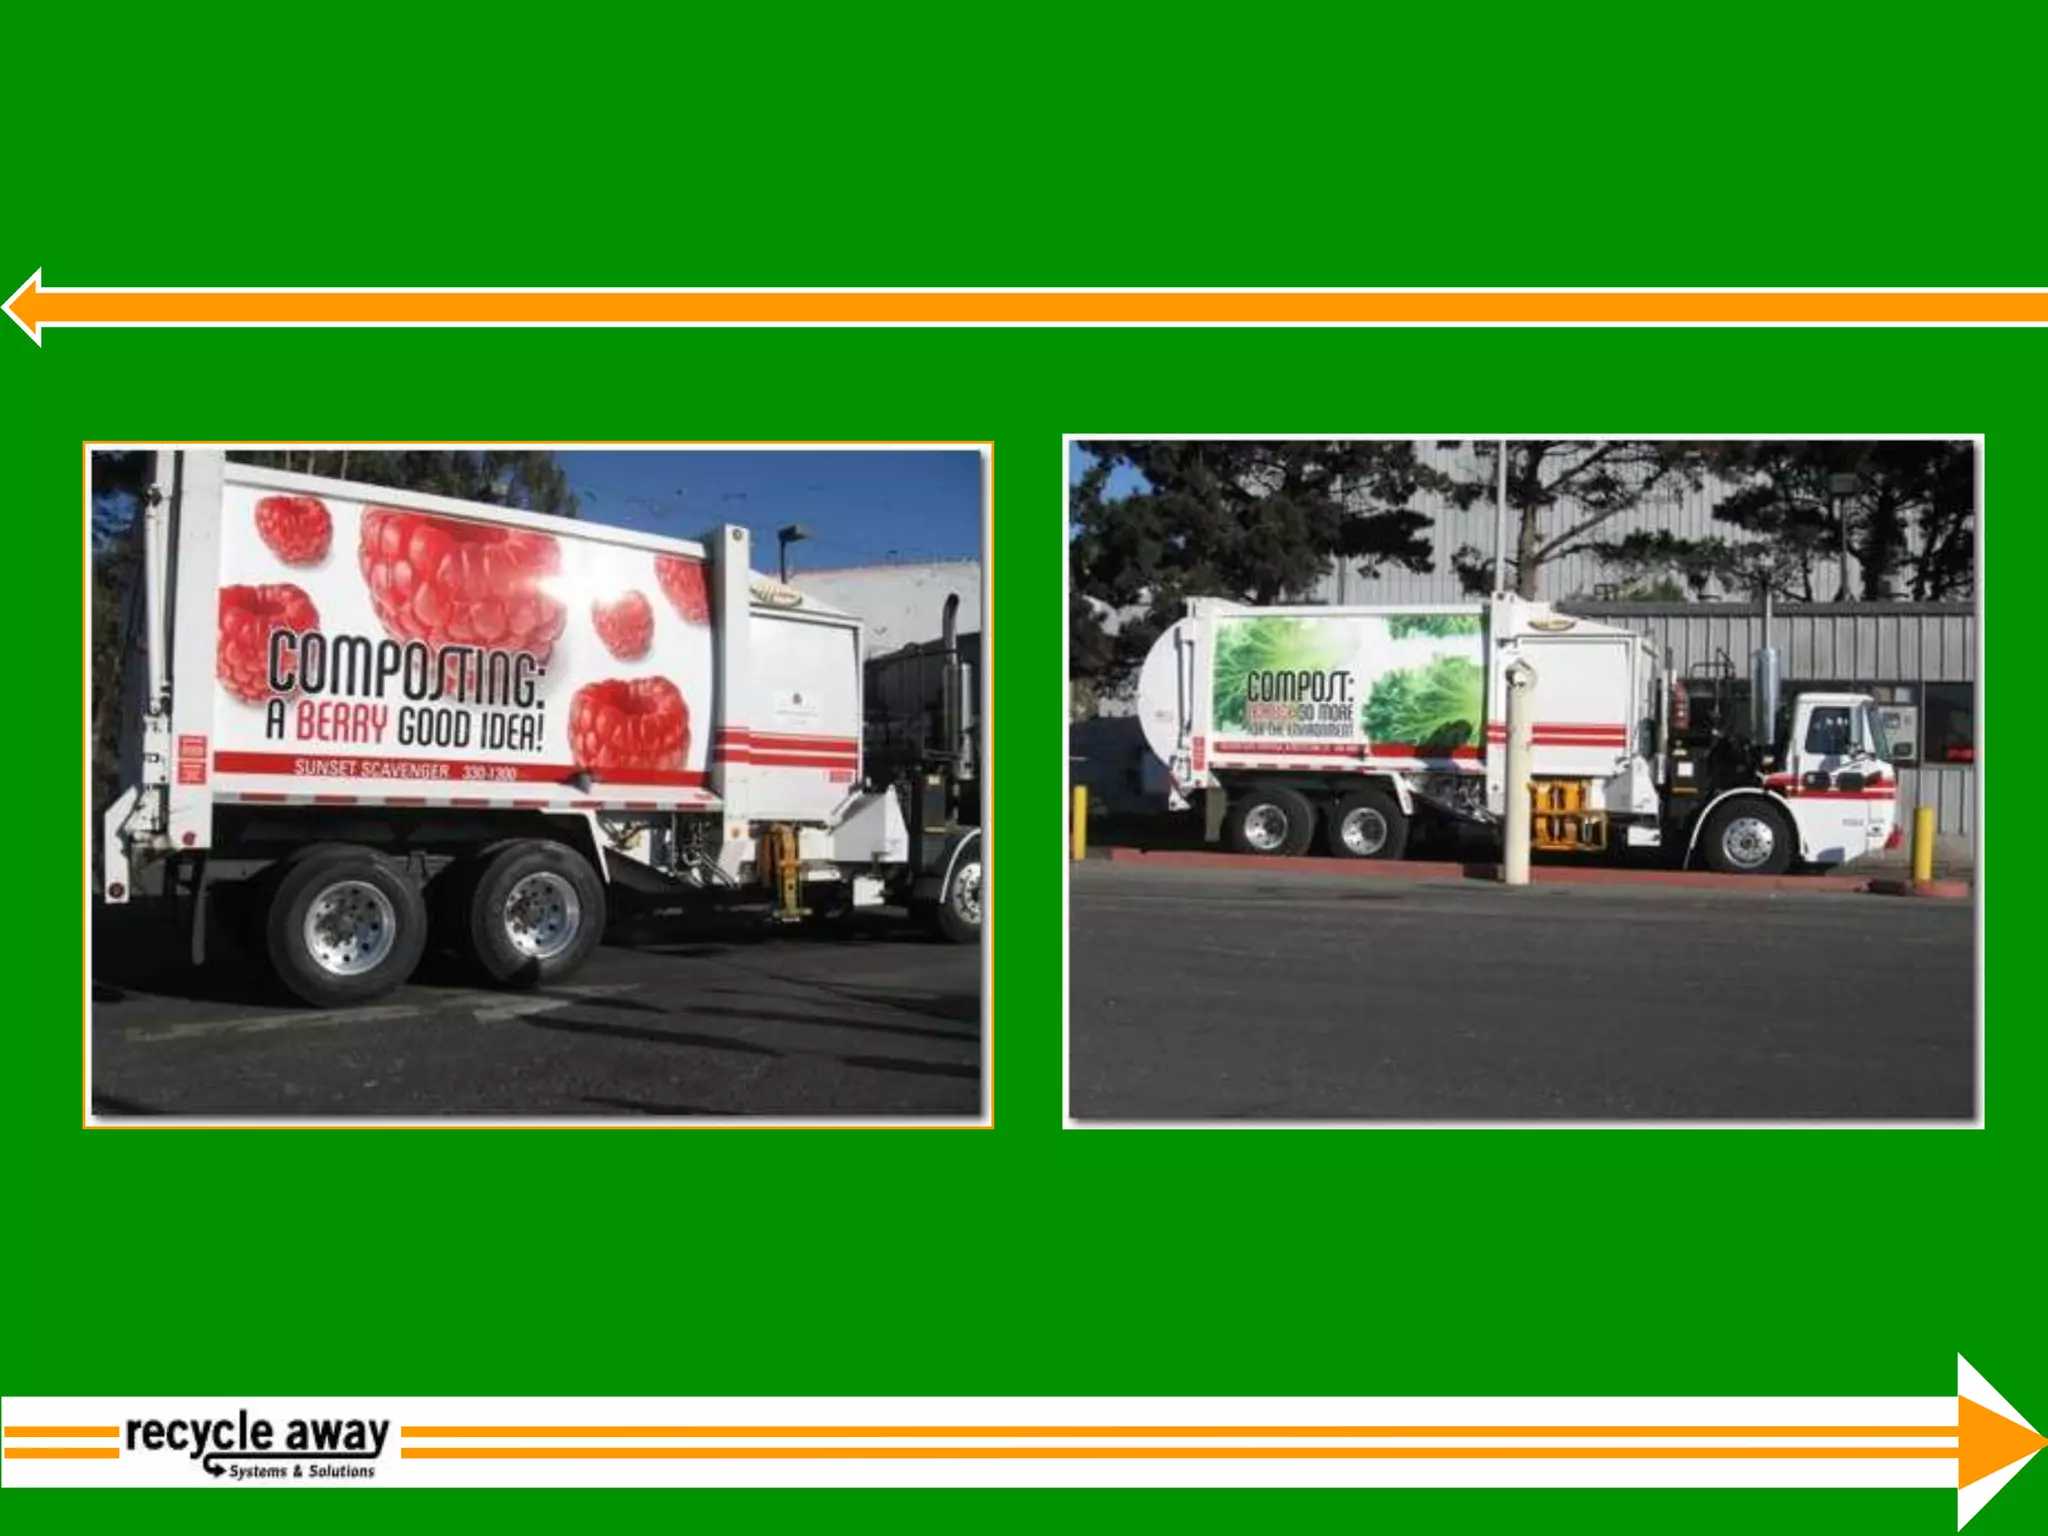
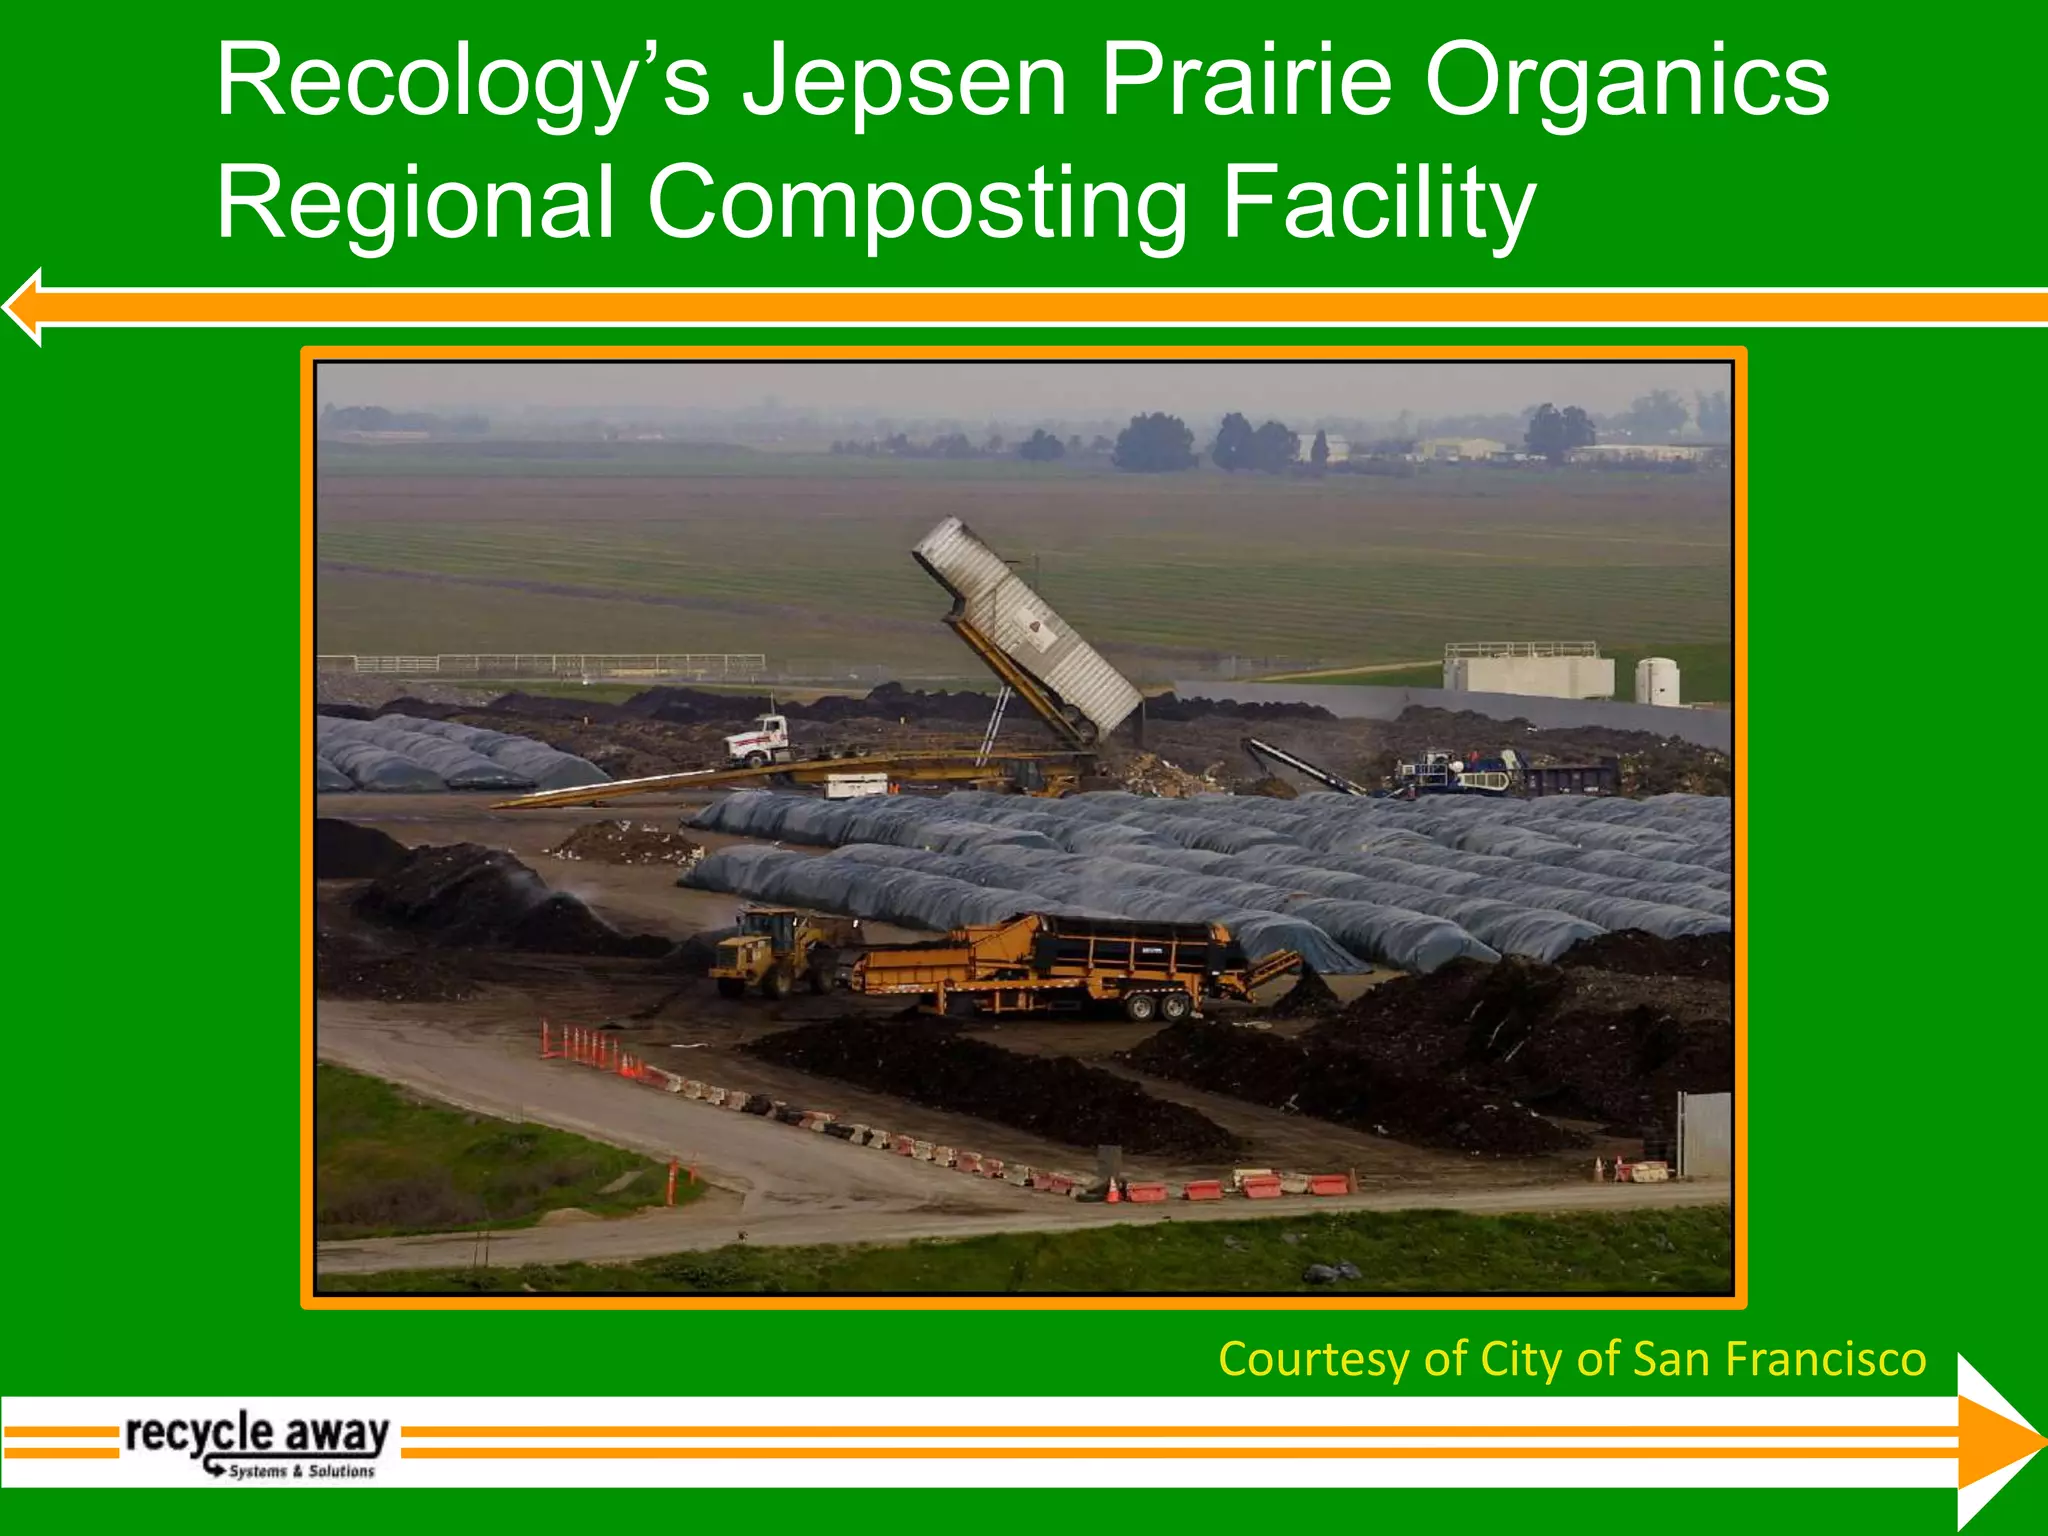
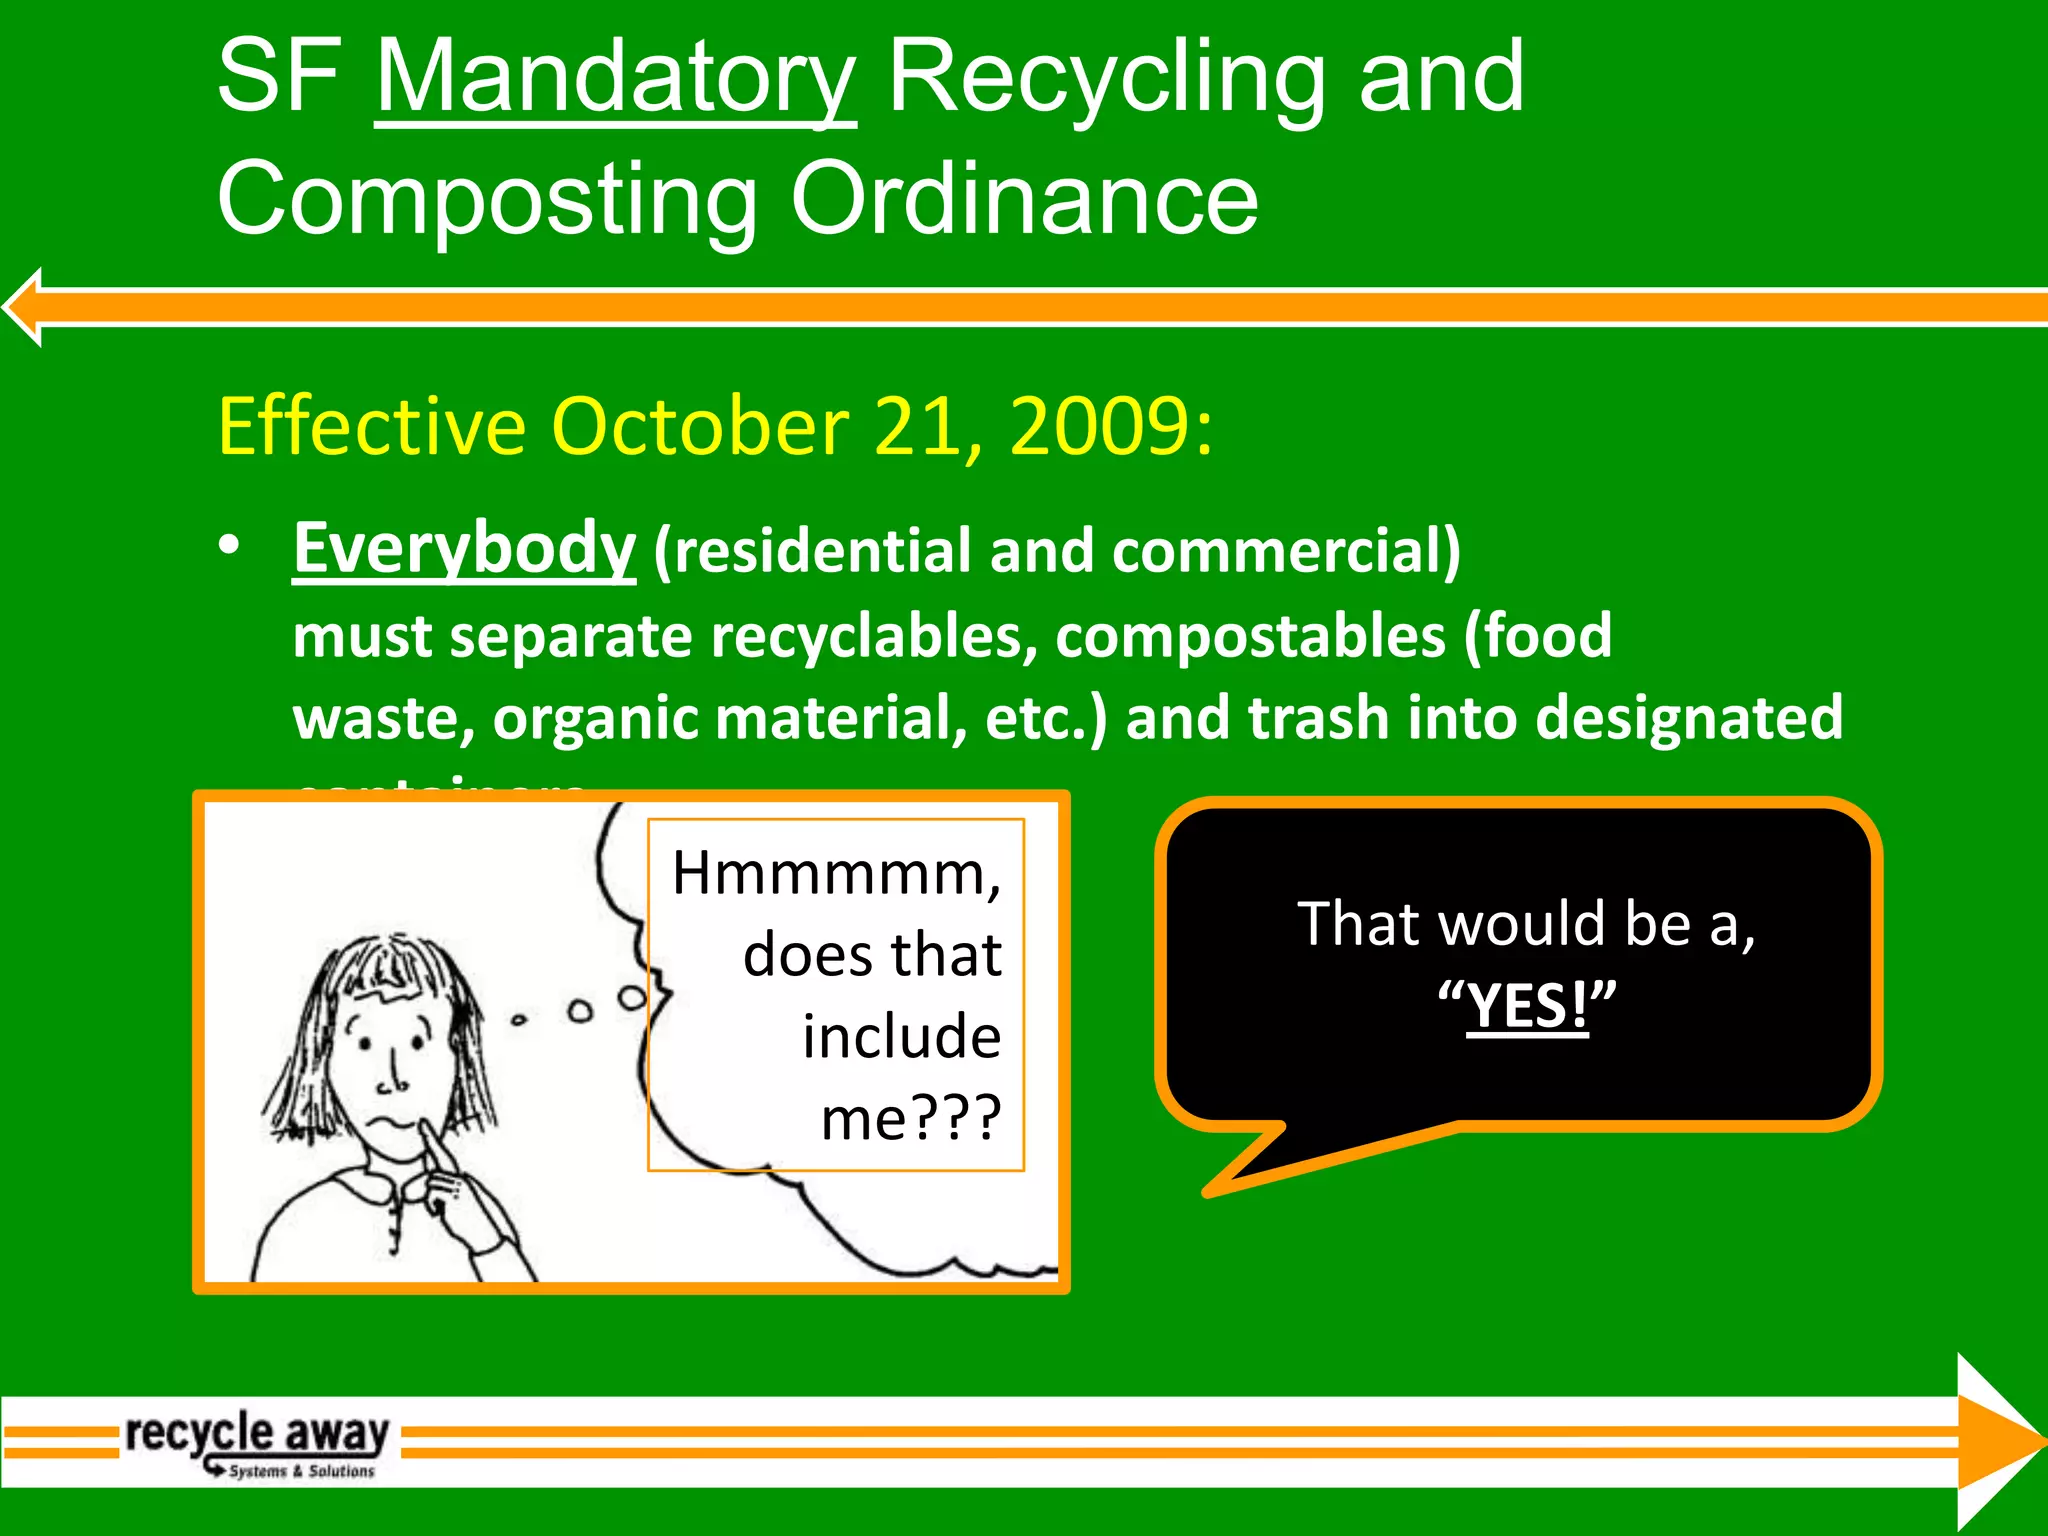
Slicing the Pie: Setting Targets for Zero WasteMichael Alexander, PresidentRecycle AwayMarch 29th, 2011
Materials Currently DisposedRecyclable Paper20%Food Scraps20%Yard Trimmings5%Bottles & Cans5%Compostable Paper10%Construction &Demolition Debris15%Other25%
Materials Management DiamondManagement TechnologiesMaterials/Generatorsscraps yard, steel & paper millspre-consumer materials, scrap metal, printer scrapstandard curbside bins, no automated collectionbottles, cans & newspapers,yard waste from homeslarger single stream bins, automated collection vehicles , business systemsrecyclables from non-participating homes, businesses, and public spacesgrinders, land spreaders, anaerobic digesters, food scraps,  textiles,C&D debrismulti-material/composite packaging & productsNext generation of conversion technologiespersonal hygiene products & highly contaminated materialslandfilling
Key Strategies – Getting to 50% DiversionSource:  Eco-Cycle
Key Strategies – Getting to 50% DiversionUniversal curbside recycling and composting collectionsYard Waste drop‐off centersSource:  Eco-Cycle
Key Strategies – Getting to 50% DiversionUniversal curbside recycling and composting collectionsYard Waste drop‐off centersPay‐As‐You‐Throw (PAYT) pricing structureSingle largest incentive to increase recyclingSource:  Eco-Cycle
PAYT Pricing Sends a Clear MessageWorcester, MAPopulation 173,000San Francisco, CAPopulation 775,000Unit based pricing is just a different way of paying for waste Source:  Kristen Brown, Green Waste Solutions, www.thewastesolution.com
Worcester, MA:  PAYT ResultsSource:  Kristen Brown, Green Waste Solutions, www.thewastesolution.com
Overall Waste GenerationDecrease + 20%Source:  Kristen Brown, Green Waste Solutions, www.thewastesolution.com
Key Strategies – Getting to 50% DiversionUniversal curbside recycling and composting collectionsYard Waste drop‐off centersPay‐As‐You‐Throw pricing structure		single largest incentive to increase recyclingMinimum 25% C&D recovery 		Incorporate recycling requirements and        deconstruction into green building codesSource:  Eco-Cycle
Key Strategies – Getting to 50% DiversionUniversal curbside recycling and composting collectionsYard Waste drop‐off centersPay‐As‐You‐Throw pricing structure		single largest incentive to increase recyclingMinimum 25% C&D recovery 		Incorporate recycling requirements and        deconstruction into green building codesEducationSource:  Eco-Cycle
Key Strategies – Getting to 70% DiversionSource:  Eco-Cycle
Mandatory recycling and composting at all homes and businessesKey Strategies – Getting to 70% DiversionSource:  Eco-Cycle
US Curbside Residential Food Scrap Collection Programs14Source:  SWANA, 2008
15US Curbside Residential Food Scrap Collection ProgramsSource:  SWANA, 2008
Key Strategies – Getting to 70% DiversionMandatory recycling and composting at all homes and businessesReduce trash service frequency to every other weekSource:  Eco-Cycle
Advantages to Every Other Week Trash CollectionOrganics collected weekly	-minimizes odors	-incentivizes people to use composting Recycling and trash alternate every other week	-Saves $2.50 ‐$3.75 per household per month off the  costs of collection trash, which helps offset processing  and collection costs for organics	-Toronto: biweekly; Arcata, CA: up to monthly;  Boulder, CO: on‐call bag option Source:  Eco-Cycle
Key Strategies – Getting to 70% DiversionMandatory recycling and composting at all homes and businessesReduce trash service frequency to every other weekFinish building the local Zero Waste Infrastructure	-  Create local CHaRM (Hard‐To‐Recycle Center)	-  Create local Reuse for used building materials (UBM’s)	-  Promote local “reuse retail” businesses    (thrift and repair)Source:  Eco-Cycle
Key Strategies for 90% DiversionSource:  Eco-Cycle
Key Strategies – Getting to 90% DiversionMandatory participation across all sectors	-Business, residential, industrial, C&D, multi‐family units	-San Francisco could be at 90% today with full participationProducer Responsibility (EPR) policies change our world	-Industry phases out toxic products to increase recovery potential	-Industry funds collection of hard‐to‐recycle products and packaging	-Industry rewarded for design‐for‐recovery Developing (local) markets for everything discarded 	-85% of materials have a market today…keep going !!Education, education, educationSource:  Eco-Cycle
State Goals Beyond 70%Washington:  80% by 2020
Florida:  75% by 2020
Minnesota:  75% by 2025
Massachusetts:  70% by 2010
California:   37 communities above 70%; (San Francisco  72%)Source:  Eco-Cycle
State Strategies to Maximize RecyclingEstablish Aggressive GoalsEnact Disposal Bans Expand Bottle BillsBuild Local Recycling Capacity BuildingModernize the Infrastructure Introduce Product Stewardship LegislationExpand Market DevelopmentProvide Local Government Funding
Communities on the Front-Lines of the Zero Waste MovementAustin, TX Alaminos City, PhilippinesCanberra, AustraliaNew Zealand – with over 66% of NZ CitiesBuenos Aires, ArgentinaSeattle, WABoulder, COCentral Vermont Waste Mgt. District, VTSan Luis Obispo, CAFresno, CASan Francisco, CADel Norte County CAOakland, CASanta Cruz County, CABerkeley, CAPalo Alto, CAMarin CountyLos Angeles, CAChicago, IL Halifax, Nova ScotiaToronto, OntarioNelson, British Columbia and other Regional Districts Source: www.zwia.org
San Francisco’s Waste Diversion & Zero Waste Goals199010% Diversion
19902000CA State Mandate with PenaltiesSan Francisco’s Waste Diversion & Zero Waste Goals
San Francisco’s Waste Diversion & Zero Waste Goals199020002005>50% Diversion
1990200020052007>72% Diversion(Including C&D)San Francisco’s Waste Diversion & Zero Waste Goals
San Francisco’s Waste Diversion & Zero Waste Goals20092005200720001990-  Ban on    Styrofoam &    Plastic Bags -  Mandatory    Participation   in Recycling,      C&D, &    Composting
San Francisco’s Waste Diversion & Zero Waste Goals2010Goal 75%  Landfill Diversion19902000200520072009
San Francisco’s Waste Diversion & Zero Waste Goals1990200020052007200920102020Zero Waste Diverted to Landfill or Incinerator
3 Stream Collection Programs for Residents and Businesses
Easy to Understand Program & Outreach
Food Service/Event Signage
Designed for Easy ParticipationKitchen PailLabeled LidsWheeled CartPhoto Courtesy of City of San Francisco
Recology’sJepsen Prairie Organics Regional Composting FacilityCourtesy of City of San Francisco
SF Mandatory Recycling and Composting OrdinanceEffective October 21, 2009:Everybody(residential and commercial)must separate recyclables, compostables(food waste, organic material, etc.) and trash into designated containers Hmmmmm, does that include me???That would be a, “YES!”
SF Mandatory Recycling and Composting OrdinanceEffective October 21, 2009:Everybody (residential and commercial)must separate recyclables, compostables(food waste, organic material, etc.) and trash into designated containers Property managers must provide program for tenants, contractors/janitors with appropriate color-coded containers, signage and education/training

Materials #1: What's In Your Trash (Michael Alexander)

  • 1.
    Slicing the Pie:Setting Targets for Zero WasteMichael Alexander, PresidentRecycle AwayMarch 29th, 2011
  • 2.
    Materials Currently DisposedRecyclablePaper20%Food Scraps20%Yard Trimmings5%Bottles & Cans5%Compostable Paper10%Construction &Demolition Debris15%Other25%
  • 3.
    Materials Management DiamondManagementTechnologiesMaterials/Generatorsscraps yard, steel & paper millspre-consumer materials, scrap metal, printer scrapstandard curbside bins, no automated collectionbottles, cans & newspapers,yard waste from homeslarger single stream bins, automated collection vehicles , business systemsrecyclables from non-participating homes, businesses, and public spacesgrinders, land spreaders, anaerobic digesters, food scraps, textiles,C&D debrismulti-material/composite packaging & productsNext generation of conversion technologiespersonal hygiene products & highly contaminated materialslandfilling
  • 4.
    Key Strategies –Getting to 50% DiversionSource: Eco-Cycle
  • 5.
    Key Strategies –Getting to 50% DiversionUniversal curbside recycling and composting collectionsYard Waste drop‐off centersSource: Eco-Cycle
  • 6.
    Key Strategies –Getting to 50% DiversionUniversal curbside recycling and composting collectionsYard Waste drop‐off centersPay‐As‐You‐Throw (PAYT) pricing structureSingle largest incentive to increase recyclingSource: Eco-Cycle
  • 7.
    PAYT Pricing Sendsa Clear MessageWorcester, MAPopulation 173,000San Francisco, CAPopulation 775,000Unit based pricing is just a different way of paying for waste Source: Kristen Brown, Green Waste Solutions, www.thewastesolution.com
  • 8.
    Worcester, MA: PAYT ResultsSource: Kristen Brown, Green Waste Solutions, www.thewastesolution.com
  • 9.
    Overall Waste GenerationDecrease+ 20%Source: Kristen Brown, Green Waste Solutions, www.thewastesolution.com
  • 10.
    Key Strategies –Getting to 50% DiversionUniversal curbside recycling and composting collectionsYard Waste drop‐off centersPay‐As‐You‐Throw pricing structure single largest incentive to increase recyclingMinimum 25% C&D recovery Incorporate recycling requirements and deconstruction into green building codesSource: Eco-Cycle
  • 11.
    Key Strategies –Getting to 50% DiversionUniversal curbside recycling and composting collectionsYard Waste drop‐off centersPay‐As‐You‐Throw pricing structure single largest incentive to increase recyclingMinimum 25% C&D recovery Incorporate recycling requirements and deconstruction into green building codesEducationSource: Eco-Cycle
  • 12.
    Key Strategies –Getting to 70% DiversionSource: Eco-Cycle
  • 13.
    Mandatory recycling andcomposting at all homes and businessesKey Strategies – Getting to 70% DiversionSource: Eco-Cycle
  • 14.
    US Curbside ResidentialFood Scrap Collection Programs14Source: SWANA, 2008
  • 15.
    15US Curbside ResidentialFood Scrap Collection ProgramsSource: SWANA, 2008
  • 16.
    Key Strategies –Getting to 70% DiversionMandatory recycling and composting at all homes and businessesReduce trash service frequency to every other weekSource: Eco-Cycle
  • 17.
    Advantages to EveryOther Week Trash CollectionOrganics collected weekly -minimizes odors -incentivizes people to use composting Recycling and trash alternate every other week -Saves $2.50 ‐$3.75 per household per month off the costs of collection trash, which helps offset processing and collection costs for organics -Toronto: biweekly; Arcata, CA: up to monthly; Boulder, CO: on‐call bag option Source: Eco-Cycle
  • 18.
    Key Strategies –Getting to 70% DiversionMandatory recycling and composting at all homes and businessesReduce trash service frequency to every other weekFinish building the local Zero Waste Infrastructure - Create local CHaRM (Hard‐To‐Recycle Center) - Create local Reuse for used building materials (UBM’s) - Promote local “reuse retail” businesses (thrift and repair)Source: Eco-Cycle
  • 19.
    Key Strategies for90% DiversionSource: Eco-Cycle
  • 20.
    Key Strategies –Getting to 90% DiversionMandatory participation across all sectors -Business, residential, industrial, C&D, multi‐family units -San Francisco could be at 90% today with full participationProducer Responsibility (EPR) policies change our world -Industry phases out toxic products to increase recovery potential -Industry funds collection of hard‐to‐recycle products and packaging -Industry rewarded for design‐for‐recovery Developing (local) markets for everything discarded -85% of materials have a market today…keep going !!Education, education, educationSource: Eco-Cycle
  • 21.
    State Goals Beyond70%Washington: 80% by 2020
  • 22.
  • 23.
  • 24.
  • 25.
    California: 37 communities above 70%; (San Francisco 72%)Source: Eco-Cycle
  • 26.
    State Strategies toMaximize RecyclingEstablish Aggressive GoalsEnact Disposal Bans Expand Bottle BillsBuild Local Recycling Capacity BuildingModernize the Infrastructure Introduce Product Stewardship LegislationExpand Market DevelopmentProvide Local Government Funding
  • 27.
    Communities on theFront-Lines of the Zero Waste MovementAustin, TX Alaminos City, PhilippinesCanberra, AustraliaNew Zealand – with over 66% of NZ CitiesBuenos Aires, ArgentinaSeattle, WABoulder, COCentral Vermont Waste Mgt. District, VTSan Luis Obispo, CAFresno, CASan Francisco, CADel Norte County CAOakland, CASanta Cruz County, CABerkeley, CAPalo Alto, CAMarin CountyLos Angeles, CAChicago, IL Halifax, Nova ScotiaToronto, OntarioNelson, British Columbia and other Regional Districts Source: www.zwia.org
  • 28.
    San Francisco’s WasteDiversion & Zero Waste Goals199010% Diversion
  • 29.
    19902000CA State Mandatewith PenaltiesSan Francisco’s Waste Diversion & Zero Waste Goals
  • 30.
    San Francisco’s WasteDiversion & Zero Waste Goals199020002005>50% Diversion
  • 31.
    1990200020052007>72% Diversion(Including C&D)SanFrancisco’s Waste Diversion & Zero Waste Goals
  • 32.
    San Francisco’s WasteDiversion & Zero Waste Goals20092005200720001990- Ban on Styrofoam & Plastic Bags - Mandatory Participation in Recycling, C&D, & Composting
  • 33.
    San Francisco’s WasteDiversion & Zero Waste Goals2010Goal 75% Landfill Diversion19902000200520072009
  • 34.
    San Francisco’s WasteDiversion & Zero Waste Goals1990200020052007200920102020Zero Waste Diverted to Landfill or Incinerator
  • 35.
    3 Stream CollectionPrograms for Residents and Businesses
  • 36.
    Easy to UnderstandProgram & Outreach
  • 37.
  • 38.
    Designed for EasyParticipationKitchen PailLabeled LidsWheeled CartPhoto Courtesy of City of San Francisco
  • 40.
    Recology’sJepsen Prairie OrganicsRegional Composting FacilityCourtesy of City of San Francisco
  • 41.
    SF Mandatory Recyclingand Composting OrdinanceEffective October 21, 2009:Everybody(residential and commercial)must separate recyclables, compostables(food waste, organic material, etc.) and trash into designated containers Hmmmmm, does that include me???That would be a, “YES!”
  • 42.
    SF Mandatory Recyclingand Composting OrdinanceEffective October 21, 2009:Everybody (residential and commercial)must separate recyclables, compostables(food waste, organic material, etc.) and trash into designated containers Property managers must provide program for tenants, contractors/janitors with appropriate color-coded containers, signage and education/training
  • 43.
    SF Mandatory Recyclingand Composting OrdinanceEffective October 21, 2009:Everybody (residential and commercial)must separate recyclables, compostables(food waste, organic material, etc.) and trash into designated containers Property managers must provide program for tenants, contractors/janitors with appropriate color-coded containers, signage and education/trainingPotential fines up to $100 for residents, $1,000 for businesses
  • 44.
    SF Mandatory Recyclingand Composting OrdinanceEffective October 21, 2009:Everybody (residential and commercial)must separate recyclables, compostables(food waste, organic material, etc.) and trash into designated containers Property managers must provide program for tenants, contractors/janitors with appropriate color-coded containers, signage and education/trainingPotential fines up to $100 for residents, $1000 for businessesPressure from ordinance has resulted in 15% increase composting tonnage to nearly 500 tpd and doubling of new composting participation requests
  • 45.
    Lessons & Recommendationsfrom San FranciscoProvide convenient, color coded and easy to use collection programs Conduct extensive outreach and on-site assistance to commercial & multi-tenant customers Mandate participation with threat of finesImprove technologies to reduce environmental impacts and improve/diversify products (i.e. biodiesel or anaerobic digestion)Pursue Extended Producer Responsibility policies
  • 46.
    Michael Alexander, PresidentRecycleAwayBrattleboro, VT 053021-800-664-5340c) 802-579-7432Michael@RecycleAway.comwww.RecycleAway.com 

Editor's Notes

  • #25 50% Diversion by 2000 State Mandate with penalties (CA increased diversion from 10% in 1990 to > 50% in 2005)75% Landfill Diversion by 2010 SF Goal (Achieved 72% diversion for 2007, including C&D)Zero Waste to landfill or incineration by 2020 SF Goal2009 Passed Styrofoam & Plastic Bag Bans and Mandatory C&D, Recycling and Composting Participation
  • #26 50% Diversion by 2000 State Mandate with penalties (CA increased diversion from 10% in 1990 to > 50% in 2005)75% Landfill Diversion by 2010 SF Goal (Achieved 72% diversion for 2007, including C&D)Zero Waste to landfill or incineration by 2020 SF Goal2009 Passed Styrofoam & Plastic Bag Bans and Mandatory C&D, Recycling and Composting Participation
  • #27 50% Diversion by 2000 State Mandate with penalties (CA increased diversion from 10% in 1990 to > 50% in 2005)75% Landfill Diversion by 2010 SF Goal (Achieved 72% diversion for 2007, including C&D)Zero Waste to landfill or incineration by 2020 SF Goal2009 Passed Styrofoam & Plastic Bag Bans and Mandatory C&D, Recycling and Composting Participation
  • #28 50% Diversion by 2000 State Mandate with penalties (CA increased diversion from 10% in 1990 to > 50% in 2005)75% Landfill Diversion by 2010 SF Goal (Achieved 72% diversion for 2007, including C&D)Zero Waste to landfill or incineration by 2020 SF Goal2009 Passed Styrofoam & Plastic Bag Bans and Mandatory C&D, Recycling and Composting Participation
  • #29 50% Diversion by 2000 State Mandate with penalties (CA increased diversion from 10% in 1990 to > 50% in 2005)75% Landfill Diversion by 2010 SF Goal (Achieved 72% diversion for 2007, including C&D)Zero Waste to landfill or incineration by 2020 SF Goal2009 Passed Styrofoam & Plastic Bag Bans and Mandatory C&D, Recycling and Composting Participation
  • #30 50% Diversion by 2000 State Mandate with penalties (CA increased diversion from 10% in 1990 to > 50% in 2005)75% Landfill Diversion by 2010 SF Goal (Achieved 72% diversion for 2007, including C&D)Zero Waste to landfill or incineration by 2020 SF Goal2009 Passed Styrofoam & Plastic Bag Bans and Mandatory C&D, Recycling and Composting Participation
  • #31 50% Diversion by 2000 State Mandate with penalties (CA increased diversion from 10% in 1990 to > 50% in 2005)75% Landfill Diversion by 2010 SF Goal (Achieved 72% diversion for 2007, including C&D)Zero Waste to landfill or incineration by 2020 SF Goal2009 Passed Styrofoam & Plastic Bag Bans and Mandatory C&D, Recycling and Composting Participation