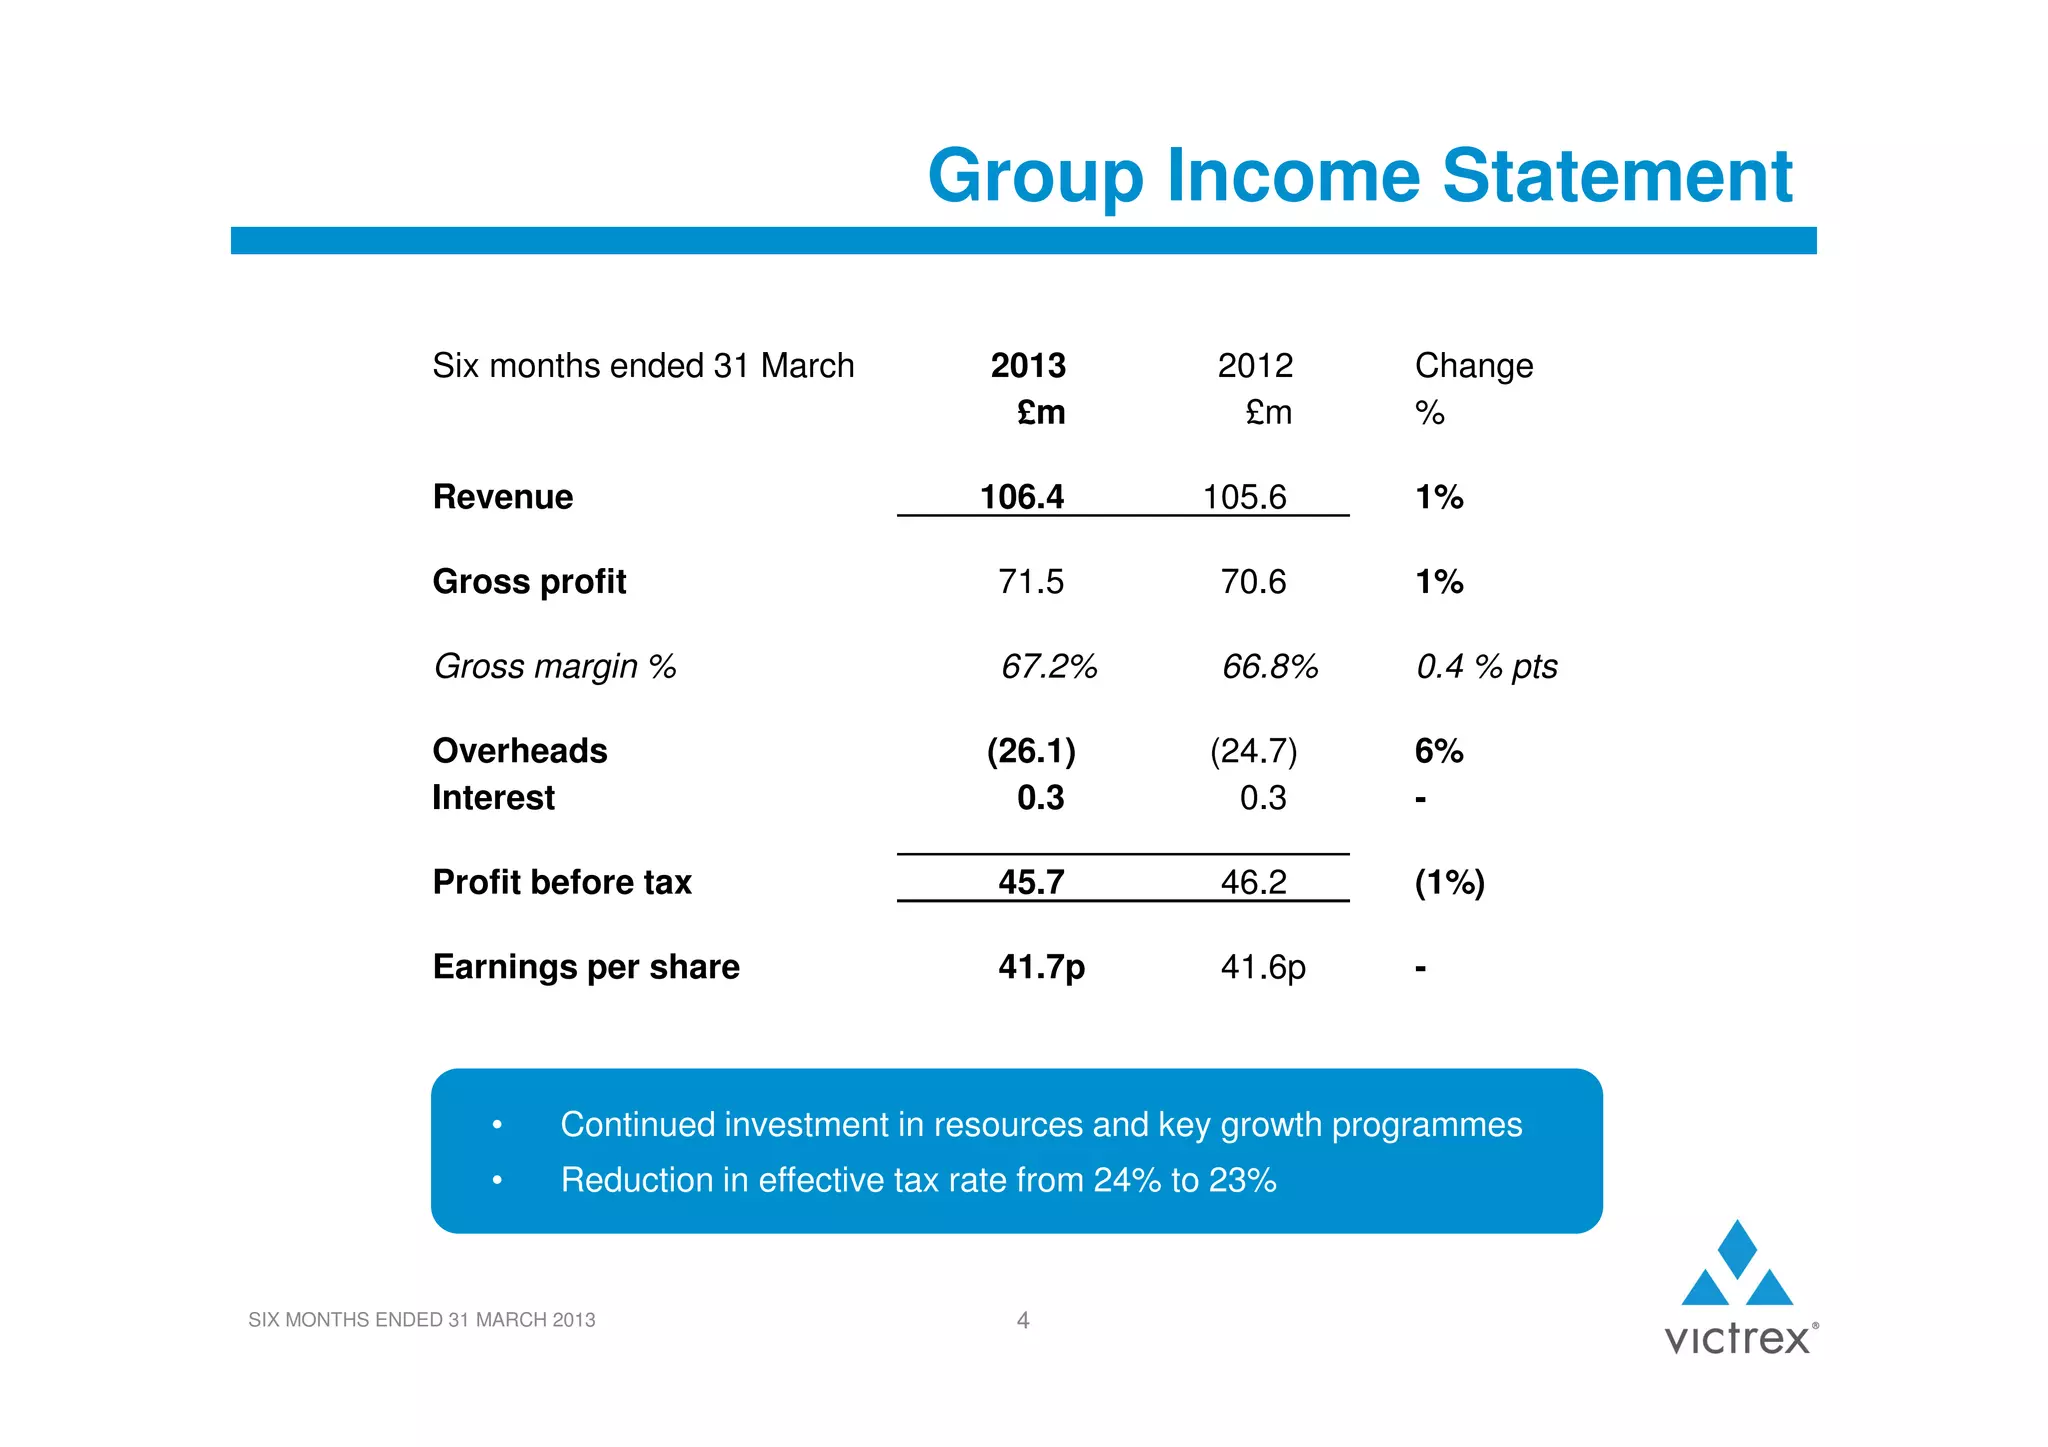
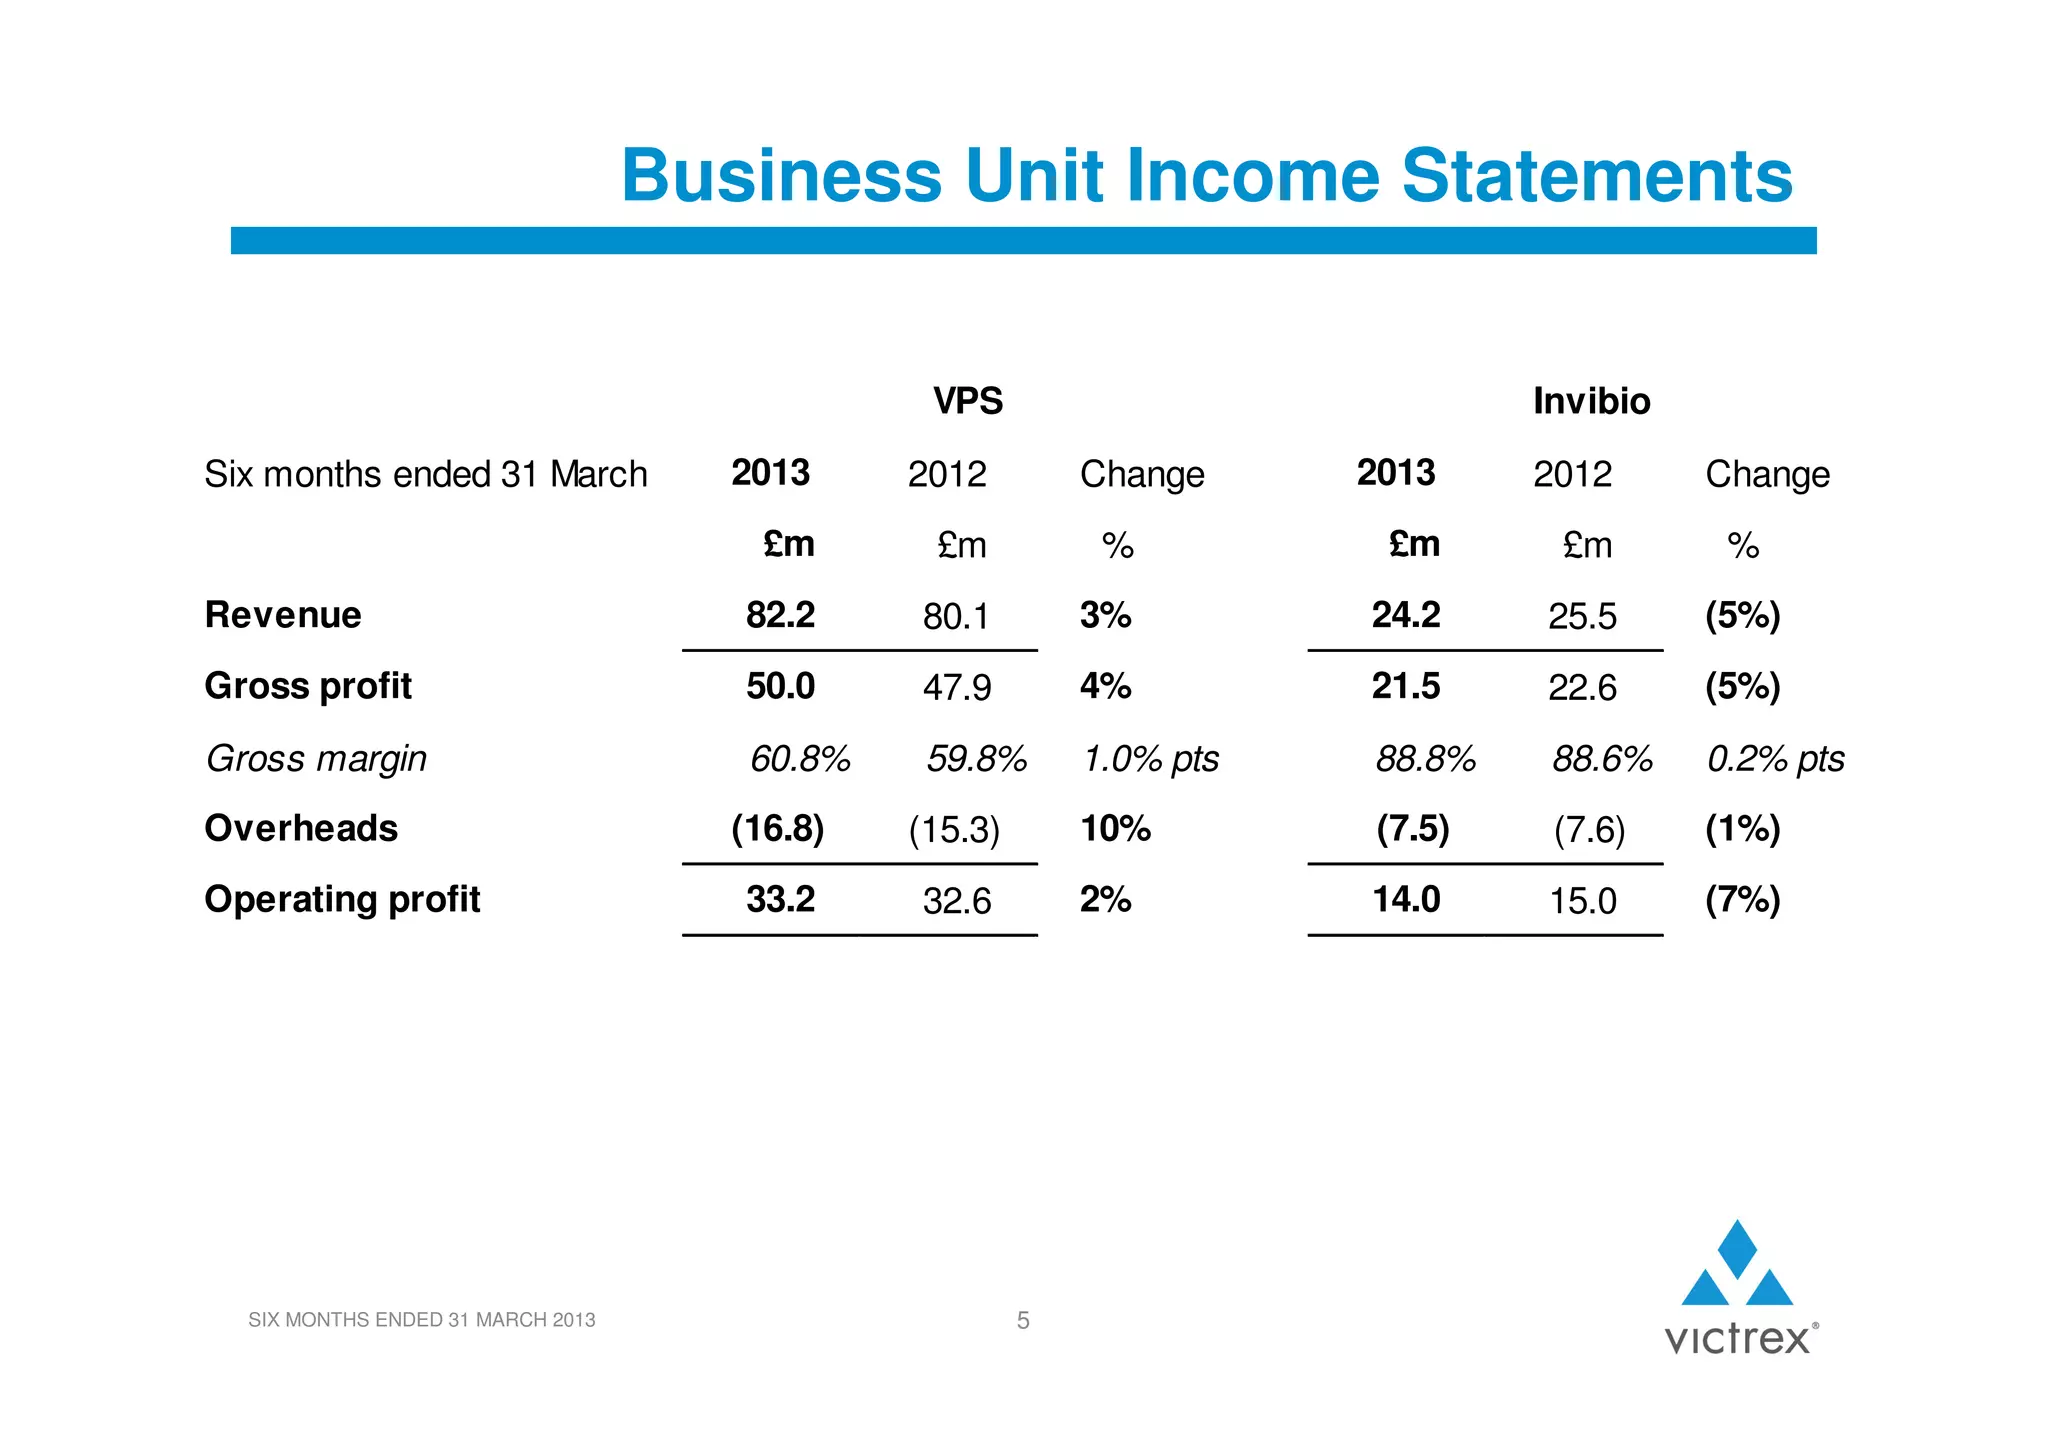
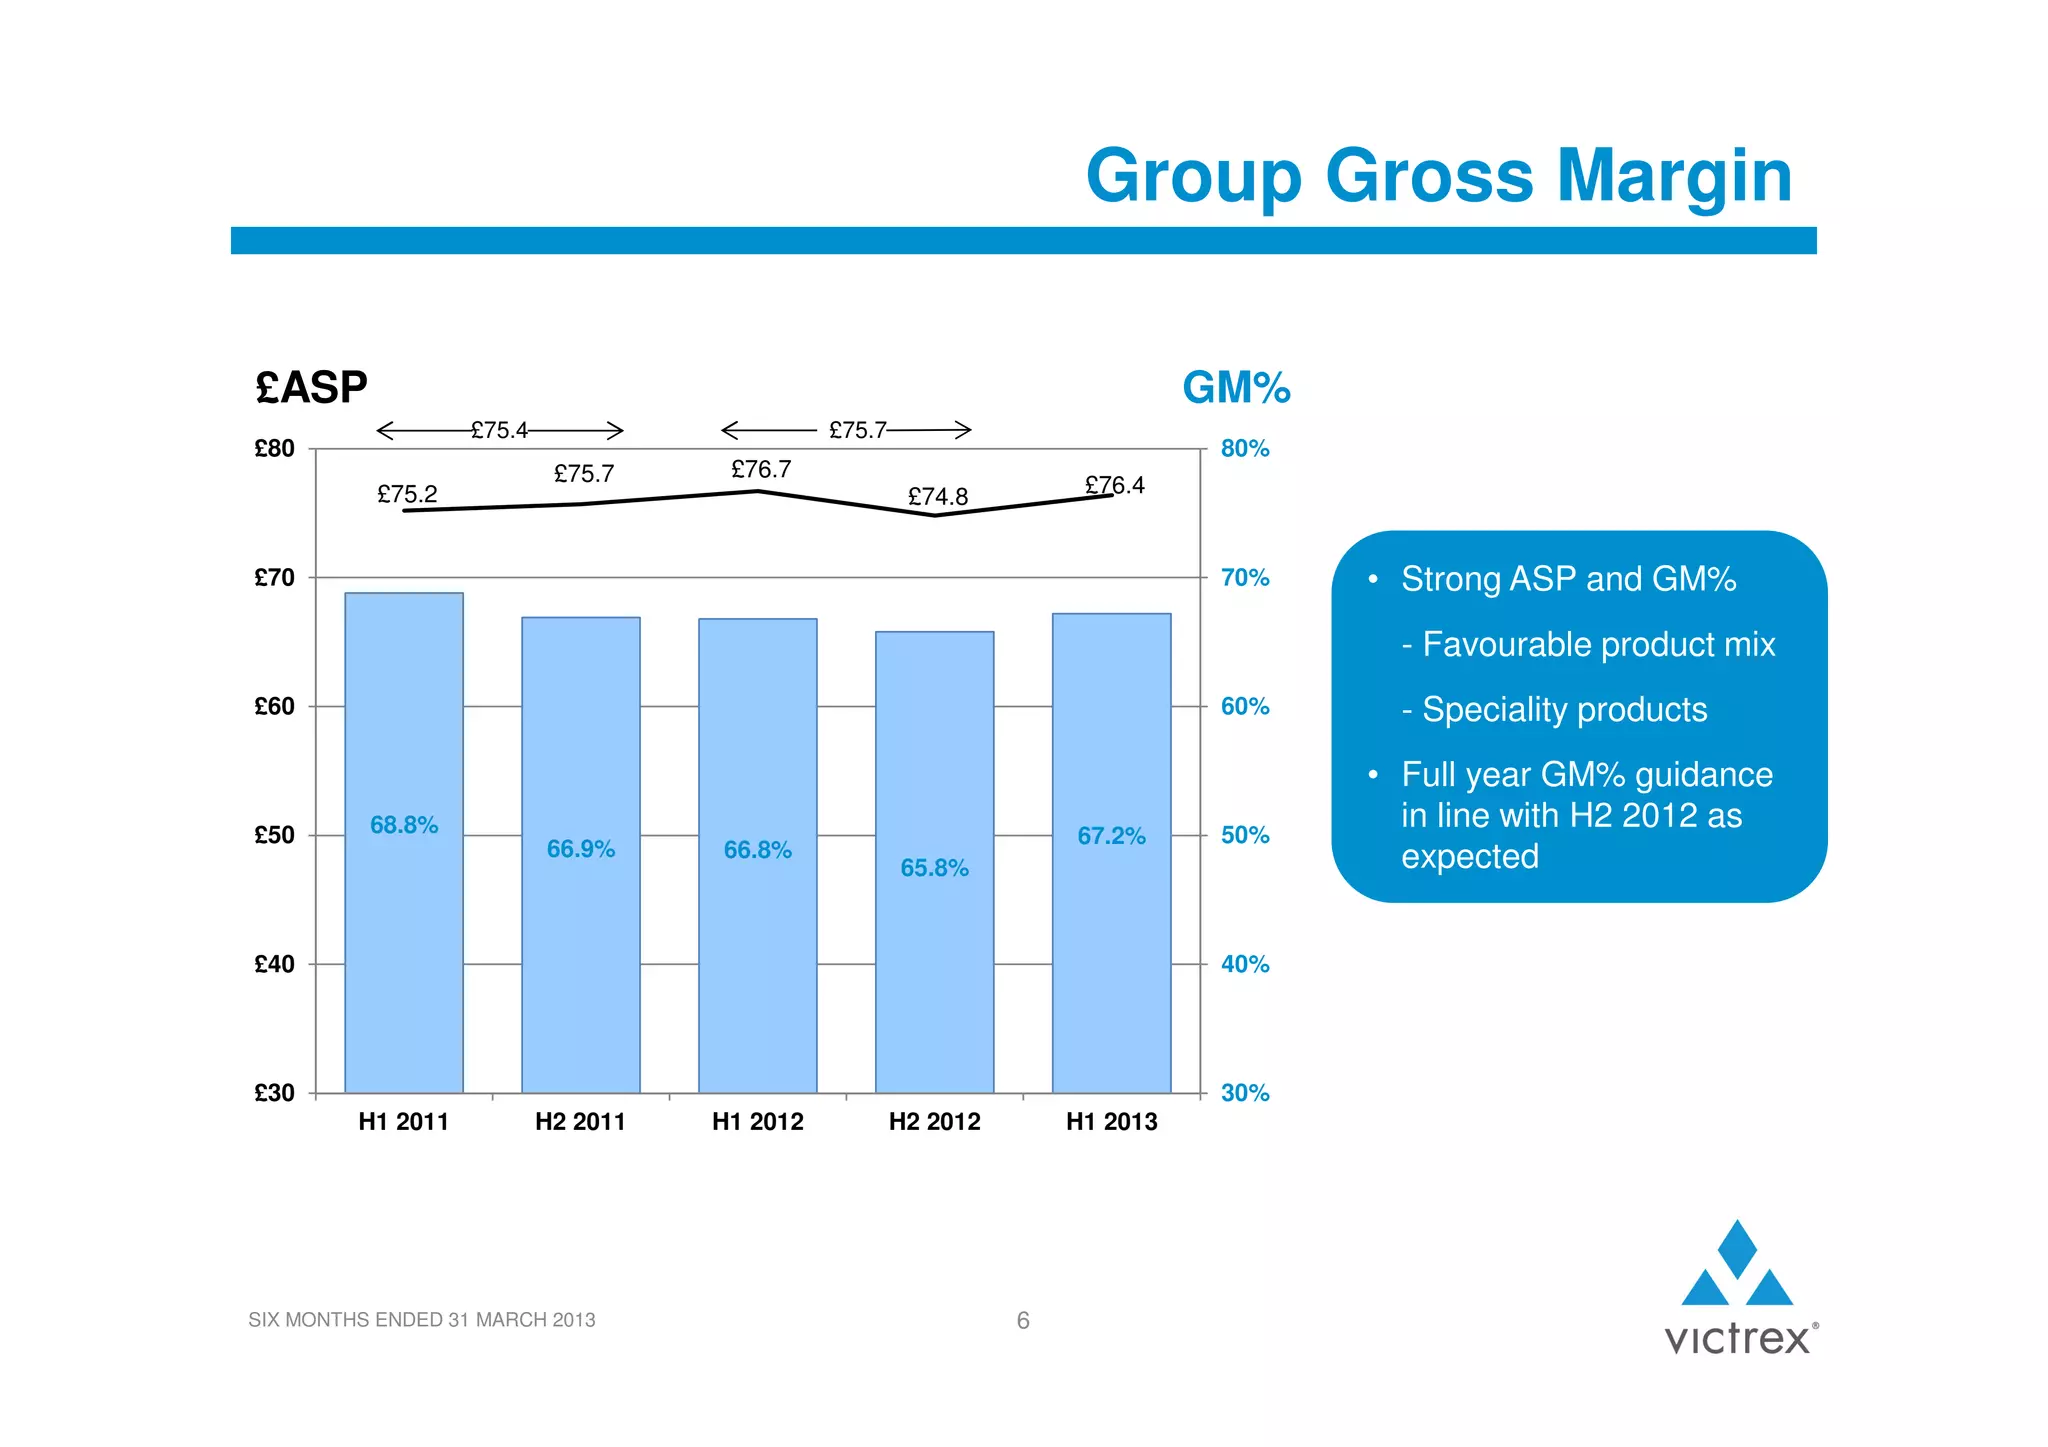
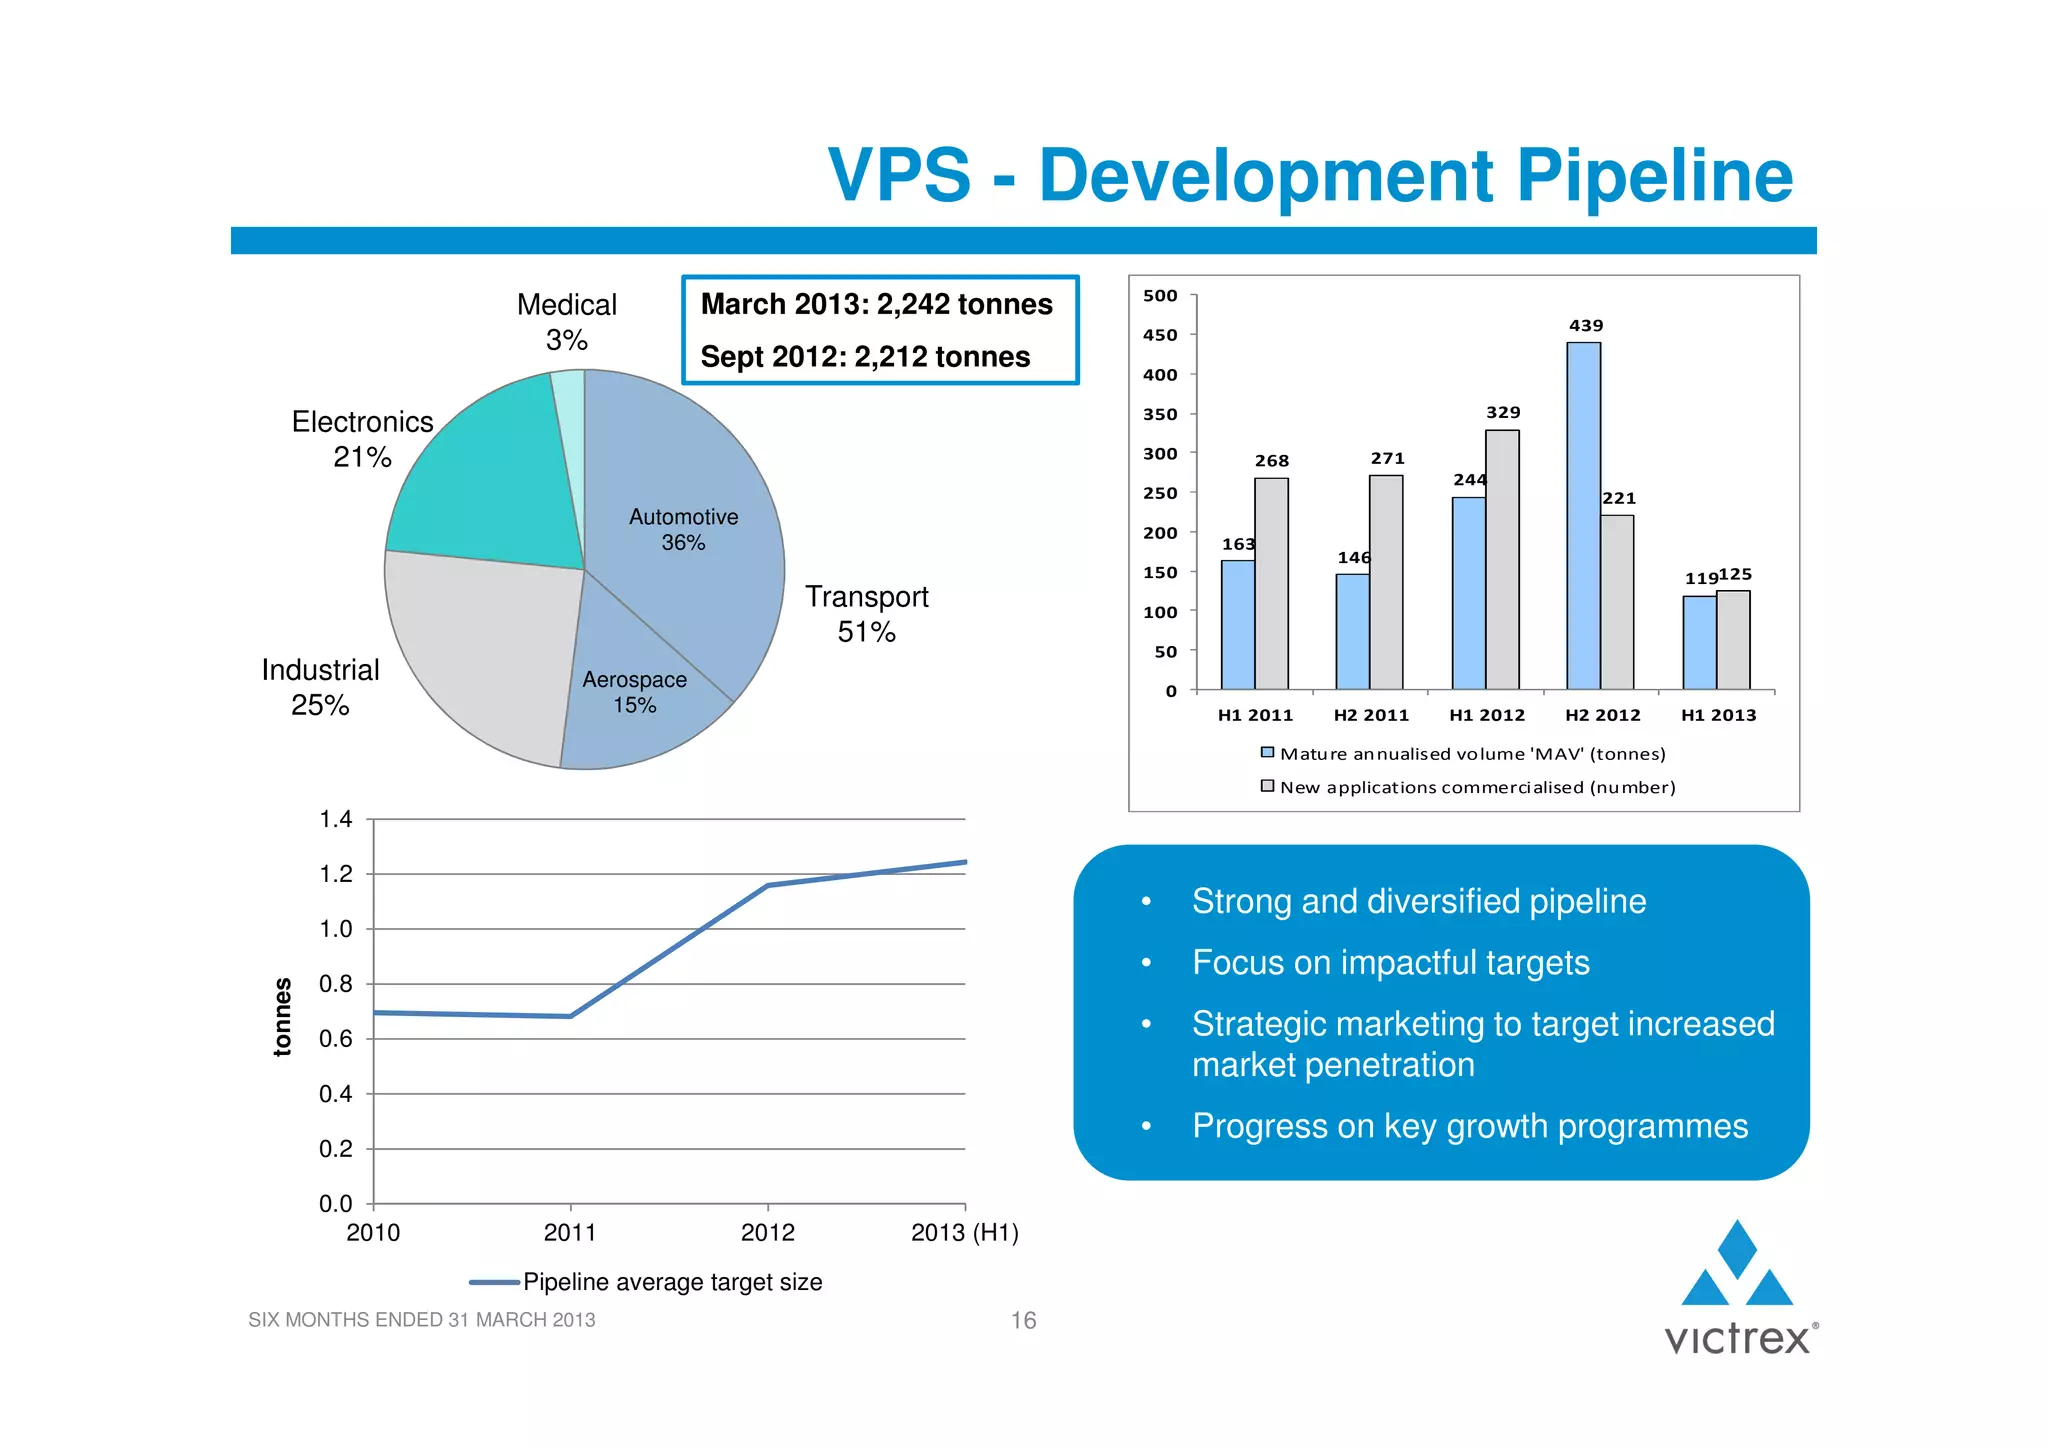
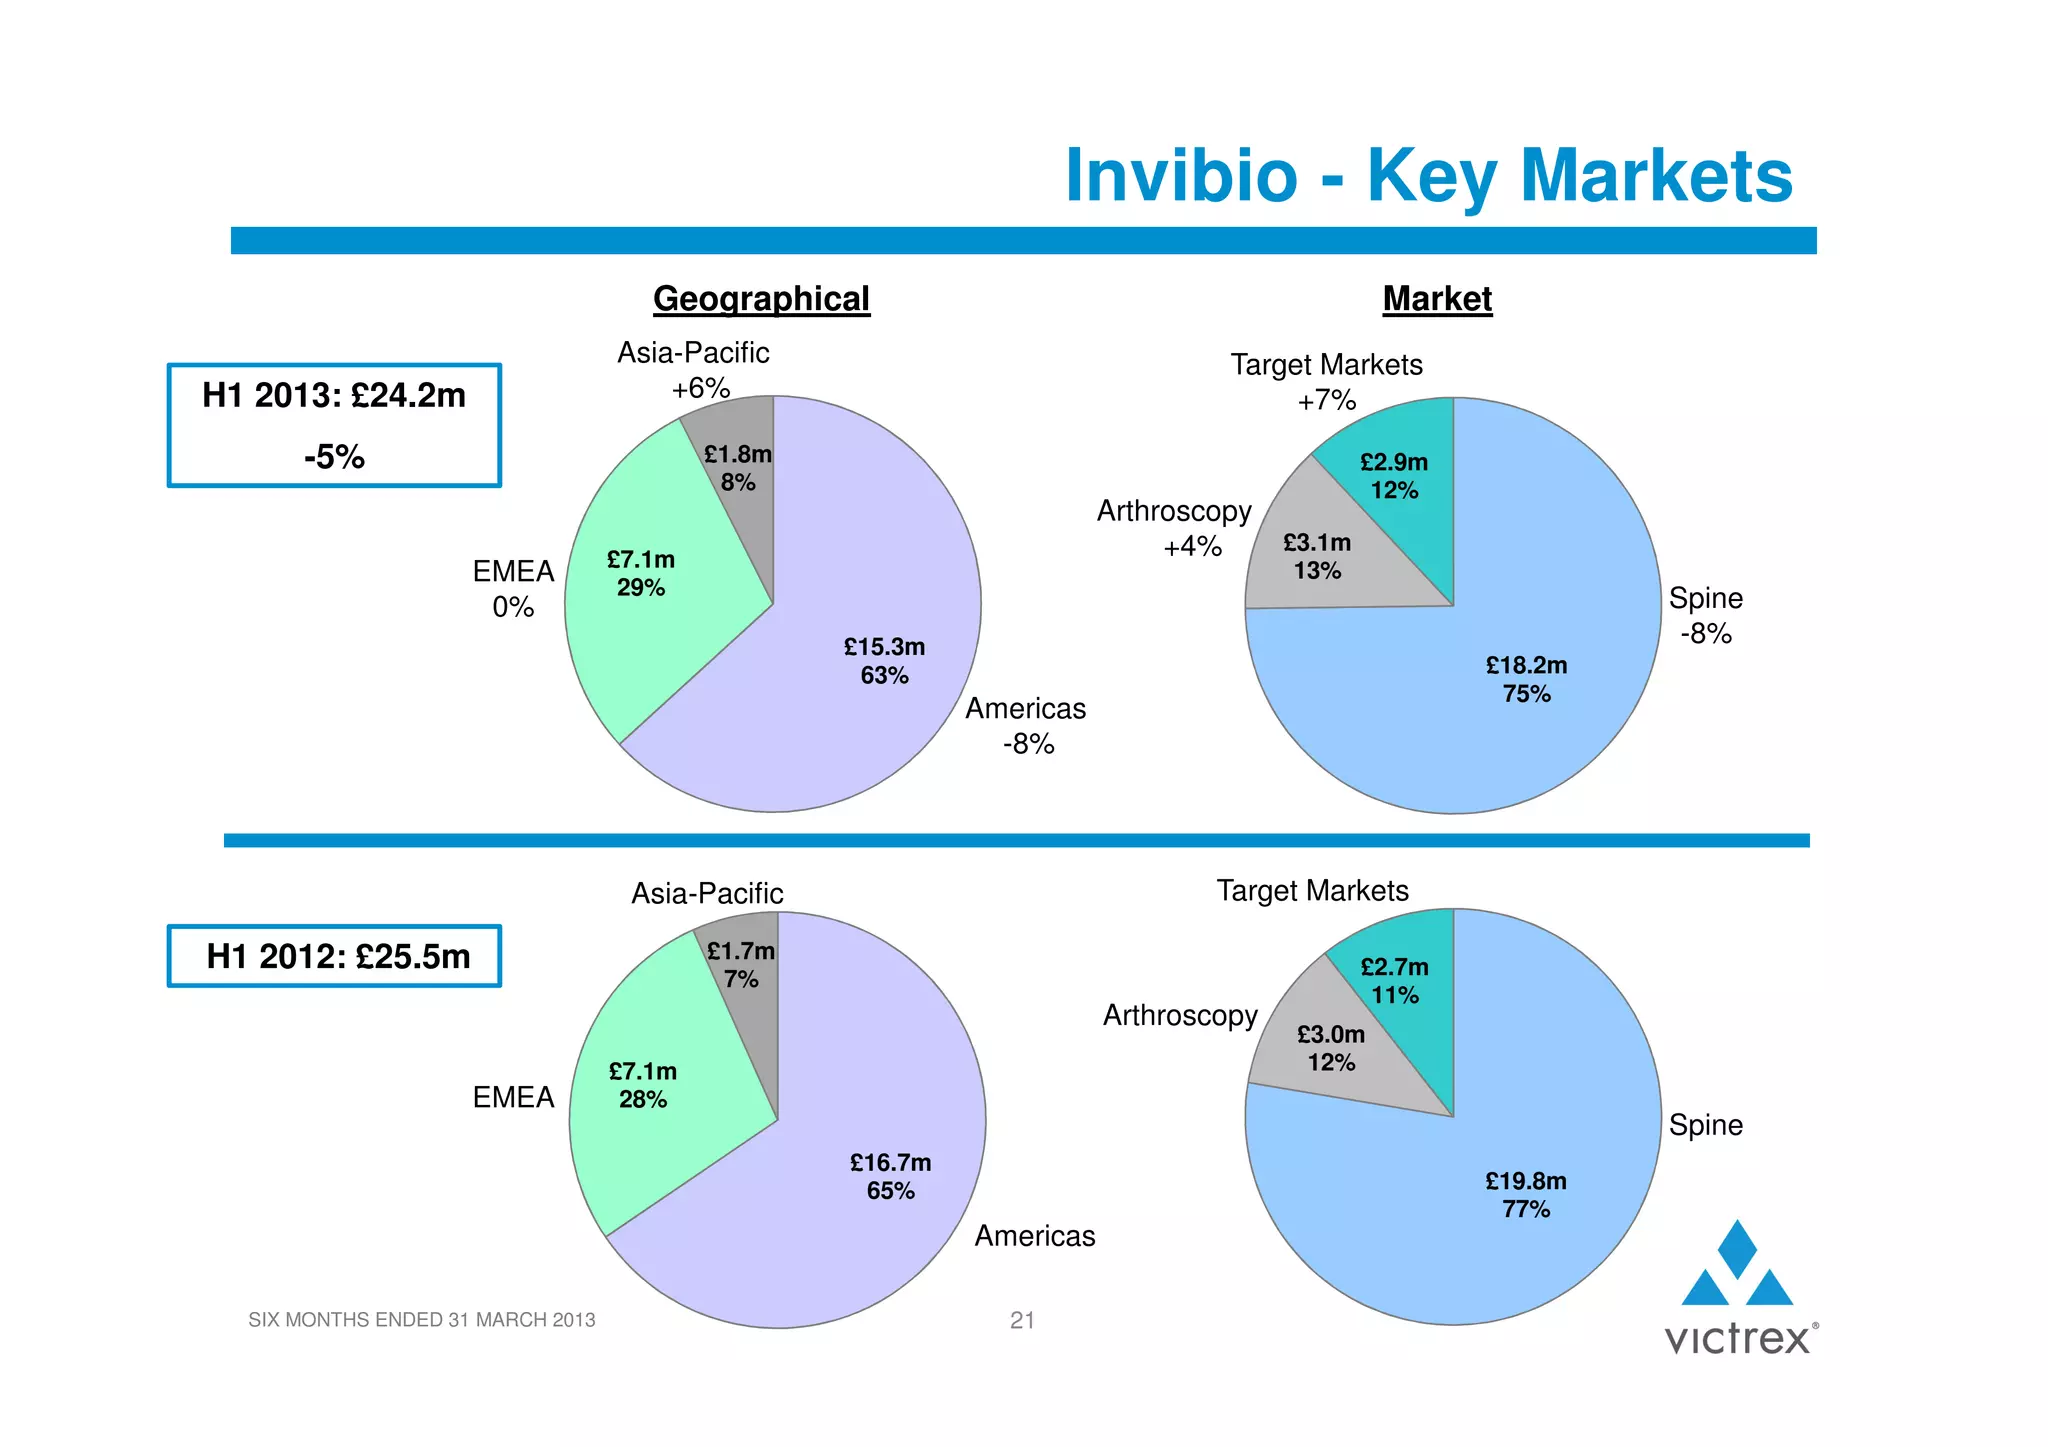
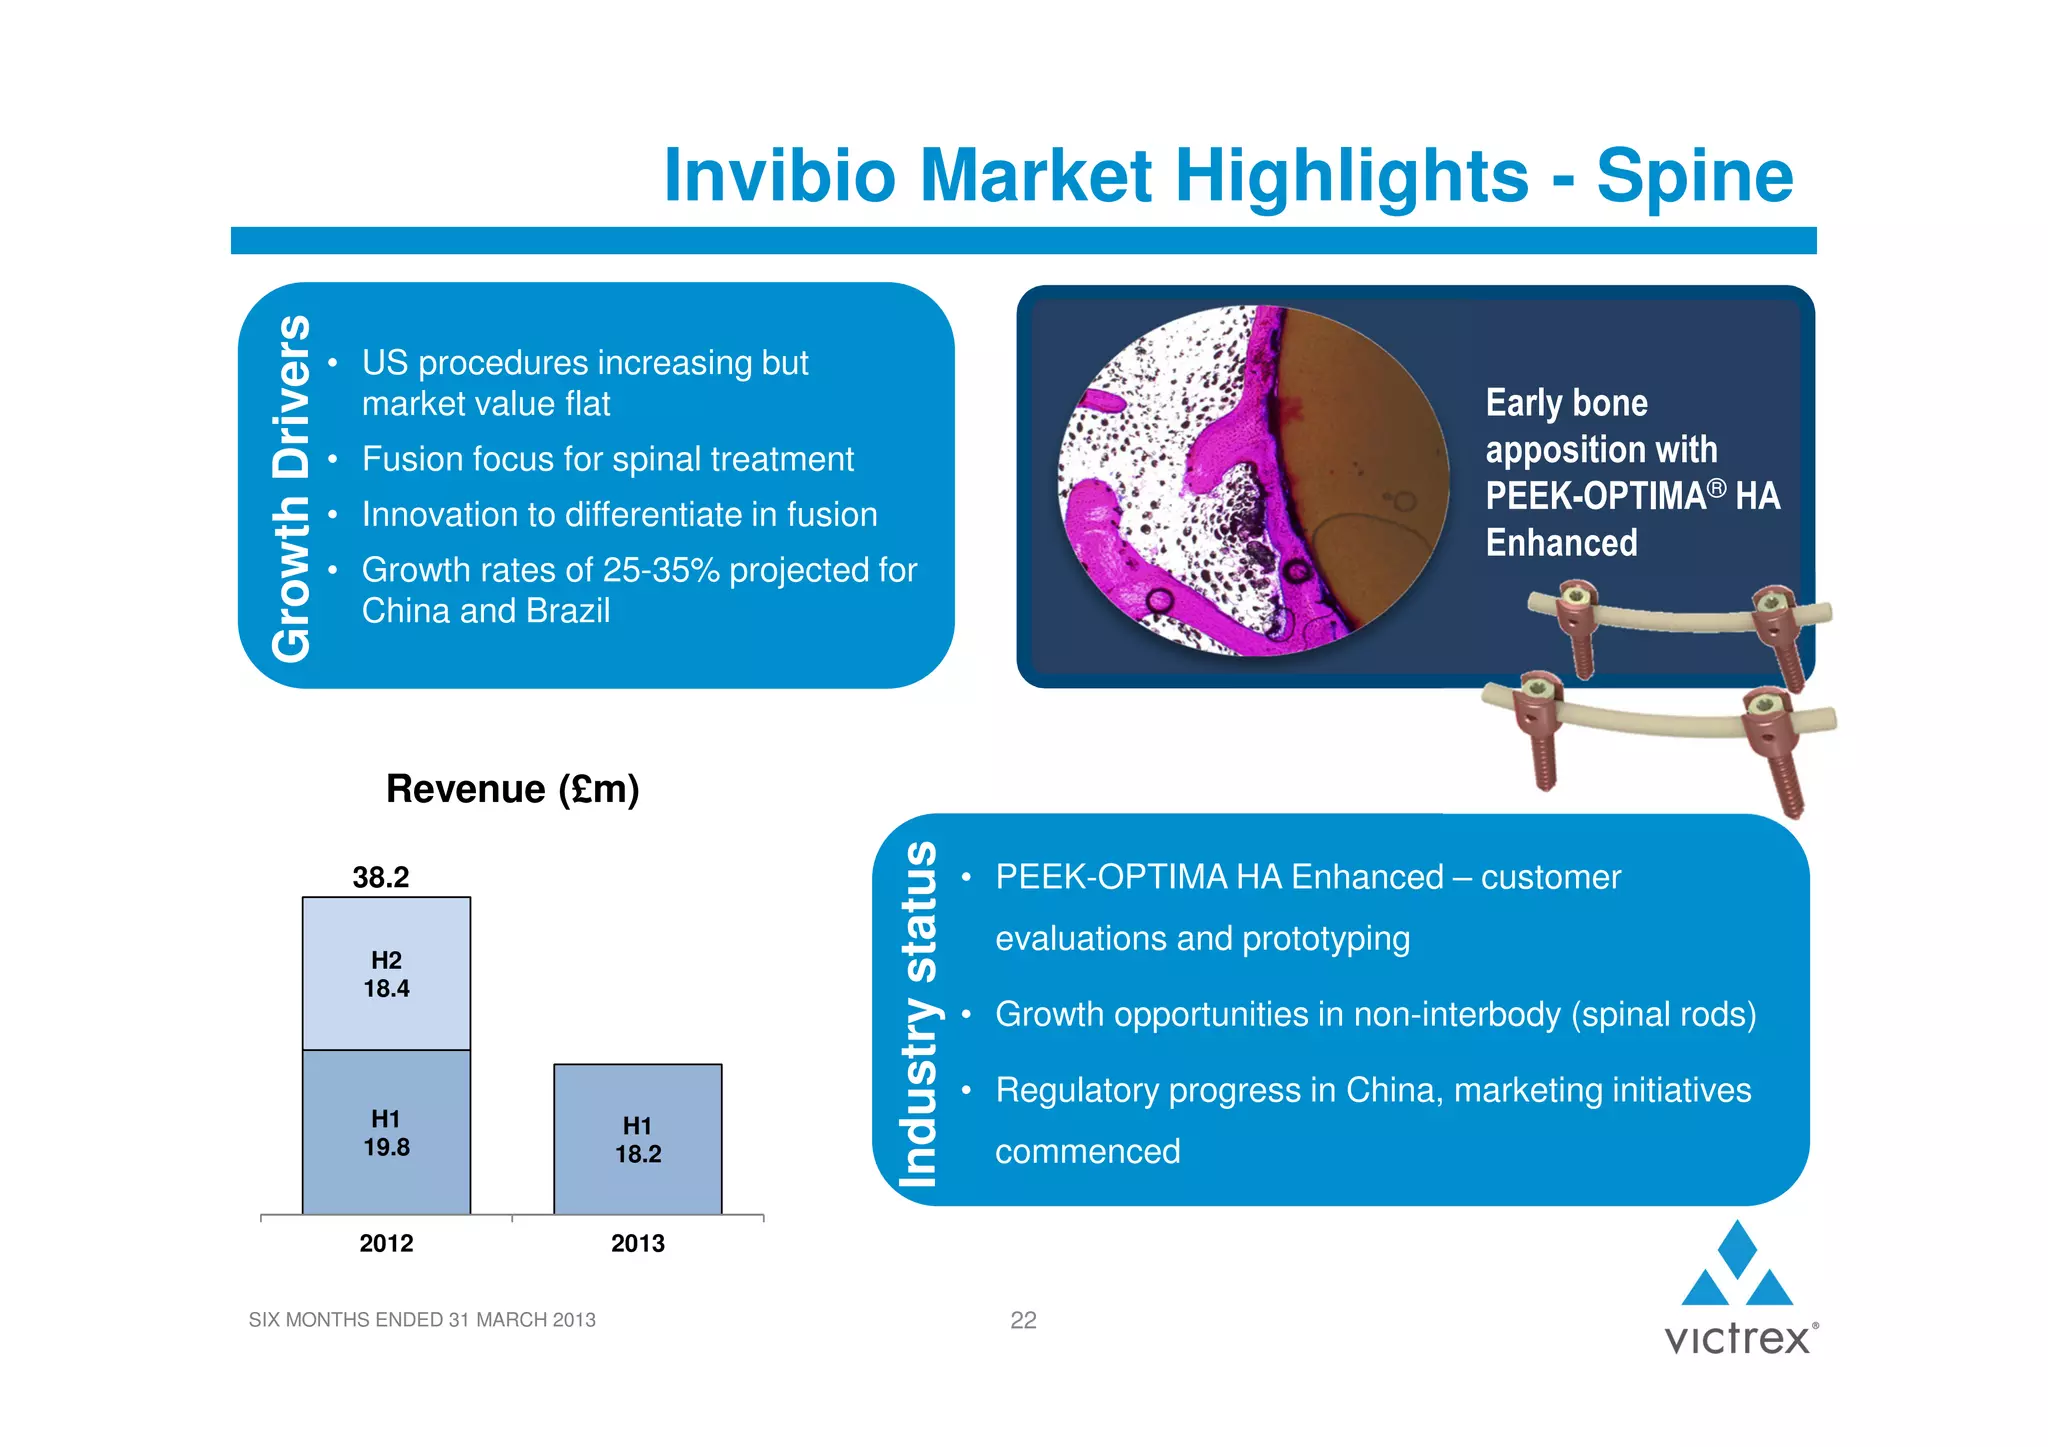
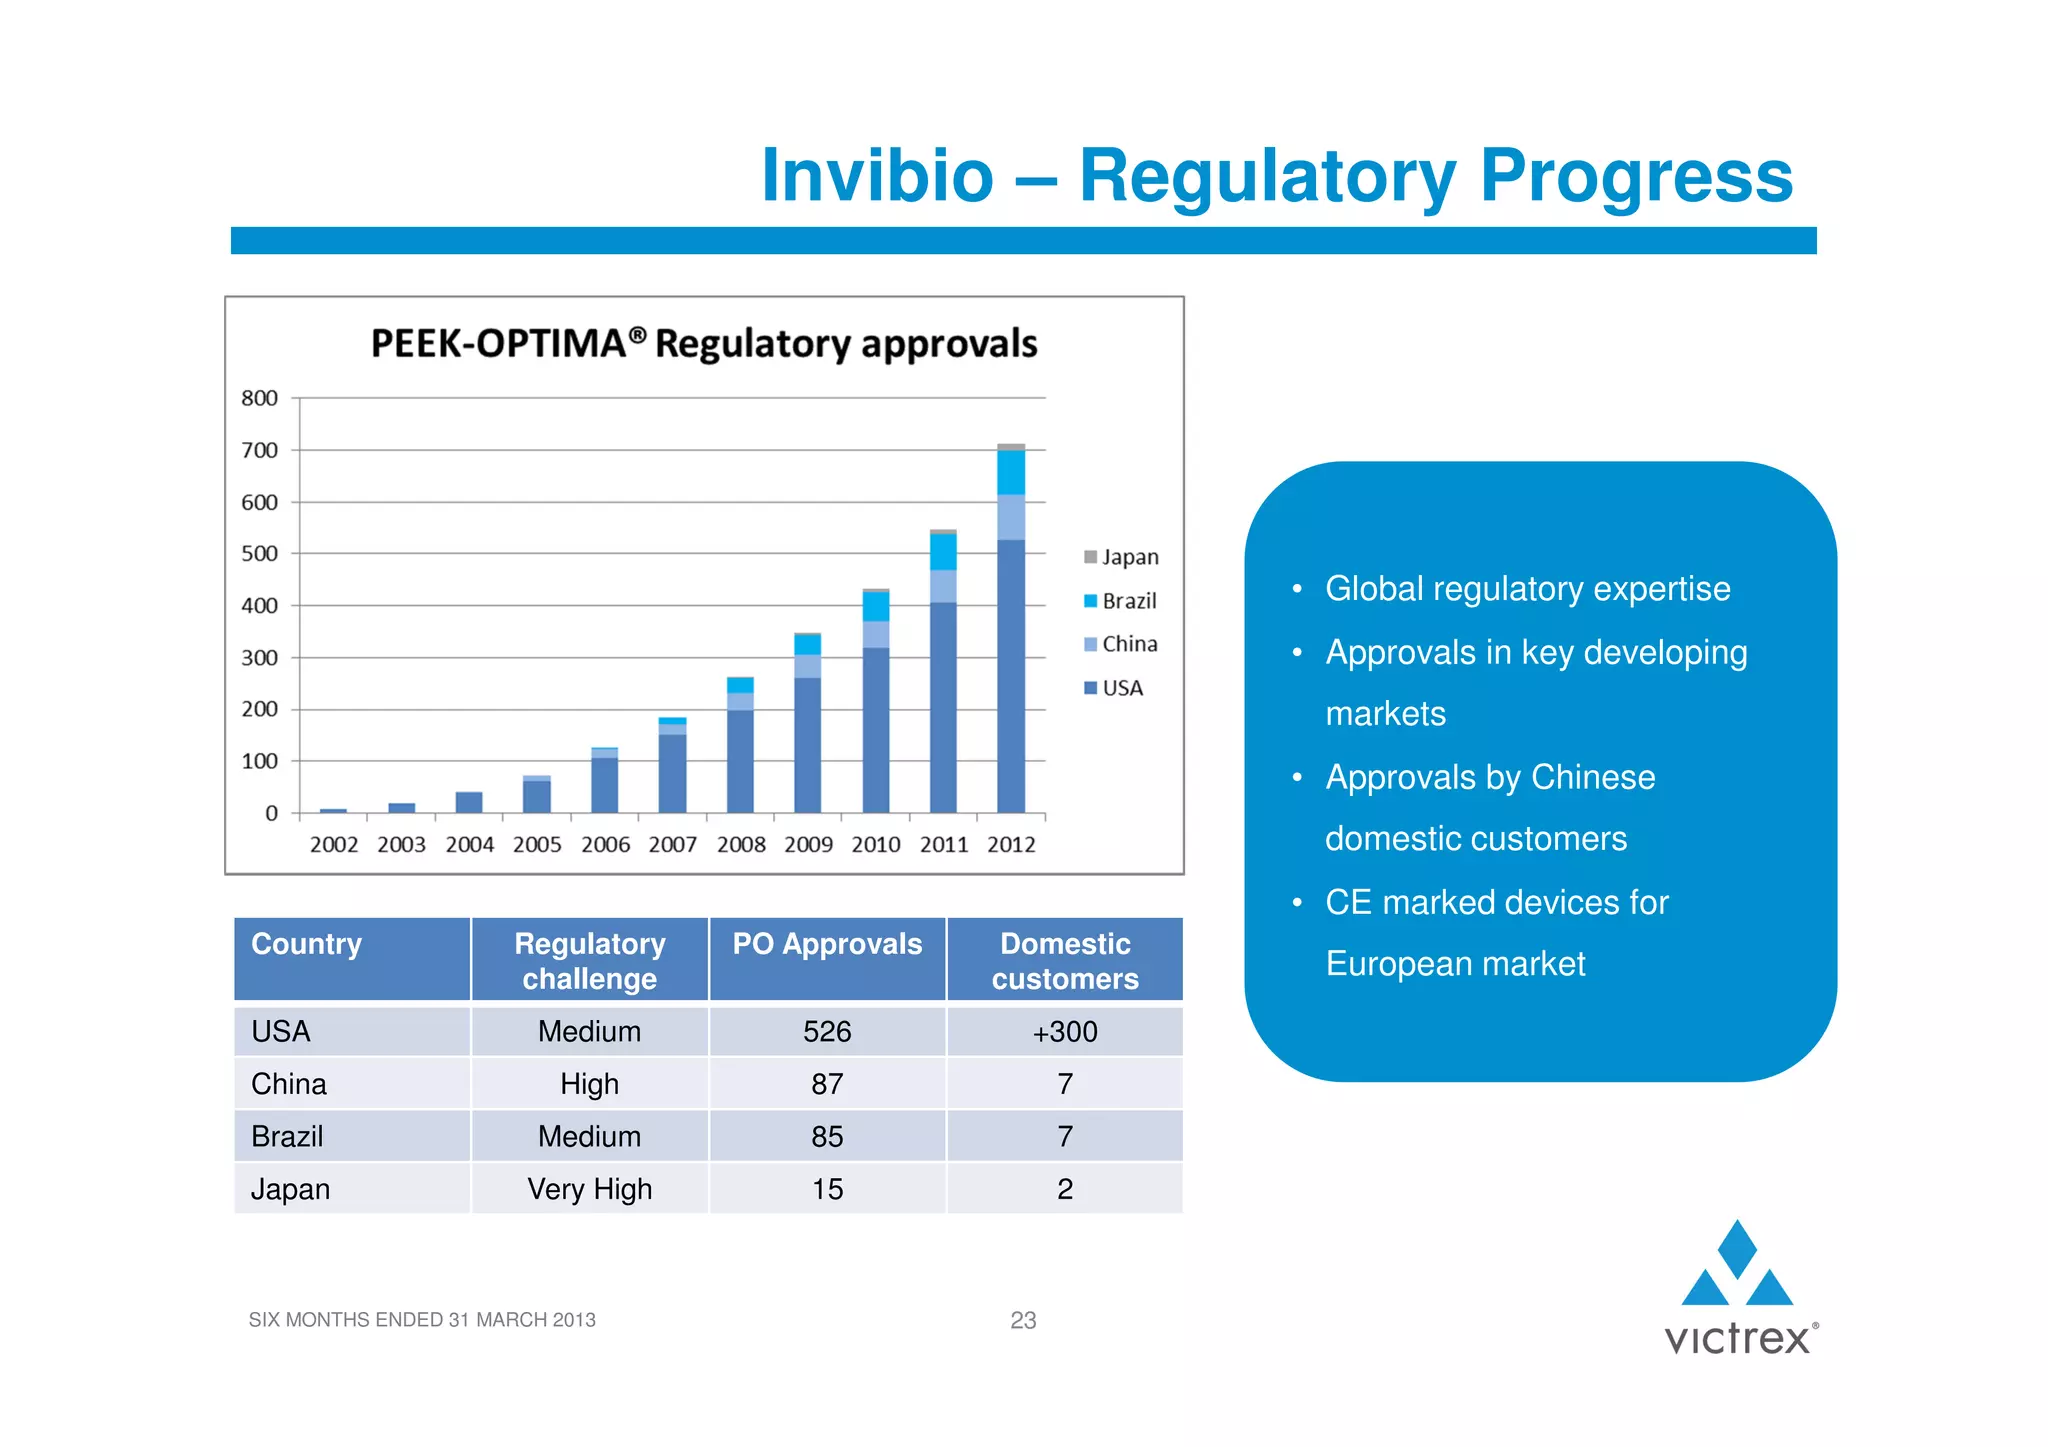
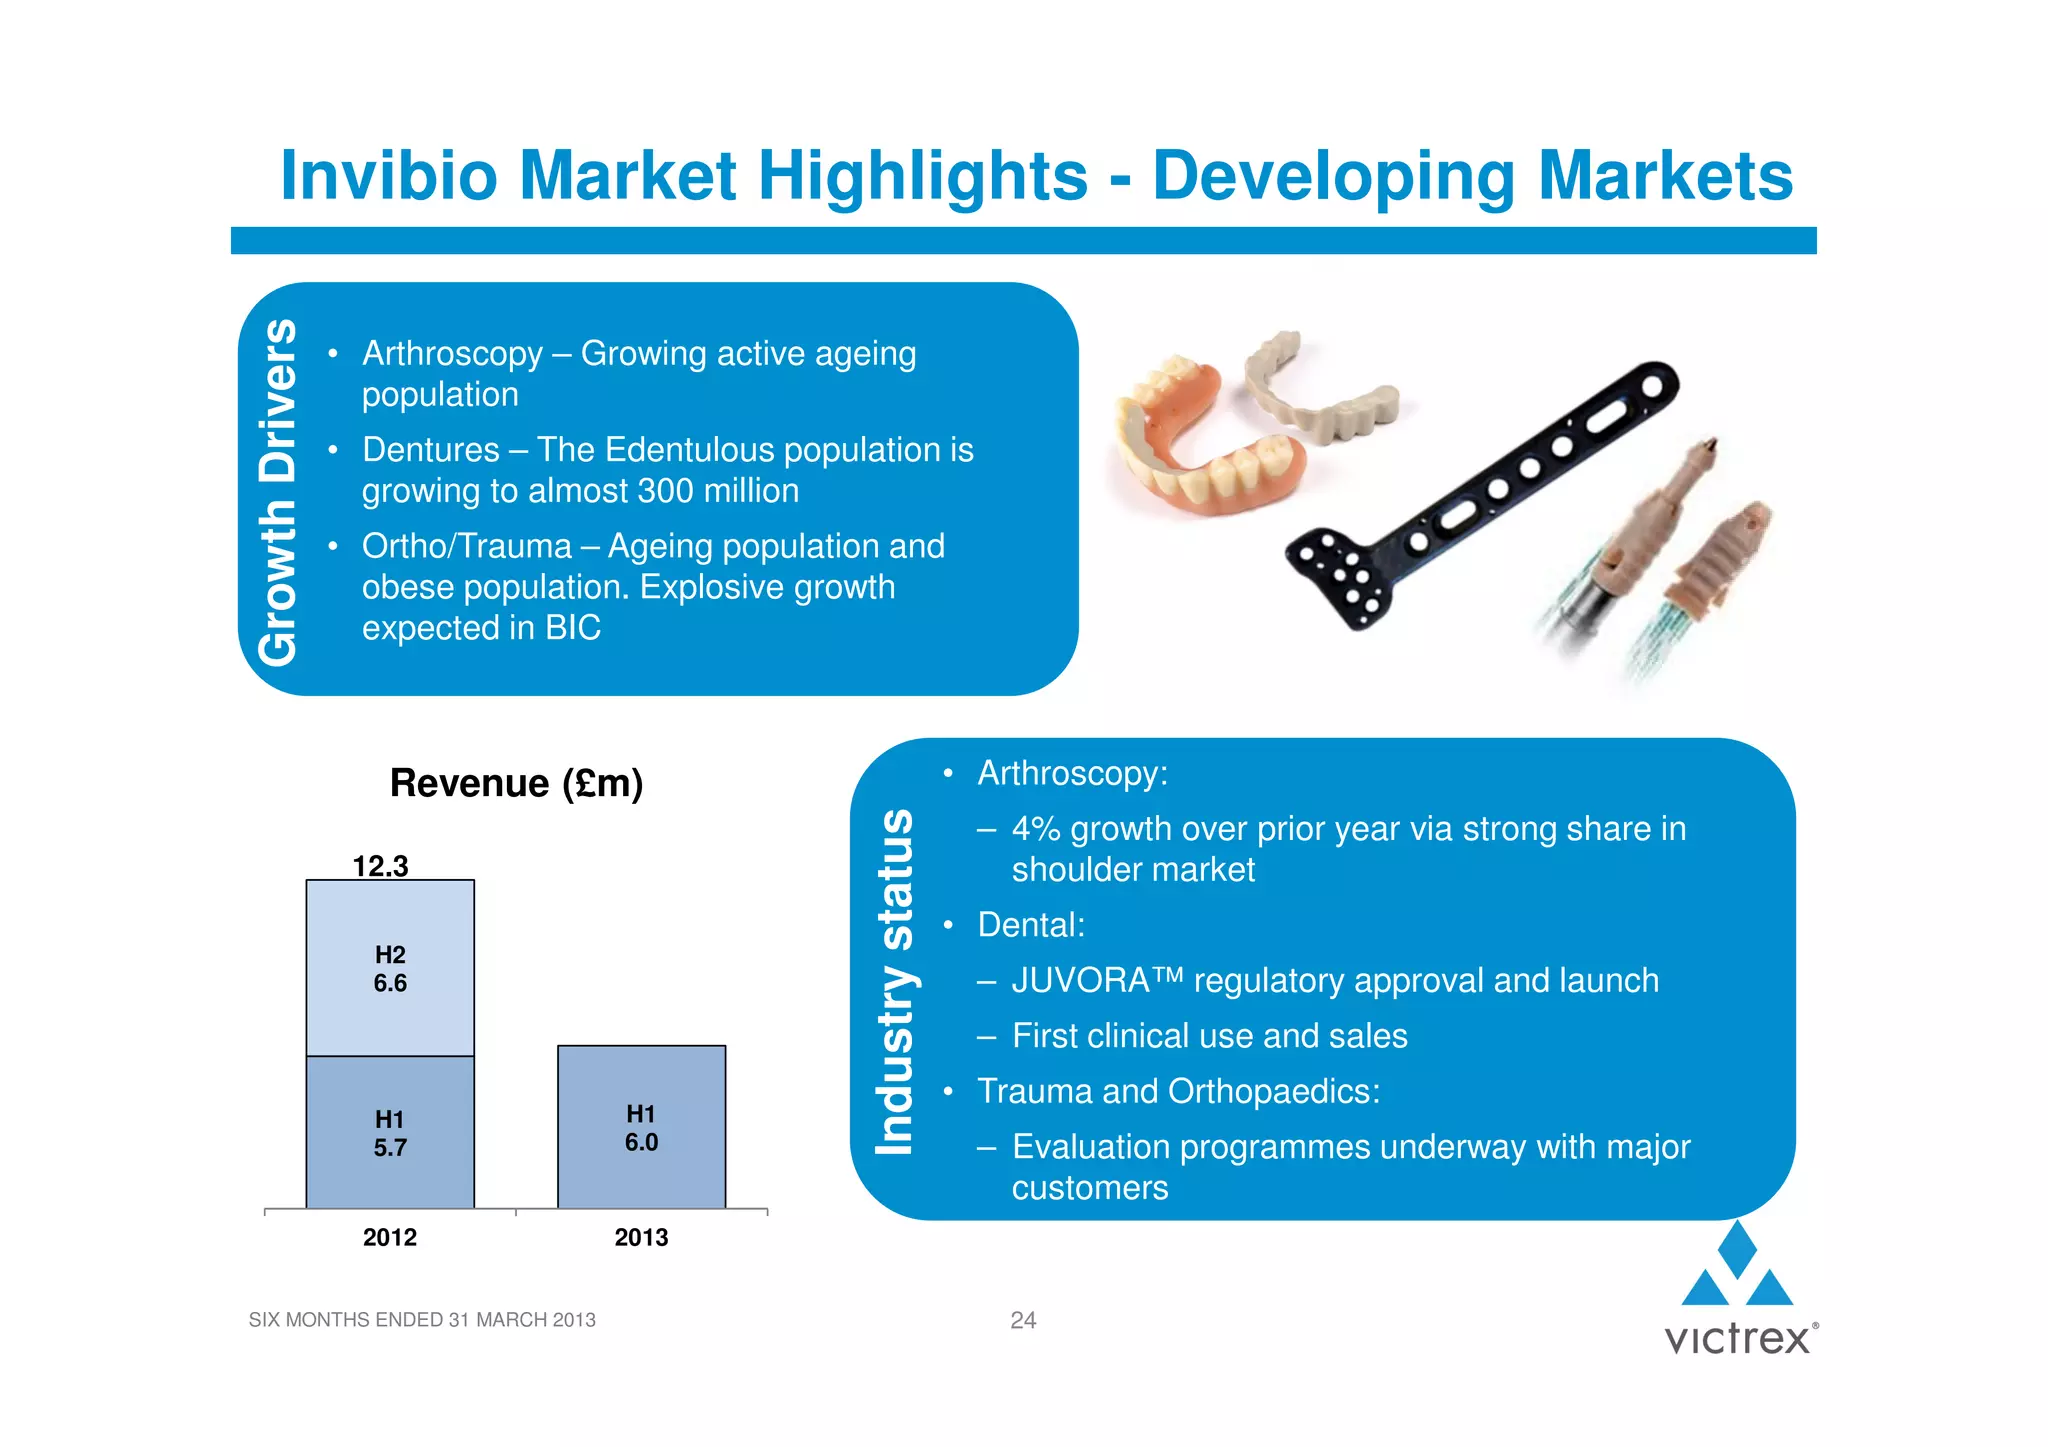
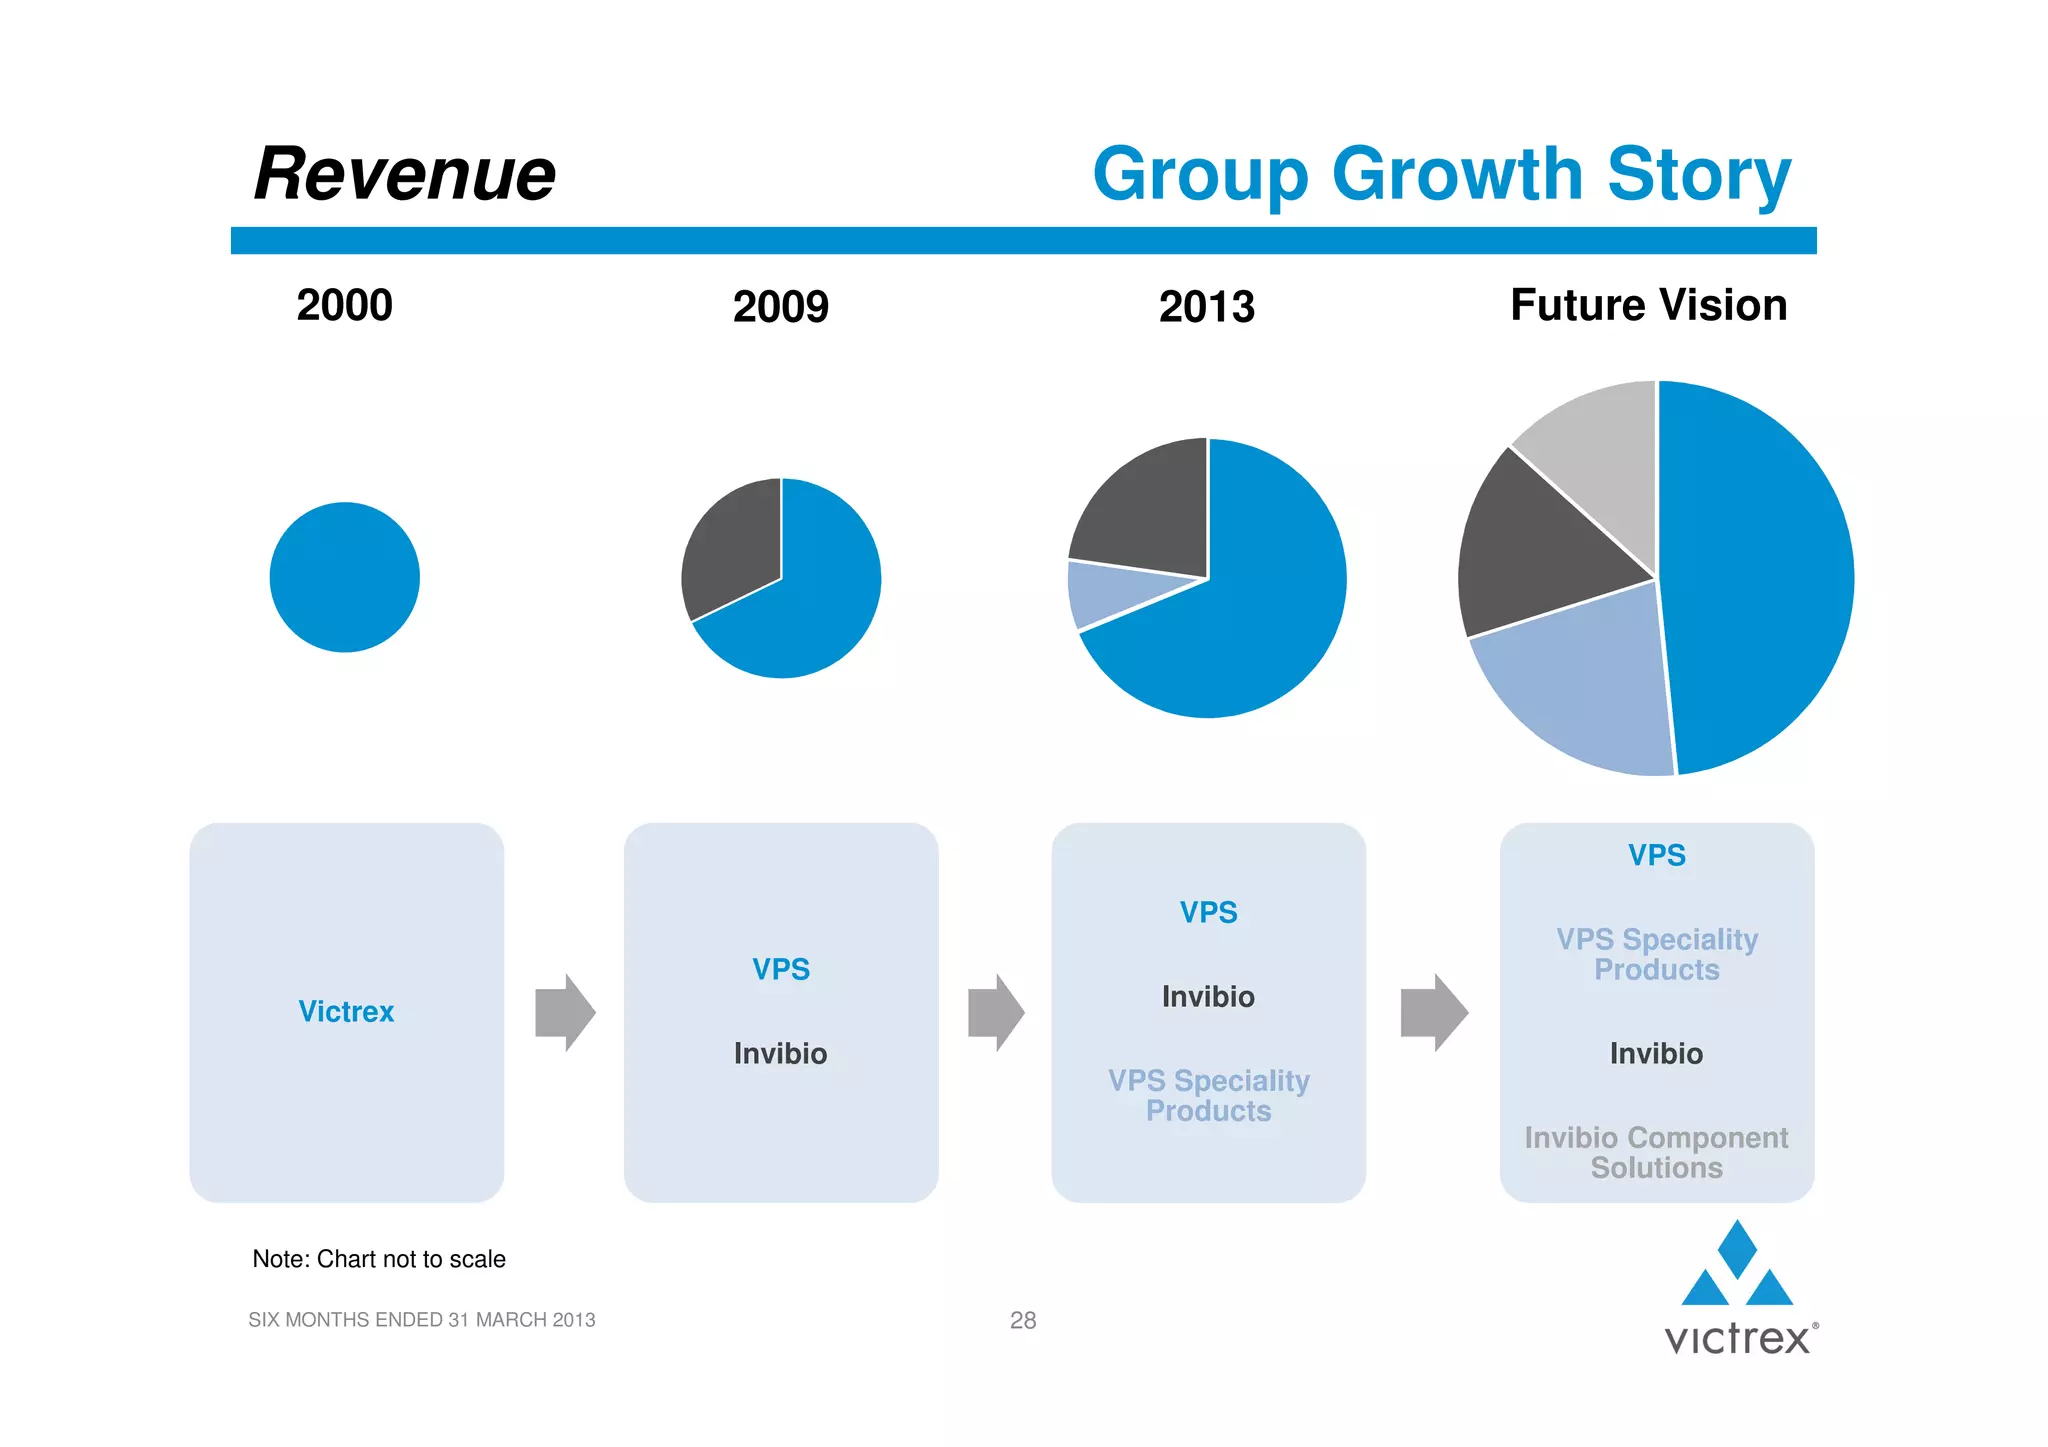
3. Business Highlights
Resilience in challenging market conditions
• Revenue and earnings per share ahead of last year
• Group gross margins maintained
• Continued investment in key growth programmes
• VICTREX PEEK capacity expansion on track
• Cash generation remains strong
• Interim dividend increased by 15%
SIX MONTHS ENDED 31 MARCH 2013
3
4. Group Income Statement
Six months ended 31 March
2013
£m
2012
£m
106.4
105.6
1%
Gross profit
71.5
70.6
1%
Gross margin %
67.2%
66.8%
0.4 % pts
Revenue
Change
%
(26.1)
0.3
(24.7)
0.3
Profit before tax
45.7
46.2
(1%)
Earnings per share
41.7p
41.6p
-
Overheads
Interest
6%
-
•
Continued investment in resources and key growth programmes
•
Reduction in effective tax rate from 24% to 23%
SIX MONTHS ENDED 31 MARCH 2013
4
7. Currency Update
Average exchange rates
2012
H1
2012
Year
2013
H1
2013
Year *
Exchange rate
sensitivity #
$/£
1.59
1.59
1.57
1.57
£4.3m
€/£
1.18
1.17
1.19
1.21
£3.6m
¥/£
130
126
127
127
£0.7m
•
The impact on 2012 profit before tax of applying these 2013 indicative
exchange rates would be a reduction of £1m
* 2013 year estimates based on forecast sales volume, currency hedging already in place and spot exchange rates as at 30 April 2013
#
Management estimate of impact on full year PBT from a 5% movement in full year average exchange rate
SIX MONTHS ENDED 31 MARCH 2013
7
8. Group Cash Flow Statement
Six months ended 31 March
Operating profit
Increase in inventories
Increase in trade and other receivables
Decrease in trade and other payables
Depreciation
Other
Cash generated from operations
Tax paid
Capital expenditure
Dividends paid
Other financing activities
Net decrease in cash and cash equivalents
•
Capital investment in PEEK and BDF capacity
•
Indicative capital forecast:
2013: £40m
•
2014: £65m
2015: £40m
15% increase 2013 interim dividend (~ £9m)
SIX MONTHS ENDED 31 MARCH 2013
8
2013
£m
45.4
(4.4)
(2.1)
(4.4)
5.3
1.3
41.1
(11.9)
(16.0)
(23.9)
0.9
(9.8)
2012
£m
45.9
(6.3)
(3.8)
(8.6)
4.7
(0.4)
31.5
(13.7)
(12.1)
(20.5)
0.9
(13.9)
9. Group Balance Sheet
31 March
2013
£m
166.7
53.7
74.3
41.1
(9.7)
(52.1)
274.0
PPE and intangible assets
Inventories
Cash
Trade receivables and other assets
Retirement benefit obligations ('RBO')
Trade payables and other liabilities
Equity shareholders' funds
• Planned inventory increase due to phasing of production campaigns
• RBO reflects increase in market expectation of long term inflation
SIX MONTHS ENDED 31 MARCH 2013
9
30 September
2012
£m
153.7
48.6
83.9
39.5
(4.0)
(50.6)
271.1
11. VPS Highlights
Resilience in difficult global economic conditions
• Revenue growth
• Progress in speciality products
• Average selling price and gross margins strong
• Continued investment
SIX MONTHS ENDED 31 MARCH 2013
11
12. Group End Markets
By Industry
By Region
H1 2013:
1,392 tonnes
Medical
+15%
Asia-Pacific
-10%
+1%
EMEA
+8%
176 t
13%
237 t
17%
Americas
-4%
388 t
28%
Electronics
+1%
767 t
55%
Industrial
-5%
524 t
38%
312 t
22%
380 t
27%
Transport
+5%
Medical
Asia-Pacific
H1 2012:
1,377 tonnes
EMEA
153 t
11%
263 t
19%
Electronics
710 t
52%
552 t
40%
310 t
23%
404 t
29%
Americas
SIX MONTHS ENDED 31 MARCH 2013
362 t
26%
12
Transport
Industrial
13. Growth Drivers
VPS Market Highlights - Industrial
Development Pipeline
• Deeper, hotter, higher pressure, more aggressive
Industrial (25%)
• High oil price > $60-80/bbl drives exploration
• VICTREX PEEK proven track record
• Magma progress
1,121
H2
569
H1
552
H1
524
2012
Industry status
Sales Volume (tonnes)
• Volume down 5% on H1 2012
• Oil and Gas:
– Reduced rig count towards end 2012
– Megatrends play to our products strengths
• Industrial machinery and equipment:
2013
SIX MONTHS ENDED 31 MARCH 2013
– Stable demand
13
14. Growth Drivers
VPS Market Highlights - Transport
Auto
• Hotter, higher pressure operating environments
• Car production CAGR 4-5%, China premium market slowing
• Displace incumbent materials to meet regulatory
performance
Aero
• Jet fuel cost increasing
• Aircraft OEMs running huge order backlogs
• VICTREX PEEK certified by all major OEMs and regulators
• Up to 80% lighter than traditional aerospace materials
Development Pipeline
Auto (36%)
Aero (15%)
744
H2
382
H1
362
H1
380
2012
Industry status
Industry status
Sales Volume (tonnes)
•
Volume up 5% on H1 2012
•
Automotive: global demand maintained
•
Aerospace: expanding global opportunities
•
New application development
•
Market penetration
2013
SIX MONTHS ENDED 31 MARCH 2013
14
15. Growth Drivers
VPS Market Highlights - Electronics
Development Pipeline
• Thinner, smaller, smarter devices
Electronics (21%)
• Energy and thermal management challenges
• APTIV® films create design opportunities resulting from
inherent durability
714
H2
404
H1
310
H1
312
2012
Industry status
Industry status
Sales Volume (tonnes)
• Volume in line with H1 2012
• Consumer electronics growth:
– Cyclicality of new applications
– Opportunities for APTIV films
• Semiconductor manufacturing:
2013
SIX MONTHS ENDED 31 MARCH 2013
– Lower capital investment in Asia
15
16. VPS - Development Pipeline
March 2013: 2,242 tonnes
Medical
3%
500
439
450
Sept 2012: 2,212 tonnes
400
329
350
Electronics
21%
300
268
271
244
250
Automotive
36%
200
221
163
146
150
Transport
51%
Industrial
25%
119125
100
50
Aerospace
15%
0
H1 2011
H2 2011
H1 2012
H2 2012
H1 2013
Matu re an nualised vo lume 'MAV' (tonnes)
New applications commercialised (nu mber)
1.4
1.2
•
tonnes
Strategic marketing to target increased
market penetration
•
0.6
Focus on impactful targets
•
0.8
Strong and diversified pipeline
•
1.0
Progress on key growth programmes
0.4
0.2
0.0
2010
2011
2012
2013 (H1)
Pipeline average target size
SIX MONTHS ENDED 31 MARCH 2013
16
17. Speciality Products
•
Investment in downstream product forms to accelerate adoption and drive growth
•
Strong H1 performance driven by APTIV film
•
Targeting specific markets
•
Developing process capability and new product solutions
•
Future investment opportunities
SIX MONTHS ENDED 31 MARCH 2013
17
18. VPS - Outlook
Regional view
Global market view
Asia-Pacific
Optimistic
Aerospace
Consumer electronics
EMEA
Americas
Neutral
Automotive
Oil and gas
Japan
Cautious
Semiconductor
Industrial machinery
Growth potential
Optimistic
Growth potential
Growth potential
Consumer confidence
Neutral
Growth potential
Consumer confidence
Growth challenge
Cautious
Investment confidence
SIX MONTHS ENDED 31 MARCH 2013
18
20. Invibio Highlights
Progress despite challenging growth environment
• Renewal of major US Spine contracts
• Growth in developing markets
• Further regulatory approvals in Asia
• Innovative new products launched in spine and dental
SIX MONTHS ENDED 31 MARCH 2013
20
22. Growth Drivers
Invibio Market Highlights - Spine
• US procedures increasing but
market value flat
Early bone
apposition with
PEEK-OPTIMA® HA
Enhanced
• Fusion focus for spinal treatment
• Innovation to differentiate in fusion
• Growth rates of 25-35% projected for
China and Brazil
38.2
H2
18.4
H1
19.8
H1
18.2
2012
Industry status
Revenue (£m)
• PEEK-OPTIMA HA Enhanced – customer
evaluations and prototyping
• Growth opportunities in non-interbody (spinal rods)
• Regulatory progress in China, marketing initiatives
2013
SIX MONTHS ENDED 31 MARCH 2013
commenced
22
23. Invibio – Regulatory Progress
• Global regulatory expertise
• Approvals in key developing
markets
• Approvals by Chinese
domestic customers
• CE marked devices for
Country
Regulatory
challenge
PO Approvals
Domestic
customers
USA
Medium
526
+300
China
High
87
7
Brazil
Medium
85
7
Japan
Very High
15
2
SIX MONTHS ENDED 31 MARCH 2013
23
European market
24. Growth Drivers
Invibio Market Highlights - Developing Markets
• Arthroscopy – Growing active ageing
population
• Dentures – The Edentulous population is
growing to almost 300 million
• Ortho/Trauma – Ageing population and
obese population. Explosive growth
expected in BIC
• Arthroscopy:
12.3
H2
6.6
H1
5.7
H1
6.0
2012
Industry status
Revenue (£m)
– 4% growth over prior year via strong share in
shoulder market
• Dental:
– JUVORA™ regulatory approval and launch
– First clinical use and sales
• Trauma and Orthopaedics:
2013
SIX MONTHS ENDED 31 MARCH 2013
– Evaluation programmes underway with major
customers
24
25. Invibio - Market Focus
Application area and market focus
Wide market acceptance
Probability of widespread adoption
Spine
fusion
lumbar
Emerging acceptance
Market seeding
SF
cervical
Introduction of JUVORA brand in for high
value removable dentures
CMF
Arthro
Recon
dental
Non
fusion
Market focus on fusion
Hip,
knee and
extremities
Trauma
Focus on metal replacement in knees for
cost and performance benefits.
Proof of concept testing
Steady increase in devices using PEEK.
Entered into joint development
agreements with major industry players
0
5
10
Indicative time to wide market acceptance (years)
SIX MONTHS ENDED 31 MARCH 2013
25
26. Invibio Component Solutions
• Component based solutions to accelerate adoption and drive growth
• Focus on high incidence surgeries in which PEEK-OPTIMA offers clear benefits
• Provides opportunity to simplify spine supply chain
• Initial regulatory approval and revenues achieved for JUVORA and Trauma
• Focused on adoption through proven clinical benefits and patient preference
• Future investment opportunities
SIX MONTHS ENDED 31 MARCH 2013
26
27. Invibio - Outlook
Regional view
Global market view
Asia-Pacific
Optimistic
Spine (new)
Dentures
EMEA
Neutral
Arthroscopy
Americas
Cautious
Spine (core)
Growth potential
Optimistic
Growth potential
Growth challenge
Neutral
Growth potential
New product introductions
Growth challenge
Inventory management
Cautious
Growth challenge
SIX MONTHS ENDED 31 MARCH 2013
27
28. Group Growth Story
Revenue
2000
2009
2013
Future Vision
VPS
VPS
VPS
Invibio
Victrex
Invibio
VPS Speciality
Products
Note: Chart not to scale
SIX MONTHS ENDED 31 MARCH 2013
28
VPS Speciality
Products
Invibio
Invibio Component
Solutions
30. Disclaimer
Victrex's business and share price may be affected by a
number of risks, trends, factors and uncertainties, not all of
which are in our control.
Accordingly, actual results may differ materially from
anticipated results because of a variety of risk factors,
including: changes in exchange rates; changes in global,
political, economic, business, competitive and market forces;
changes in raw material pricing and availability; changes to
legislation and tax rates; future business combinations or
disposals; relations with customers and customer credit risk;
events affecting international security, including global health
issues and terrorism; changes in regulatory environment and
the outcome of litigation.
SIX MONTHS ENDED 31 MARCH 2013
30