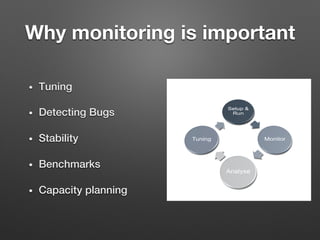
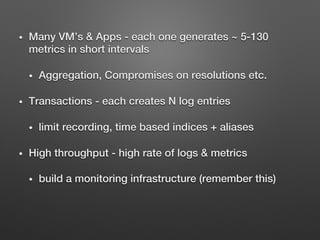
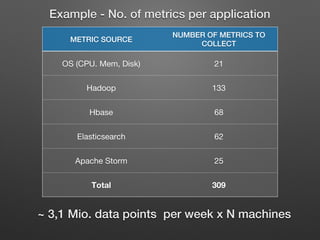
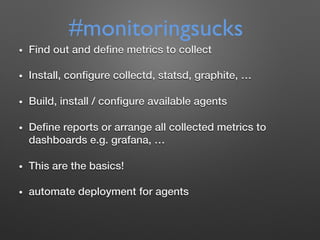
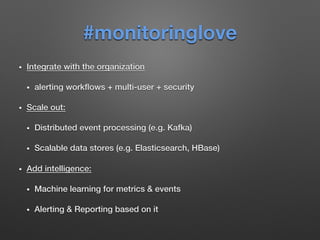
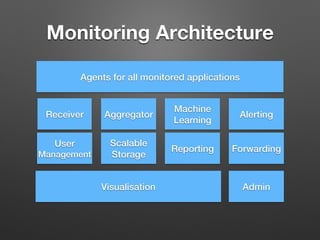
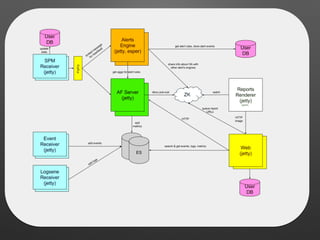
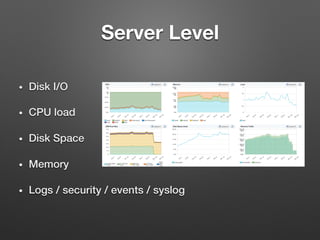
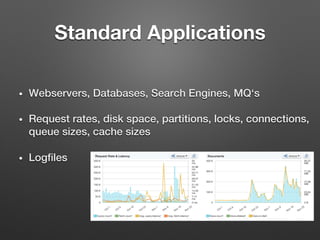
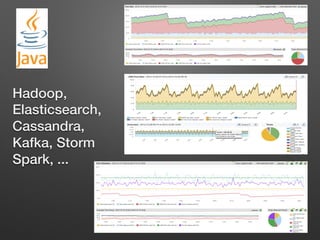
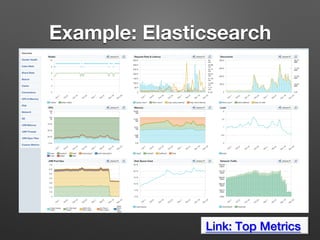
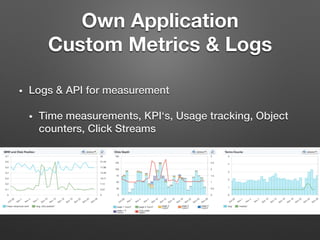
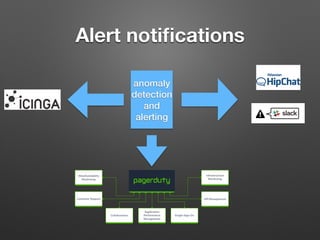
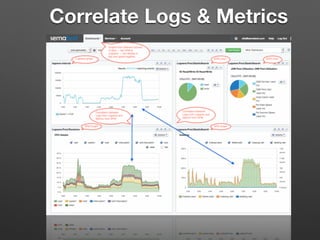
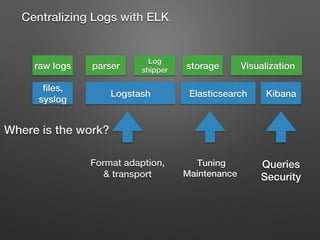
Metrics & more
how to monitor big data systems @scale!
About me

Stefan Thies

@seti321


!
DevOps Evangelist @sematext!
Why monitoring is important
•  Tuning !
•  Detecting Bugs!
•  Stability!
•  Benchmarks!
•  Capacity planning!
Monitoring tools
must endure the
load
Would you start building own scales, 
when you would operate a real zoo?

- What’s your mechanical engineering expertise?
- How long does it take to get tools and raw material? 
- Who feeds the animals while being in the workshop?
- When do we need it and could it be ‚in time‘?
Let’s take
something from
the shelf and
build a custom
interface
‚load balancers‘!‚Custom Interface‘!
What
happens
@scale?
•  Many VM’s & Apps - each one generates ~ 5-130
metrics in short intervals!
•  Aggregation, Compromises on resolutions etc.!
•  Transactions - each creates N log entries !
•  limit recording, time based indices + aliases!
•  High throughput - high rate of logs & metrics!
•  build a monitoring infrastructure (remember this)!
!
METRIC SOURCE!
NUMBER OF METRICS TO
COLLECT!
OS (CPU. Mem, Disk)
 21
Hadoop
 133
Hbase 
 68
Elasticsearch
 62
Apache Storm
 25
Total
 309
~ 3,1 Mio. data points per week x N machines !
!
Example - No. of metrics per application!
25 Metric
Categories !
Metrics – Apache Kafka!
•  Find out and define metrics to collect !
•  Install, configure collectd, statsd, graphite, …!
•  Build, install / configure available agents!
•  Define reports or arrange all collected metrics to
dashboards e.g. grafana, …!
•  This are the basics!!
•  automate deployment for agents!
#monitoringsucks
#monitoringlove
•  Integrate with the organization !
•  alerting workflows + multi-user + security!
•  Scale out: !
•  Distributed event processing (e.g. Kafka)!
•  Scalable data stores (e.g. Elasticsearch, HBase)!
•  Add intelligence: !
•  Machine learning for metrics & events!
•  Alerting & Reporting based on it!
Monitoring Architecture
Receiver! Aggregator!
Scalable!
Storage!
Reporting!
Machine
Learning!
Alerting!
Forwarding!
User
Management!
Agents for all monitored applications!
Visualisation! Admin!
What can we find

in the wild?
Network Level
•  Packets: loss, size, counts!
•  Latency, jitters, delays!
•  Bandwidth – total, per link, per service, !
•  Firewalls / security breaches!
•  IDS, IPS – yet another malware detected !
•  On physical, transport, application layer, ...!
Server Level
•  Disk I/O!
•  CPU load!
•  Disk Space !
•  Memory!
•  Logs / security / events / syslog!
Standard Applications
•  Webservers, Databases, Search Engines, MQ‘s!
•  Request rates, disk space, partitions, locks, connections,
queue sizes, cache sizes!
•  Logfiles!
Hadoop,
Elasticsearch,
Cassandra,
Kafka, Storm
Spark, ...!
Example: Elasticsearch
Link: Top Metrics !
Own Application 

Custom Metrics & Logs
•  Logs & API for measurement!
•  Time measurements, KPI‘s, Usage tracking, Object
counters, Click Streams!
Application Traces
•  Post mortem analysis!
process.on (‚exit‘, heapdumpAndDie)
•  Dtrace !
•  Call Traces, Error stacks!
•  Heapdumps & Flamegraphs!
Log files as source of metrics
•  Simplest: log rate of an application!
•  Generate Count for operations!
•  Apply search and count related events!
•  E.g. count slow operations!
•  Extract values from logs !
•  Apply regex or field search to extract numbers !
Logs2Metrics 
Logs! Index!
Scheduled
Queries!
aggregate all messages
matching e.g.
„session opened“
every Minute e.g. on
auth.log
Custom !
Metric!
Monitoring !
System!
A Checklist for the introduction
of monitoring solutions
Define your criterias
•  Coverage of monitors/agents!
•  Quality of agents & setup!
•  Multi-User Support!
•  Reporting Capability & Secure Sharing!
•  Alerting capabilities!
•  Integrations / Notifications / API‘s!
•  Estimate required resources !
Map your landscape
•  Quantity of servers & applications to monitor!
•  What are the components of your App-Stack?!
•  Linux on AWS, NGINX, Node.js, REDIS, Elasticsearch!
•  Which programming languages are used?!
•  Can you find agents/monitors for all your ‚Apps‘?!
•  List missing parts -> find other or build a monitor!
Customizing – custom
metrics/plugins
•  What metrics are relevant for each ‚App‘?!
•  What is covered by existing agents?!
•  How to aggregate each of this metrics? !
•  min, max, sum, avg!
•  Pre-Aggregation vs. Query Time Aggregation!
Dashboards
•  Graphs!
•  Which metrics belong together?!
•  Display options ….!
•  Query language !
•  Dashboards!
•  What combination of graphs provides best insight?!
•  Can you share and re-use arranged dashboards for similar setups or situations? !
•  Or do you need to configure it again for other servers?!
•  Is sharing secured? Or just a link to your UI?!
Alerts
•  Threshold based alerts!
•  Status changes !
•  Heartbeat alerts!
•  Anomaly detection!
•  Challenges: Number of alert rules and queries !
& tuning ‘noise level’!
Alert notifications
anomaly
detection
and
alerting!
•  Metrics show „something happens“!
•  Logs provide evidence „what happened“!
•  Faster insights by reporting them together!
•  Correlate logs and metrics!
•  Metrics could be created from logs!
Integrate metrics & logs
Correlate Logs & Metrics
A brief overview of 

Centralizing Logs

raw logs! parser!
Log
shipper! storage! Visualization!
Kibana!Elasticsearch!Logstash!
Where is the work?!
Centralizing Logs with ELK !
files,
syslog!
Format adaption,!
& transport!
Tuning !
Maintenance!
Queries!
Security !
•  Input: Unstructured log lines!
•  Filter & Parser: Grok / RegEx!
•  Output: Structured JSON!
•  Forwarder: !
•  Elasticsearch, …!
•  Schema: Define the right Mapping 
•  Insert rate:!
•  Use bulk indexing!
•  Increase refresh time for higher insert rate!
•  Volume: !
•  Aliases and time based indices!
•  Memory usage: configure caching limits!
Setup Elasticsearch
•  How to secure it? !
•  Proxies, Security plugins, Hosted Solutions!
•  Queries and dashboard creation!
•  generators/templates for specific setups!
•  Learn Lucene query language!
Kibana
Thank you for !
your attention!
http://blog.sematext.com!

Metrics & more

  • 1.
    Metrics & more howto monitor big data systems @scale!
  • 2.
  • 3.
    Why monitoring isimportant •  Tuning ! •  Detecting Bugs! •  Stability! •  Benchmarks! •  Capacity planning!
  • 4.
  • 5.
    Would you startbuilding own scales, when you would operate a real zoo? - What’s your mechanical engineering expertise? - How long does it take to get tools and raw material? - Who feeds the animals while being in the workshop? - When do we need it and could it be ‚in time‘?
  • 6.
    Let’s take something from theshelf and build a custom interface ‚load balancers‘!‚Custom Interface‘!
  • 7.
  • 8.
    •  Many VM’s& Apps - each one generates ~ 5-130 metrics in short intervals! •  Aggregation, Compromises on resolutions etc.! •  Transactions - each creates N log entries ! •  limit recording, time based indices + aliases! •  High throughput - high rate of logs & metrics! •  build a monitoring infrastructure (remember this)! !
  • 9.
    METRIC SOURCE! NUMBER OFMETRICS TO COLLECT! OS (CPU. Mem, Disk) 21 Hadoop 133 Hbase 68 Elasticsearch 62 Apache Storm 25 Total 309 ~ 3,1 Mio. data points per week x N machines ! ! Example - No. of metrics per application!
  • 10.
  • 11.
    •  Find outand define metrics to collect ! •  Install, configure collectd, statsd, graphite, …! •  Build, install / configure available agents! •  Define reports or arrange all collected metrics to dashboards e.g. grafana, …! •  This are the basics!! •  automate deployment for agents! #monitoringsucks
  • 12.
    #monitoringlove •  Integrate withthe organization ! •  alerting workflows + multi-user + security! •  Scale out: ! •  Distributed event processing (e.g. Kafka)! •  Scalable data stores (e.g. Elasticsearch, HBase)! •  Add intelligence: ! •  Machine learning for metrics & events! •  Alerting & Reporting based on it!
  • 13.
  • 15.
    What can wefind
 in the wild?
  • 16.
    Network Level •  Packets:loss, size, counts! •  Latency, jitters, delays! •  Bandwidth – total, per link, per service, ! •  Firewalls / security breaches! •  IDS, IPS – yet another malware detected ! •  On physical, transport, application layer, ...!
  • 17.
    Server Level •  DiskI/O! •  CPU load! •  Disk Space ! •  Memory! •  Logs / security / events / syslog!
  • 18.
    Standard Applications •  Webservers,Databases, Search Engines, MQ‘s! •  Request rates, disk space, partitions, locks, connections, queue sizes, cache sizes! •  Logfiles!
  • 19.
  • 20.
  • 21.
    Own Application 
 CustomMetrics & Logs •  Logs & API for measurement! •  Time measurements, KPI‘s, Usage tracking, Object counters, Click Streams!
  • 22.
    Application Traces •  Postmortem analysis! process.on (‚exit‘, heapdumpAndDie) •  Dtrace ! •  Call Traces, Error stacks! •  Heapdumps & Flamegraphs!
  • 23.
    Log files assource of metrics •  Simplest: log rate of an application! •  Generate Count for operations! •  Apply search and count related events! •  E.g. count slow operations! •  Extract values from logs ! •  Apply regex or field search to extract numbers !
  • 24.
    Logs2Metrics Logs! Index! Scheduled Queries! aggregateall messages matching e.g. „session opened“ every Minute e.g. on auth.log Custom ! Metric! Monitoring ! System!
  • 25.
    A Checklist forthe introduction of monitoring solutions
  • 26.
    Define your criterias • Coverage of monitors/agents! •  Quality of agents & setup! •  Multi-User Support! •  Reporting Capability & Secure Sharing! •  Alerting capabilities! •  Integrations / Notifications / API‘s! •  Estimate required resources !
  • 27.
    Map your landscape • Quantity of servers & applications to monitor! •  What are the components of your App-Stack?! •  Linux on AWS, NGINX, Node.js, REDIS, Elasticsearch! •  Which programming languages are used?! •  Can you find agents/monitors for all your ‚Apps‘?! •  List missing parts -> find other or build a monitor!
  • 28.
    Customizing – custom metrics/plugins • What metrics are relevant for each ‚App‘?! •  What is covered by existing agents?! •  How to aggregate each of this metrics? ! •  min, max, sum, avg! •  Pre-Aggregation vs. Query Time Aggregation!
  • 29.
    Dashboards •  Graphs! •  Whichmetrics belong together?! •  Display options ….! •  Query language ! •  Dashboards! •  What combination of graphs provides best insight?! •  Can you share and re-use arranged dashboards for similar setups or situations? ! •  Or do you need to configure it again for other servers?! •  Is sharing secured? Or just a link to your UI?!
  • 30.
    Alerts •  Threshold basedalerts! •  Status changes ! •  Heartbeat alerts! •  Anomaly detection! •  Challenges: Number of alert rules and queries ! & tuning ‘noise level’!
  • 31.
  • 32.
    •  Metrics show„something happens“! •  Logs provide evidence „what happened“! •  Faster insights by reporting them together! •  Correlate logs and metrics! •  Metrics could be created from logs! Integrate metrics & logs
  • 33.
  • 34.
    A brief overviewof 
 Centralizing Logs

  • 36.
    raw logs! parser! Log shipper!storage! Visualization! Kibana!Elasticsearch!Logstash! Where is the work?! Centralizing Logs with ELK ! files, syslog! Format adaption,! & transport! Tuning ! Maintenance! Queries! Security !
  • 37.
    •  Input: Unstructuredlog lines! •  Filter & Parser: Grok / RegEx! •  Output: Structured JSON! •  Forwarder: ! •  Elasticsearch, …!
  • 38.
    •  Schema: Definethe right Mapping •  Insert rate:! •  Use bulk indexing! •  Increase refresh time for higher insert rate! •  Volume: ! •  Aliases and time based indices! •  Memory usage: configure caching limits! Setup Elasticsearch
  • 39.
    •  How tosecure it? ! •  Proxies, Security plugins, Hosted Solutions! •  Queries and dashboard creation! •  generators/templates for specific setups! •  Learn Lucene query language!
  • 40.
  • 41.
    Thank you for! your attention! http://blog.sematext.com!