Download as PDF, PPTX

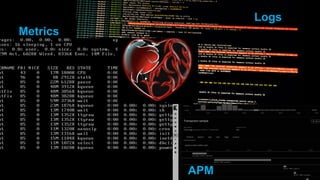

![Metrics vs Logs
64.242.88.10 - - [07/Mar/2017:16:10:02 -0800] "GET /mailman/listinfo/hsdivision HTTP/1.1" 200 6291
64.242.88.10 - - [07/Mar/2017:16:11:58 -0800] "POST /twiki/bin/view/TWiki/WikiSyntax HTTP/1.1" 404 7352
64.242.88.10 - - [07/Mar/2017:16:20:55 -0800] "GET /twiki/bin/view/Main/DCCAndPostFix HTTP/1.1" 200 5253
For each event, print out what happened.
Logs are chronological records of events](https://image.slidesharecdn.com/logsmetricsapm-santa-190723161257/85/Logging-Metrics-and-APM-The-Operations-Trifecta-9-320.jpg)
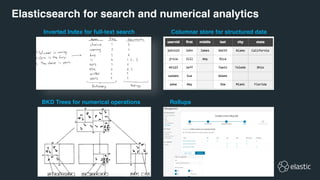
![Metrics vs Logs
64.242.88.10 - - [07/Mar/2017:16:10:02 -0800] "GET /mailman/listinfo/hsdivision HTTP/1.1" 200 6291
64.242.88.10 - - [07/Mar/2017:16:11:58 -0800] "POST /twiki/bin/view/TWiki/WikiSyntax HTTP/1.1" 404 7352
64.242.88.10 - - [07/Mar/2017:16:20:55 -0800] "GET /twiki/bin/view/Main/DCCAndPostFix HTTP/1.1" 200 5253
For each event, print out what happened.
Logs are chronological records of events
07/Mar/2017 16:10:00 all 2.58 0.00 0.70 1.12 0.05 95.55 server1 containerX regionA
07/Mar/2017 16:20:00 all 2.56 0.00 0.69 1.05 0.04 95.66 server2 containerY regionB
07/Mar/2017 16:30:00 all 2.64 0.00 0.65 1.15 0.05 95.50 server2 containerZ regionC
Every x minutes, measure the CPU load and print it out, and annotate with meta-data.
Metrics are periodic measurements of numeric KPIs](https://image.slidesharecdn.com/logsmetricsapm-santa-190723161257/85/Logging-Metrics-and-APM-The-Operations-Trifecta-15-320.jpg)


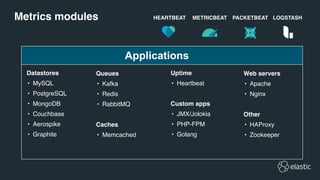
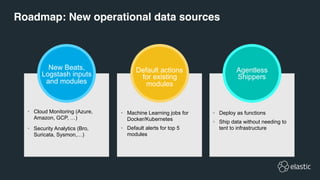
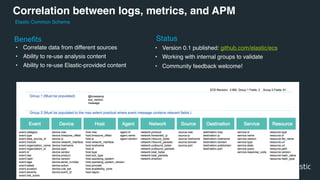
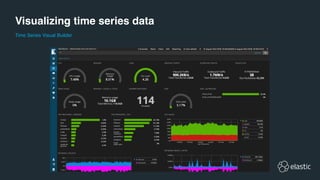
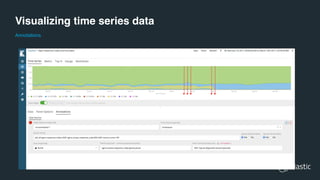
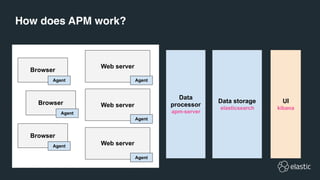
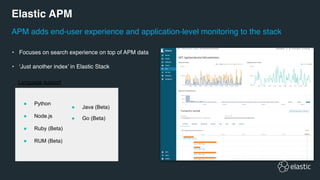
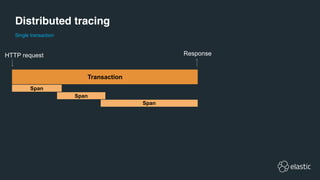


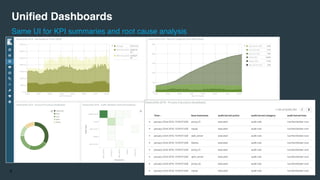
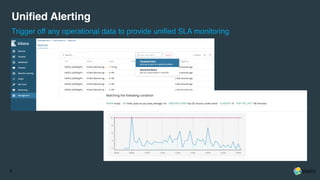
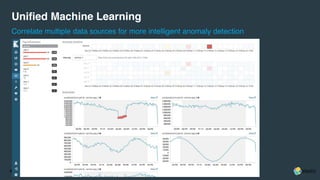
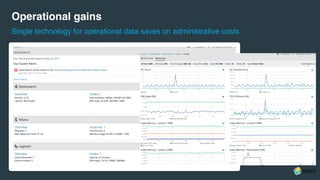
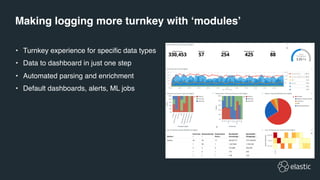
The document discusses the integration and benefits of logs, metrics, and application performance monitoring (APM) within a unified operational data stack. It highlights features such as unified dashboards, alerting, and machine learning for anomaly detection, while detailing the evolution and capabilities of the Elastic Stack for these purposes. Additionally, it outlines practical implementations, data sources, and future roadmaps for enhancing operational data analysis.


![Modernising One Legal Se@rch with Elastic Enterprise Search [Customer Story]](https://cdn.slidesharecdn.com/ss_thumbnails/modernisingonelegalserchwithelastic-jsedit14thjune2021-210625013449-thumbnail.jpg?width=640&height=640&fit=bounds)