Metrics-Driven Design
                            by Joshua Porter

                            Twitter: bokardo


                                    bokardo
                                  52weeksofUX
                                  performable
                                   microcopy
                           designing for the social web
                                make them care!
                                                          by Joshua Porter

Saturday, March 12, 2011
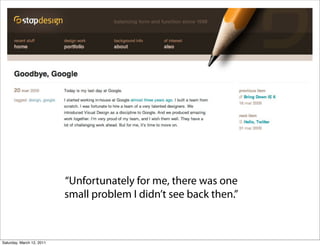
“Unfortunately for me, there was one
                           small problem I didn’t see back then.”


Saturday, March 12, 2011
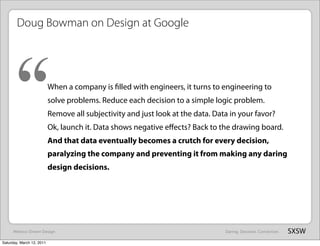
Doug Bowman on Design at Google


      “                    Yes, it’s true that a team at Google couldn’t decide between two
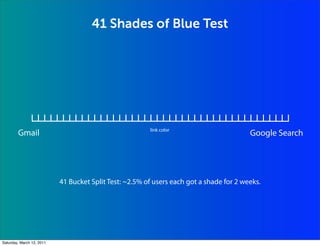
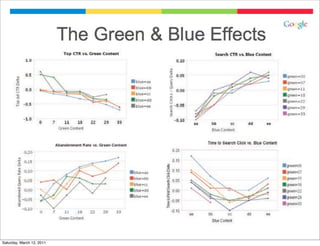
                           blues, so they’re testing 41 shades between each blue to see
                           which one performs better. I had a recent debate over whether a
                           border should be 3, 4 or 5 pixels wide, and was asked to prove my
                           case. I can’t operate in an environment like that.


      Metrics-Driven Design                                                     Daring. Decisive. Conviction.   SXSW
Saturday, March 12, 2011
41 Shades of Blue Test


                                                        link color
        Gmail                                                                            Google Search


                           41 Bucket Split Test: ~2.5% of users each got a shade for 2 weeks.


Saturday, March 12, 2011
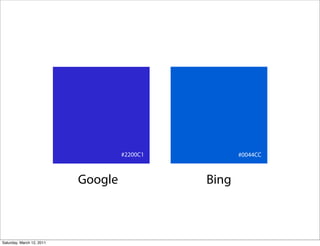
#2200C1          #0044CC


                           Google             Bing


Saturday, March 12, 2011
“                    That blue was worth at
                           least $80 million.
                           Paul Ray, UX Manager, Bing


      Metrics-Driven Design                             Microcopy   SXSW
Saturday, March 12, 2011
Doug Bowman on Design at Google


      “                    When a company is filled with engineers, it turns to engineering to
                           solve problems. Reduce each decision to a simple logic problem.
                           Remove all subjectivity and just look at the data. Data in your favor?
                           Ok, launch it. Data shows negative effects? Back to the drawing board.
                           And that data eventually becomes a crutch for every decision,
                           paralyzing the company and preventing it from making any daring
                           design decisions.


      Metrics-Driven Design                                                      Daring. Decisive. Conviction.   SXSW
Saturday, March 12, 2011
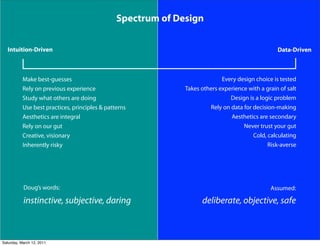
Spectrum of Design


   Intuition-Driven                                                                               Data-Driven


           Make best-guesses                                                Every design choice is tested
           Rely on previous experience                        Takes others experience with a grain of salt
           Study what others are doing                                         Design is a logic problem
           Use best practices, principles & patterns                   Rely on data for decision-making
           Aesthetics are integral                                             Aesthetics are secondary
           Rely on our gut                                                          Never trust your gut
           Creative, visionary                                                          Cold, calculating
           Inherently risky                                                                   Risk-averse


           Doug’s words:                                                                       Assumed:

           instinctive, subjective, daring                          deliberate, objective, safe


Saturday, March 12, 2011
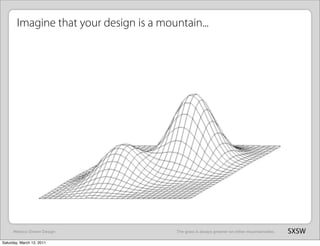
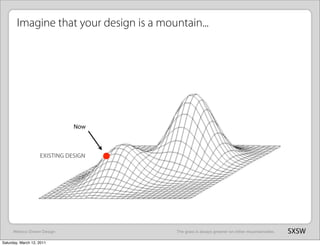
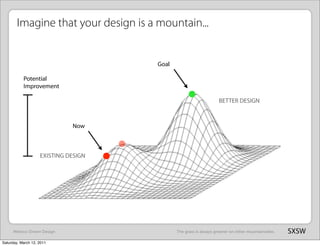
Imagine that your design is a mountain...


      Metrics-Driven Design               The grass is always greener on other mountainsides.   SXSW
Saturday, March 12, 2011
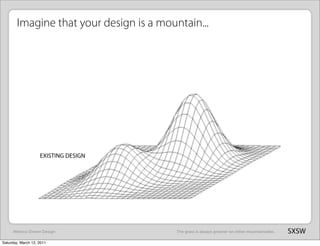
Imagine that your design is a mountain...


                    EXISTING DESIGN


      Metrics-Driven Design               The grass is always greener on other mountainsides.   SXSW
Saturday, March 12, 2011
Imagine that your design is a mountain...


                               Now


                    EXISTING DESIGN


      Metrics-Driven Design               The grass is always greener on other mountainsides.   SXSW
Saturday, March 12, 2011
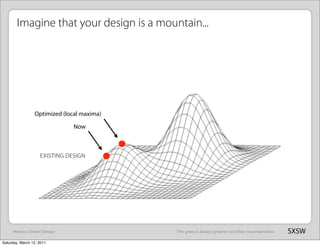
Imagine that your design is a mountain...


                 Optimized (local maxima)

                               Now


                    EXISTING DESIGN


      Metrics-Driven Design                 The grass is always greener on other mountainsides.   SXSW
Saturday, March 12, 2011
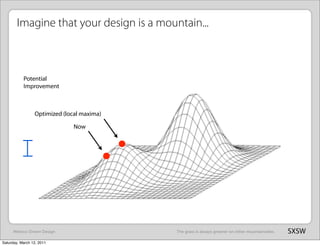
Imagine that your design is a mountain...


           Potential
           Improvement


                 Optimized (local maxima)

                               Now


      Metrics-Driven Design                 The grass is always greener on other mountainsides.   SXSW
Saturday, March 12, 2011
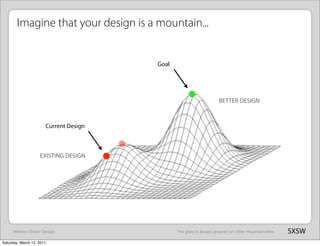
Imagine that your design is a mountain...


                                        Goal


                                                                    BETTER DESIGN


                       Current Design


                    EXISTING DESIGN


      Metrics-Driven Design                    The grass is always greener on other mountainsides.   SXSW
Saturday, March 12, 2011
Imagine that your design is a mountain...


                                      Goal

           Potential
           Improvement

                                                                  BETTER DESIGN


                              Now


                    EXISTING DESIGN


      Metrics-Driven Design                  The grass is always greener on other mountainsides.   SXSW
Saturday, March 12, 2011
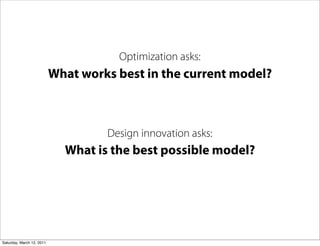
Optimization asks:
                           What works best in the current model?


                                    Design innovation asks:
                             What is the best possible model?


Saturday, March 12, 2011
What are Metrics?


Saturday, March 12, 2011
DEFINITION


                  Metrics are simply numbers
                that measure the effectiveness
                       of your business.


Saturday, March 12, 2011
5 Reasons why Metrics are a
                          Designer’s Best Friend


Saturday, March 12, 2011
1. Metrics reduce arguments
                          based on opinion.


Saturday, March 12, 2011
2. Metrics give you answers
                            about what really works.


Saturday, March 12, 2011
3. Metrics show you where
                           you’re strong as a designer.


Saturday, March 12, 2011
4. Metrics allow you to test
                               anything you want.


Saturday, March 12, 2011
5. Clients love metrics.


Saturday, March 12, 2011
PRINCIPLE

                  Your metrics will be as unique
                        as your business.


Saturday, March 12, 2011
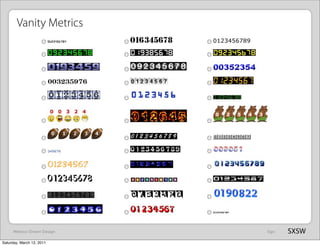
Vanity Metrics


      Metrics-Driven Design   Ego   SXSW
Saturday, March 12, 2011
The Usage Lifecycle


Saturday, March 12, 2011
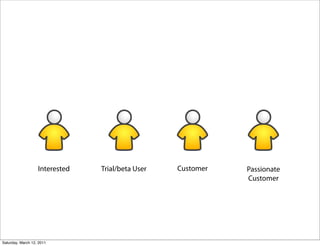
Interested   Trial/beta User   Customer   Passionate
                                                             Customer


Saturday, March 12, 2011
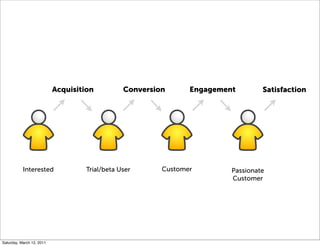
Acquisition          Conversion      Engagement        Satisfaction


           Interested               Trial/beta User      Customer        Passionate
                                                                         Customer


Saturday, March 12, 2011
With metrics you are essentially just measuring
                how well you move people along the lifecycle!


Saturday, March 12, 2011
Acquisition Metrics


Saturday, March 12, 2011
CPA - Cost per Acquisition

                           If your CPA is higher than your LTV
                                  then you’re in trouble.


Saturday, March 12, 2011
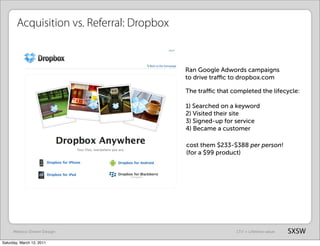
Acquisition vs. Referral: Dropbox


                                            Ran Google Adwords campaigns
                                            to drive traffic to dropbox.com

                                            The traffic that completed the lifecycle:

                                            1) Searched on a keyword
                                            2) Visited their site
                                            3) Signed-up for service
                                            4) Became a customer

                                            cost them $233-$388 per person!
                                            (for a $99 product)


      Metrics-Driven Design                                  LTV = Lifetime value   SXSW
Saturday, March 12, 2011
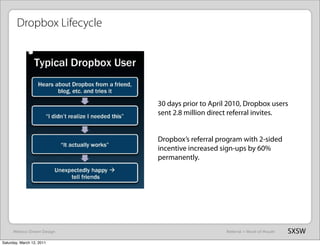
Dropbox Lifecycle


                              30 days prior to April 2010, Dropbox users
                              sent 2.8 million direct referral invites.


                              Dropbox’s referral program with 2-sided
                              incentive increased sign-ups by 60%
                              permanently.


      Metrics-Driven Design                         Referral = Word of Mouth   SXSW
Saturday, March 12, 2011
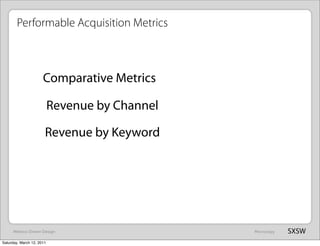
Performable Acquisition Metrics


                      Comparative Metrics

                           Revenue by Channel

                       Revenue by Keyword


      Metrics-Driven Design                     Microcopy   SXSW
Saturday, March 12, 2011
Conversion Metrics


Saturday, March 12, 2011
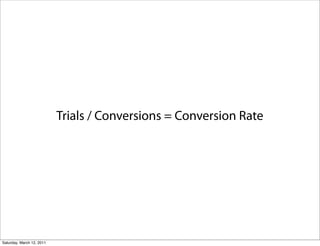
Trials / Conversions = Conversion Rate


Saturday, March 12, 2011
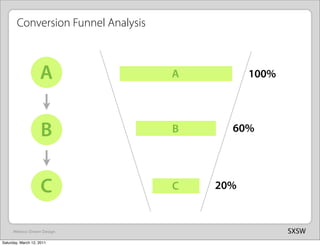
Conversion Funnel Analysis


                    A                A         100%


                     B               B     60%


                     C               C   20%


      Metrics-Driven Design                           SXSW
Saturday, March 12, 2011
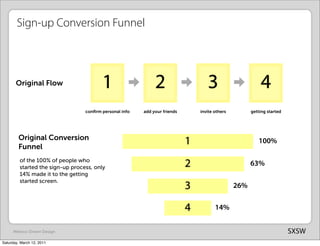
Sign-up Conversion Funnel


       Original Flow                     1                    2                    3                      4
                                  confirm personal info   add your friends       invite others         getting started


        Original Conversion
        Funnel
                                                                            1                            100%

         of the 100% of people who
         started the sign-up process, only                                  2                         63%
         14% made it to the getting
         started screen.
                                                                            3                   26%


                                                                            4          14%


      Metrics-Driven Design                                                                                             SXSW
Saturday, March 12, 2011
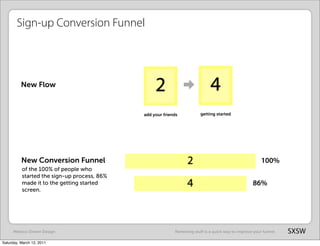
Sign-up Conversion Funnel


          New Flow
                                                  2                          4
                                             add your friends           getting started


          New Conversion Funnel                                  2                                     100%
          of the 100% of people who
          started the sign-up process, 86%
          made it to the getting started
          screen.
                                                                 4                                86%


      Metrics-Driven Design                                Removing stuff is a quick way to improve your funnel   SXSW
Saturday, March 12, 2011
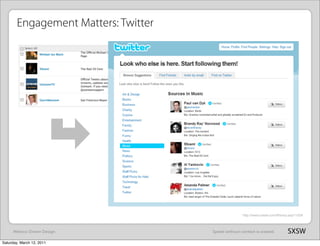
Engagement Matters: Twitter


                                                     http://www.lukew.com/ff/entry.asp?1039


      Metrics-Driven Design           Speed without context is wasted.           SXSW
Saturday, March 12, 2011
Engagement Metrics


Saturday, March 12, 2011
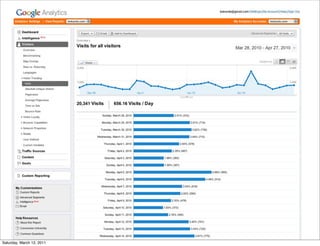
•   Hits
                           •   Page views
                           •   Visits
                           •   Unique Visitors
                           •   Returning Visitors
                           •   Registered Users
                           •   Customers
                           •   Frequency
                           •   Time on Site
                           •   Daily Active Users


Saturday, March 12, 2011
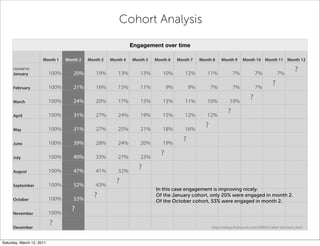
Cohort Analysis

                                                                Engagement over time

                      Month 1     Month 2   Month 3   Month 4   Month 5   Month 6    Month 7    Month 8     Month 9      Month 10 Month 11 Month 12

      (Joined in)
                           100%      20%       19%       13%       13%       10%        12%        11%              7%           7%            7%
                                                                                                                                                         ?
      January


                           100%      21%       16%       13%       11%          9%         9%         7%            7%           7%
                                                                                                                                           ?
      February


                           100%      24%       20%       17%       15%       13%        11%        10%           10%
                                                                                                                             ?
      March


                           100%      31%       27%       24%       19%       15%        12%        12%
                                                                                                                ?
      April


                           100%      31%       27%       25%       21%       18%        16%
                                                                                                  ?
      May


                           100%      39%       28%       24%       20%       19%
                                                                                       ?
      June


                           100%      40%       33%       27%       23%
                                                                            ?
      July


                           100%      47%       41%       32%
                                                                  ?
      August


                           100%      52%       43%
                                                        ?
      September
                                                                          In this case engagement is improving nicely.
                           100%      53%
                                              ?                           Of the January cohort, only 20% were engaged in month 2.
      October                                                             Of the October cohort, 53% were engaged in month 2.

                           100%
                                    ?
      November

                           ?
      December                                                                                        http://redeye.firstround.com/2008/01/after-the-techc.html


Saturday, March 12, 2011
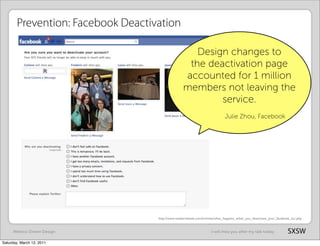
Prevention: Facebook Deactivation

                                                      Design changes to
                                                    the deactivation page
                                                   accounted for 1 million
                                                   members not leaving the
                                                           service.
                                                                              Julie Zhou, Facebook


                                    http://www.readwriteweb.com/archives/what_happens_when_you_deactivate_your_facebook_acc.php


      Metrics-Driven Design                                          I will miss you after my talk today.             SXSW
Saturday, March 12, 2011
Satisfaction Metrics


Saturday, March 12, 2011
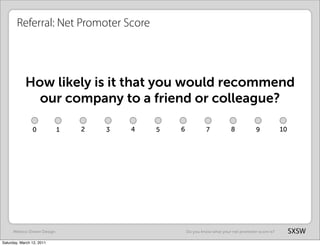
Referral: Net Promoter Score


            How likely is it that you would recommend
              our company to a friend or colleague?

                0             1   2   3   4   5   6            7            8           9            10


      Metrics-Driven Design                           Do you know what your net promoter score is?        SXSW
Saturday, March 12, 2011
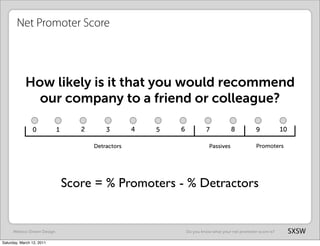
Net Promoter Score


            How likely is it that you would recommend
              our company to a friend or colleague?

                0             1      2       3        4   5   6            7            8           9            10

                                         Detractors                          Passives               Promoters


                                  Score = % Promoters - % Detractors


      Metrics-Driven Design                                       Do you know what your net promoter score is?        SXSW
Saturday, March 12, 2011
Mint.com & Net Promoter Score


      “                    Maybe we didn’t have a high viral coefficient
                           but we had a great net promoter score.
                           Jason Putorti, Lead Designer, Mint.com


      Metrics-Driven Design                                              SXSW
Saturday, March 12, 2011
Emergent Metrics


Saturday, March 12, 2011
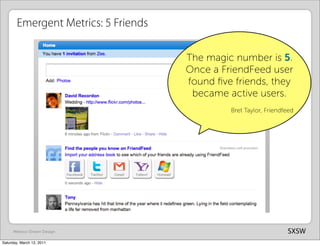
Emergent Metrics: 5 Friends

                                      The magic number is 5.
                                      Once a FriendFeed user
                                      found five friends, they
                                       became active users.
                                               Bret Taylor, Friendfeed


      Metrics-Driven Design                                        SXSW
Saturday, March 12, 2011
Is there one metric that drives others?


      “                    At Blogger, we determined that our most critical
                           metric was number of posts. An increase in posts
                           meant that people were not just creating blogs, but
                           updating them, and more posts would drive more
                           readership, which would drive more users, which
                           would drive more posts.

                                                           Ev Williams
                                                           founder of Blogger & Twitter


      Metrics-Driven Design                                    Once you’re lucky, twice you’re good.   SXSW
Saturday, March 12, 2011
Principles of Metrics-Driven Design


               1. Optimize in small steps; innovate with daring leaps.
               2. No design survives contact with the user.
               3. Small improvements, taken together, yield amazing results. 
               4. Testing is empowering, reversion is cleansing.
               5. Metrics are not creative: human beings are.
               6. All team members are responsible for the user experience.
               7. If metrics aren’t actionable, they aren’t useful.
               8. Design is never done.


      Metrics-Driven Design                           Reminder: Principal = Person & Principle = Thing   SXSW
Saturday, March 12, 2011
This Talk.


       http://bokardo.com/talks/metrics-driven-design/


Saturday, March 12, 2011
My Life.


                    http://performable.com              http://oneflightbooks.com


Saturday, March 12, 2011