Download to read offline


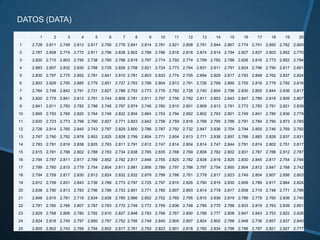
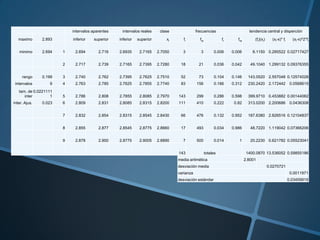
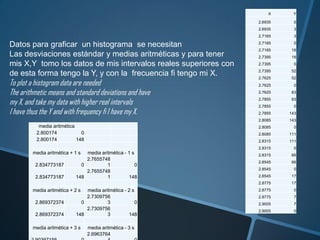
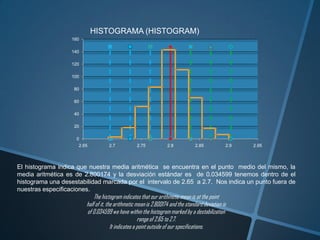
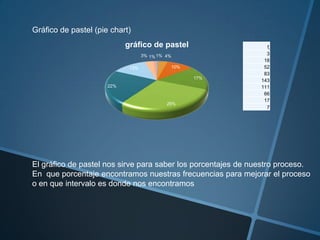
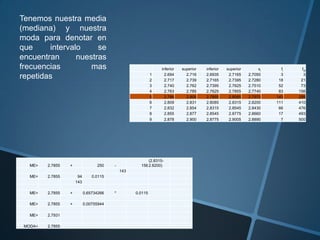

This document contains data from an experiment measuring 25 samples over 20 intervals. It includes the raw data, calculations of statistical measures like the mean, standard deviation, and variance. It also contains the data needed to plot a histogram, showing the frequency distribution of the sample values. The histogram indicates that most values fall within 3 standard deviations of the mean of 2.8, but there is an outlier between 2.65-2.7 that is outside specifications.


