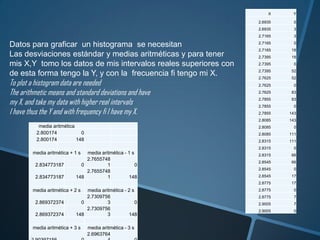
Download to read offline


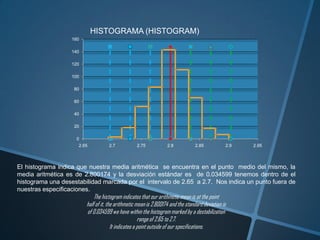


This document contains data from an experiment measuring 25 samples over 20 intervals. It includes the raw data, calculations of statistical measures like the mean, standard deviation, and variance. It also shows how to plot the data as a histogram. The histogram depicts the distribution of the data, with the highest frequencies near the mean of 2.8. It identifies one interval from 2.65 to 2.7 as being outside specifications.


![Presentacion De Info[1]](https://cdn.slidesharecdn.com/ss_thumbnails/presentacion-de-info1-1208433682950557-9-thumbnail.jpg?width=640&height=640&fit=bounds)


