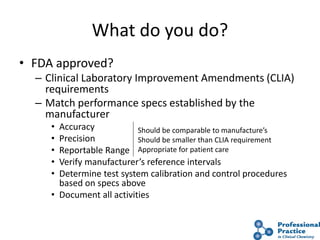
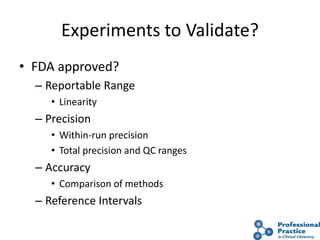
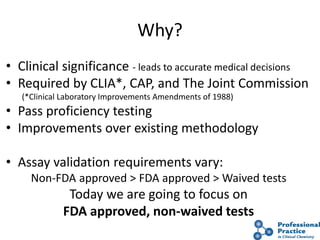
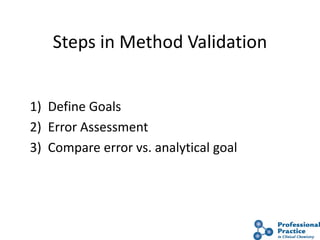
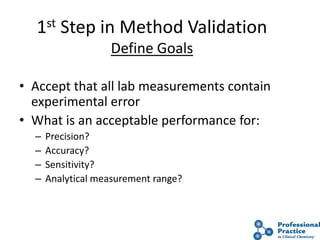
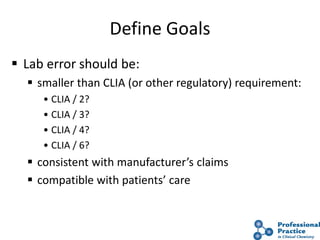
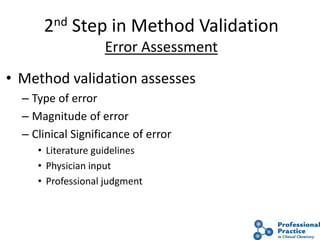
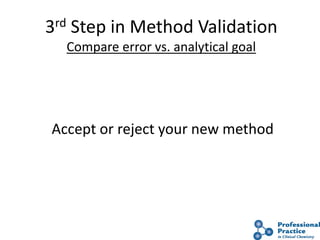
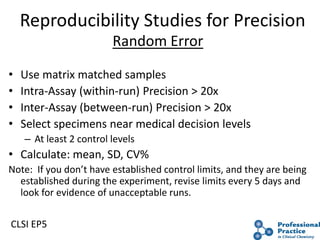
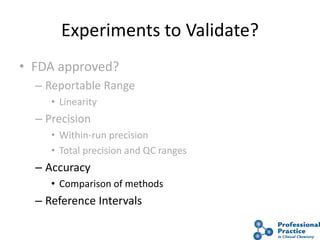
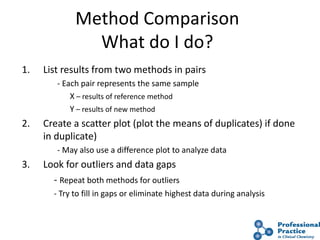
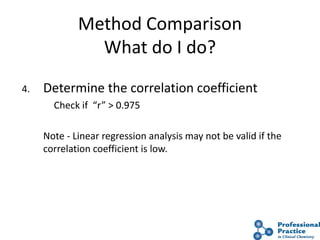
Method Validation
Ross Molinaro, PhD, MT(ASCP), DABCC, FACB
Emory University
Atlanta, GA
Learning Objectives
After this presentation, you should be able to:
1. Define method evaluation.
2. List the steps needed to complete a method
evaluation study.
3. Define total allowable error (TEa).
4. Apply TEa to method evaluation.
5. Describe recommendations for Sigma values.
Looking to implement a clinical test?
• Establish the need
• Clinical performance
– Clinical sensitivity
– Clinical specificity
• Define the performance standards
– Costs/efficiencies/space
– Turn around times/sample requirements
– Analytical Quality (from kit insert, references)
• Select the new method
 Evaluate the new method
• Implement the new method
What is method evaluation?
• Determination of:
– analytical performance characteristics
– clinical performance characteristics
• Validation
– Objective evidence that requirements for a specific
intended use can be fulfilled consistently
• Verification
– Objective evidence that requirements have been
fulfilled
What do you do?
• FDA approved?
– Clinical Laboratory Improvement Amendments (CLIA)
requirements
– Match performance specs established by the
manufacturer
• Accuracy
• Precision
• Reportable Range
• Verify manufacturer’s reference intervals
• Determine test system calibration and control procedures
based on specs above
• Document all activities
Should be comparable to manufacture’s
Should be smaller than CLIA requirement
Appropriate for patient care
Experiments to Validate?
• FDA approved?
– Reportable Range
• Linearity
– Precision
• Within-run precision
• Total precision and QC ranges
– Accuracy
• Comparison of methods
– Reference Intervals
Why?
• Clinical significance - leads to accurate medical decisions
• Required by CLIA*, CAP, and The Joint Commission
(*Clinical Laboratory Improvements Amendments of 1988)
• Pass proficiency testing
• Improvements over existing methodology
• Assay validation requirements vary:
Non-FDA approved > FDA approved > Waived tests
Today we are going to focus on
FDA approved, non-waived tests
Steps in Method Validation
1) Define Goals
2) Error Assessment
3) Compare error vs. analytical goal
9
1st Step in Method Validation
Define Goals
• Accept that all lab measurements contain
experimental error
• What is an acceptable performance for:
– Precision?
– Accuracy?
– Sensitivity?
– Analytical measurement range?
10
Define Goals
 Lab error should be:
 smaller than CLIA (or other regulatory) requirement:
• CLIA / 2?
• CLIA / 3?
• CLIA / 4?
• CLIA / 6?
 consistent with manufacturer’s claims
 compatible with patients’ care
11
2nd Step in Method Validation
Error Assessment
• Method validation assesses
– Type of error
– Magnitude of error
– Clinical Significance of error
• Literature guidelines
• Physician input
• Professional judgment
12
3rd Step in Method Validation
Compare error vs. analytical goal
Accept or reject your new method
13
Accuracy and Precision
Accuracy – closeness of
measured value to the
“true” value – bias
Precision – dispersion of
repeated measurements
about the mean –
reproducibility
Reliability –
Accuracy + Precision
14
Systematic and Random Errors
X
Y
.
.
.
.
.
. .
.
.
.
.
.
.
.
.
.
.
.
Y = mX + b
Y=X+b
Y=mX
New
method
-
Reference (old) method - X
Y = X
15
Total Analytical Error - TE
TE = RE + SE
RE
SE
Y
Y - X
X
16
Systematic Error - Affects accuracy
Systematic error (SE) - Bias
• Types of systemic errors:
– Proportional (indicated by slope)
– Constant (indicated by intercept)
– Proportional + Constant (Combination of both)
– Caused by (examples): bad calibrators, bad reagents, bad
pipettes, interference
17
Random Error (RE) - Affects precision
• May be caused by (for example):
– Variability in volume of sample or reagent delivered
– Changes in environment
– Inconsistent handling of materials
• Estimated by:
– Standard deviation (SD)
– Coefficient of variation (CV)
– Correlation coefficient (r)
18
Magnitude of Error – TE
• TE is the total maximum error of a test as
measured in the lab
• TE is the sum of: random + systemic errors
TE = RE + SE
• Determined
– For each given method
– At various medical decision levels (XC)
19
Total Allowable Error - TEA
TEA is the total error permitted by CLIA, based on
• Medical requirements
• Best available analytical method
• Compatible with proficiency testing expectations
Goal: Total Analytical Error < Total Allowable Error
TE < TEA
Determined
• Method specific
• Measured at various Medical decision levels (XC)
Ready to Validate?
• FDA approved?
– Reportable Range
• Linearity
– Precision
• Within-run precision
• Total precision and QC ranges
– Accuracy
• Comparison of methods
– Reference Intervals
21
AMR: Linearity Study
• Analytical Measurement Range (AMR)
– Range of analyte where results are proportional to the
true concentration of analyte in the sample
– Range over which the test can be performed w/o
modification (e.g. no dilution)
• Also called: Dynamic Range, and Reportable range
• Determined in the lab by linearity experiments
22
AMR vs. MD/C
• Analytical Measurement Range – AMR
– Range of analyte values that a method can
directly measure w/o modification (no
dilutions, concentrations, other pretreatments
that are not part of the usual assay process)
• Maximum Dilution/Concentration (formerly
Clinically Reportable Range – CRR)
– Range of analyte values which are clinically
significant
– Can be reported following modification (such
as dilutions)
23
AMR vs. MD/C
Measurement range should be medically useful if:
• MD/C > AMR
–Value higher than AMR: report as > X or dilute
–Value lower than AMR : report as < X or
concentrate
If: MD/C < AMR - Limit AMR
24
Linearity Study – “to do” list
• Samples:
– Ideal: Use “traceable” standards in matrix matched sample
– Mix of very high with very low pt.’s samples are OK if conc.
are known
– Dilute high samples in acceptable matrix diluent
• At least 5-7 different conc. points within the
reportable range (5 – 95% of AMR), equally spaced is
ideal
• Testing is performed in duplicate
• Run from lowest to highest (to avoid carryover)
• Pipetting accuracy and precision is critical
Limit of Detection
• Limit of Blank (LoB):
– The lowest concentration that can be distinguished from
background (blank, zero) noise
– Sometimes called limit of absence.
– Calculated as: Mean conc. of blank zero (>20 replicates) + 2SD
– This is the number provided in most kit inserts
• Limit of Detection (LoD):
– The lowest number that will almost always have a non-zero
result (mean conc. of blank + 3 SD)
Limit of Quantification (LoQ):
– The lowest concentration that can be quantified reliably
– Analyte lowest concentration where CV ≤ 20% (or other error
goal)
– Results with higher CV% have large random error, thus are not
useful for clinical interpretation
26
LOQ Experiments
• Only needed if MD/C begins
– At or near zero
– At or below the manufacturer’s stated AMR
– Not necessary for most assays
• Start with low end linearity study
– Determine the low end AMR
• Follow up with precision study
– Calculate the precision (CV) at low end concentrations
27
LOQ study example
Experiments to Validate?
• FDA approved?
– Reportable Range
• Linearity
– Precision
• Within-run precision
• Total precision and QC ranges
– Accuracy
• Comparison of methods
– Reference Intervals
29
Reproducibility Studies for Precision
• Use matrix matched samples
• Intra-Assay (within-run) Precision > 20x
• Inter-Assay (between-run) Precision > 20x
• Select specimens near medical decision levels
– At least 2 control levels
• Calculate: mean, SD, CV%
Note: If you don’t have established control limits, and they are being
established during the experiment, revise limits every 5 days and
look for evidence of unacceptable runs.
Random Error
CLSI EP5
Experiments to Validate?
• FDA approved?
– Reportable Range
• Linearity
– Precision
• Within-run precision
• Total precision and QC ranges
– Accuracy
• Comparison of methods
– Reference Intervals
31
Method Comparison
What do I do?
1. List results from two methods in pairs
- Each pair represents the same sample
X – results of reference method
Y – results of new method
2. Create a scatter plot (plot the means of duplicates) if done
in duplicate)
- May also use a difference plot to analyze data
3. Look for outliers and data gaps
- Repeat both methods for outliers
- Try to fill in gaps or eliminate highest data during analysis
32
Method Comparison
What do I do?
4. Determine the correlation coefficient
Check if “r” > 0.975
Note - Linear regression analysis may not be valid if the
correlation coefficient is low.
33
The correlation coefficient - r
• “r” – a statistical term
• It indicates the extent of linear relationship
between the methods
• Ideally, r should be 1.00
• “r” can ranges from +1 to –1
34
Characteristics of r
 “r” influenced by range of values
• r < 0.975 may indicate that the range of data is too
limited
 “r” is influenced by random errors only
 Systematic error has no effect on r
• r is only used to assess linear relationship between methods
• Method accuracy should not be based on r
35
Method Comparison
What do I do?
5. Generate a “linear best fit line”
Y= mX + b
m = slope (indicates a proportional error)
b = intercept (indicates constant error)
36
Method Comparison
What do I do?
6. Evaluate linear regression line:
Evaluate slope
Slope = 0.900 = -10% proportional error
Slope = 1.100 = +10% proportional error
Intercept should be close to zero (indicating very small
constant bias)
May need to evaluate separate areas of the graph
independently.
37
Method Comparison
What do I do?
7. Calculate systematic error at medical decision levels
Use slope and intercept to calculate systematic error:
Yc= mX + b SE = Y – X
Yc = Calculated result on new method
X = Result from existing method
m = Slope observed in method comparison experiment
b = Intercept observed in method comparison experiment
38
Method Comparison
What do I do?
8. Compare result tracking over time. May be needed if:
Results are monitored over long intervals (trends)
The method comparison shows significant differences
between the two methods
Experiments to Validate?
• FDA approved?
– Reportable Range
• Linearity
– Precision
• Within-run precision
• Total precision and QC ranges
– Accuracy
• Comparison of methods
– Reference Intervals
• Normal Range
40
Reference
Interval
www.westgard.com
41
Reference Range Studies
• CLIA ‘88 requires verification of FDA approved
manufacture’s reference range
• Reference range study should reflect the
laboratory’s patient population
• Reference interval itself doesn't enter into the
decision on method acceptability
• Usually done last, but testing should be done over
several days.
• Data analysis will depend upon the distribution of
the results.
42
Reference Range Studies
• Validating a reference range: The number of
samples needed if age/sex not a factor:
– Verification of manufacturer’s range N > 20
• Used if using the manufacturer’s range and the test will be
used in the exact manner described by the manufacturer.
– Estimating a reference range N = 40-60
• Used if the manufacturer’s range is not adequate or if the use
of the test not conform exactly to the manufacturer’s
intended use.
– Establishing a reference range N > 120
• Non-FDA approved tests or if there will be significant changes
to the use of the method.
43
Reference Range Studies
• Transferring a reference range:
– New reference range is calculated based on the
systematic analytical differences between the two
methods.
– Can be done if the lab has previously established a
reference range and is changing methodology
– Acceptable, but not recommended method.
– Should be verified by running at least 20 samples.
– To reduce errors introduced by drift, transference
calculations should be limited to one method change.
44
Reference Range Studies
• “Divine judgment” of the Lab Director
– Use only when all other options are unavailable.
– May be needed for sub-population ranges.
– Use published data from respected sources.
Experiments to Validate?
• FDA approved?
– Reportable Range
• Linearity
– Precision
• Within-run precision
• Total precision and QC ranges
– Accuracy
• Comparison of methods
– Reference Intervals
46
Interference Studies
Materials in patient specimen that cause errors which are
independent of analyte concentration
• Include substances commonly found in serum or plasma, such as:
– Lipids (Lipemia)
– Hemoglobin (Hemolysis)
– Bilirubin (Icterus)
• Less common substances:
– Drugs
• Immunoassay Interferences:
– HAMA and other heterophile antibodies
– Specific antibodies
– Rheumatoid Factors
– Non-specific binding of immunoglobulins (sticky serum, “anti-plastic”)
• Anticoagulants
47
Interference Studies
From: www.westgard.com
48
Interference Studies – “to do” list
• The interfering substance is “spiked” into a
known sample (no analyte added)
• Added volume < 10%
• Run in duplicates
• Calculate interference (bias):
Bias = (sample + interference) - baseline sample
(sample + buffer/water)
49
Interferences in Immunoassays
• Non-specific binding
– High levels of immunoglobulins
– Immune complexes
• Interfering antibodies
– Rheumatoid factor
– Specific antibodies to the analyte
– Heterophile antibodies (antibodies to reagent non-
human proteins)
• High concentrations of these types of substances
may be difficult to obtain. Interference studies
may require “mixing experiments”.
50
Put Method On Line
• Write and test a procedure!
– CLSI protocol (GP2)
– Maintenance
– Calibration
– Control system
• Staff training
• Document Method Evaluation experiments
according to appropriate regulations
• Start routine service
• Monitor performance
Self Assessment Questions
1. Which of the following is a step in method
validation?
a) Error assessment
b) Vendor consultation
c) FDA approval
d) Dissociative statistics
2. The lower limit of quantitation is defined as:
a) The lowest number that will almost always have
a non-zero result
b) The lowest concentration that can be
distinguished from background
c) The lowest concentration that can be quantified
reliably
d) None of the above
3. The range of analyte where results are
proportional to the true concentration of
analyte in the sample without modification
defines which of the following?
a) Clinical reportable range
b) Precision
c) Analytical measurement range
d) Accuracy
4. When evaluating a linear regression line (y =
mx + b), which of the following denotes the
lowest level of proportional and constant
bias?
a) y = .28x + .94
b) y = 1.15x + .25
c) y = 1.05x - .04
d) y = .34x + 1.00

method_validation_molinaro_laboratory.pdf

  • 1.
    Method Validation Ross Molinaro,PhD, MT(ASCP), DABCC, FACB Emory University Atlanta, GA
  • 2.
    Learning Objectives After thispresentation, you should be able to: 1. Define method evaluation. 2. List the steps needed to complete a method evaluation study. 3. Define total allowable error (TEa). 4. Apply TEa to method evaluation. 5. Describe recommendations for Sigma values.
  • 3.
    Looking to implementa clinical test? • Establish the need • Clinical performance – Clinical sensitivity – Clinical specificity • Define the performance standards – Costs/efficiencies/space – Turn around times/sample requirements – Analytical Quality (from kit insert, references) • Select the new method  Evaluate the new method • Implement the new method
  • 4.
    What is methodevaluation? • Determination of: – analytical performance characteristics – clinical performance characteristics • Validation – Objective evidence that requirements for a specific intended use can be fulfilled consistently • Verification – Objective evidence that requirements have been fulfilled
  • 5.
    What do youdo? • FDA approved? – Clinical Laboratory Improvement Amendments (CLIA) requirements – Match performance specs established by the manufacturer • Accuracy • Precision • Reportable Range • Verify manufacturer’s reference intervals • Determine test system calibration and control procedures based on specs above • Document all activities Should be comparable to manufacture’s Should be smaller than CLIA requirement Appropriate for patient care
  • 6.
    Experiments to Validate? •FDA approved? – Reportable Range • Linearity – Precision • Within-run precision • Total precision and QC ranges – Accuracy • Comparison of methods – Reference Intervals
  • 7.
    Why? • Clinical significance- leads to accurate medical decisions • Required by CLIA*, CAP, and The Joint Commission (*Clinical Laboratory Improvements Amendments of 1988) • Pass proficiency testing • Improvements over existing methodology • Assay validation requirements vary: Non-FDA approved > FDA approved > Waived tests Today we are going to focus on FDA approved, non-waived tests
  • 8.
    Steps in MethodValidation 1) Define Goals 2) Error Assessment 3) Compare error vs. analytical goal
  • 9.
    9 1st Step inMethod Validation Define Goals • Accept that all lab measurements contain experimental error • What is an acceptable performance for: – Precision? – Accuracy? – Sensitivity? – Analytical measurement range?
  • 10.
    10 Define Goals  Laberror should be:  smaller than CLIA (or other regulatory) requirement: • CLIA / 2? • CLIA / 3? • CLIA / 4? • CLIA / 6?  consistent with manufacturer’s claims  compatible with patients’ care
  • 11.
    11 2nd Step inMethod Validation Error Assessment • Method validation assesses – Type of error – Magnitude of error – Clinical Significance of error • Literature guidelines • Physician input • Professional judgment
  • 12.
    12 3rd Step inMethod Validation Compare error vs. analytical goal Accept or reject your new method
  • 13.
    13 Accuracy and Precision Accuracy– closeness of measured value to the “true” value – bias Precision – dispersion of repeated measurements about the mean – reproducibility Reliability – Accuracy + Precision
  • 14.
    14 Systematic and RandomErrors X Y . . . . . . . . . . . . . . . . . . Y = mX + b Y=X+b Y=mX New method - Reference (old) method - X Y = X
  • 15.
    15 Total Analytical Error- TE TE = RE + SE RE SE Y Y - X X
  • 16.
    16 Systematic Error -Affects accuracy Systematic error (SE) - Bias • Types of systemic errors: – Proportional (indicated by slope) – Constant (indicated by intercept) – Proportional + Constant (Combination of both) – Caused by (examples): bad calibrators, bad reagents, bad pipettes, interference
  • 17.
    17 Random Error (RE)- Affects precision • May be caused by (for example): – Variability in volume of sample or reagent delivered – Changes in environment – Inconsistent handling of materials • Estimated by: – Standard deviation (SD) – Coefficient of variation (CV) – Correlation coefficient (r)
  • 18.
    18 Magnitude of Error– TE • TE is the total maximum error of a test as measured in the lab • TE is the sum of: random + systemic errors TE = RE + SE • Determined – For each given method – At various medical decision levels (XC)
  • 19.
    19 Total Allowable Error- TEA TEA is the total error permitted by CLIA, based on • Medical requirements • Best available analytical method • Compatible with proficiency testing expectations Goal: Total Analytical Error < Total Allowable Error TE < TEA Determined • Method specific • Measured at various Medical decision levels (XC)
  • 20.
    Ready to Validate? •FDA approved? – Reportable Range • Linearity – Precision • Within-run precision • Total precision and QC ranges – Accuracy • Comparison of methods – Reference Intervals
  • 21.
    21 AMR: Linearity Study •Analytical Measurement Range (AMR) – Range of analyte where results are proportional to the true concentration of analyte in the sample – Range over which the test can be performed w/o modification (e.g. no dilution) • Also called: Dynamic Range, and Reportable range • Determined in the lab by linearity experiments
  • 22.
    22 AMR vs. MD/C •Analytical Measurement Range – AMR – Range of analyte values that a method can directly measure w/o modification (no dilutions, concentrations, other pretreatments that are not part of the usual assay process) • Maximum Dilution/Concentration (formerly Clinically Reportable Range – CRR) – Range of analyte values which are clinically significant – Can be reported following modification (such as dilutions)
  • 23.
    23 AMR vs. MD/C Measurementrange should be medically useful if: • MD/C > AMR –Value higher than AMR: report as > X or dilute –Value lower than AMR : report as < X or concentrate If: MD/C < AMR - Limit AMR
  • 24.
    24 Linearity Study –“to do” list • Samples: – Ideal: Use “traceable” standards in matrix matched sample – Mix of very high with very low pt.’s samples are OK if conc. are known – Dilute high samples in acceptable matrix diluent • At least 5-7 different conc. points within the reportable range (5 – 95% of AMR), equally spaced is ideal • Testing is performed in duplicate • Run from lowest to highest (to avoid carryover) • Pipetting accuracy and precision is critical
  • 25.
    Limit of Detection •Limit of Blank (LoB): – The lowest concentration that can be distinguished from background (blank, zero) noise – Sometimes called limit of absence. – Calculated as: Mean conc. of blank zero (>20 replicates) + 2SD – This is the number provided in most kit inserts • Limit of Detection (LoD): – The lowest number that will almost always have a non-zero result (mean conc. of blank + 3 SD) Limit of Quantification (LoQ): – The lowest concentration that can be quantified reliably – Analyte lowest concentration where CV ≤ 20% (or other error goal) – Results with higher CV% have large random error, thus are not useful for clinical interpretation
  • 26.
    26 LOQ Experiments • Onlyneeded if MD/C begins – At or near zero – At or below the manufacturer’s stated AMR – Not necessary for most assays • Start with low end linearity study – Determine the low end AMR • Follow up with precision study – Calculate the precision (CV) at low end concentrations
  • 27.
  • 28.
    Experiments to Validate? •FDA approved? – Reportable Range • Linearity – Precision • Within-run precision • Total precision and QC ranges – Accuracy • Comparison of methods – Reference Intervals
  • 29.
    29 Reproducibility Studies forPrecision • Use matrix matched samples • Intra-Assay (within-run) Precision > 20x • Inter-Assay (between-run) Precision > 20x • Select specimens near medical decision levels – At least 2 control levels • Calculate: mean, SD, CV% Note: If you don’t have established control limits, and they are being established during the experiment, revise limits every 5 days and look for evidence of unacceptable runs. Random Error CLSI EP5
  • 30.
    Experiments to Validate? •FDA approved? – Reportable Range • Linearity – Precision • Within-run precision • Total precision and QC ranges – Accuracy • Comparison of methods – Reference Intervals
  • 31.
    31 Method Comparison What doI do? 1. List results from two methods in pairs - Each pair represents the same sample X – results of reference method Y – results of new method 2. Create a scatter plot (plot the means of duplicates) if done in duplicate) - May also use a difference plot to analyze data 3. Look for outliers and data gaps - Repeat both methods for outliers - Try to fill in gaps or eliminate highest data during analysis
  • 32.
    32 Method Comparison What doI do? 4. Determine the correlation coefficient Check if “r” > 0.975 Note - Linear regression analysis may not be valid if the correlation coefficient is low.
  • 33.
    33 The correlation coefficient- r • “r” – a statistical term • It indicates the extent of linear relationship between the methods • Ideally, r should be 1.00 • “r” can ranges from +1 to –1
  • 34.
    34 Characteristics of r “r” influenced by range of values • r < 0.975 may indicate that the range of data is too limited  “r” is influenced by random errors only  Systematic error has no effect on r • r is only used to assess linear relationship between methods • Method accuracy should not be based on r
  • 35.
    35 Method Comparison What doI do? 5. Generate a “linear best fit line” Y= mX + b m = slope (indicates a proportional error) b = intercept (indicates constant error)
  • 36.
    36 Method Comparison What doI do? 6. Evaluate linear regression line: Evaluate slope Slope = 0.900 = -10% proportional error Slope = 1.100 = +10% proportional error Intercept should be close to zero (indicating very small constant bias) May need to evaluate separate areas of the graph independently.
  • 37.
    37 Method Comparison What doI do? 7. Calculate systematic error at medical decision levels Use slope and intercept to calculate systematic error: Yc= mX + b SE = Y – X Yc = Calculated result on new method X = Result from existing method m = Slope observed in method comparison experiment b = Intercept observed in method comparison experiment
  • 38.
    38 Method Comparison What doI do? 8. Compare result tracking over time. May be needed if: Results are monitored over long intervals (trends) The method comparison shows significant differences between the two methods
  • 39.
    Experiments to Validate? •FDA approved? – Reportable Range • Linearity – Precision • Within-run precision • Total precision and QC ranges – Accuracy • Comparison of methods – Reference Intervals • Normal Range
  • 40.
  • 41.
    41 Reference Range Studies •CLIA ‘88 requires verification of FDA approved manufacture’s reference range • Reference range study should reflect the laboratory’s patient population • Reference interval itself doesn't enter into the decision on method acceptability • Usually done last, but testing should be done over several days. • Data analysis will depend upon the distribution of the results.
  • 42.
    42 Reference Range Studies •Validating a reference range: The number of samples needed if age/sex not a factor: – Verification of manufacturer’s range N > 20 • Used if using the manufacturer’s range and the test will be used in the exact manner described by the manufacturer. – Estimating a reference range N = 40-60 • Used if the manufacturer’s range is not adequate or if the use of the test not conform exactly to the manufacturer’s intended use. – Establishing a reference range N > 120 • Non-FDA approved tests or if there will be significant changes to the use of the method.
  • 43.
    43 Reference Range Studies •Transferring a reference range: – New reference range is calculated based on the systematic analytical differences between the two methods. – Can be done if the lab has previously established a reference range and is changing methodology – Acceptable, but not recommended method. – Should be verified by running at least 20 samples. – To reduce errors introduced by drift, transference calculations should be limited to one method change.
  • 44.
    44 Reference Range Studies •“Divine judgment” of the Lab Director – Use only when all other options are unavailable. – May be needed for sub-population ranges. – Use published data from respected sources.
  • 45.
    Experiments to Validate? •FDA approved? – Reportable Range • Linearity – Precision • Within-run precision • Total precision and QC ranges – Accuracy • Comparison of methods – Reference Intervals
  • 46.
    46 Interference Studies Materials inpatient specimen that cause errors which are independent of analyte concentration • Include substances commonly found in serum or plasma, such as: – Lipids (Lipemia) – Hemoglobin (Hemolysis) – Bilirubin (Icterus) • Less common substances: – Drugs • Immunoassay Interferences: – HAMA and other heterophile antibodies – Specific antibodies – Rheumatoid Factors – Non-specific binding of immunoglobulins (sticky serum, “anti-plastic”) • Anticoagulants
  • 47.
  • 48.
    48 Interference Studies –“to do” list • The interfering substance is “spiked” into a known sample (no analyte added) • Added volume < 10% • Run in duplicates • Calculate interference (bias): Bias = (sample + interference) - baseline sample (sample + buffer/water)
  • 49.
    49 Interferences in Immunoassays •Non-specific binding – High levels of immunoglobulins – Immune complexes • Interfering antibodies – Rheumatoid factor – Specific antibodies to the analyte – Heterophile antibodies (antibodies to reagent non- human proteins) • High concentrations of these types of substances may be difficult to obtain. Interference studies may require “mixing experiments”.
  • 50.
    50 Put Method OnLine • Write and test a procedure! – CLSI protocol (GP2) – Maintenance – Calibration – Control system • Staff training • Document Method Evaluation experiments according to appropriate regulations • Start routine service • Monitor performance
  • 51.
    Self Assessment Questions 1.Which of the following is a step in method validation? a) Error assessment b) Vendor consultation c) FDA approval d) Dissociative statistics
  • 52.
    2. The lowerlimit of quantitation is defined as: a) The lowest number that will almost always have a non-zero result b) The lowest concentration that can be distinguished from background c) The lowest concentration that can be quantified reliably d) None of the above
  • 53.
    3. The rangeof analyte where results are proportional to the true concentration of analyte in the sample without modification defines which of the following? a) Clinical reportable range b) Precision c) Analytical measurement range d) Accuracy
  • 54.
    4. When evaluatinga linear regression line (y = mx + b), which of the following denotes the lowest level of proportional and constant bias? a) y = .28x + .94 b) y = 1.15x + .25 c) y = 1.05x - .04 d) y = .34x + 1.00