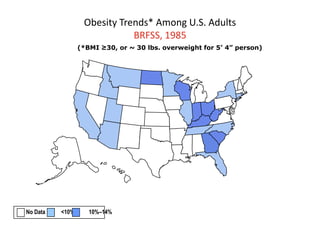
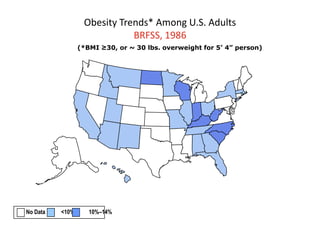
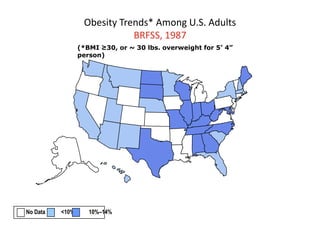
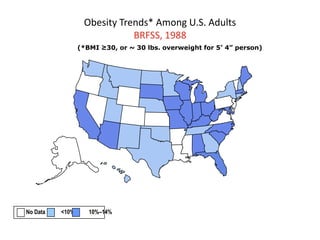
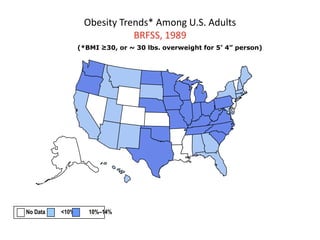
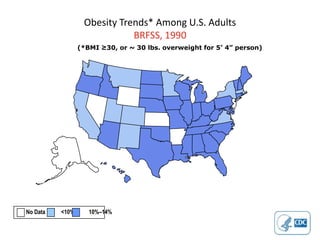
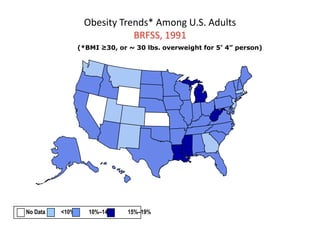
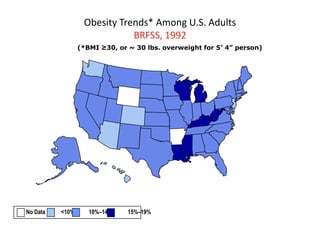
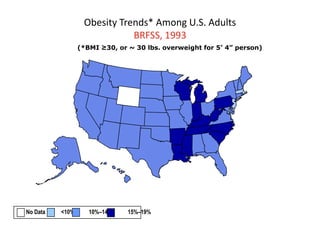
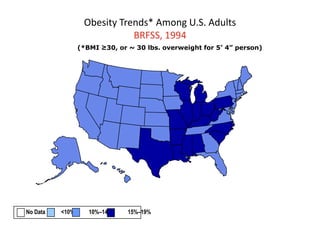
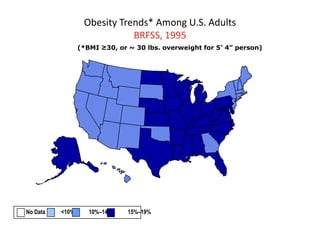
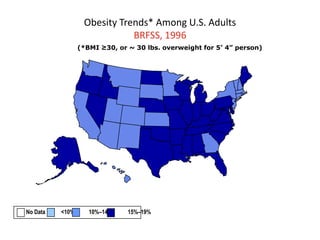
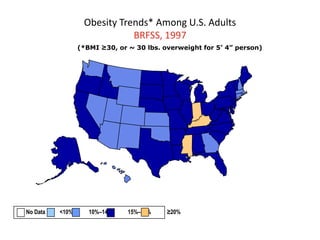
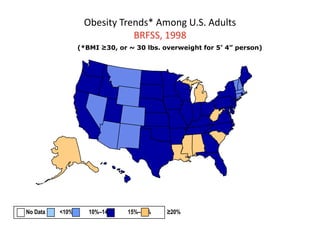
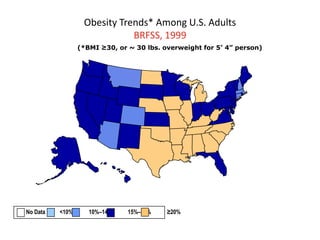
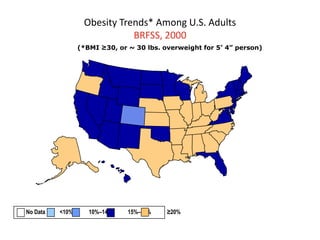
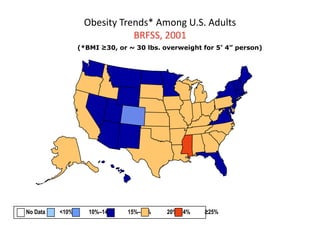
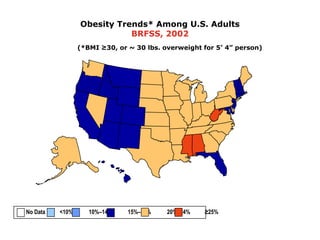
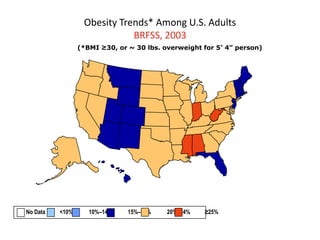
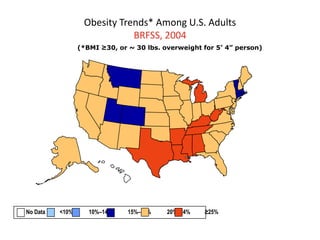
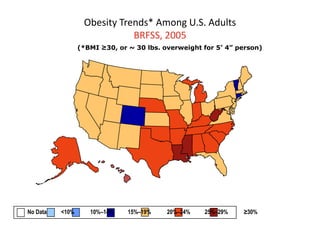
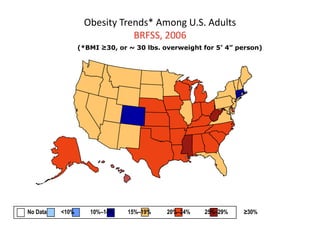
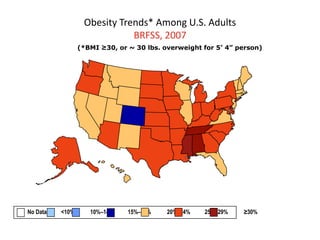
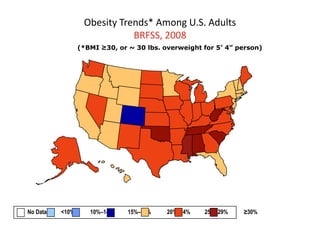
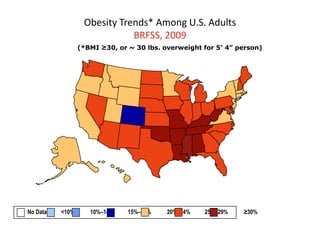
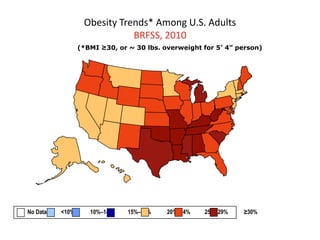
This document shows maps of the United States from 1985 to 2010 tracking obesity trends among U.S. adults based on data from the Behavioral Risk Factor Surveillance System. The maps use color coding to indicate obesity rates in different states, ranging from less than 10% to over 30%, showing that over this 25 year period obesity rates increased nationwide and more states had higher rates over 25%.


![CASE_PRESENTATION_ON_subdural_hematoma(SDH)[1 FINAL PPT]-1.pptx](https://cdn.slidesharecdn.com/ss_thumbnails/casepresentationonsubduralhematomasdh1finalppt-1-260129172522-d405d375-thumbnail.jpg?width=640&height=640&fit=bounds)


