Download to read offline

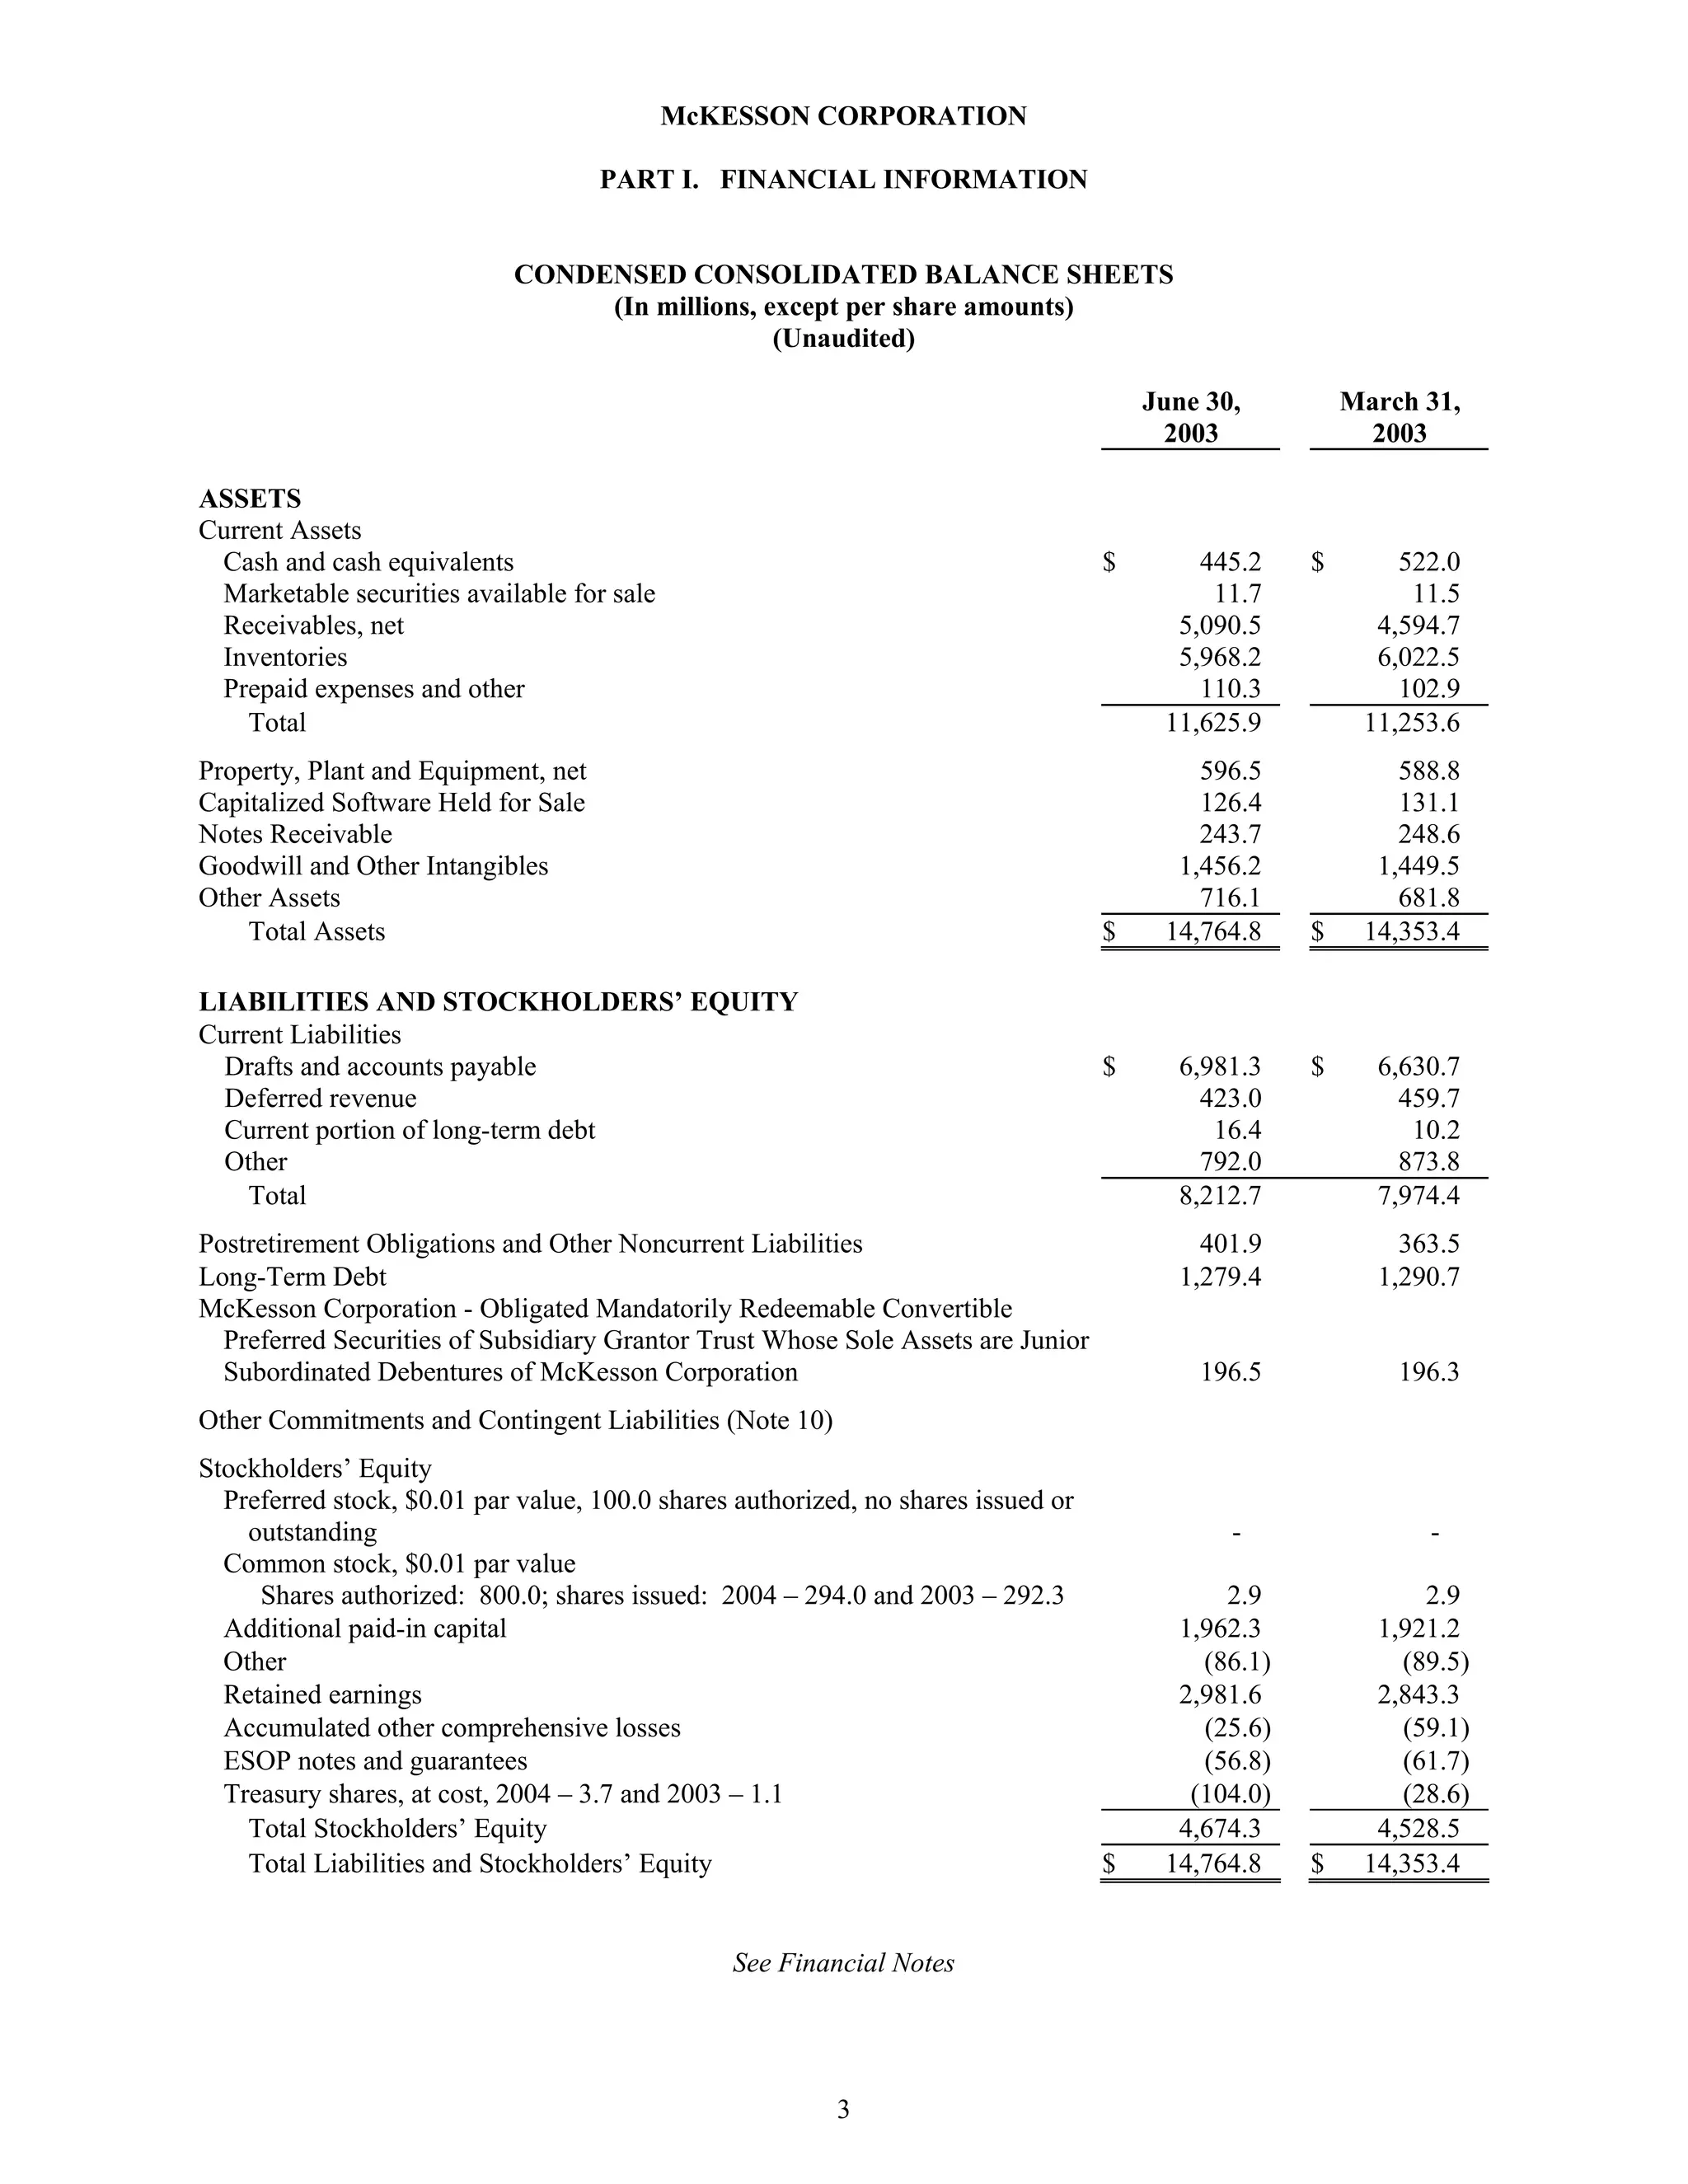

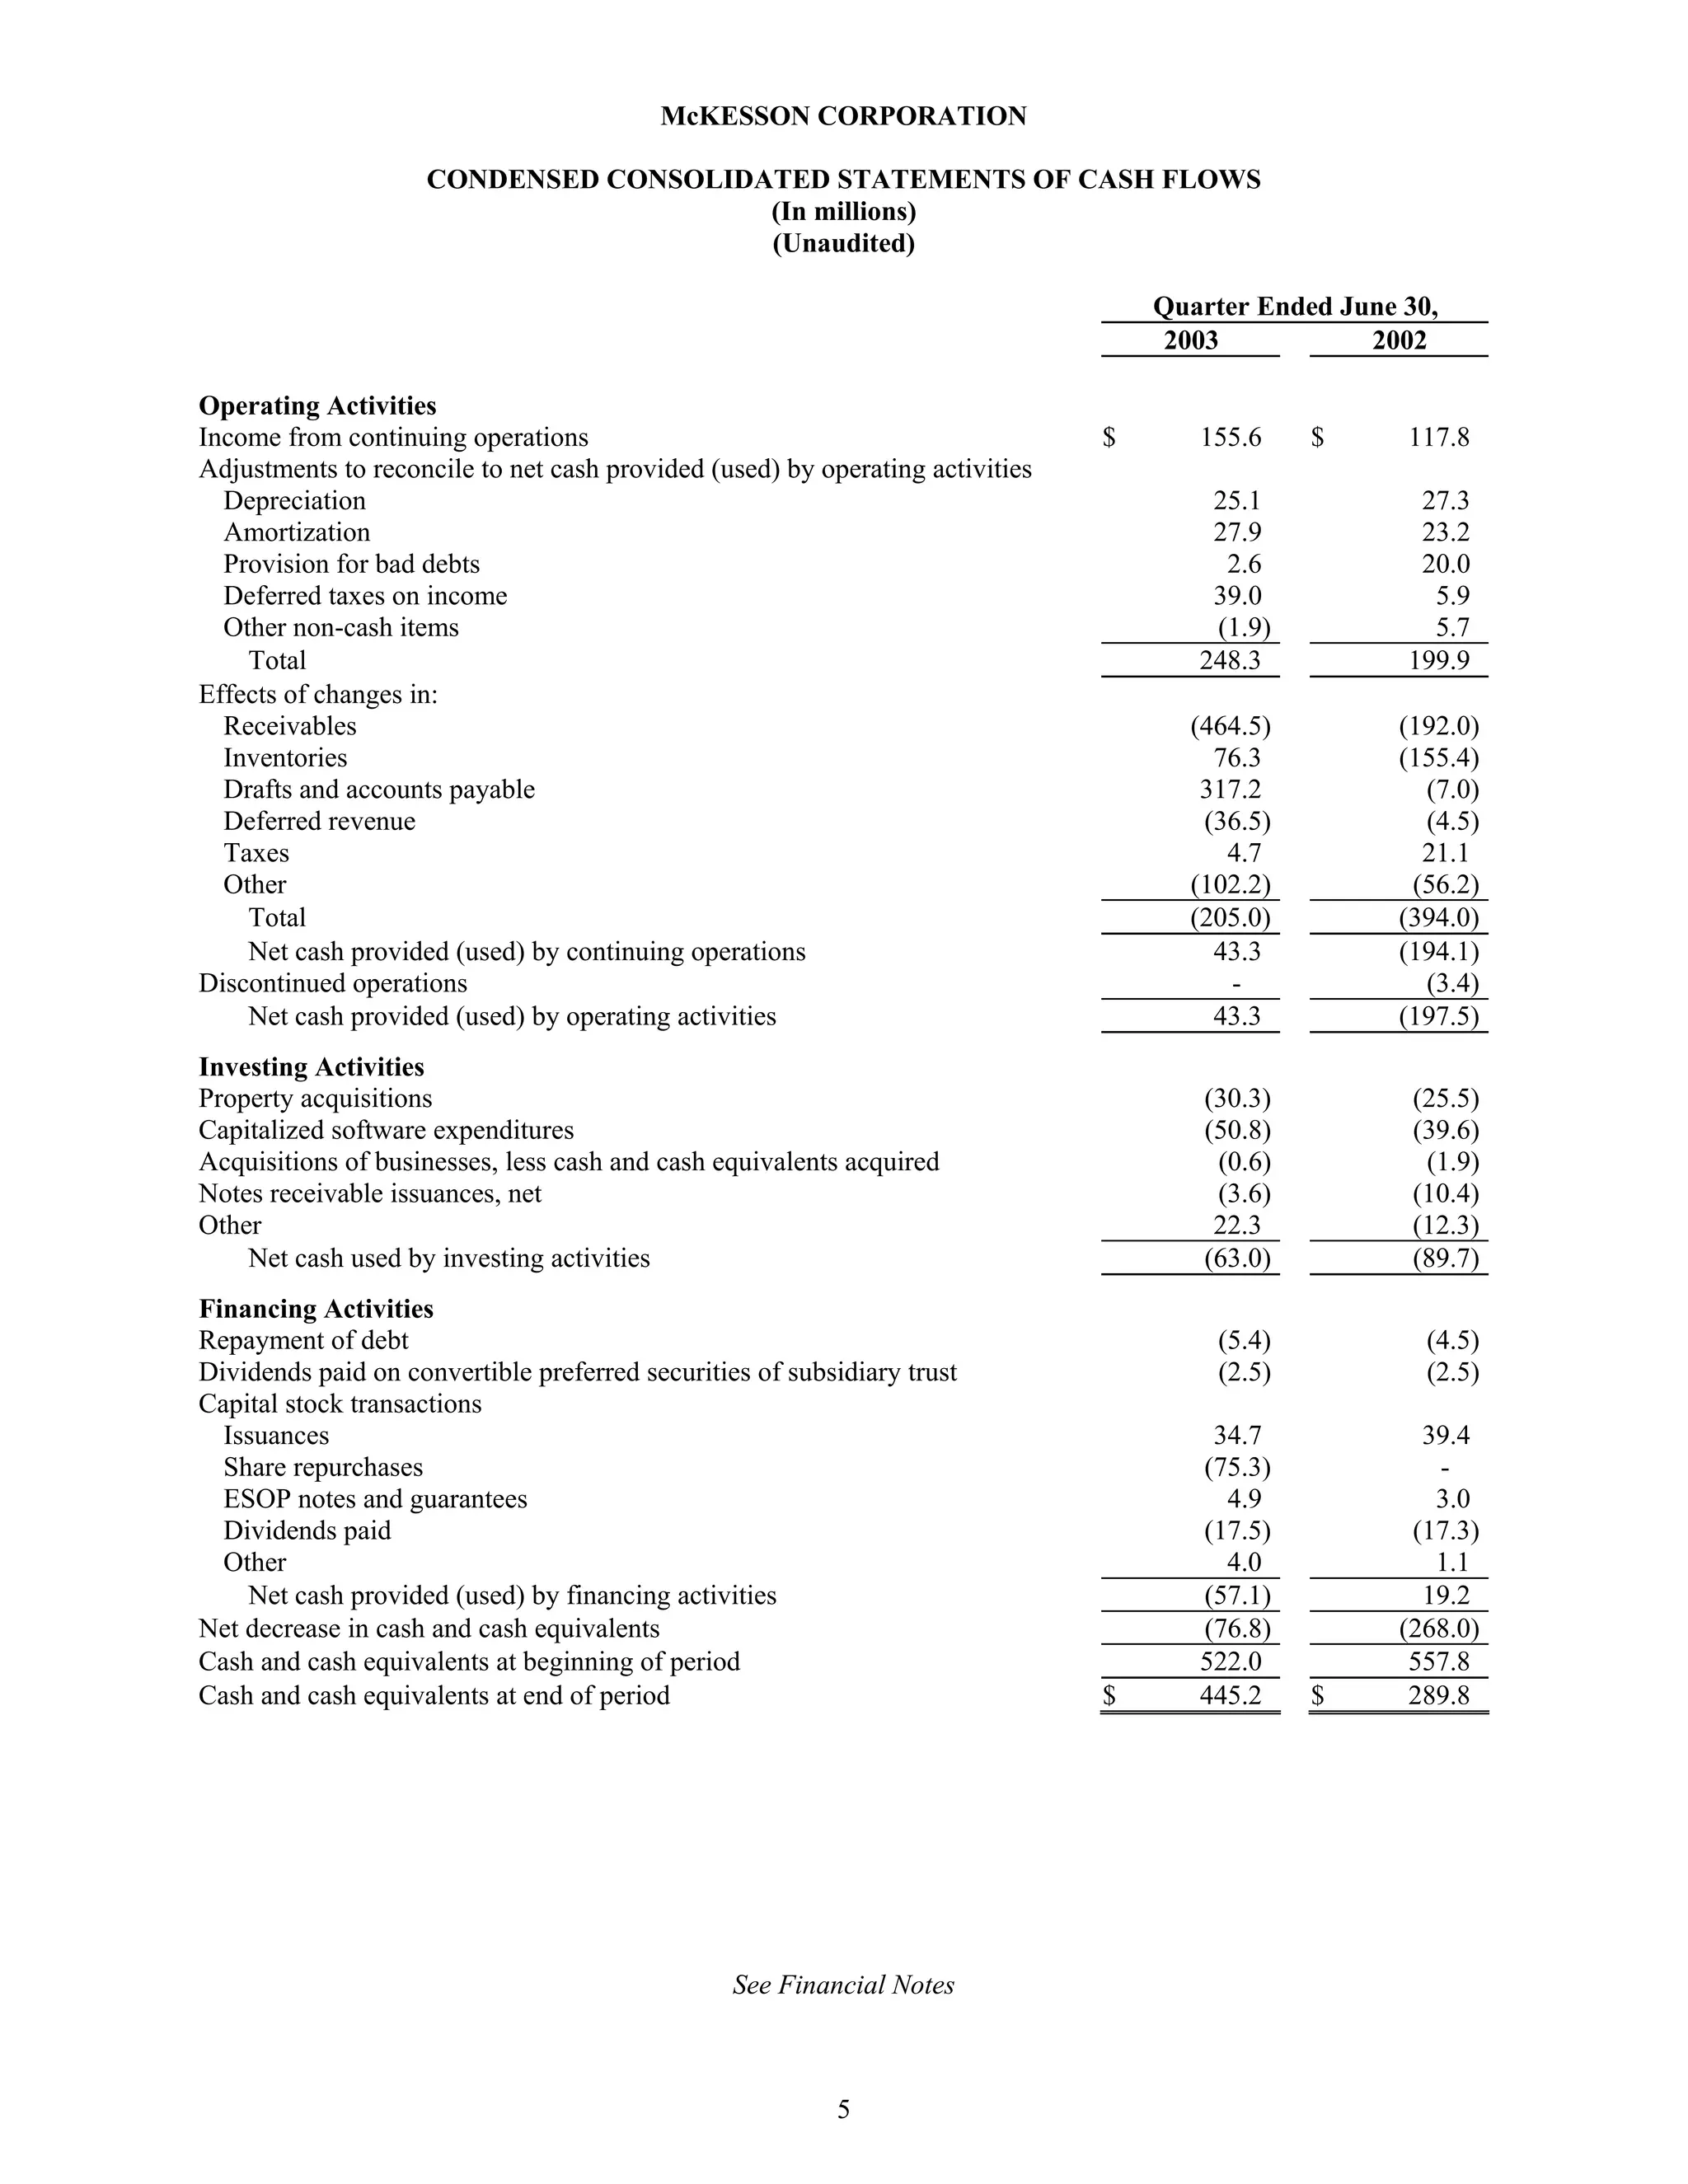
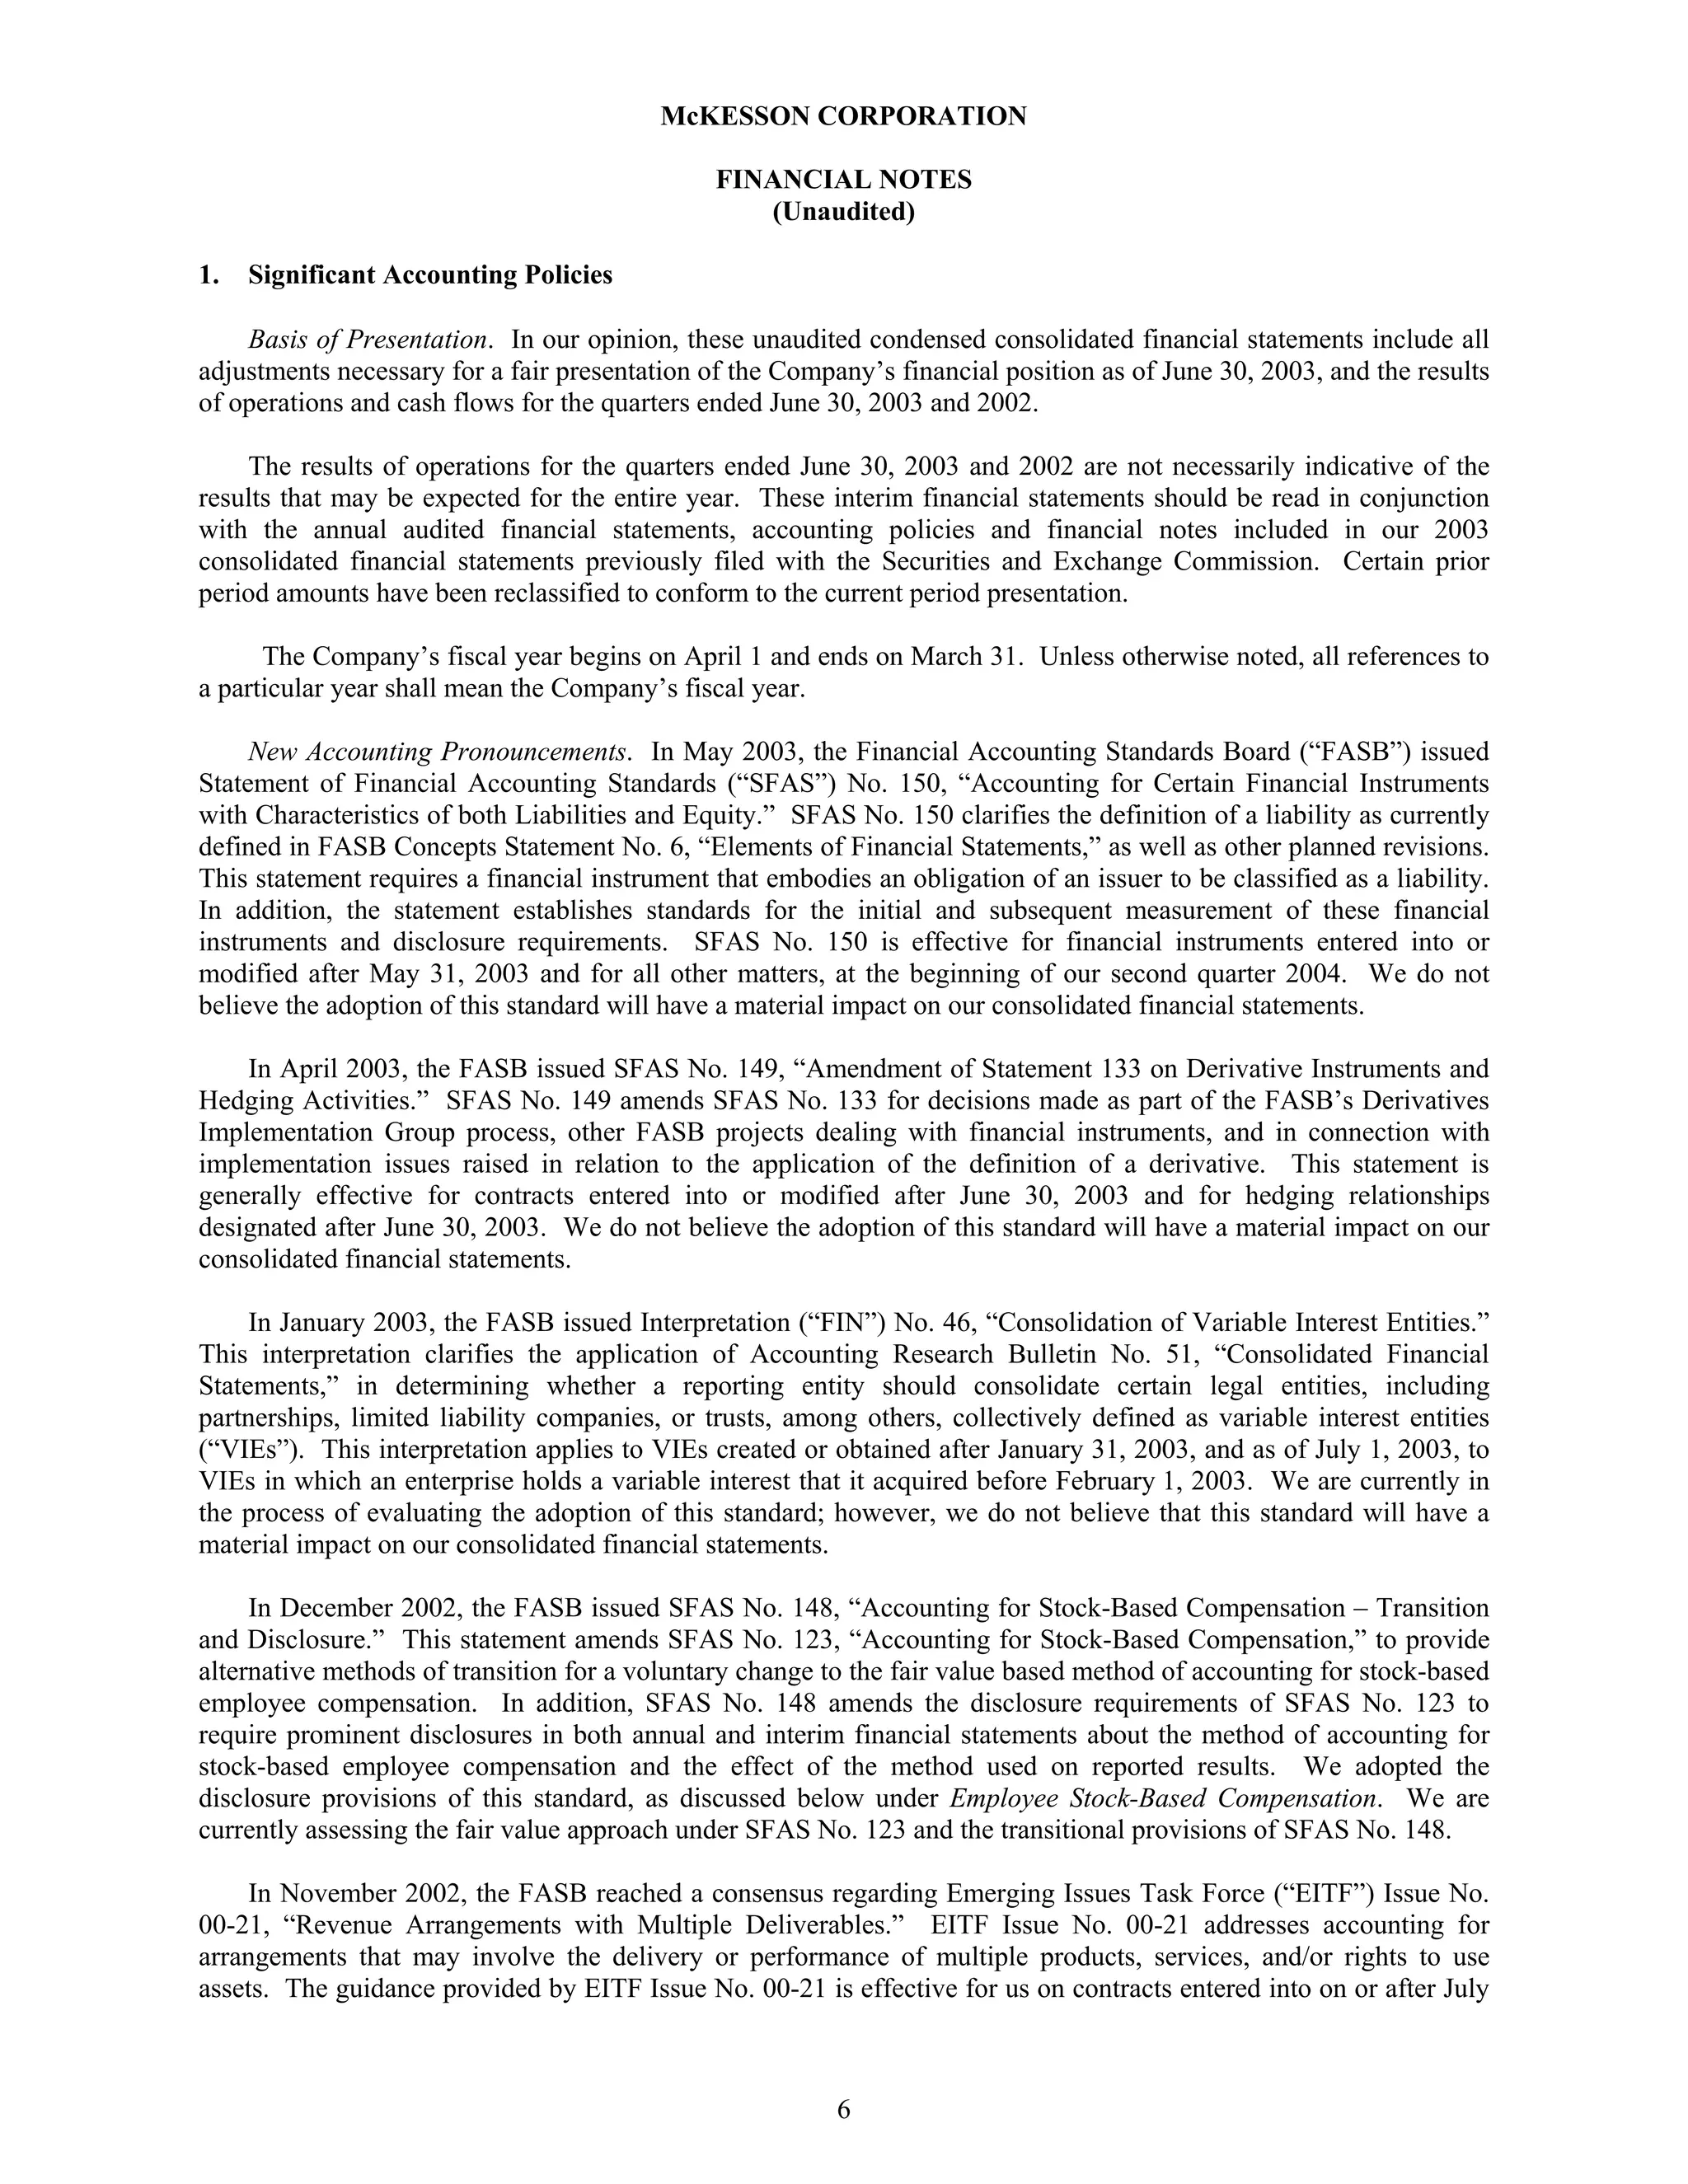


This document is McKesson Corporation's Form 10-Q quarterly report filed with the SEC for the quarter ended June 30, 2003. It includes condensed consolidated financial statements and notes. The financial statements show that for the quarter ended June 30, 2003, McKesson's revenues increased 21% to $16.5 billion compared to the same period in 2002, while net income increased 33% to $155.6 million. McKesson's total assets as of June 30, 2003 were $14.8 billion, with current assets of $11.6 billion including $5.1 billion in receivables and $6 billion in inventories.


