SlideShare a Scribd company logo
1 of 24
Download to read offline
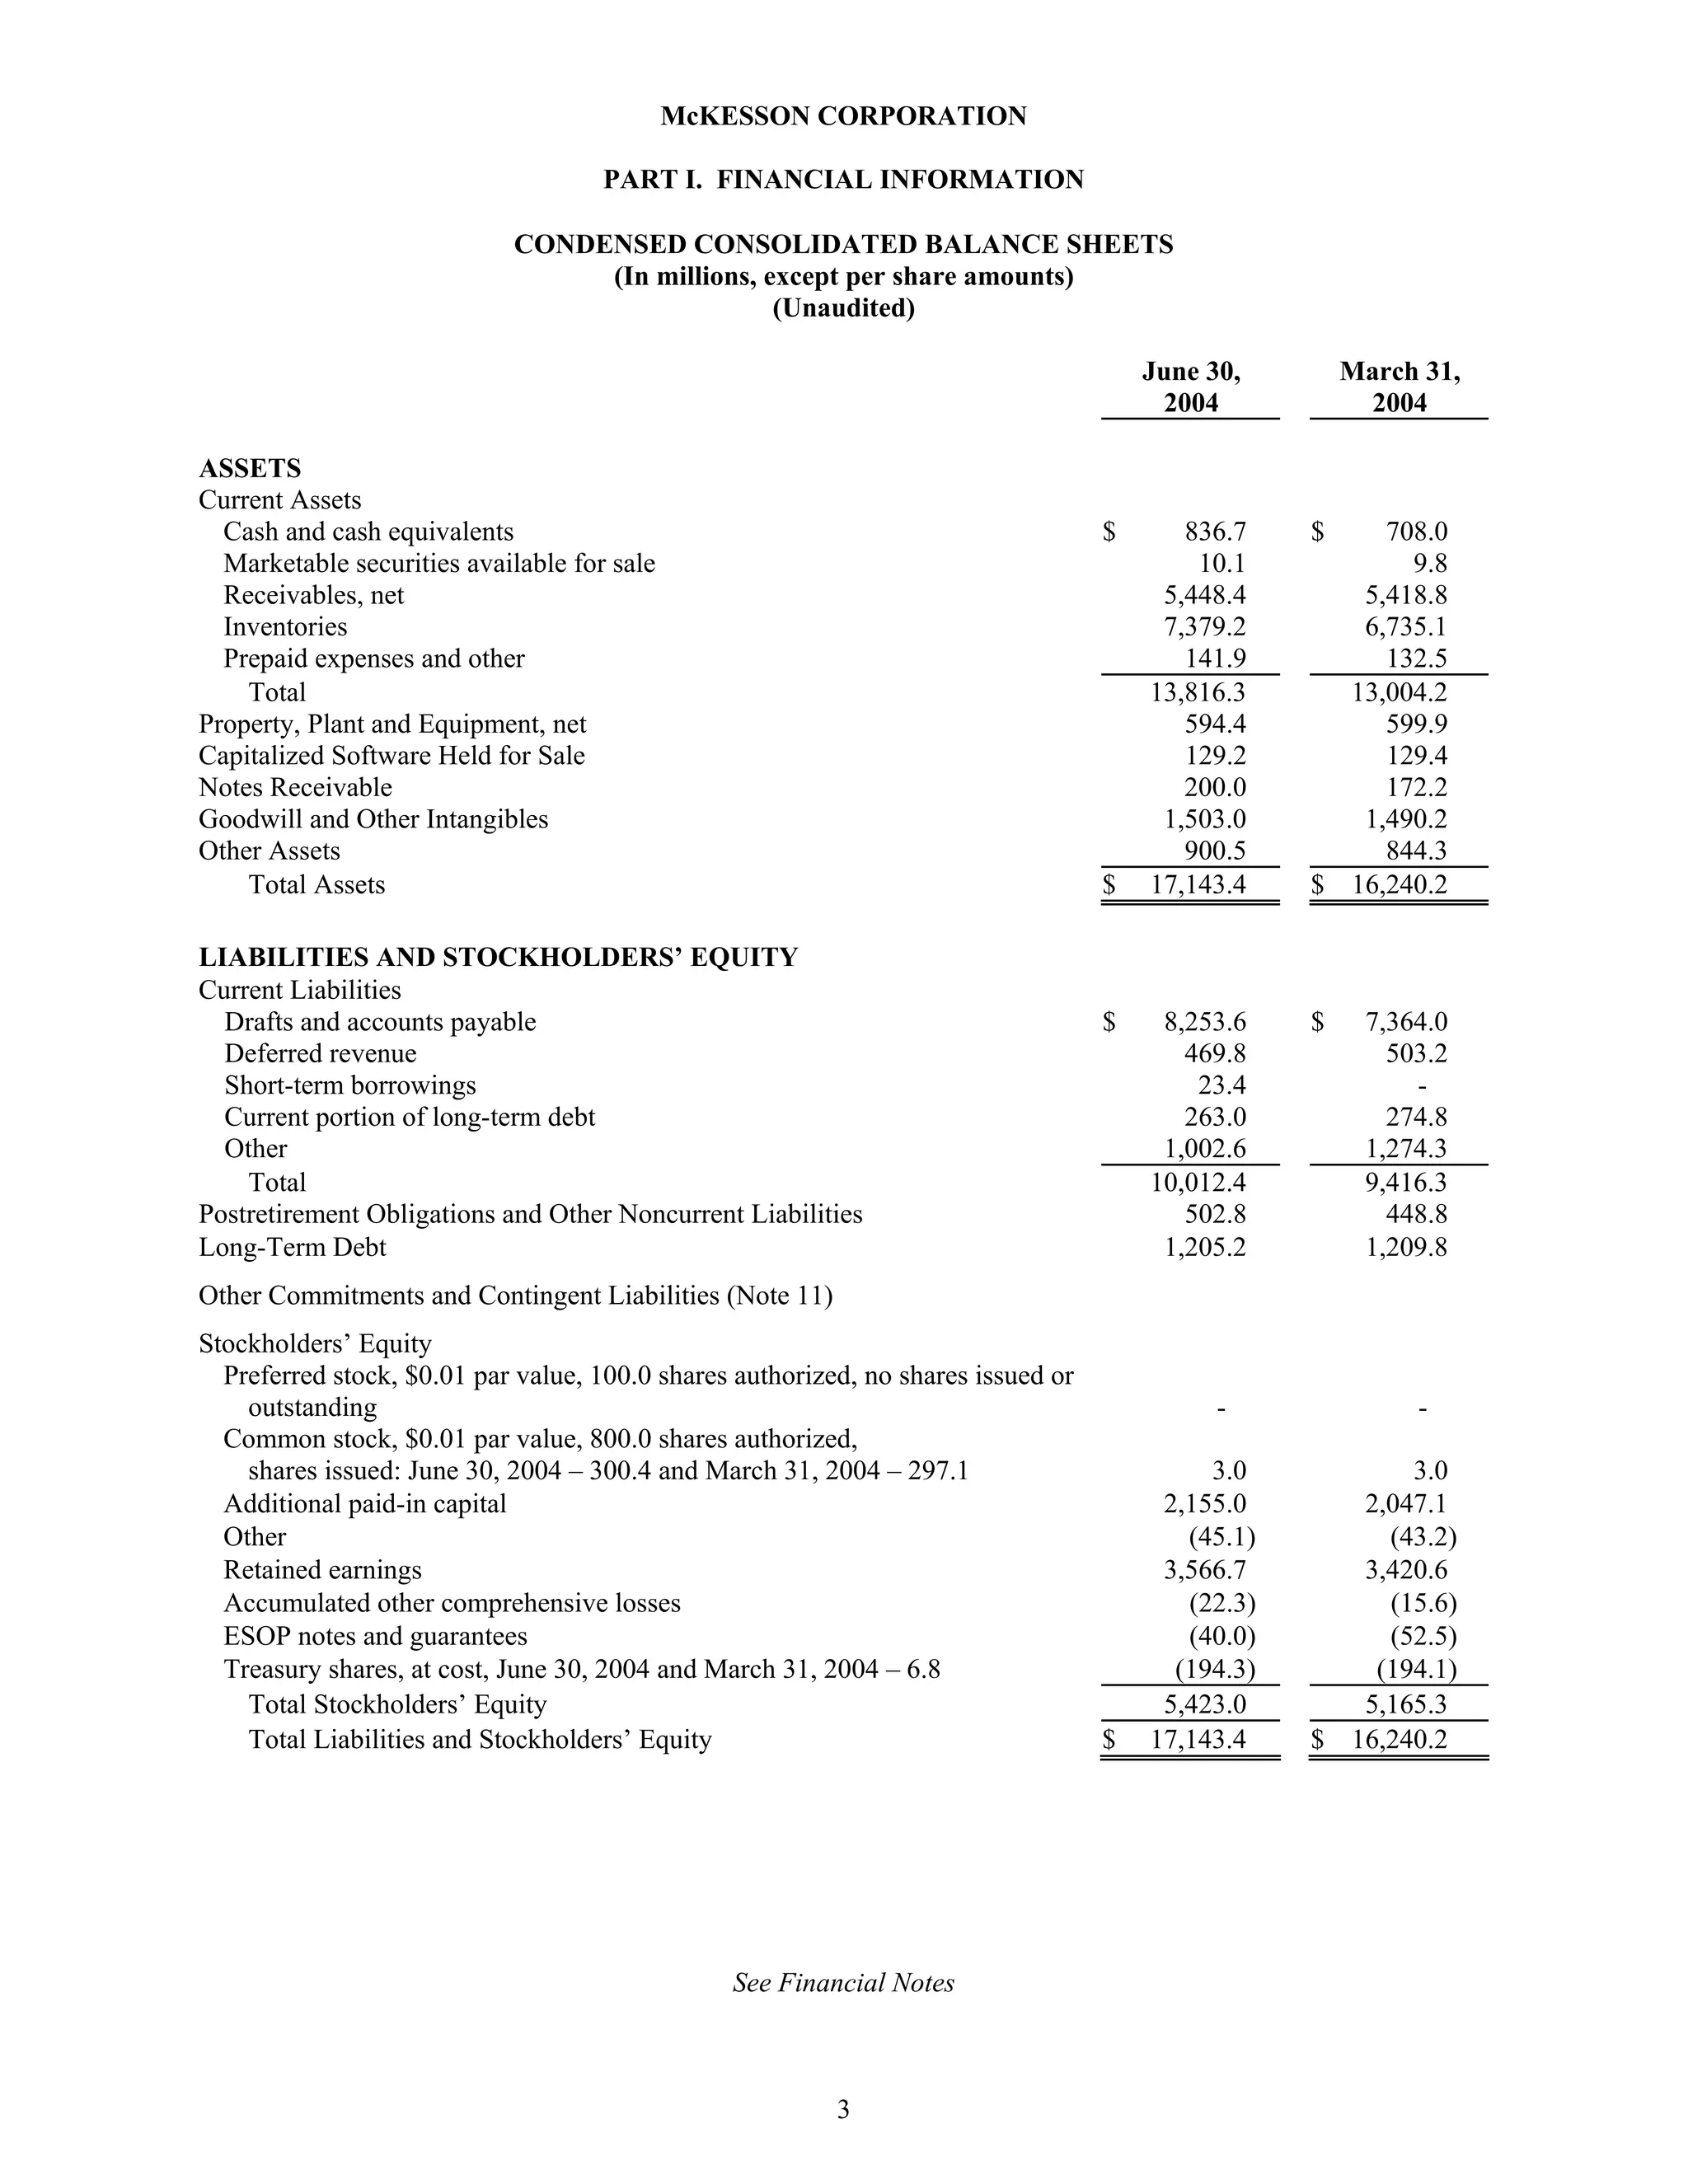
SECURITIES AND EXCHANGE COMMISSION
                                                  Washington, D.C. 20549


                                                         FORM 10-Q

(Mark One)


   ⌧ QUARTERLY REPORT PURSUANT TO SECTION 13 OR 15(d) OF THE SECURITIES EXCHANGE
ACT OF 1934

         For quarter ended June 30, 2004

      TRANSITION REPORT PURSUANT TO SECTION 13 OR 15(d) OF THE SECURITIES EXCHANGE
ACT OF 1934

         For the transition period from                         to

                                                Commission file number 1-13252


                                 McKESSON CORPORATION
                                          (Exact name of Registrant as specified in its charter)


                           Delaware                                                                94-3207296
   (State or other jurisdiction of incorporation or organization)                     (IRS Employer Identification No.)


      One Post Street, San Francisco, California                                                     94104
              (Address of principal executive offices)                                              (Zip Code)

                                                           (415) 983-8300
                                         (Registrant’s telephone number, including area code)

    Indicate by check mark whether the Registrant (1) has filed all reports required to be filed by Section 13 or
15(d) of the Securities Exchange Act of 1934 during the preceding 12 months (or for such shorter period that the
Registrant was required to file such reports), and (2) has been subject to such filing requirements for the past 90
days. Yes ⌧ No

    Indicate by check mark whether the registrant is an accelerated filer. Yes ⌧                      No

    Indicate the number of shares outstanding of each of the issuer’s classes of common stock, as of the latest
practicable date.


                        Class                                                        Outstanding at June 30, 2004
              Common stock, $0.01 par value                                               293,590,306 shares


                                                                     1
McKESSON CORPORATION

                                                             TABLE OF CONTENTS


Item                                                                                                                                                    Page
                                                PART I. FINANCIAL INFORMATION

1.     Condensed Financial Statements

       Consolidated Balance Sheets
          June 30, 2004 and March 31, 2004 ......................................................................................                          3

       Consolidated Statements of Operations
          Quarter ended June 30, 2004 and 2003 ................................................................................                            4

       Consolidated Statements of Cash Flows
          Quarter ended June 30, 2004 and 2003 ................................................................................                            5

       Financial Notes............................................................................................................................       6-14

2.     Management’s Discussion and Analysis of Results of Operations and Financial Condition
          Financial Review..................................................................................................................            15-20

3.     Quantitative and Qualitative Disclosures about Market Risk......................................................                                   20

4.     Controls and Procedures..............................................................................................................              20

                                                   PART II. OTHER INFORMATION

1.     Legal Proceedings .......................................................................................................................          21

2.     Changes in Securities, Use of Proceeds and Issuer Purchases of Equity Securities....................                                               21

6.     Exhibits and Reports on Form 8-K..............................................................................................                     21

       Signatures....................................................................................................................................     21


                                                                                2
McKESSON CORPORATION

                                     PART I. FINANCIAL INFORMATION

                            CONDENSED CONSOLIDATED BALANCE SHEETS
                                 (In millions, except per share amounts)
                                                (Unaudited)

                                                                                       June 30,        March 31,
                                                                                        2004            2004

ASSETS
Current Assets
  Cash and cash equivalents                                                        $      836.7    $    708.0
  Marketable securities available for sale                                                 10.1           9.8
  Receivables, net                                                                      5,448.4       5,418.8
  Inventories                                                                           7,379.2       6,735.1
  Prepaid expenses and other                                                              141.9         132.5
    Total                                                                              13,816.3      13,004.2
Property, Plant and Equipment, net                                                        594.4         599.9
Capitalized Software Held for Sale                                                        129.2         129.4
Notes Receivable                                                                          200.0         172.2
Goodwill and Other Intangibles                                                          1,503.0       1,490.2
Other Assets                                                                              900.5         844.3
    Total Assets                                                                   $   17,143.4    $ 16,240.2

LIABILITIES AND STOCKHOLDERS’ EQUITY
Current Liabilities
  Drafts and accounts payable                                                      $    8,253.6    $    7,364.0
  Deferred revenue                                                                        469.8           503.2
  Short-term borrowings                                                                    23.4             -
  Current portion of long-term debt                                                       263.0           274.8
  Other                                                                                 1,002.6         1,274.3
    Total                                                                              10,012.4         9,416.3
Postretirement Obligations and Other Noncurrent Liabilities                               502.8           448.8
Long-Term Debt                                                                          1,205.2         1,209.8
Other Commitments and Contingent Liabilities (Note 11)
Stockholders’ Equity
  Preferred stock, $0.01 par value, 100.0 shares authorized, no shares issued or
    outstanding                                                                              -              -
  Common stock, $0.01 par value, 800.0 shares authorized,
    shares issued: June 30, 2004 – 300.4 and March 31, 2004 – 297.1                         3.0           3.0
  Additional paid-in capital                                                            2,155.0       2,047.1
  Other                                                                                   (45.1)        (43.2)
  Retained earnings                                                                     3,566.7       3,420.6
  Accumulated other comprehensive losses                                                  (22.3)        (15.6)
  ESOP notes and guarantees                                                               (40.0)        (52.5)
  Treasury shares, at cost, June 30, 2004 and March 31, 2004 – 6.8                       (194.3)       (194.1)
    Total Stockholders’ Equity                                                          5,423.0       5,165.3
    Total Liabilities and Stockholders’ Equity                                     $   17,143.4    $ 16,240.2


                                                See Financial Notes


                                                          3
McKESSON CORPORATION

                     CONDENSED CONSOLIDATED STATEMENTS OF OPERATIONS
                               (In millions, except per share amounts)
                                              (Unaudited)
                                                                       Quarter Ended June 30,
                                                                        2004           2003


Revenues                                                             $   19,186.6    $ 16,524.2
Cost of Sales                                                            18,334.6      15,737.7
Gross Profit                                                               852.0          786.5
Operating Expenses                                                         591.2          534.9
Operating Income                                                           260.8          251.6
Interest Expense                                                            (29.6)        (29.8)
Other Income, Net                                                            14.9          11.9
Income Before Income Taxes                                                 246.1          233.7
Income Taxes                                                               (82.5)         (78.1)
Net Income                                                           $     163.6     $    155.6

Earnings Per Common Share
  Diluted                                                            $       0.55    $     0.53
  Basic                                                              $       0.56    $     0.54

Dividends Declared Per Common Share                                  $       0.06    $     0.06

Weighted Average Shares
 Diluted                                                                   300.1          298.1
 Basic                                                                     291.4          289.8


                                          See Financial Notes


                                                  4
McKESSON CORPORATION

                    CONDENSED CONSOLIDATED STATEMENTS OF CASH FLOWS
                                       (In millions)
                                       (Unaudited)
                                                             Quarter Ended June 30,
                                                              2004           2003

Operating Activities
Net income                                                                      $   163.6     $   155.6
Adjustments to reconcile to net cash provided (used) by operating activities:
  Depreciation                                                                       27.4          25.1
  Amortization                                                                       33.9          27.9
  Provision for bad debts                                                             6.7           2.6
  Deferred taxes on income                                                          107.2          39.0
  Other non-cash items                                                               (1.0)         (1.9)
    Total                                                                           337.8         248.3
Effects of changes in:
  Receivables                                                                        (65.9)       (464.5)
  Inventories                                                                       (636.4)         76.3
  Drafts and accounts payable                                                        664.1         317.2
  Deferred revenue                                                                   (35.3)        (36.5)
  Taxes                                                                              (49.2)          4.7
  Other                                                                              (86.8)       (104.7)
    Total                                                                           (209.5)       (207.5)
    Net cash provided by operating activities                                        128.3          40.8
Investing Activities
Property acquisitions                                                                (22.9)        (30.3)
Capitalized software expenditures                                                    (37.0)        (50.8)
Acquisitions of businesses, less cash and cash equivalents acquired                  (37.4)         (0.6)
Notes receivable issuances, net                                                      (28.0)         (4.0)
Proceeds from sale of notes receivable                                                21.0           -
Proceeds from sale of business                                                        12.3           -
Other                                                                                 (4.8)         22.3
    Net cash used by investing activities                                            (96.8)        (63.4)
Financing Activities
Proceeds from issuance of debt                                                        23.4           -
Repayment of debt                                                                    (12.9)         (5.4)
Capital stock transactions:
  Issuances                                                                          83.0          34.7
  Share repurchases                                                                   -           (75.3)
  ESOP notes and guarantees                                                          12.5           4.9
  Dividends paid                                                                    (17.5)        (17.5)
  Other                                                                               8.7           4.4
    Net cash provided (used) by financing activities                                 97.2         (54.2)
Net increase (decrease) in cash and cash equivalents                                128.7         (76.8)
Cash and cash equivalents at beginning of period                                    708.0         522.0
Cash and cash equivalents at end of period                                      $   836.7     $   445.2


                                                See Financial Notes


                                                          5
McKESSON CORPORATION
                                             FINANCIAL NOTES
                                                (Unaudited)

1.   Significant Accounting Policies

     Basis of Presentation. The condensed consolidated financial statements of McKesson Corporation
(“McKesson,” the “Company,” or “we” and other similar pronouns) include the financial statements of all majority-
owned or controlled companies. Significant intercompany transactions and balances have been eliminated. In our
opinion, these unaudited condensed consolidated financial statements include all adjustments necessary for a fair
presentation of the Company’s financial position as of June 30, 2004, and the results of operations and cash flows
for the quarters ended June 30, 2004 and 2003.

    The results of operations for the quarters ended June 30, 2004 and 2003 are not necessarily indicative of the
results that may be expected for the entire year. These interim financial statements should be read in conjunction
with the annual audited financial statements, accounting policies and financial notes included in our 2004
consolidated financial statements previously filed with the Securities and Exchange Commission (“SEC”). As
described in our Annual Report on Form 10-K for the year ended March 31, 2004, we reorganized our businesses on
April 1, 2004. This reorganization resulted in changes to our reporting segments. On April 29 and 30, 2004, we
provided financial information about this reorganization, as it relates to prior periods, in a Form 8-K. Certain prior
period amounts have been reclassified to conform to the current period presentation.

     The Company’s fiscal year begins on April 1 and ends on March 31. Unless otherwise noted, all references to a
particular year shall mean the Company’s fiscal year.

     New Accounting Pronouncements. In June 2001, the Financial Accounting Standards Board (“FASB”) issued
Statement of Financial Accounting Standard (“SFAS”) No. 143, “Accounting for Asset Retirement Obligations,”
which addresses financial accounting requirements for retirement obligations associated with tangible long-lived
assets. In May 2002, the FASB issued SFAS No. 145, “Rescission of FASB Statements 4, 44, 64, Amendment to
FASB Statement No. 13, and Technical Corrections as of April 2002.” SFAS No. 145 amends other existing
authoritative pronouncements to make various technical corrections, clarify meanings, or describe their applicability
under changed conditions. SFAS Nos. 143 and 145 became effective for 2004. The adoption of these standards did
not have a material impact on our consolidated financial statements.

     In January 2003, the FASB issued Interpretation (“FIN”) No. 46, “Consolidation of Variable Interest Entities”
and in December 2003, a revised interpretation was issued (FIN No. 46(R)). In general, a variable interest entity
(“VIE”) is a corporation, partnership, trust, or any other legal structure used for business purposes that either does
not have equity investors with voting rights or has equity investors that do not provide sufficient financial resources
for the entity to support its activities. FIN No. 46 requires a VIE to be consolidated by a company if that company is
designated as the primary beneficiary. The interpretation applies to VIEs created after January 31, 2003, and for all
financial statements issued after December 15, 2003 for VIEs in which an enterprise held a variable interest that it
acquired before February 1, 2003.

     We implemented FIN Nos. 46 and 46(R) on a retroactive basis as required in 2004. As a result of the
implementation, the Company no longer consolidates its investment in the McKesson Financing Trust (the “Trust”)
as the Company was not designated as the Trust’s primary beneficiary. In accordance with this accounting standard,
the Company now recognizes the debentures issued to the Trust as long-term debt in its consolidated financial
statements in lieu of the preferred securities that the Trust issued to third parties. Additionally, the consolidated
financial statements include interest expense on the debentures and no longer report dividends on the preferred
securities, net of tax. These changes increased the Company’s net debt to net capital employed ratio slightly but did
not have a material impact on our consolidated financial statements, including diluted earnings per share.

    In April 2003, the FASB issued SFAS No. 149, “Amendment of Statement 133 on Derivative Instruments and
Hedging Activities.” SFAS No. 149 amends SFAS No. 133 for decisions made as part of the FASB’s Derivatives
Implementation Group process, other FASB projects dealing with financial instruments, and in connection with
implementation issues raised in relation to the application of the definition of a derivative. This statement is
generally effective for contracts entered into or modified after June 30, 2003 and for hedging relationships
designated after June 30, 2003. The adoption of this standard did not have a material impact on our consolidated
financial statements.

    In May 2003, the FASB issued SFAS No. 150, “Accounting for Certain Financial Instruments with
Characteristics of both Liabilities and Equity.” SFAS No. 150 clarifies the definition of a liability as currently
                                                          6
McKESSON CORPORATION
                                          FINANCIAL NOTES (Continued)
                                                  (Unaudited)

defined in FASB Concepts Statement No. 6, “Elements of Financial Statements,” as well as other planned revisions.
This statement requires a financial instrument that embodies an obligation of an issuer to be classified as a liability.
In addition, the statement establishes standards for the initial and subsequent measurement of these financial
instruments and disclosure requirements. SFAS No. 150 is effective for financial instruments entered into or
modified after May 31, 2003 and for all other matters, at the beginning of our second quarter 2004. The adoption of
this standard did not have a material impact on our consolidated financial statements.

    In December 2003, the Staff of the SEC issued Staff Accounting Bulletin (“SAB”) No. 104, “Revenue
Recognition,” which supersedes SAB No. 101, “Revenue Recognition in Financial Statements.” SAB No. 104’s
primary purpose is to rescind the accounting guidance contained in SAB No. 101 related to multiple-element
revenue arrangements that was superseded as a result of the issuance of Emerging Issues Task Force (“EITF”) Issue
No. 00-21. Additionally, SAB No. 104 rescinds the SEC’s related Revenue Recognition in Financial Statements
Frequently Asked Questions and Answers issued with SAB No. 101 that had previously been codified by the SEC.
While the wording of SAB No. 104 reflects the issuance of EITF Issue No. 00-21, the revenue recognition principles
of SAB No. 101 remain largely unchanged by the issuance of SAB No. 104, which was effective upon issuance.
The adoption of SAB No. 104 did not have a material effect on our consolidated financial position or results of
operations.

     In January 2004, the FASB issued Financial Staff Position (“FSP”) 106-1, “Accounting and Disclosure
Requirements Related to the Medicare Prescription Drug, Improvement and Modernization Act of 2003.” As
permitted by FSP No. 106-1, we elected to defer recognizing the effects of the Medicare Prescription Drug,
Improvement and Modernization Act of 2003 (the “Act”) until authoritative guidance on accounting for the new
federal subsidy is issued. In May 2004, the FASB issued FSP No. 106-2 which provides accounting guidance for
this new subsidy. The Company sponsors a number of postretirement benefit plans which may benefit from the
subsidy and as a result, we are currently evaluating the impact of FSP No. 106-2, which we are required to adopt in
our second quarter of 2005.

     Employee Stock-Based Compensation. We account for our employee stock-based compensation plans using the
intrinsic value method under Accounting Principles Board (“APB”) Opinion No. 25, “Accounting for Stock Issued
to Employees.” We apply the disclosure provisions of SFAS No. 123, “Accounting for Stock-Based
Compensation,” as amended by SFAS No. 148, “Accounting for Stock-Based Compensation – Transition and
Disclosure.” Had compensation cost for our employee stock-based compensation been recognized based on the fair
value method, consistent with the provisions of SFAS No. 123, net income and earnings per share would have been
as follows:

                                                                                      Quarter Ended June 30,
                                                                                      2004             2003
(In millions, except per share amounts)
Net income, as reported                                                         $       163.6    $       155.6
Compensation expense, net of tax:
  APB Opinion No. 25 expense included in net income                                        1.4                  0.8
  SFAS No. 123 expense                                                                    (7.6)               (26.7)
Pro forma net income                                                            $        157.4       $        129.7
Earnings per common share:
Diluted – as reported                                                           $         0.55       $         0.53
Diluted – pro forma                                                                       0.53                 0.44
Basic – as reported                                                                       0.56                 0.54
Basic – pro forma                                                                         0.54                 0.45

    SFAS No. 123 compensation expense, as indicated in the above table, decreased in the first quarter of 2005
compared to the same period a year ago. The decrease is primarily attributable to accelerated vesting of
substantially all unvested stock options outstanding during the fourth quarter of 2004. SFAS No. 123 compensation
expense is typically amortized over the related vesting period; as a result, these fully vested stock options did not
have an impact on the expense during the current quarter. Partially offsetting this decrease, during the first quarter
of 2005, we granted 6.0 million stock options that vest on or before March 31, 2005 and have a seven year term.
Historically, options granted by the Company generally vest over four years and have a term of ten years.


                                                           7
McKESSON CORPORATION
                                         FINANCIAL NOTES (Continued)
                                                 (Unaudited)

2.   Acquisitions and Divestiture

    On April 1, 2004, we acquired all of the issued and outstanding shares of Moore Medical Corp. (“MMC”), of
New Britain, Connecticut, for an aggregate cash purchase price of approximately $37 million. MMC is an Internet-
enabled, multi-channel marketer and distributor of medical-surgical and pharmaceutical products to non-hospital
provider settings. Approximately $24 million of the purchase price has been assigned to goodwill, none of which is
deductible for tax purposes. The results of MMC’s operations have been included in the condensed consolidated
financial statements within our Medical-Surgical Solutions segment since the acquisition date.

    We also completed several smaller acquisitions in 2004 within our Medical-Surgical Solutions and Provider
Technologies segments. Pro forma results of operations for our business acquisitions have not been presented
because the effects were not material to the condensed consolidated financial statements on either an individual or
aggregate basis.

    During the first quarter of 2005, we sold a business for net cash proceeds of $12.3 million. The disposition
resulted in a pre-tax loss of $1.1 million and an after-tax loss of $4.6 million. Financial results for this business
were included in our Pharmaceutical Solutions segment and were not material to our condensed consolidated
financial statements.


3.   Restructuring Activities

     Net charges from restructuring activities for the first quarter of 2005 and 2004 were $0.6 million and $1.3
million. These charges primarily related to a number of smaller initiatives offset in part by a reversal of prior years’
restructuring reserves due to a change in estimated costs to complete these activities.

     The following table summarizes restructuring activities for the quarter ended June 30, 2004:

                                   Pharmaceutical        Medical-Surgical         Provider
                                       Solutions            Solutions           Technologies        Corporate
                                              Exit-                Exit-                 Exit-
(In millions)                    Severance Related     Severance Related     Severance Related       Severance Total
                                 $ 0.4 $ 5.2           $   1.7 $      1.9    $    0.2 $    1.9      $   10.5 $ 21.8
Balance, March 31, 2004
Current year expenses                -           -         0.8        -           -        -              -      0.8
Adjustments to prior years’
   expenses                          -          -          (0.2)      -            -         -           -        (0.2)
   Net expense for the period        -          -           0.6       -            -         -           -         0.6
Liabilities related to the MMC
   acquisition                        -        -            4.0       -           -          -           -       4.0
Cash expenditures                    (0.2)    (0.5)        (0.8)     (0.3)        -         (0.1)       (9.1)  (11.0)
                                 $    0.2 $    4.7     $    5.5 $     1.6    $    0.2 $      1.8    $    1.4 $ 15.4
Balance, June 30, 2004

     Accrued restructuring liabilities are included in other liabilities in the accompanying condensed consolidated
balance sheets. In connection with the acquisition of MMC, we recorded $4.0 million of restructuring reserves
related to employee termination costs. These costs have been recognized as liabilities assumed in the purchase price
of MMC.

     In addition to the above restructuring activities, we are still managing a 2001/2000 restructuring plan associated
with customer settlements for the discontinuance of overlapping and nonstrategic products and other product
development projects within our Provider Technologies segment. Customer settlement allowances, which are
included as a reduction of accounts receivable in the accompanying condensed consolidated balance sheets, were
reduced by $0.4 million in non-cash settlements during the first quarter of 2005 to $5.8 million at June 30, 2004
from $6.2 million at March 31, 2004. Total cash and non-cash settlements of $45.3 million and $95.4 million have
been incurred since the inception of this restructuring plan. Non-cash settlements represent write-offs of customer
receivables. There have been no significant offsetting changes in estimates that increased the provision for customer
settlements. At March 31, 2004, we substantially completed our negotiations with the affected customers. As a
result, we do not anticipate additional significant increases to the allowance for customer settlements. However, as

                                                           8
McKESSON CORPORATION
                                            FINANCIAL NOTES (Continued)
                                                    (Unaudited)

settlement negotiations with the remaining customers are finalized, additional adjustments to the reserve may be
necessary.


4.   Earnings Per Share

     Basic earnings per share is computed by dividing net income by the weighted average number of common
shares outstanding during the reporting period. Diluted earnings per share is computed similarly except that it
reflects the potential dilution that could occur if dilutive securities or other obligations to issue common stock were
exercised or converted into common stock.

     The computations for basic and diluted earnings per share are as follows:

                                                                                      Quarter Ended June 30,
                                                                                      2004             2003
(In millions, except per share amounts)
Net income                                                                       $      163.6    $       155.6
Interest expense on convertible junior subordinated debentures, net of tax
  benefit                                                                                 1.5                  1.5
Net income – diluted                                                             $      165.1       $        157.1

Weighted average common shares outstanding:
Basic                                                                                   291.4                289.8
Effect of dilutive securities:
  Options to purchase common stock                                                        3.2                  2.3
  Convertible junior subordinated debentures                                              5.4                  5.4
  Restricted stock                                                                        0.1                  0.6
Diluted                                                                                 300.1                298.1

Earnings per common share:
  Basic                                                                          $        0.56      $         0.54
  Diluted                                                                        $        0.55      $         0.53

    Approximately 34 million and 43 million stock options were excluded from the computations of diluted net
earnings per share for the quarters ended June 30, 2004 and 2003 as their exercise price was higher than the
Company’s average stock price.


5.   Goodwill and Other Intangibles

     Changes in the carrying amount of goodwill for the quarter ended June 30, 2004, are as follows:

                                                               Medical-
                                          Pharmaceutical       Surgical            Provider
                                                                                                          Total
                                            Solutions          Solutions         Technologies
(In millions)
                                          $      297.7     $        725.2      $       382.9        $     1,405.8
Balance, March 31, 2004
Goodwill acquired                                   -                23.7                -                   23.7
Sale of business                                  (10.3)               -                 -                  (10.3)
Translation adjustments                            (1.0)               -                (1.4)                (2.4)
                                          $      286.4     $        748.9    $         381.5        $     1,416.8
Balance, June 30, 2004


                                                           9
McKESSON CORPORATION
                                         FINANCIAL NOTES (Continued)
                                                 (Unaudited)

     Information regarding other intangibles is as follows:

                                                                                   June 30,          March 31,
                                                                                    2004              2004
(In millions)
Customer lists                                                                $         97.9       $      92.9
Technology                                                                              63.7              61.2
Trademarks and other                                                                    23.7              23.8
  Total other intangibles, gross                                                      185.3             177.9
Accumulated amortization                                                               (99.1)            (93.5)
  Total other intangibles, net                                                $         86.2       $      84.4

     Amortization expense of other intangibles was $6.2 million and $4.6 million for the quarters ended June 30,
2004 and 2003. The weighted average remaining amortization periods for customer lists, technology and
trademarks and other intangible assets at June 30, 2004 were: 8 years, 4 years and 5 years. Estimated future annual
amortization expense of these assets is as follows: $16.5 million, $14.9 million, $15.1 million, $15.7 million and
$6.1 million for 2005 through 2009, and $9.1 million thereafter. At June 30, 2004, there was $15.0 million of other
intangibles not subject to amortization.


6.   Financing Activity

    In June 2004, we renewed our committed accounts receivable sales facility under substantially similar terms to
those previously in place with the exception that the facility was increased by $300.0 million to $1.4 billion. The
renewed facility expires in June 2005. At June 30, 2004, there were no amounts utilized under this facility.


7.   Convertible Junior Subordinated Debentures

     In February 1997, we issued 5% Convertible Junior Subordinated Debentures (the “Debentures”) in an
aggregate principal amount of $206,186,000. The Debentures, which are included in long-term debt, mature on June
1, 2027, bear interest at an annual rate of 5%, payable quarterly, and are currently redeemable by us at 101.5% of the
principal amount. The Debentures were purchased by the Trust, which is wholly owned by the Company, with
proceeds from its issuance of four million shares of preferred securities to the public and 123,720 common securities
to us. These preferred securities are convertible at the holder’s option into the Company’s common stock. The
Debentures represent the sole assets of the Trust.

     Holders of the preferred securities are entitled to cumulative cash distributions at an annual rate of 5% of the
liquidation amount of $50 per security. Each preferred security is convertible at the rate of 1.3418 shares of the
Company’s common stock, subject to adjustment in certain circumstances. The preferred securities will be
redeemed upon repayment of the Debentures and are callable by us on or after March 4, 2000, in whole or in part,
initially at 103.5% of the liquidation preference per share, and thereafter at prices declining at 0.5% per annum to
100% of the liquidation preference on and after March 4, 2007 plus, in each case, accumulated, accrued and unpaid
distributions, if any, to the redemption date.

     We have guaranteed, on a subordinated basis, distributions and other payments due on the preferred securities
(the “Guarantee”). The Guarantee, when taken together with our obligations under the Debentures, and in the
indenture pursuant to which the Debentures were issued, and our obligations under the Amended and Restated
Declaration of Trust governing the Trust, provides a full and unconditional guarantee of amounts due on the
preferred securities.


                                                          10
McKESSON CORPORATION
                                        FINANCIAL NOTES (Continued)
                                                (Unaudited)

8.   Pension and Other Postretirement Benefit Plans

    The following table provides the components of the net periodic expense for the Company’s defined benefit
pension and postretirement plans:

                                                                Quarter Ended June 30,
                                                    Pension                           Postretirement
                                           2004                 2003             2004               2003
(In millions)
Service cost—benefits earned
  during the period                $              1.4     $           1.6     $           0.5      $          0.5
Interest cost on projected benefit
  obligation                                     6.4                  6.8                 2.9                 2.9
Expected return on assets                       (7.4)                (6.4)                -                   -
Amortization of unrecognized loss
  and prior service costs                         2.2                 3.0                 7.1                 5.8
Immediate recognition of pension
  cost                                           0.7                  -                   -                   -
Settlements and other                           16.6                  -                   -                   -
Net periodic expense               $            19.9      $           5.0     $          10.5      $          9.2

    In April 2004, we made several lump sum payments totaling approximately $42 million from an unfunded U.S.
pension plan. In accordance with SFAS No. 88, “Employers’ Accounting for Settlements and Curtailments of
Defined Benefit Pension Plans and for Termination Benefits”, approximately $12 million in settlement charges
associated with these payments were expensed in the first quarter of 2005. Substantially all of this expense was
recorded in the Corporate segment.


9.   Stockholders’ Equity

     Comprehensive income is as follows:

                                                                                     Quarter Ended June 30,
                                                                                     2004             2003
(In millions)
Net income                                                                    $        163.6    $       155.6
Foreign currency translation adjustments                                                (6.7)            33.5
  Comprehensive income                                                        $        156.9    $       189.1


10. Financial Guarantees and Warranties

     Financial Guarantees

     We have agreements with certain of our customers’ financial institutions under which we have guaranteed the
repurchase of inventory (primarily for our Canadian businesses), at a discount, in the event these customers are
unable to meet certain obligations to those financial institutions. Among other limitations, these inventories must be
in resalable condition. We have also guaranteed loans, credit facilities and the payment of leases for some
customers; and we are a secured lender for substantially all of these guarantees. During the first quarter of 2005, we
converted a $40.0 million credit facility guarantee in favor of a customer (that recently emerged from bankruptcy) to
a note receivable due from this customer. This secured note bears interest and is repayable in various payments
through 2007. Customer guarantees range from one to ten years and were primarily provided to facilitate financing
for certain strategic customers. At June 30, 2004, the maximum amounts of inventory repurchase guarantees and
other customer guarantees were approximately $155 million and $15 million of which a nominal amount has been
accrued.

    At June 30, 2004, we had commitments of $11.0 million, primarily consisting of the purchase of services from
our equity-held investments, for which no amounts had been accrued.


                                                         11
McKESSON CORPORATION
                                         FINANCIAL NOTES (Continued)
                                                 (Unaudited)

    In addition, our banks and insurance companies have issued $85.2 million of standby letters of credit and surety
bonds on our behalf in order to meet the security requirements for statutory licenses and permits, court and fiduciary
obligations, and our workers’ compensation and automotive liability programs.

     Our software license agreements generally include certain provisions for indemnifying customers against
liabilities if our software products infringe a third party’s intellectual property rights. To date, we have not incurred
any material costs as a result of such indemnification agreements and have not accrued any liabilities related to such
obligations.

     In conjunction with certain transactions, primarily divestitures, we may provide routine indemnification
agreements (such as retention of previously existing environmental, tax and employee liabilities) whose terms vary
in duration and often are not explicitly defined. Where appropriate, obligations for such indemnifications are
recorded as liabilities. Because the amounts of these indemnification obligations often are not explicitly stated, the
overall maximum amount of these commitments cannot be reasonably estimated. Other than obligations recorded as
liabilities at the time of divestiture, we have historically not made significant payments as a result of these
indemnification provisions.

    Warranties

     In the normal course of business, we provide certain warranties and indemnification protection for our products
and services. For example, we provide warranties that the pharmaceutical and medical-surgical products we
distribute are in compliance with the Food, Drug and Cosmetic Act and other applicable laws and regulations. We
have received the same warranties from our suppliers, who customarily are the manufacturers of the products. In
addition, we have indemnity obligations to our customers for these products, which have also been provided to us
from our suppliers, either through express agreement or by operation of law.

     We also provide warranties regarding the performance of software and automation products we sell. Our
liability under these warranties is to bring the product into compliance with previously agreed upon specifications.
For software products, this may result in additional project costs which are reflected in our estimates used for the
percentage-of-completion method of accounting for software installation services within these contracts. In
addition, most of our customers who purchase our software and automation products also purchase annual
maintenance agreements. Revenue from these maintenance agreements is recognized on a straight-line basis over
the contract period and the cost of servicing product warranties is charged to expense when claims become
estimable. Accrued warranty costs were not material to the condensed consolidated balance sheets.


11. Other Commitments and Contingent Liabilities

     In our annual report on Form 10-K for the year ended March 31, 2004, we reported on numerous legal
proceedings including those arising out of our announcement on April 28, 1999, regarding accounting improprieties
at HBO & Company, now known as McKesson Information Solutions LLC (the “Accounting Litigation”), and other
litigation and contingencies. Since the date of that report the only significant developments were as follows:

    I. Accounting Litigation

    On April 7, 2004, in the previously reported action captioned The State of Oregon Public Employees Retirement
Board v. McKesson HBOC, Inc. et al. (Master File No. 307619), the Honorable Donald S. Mitchell in the California
Superior Court, City and County of San Francisco sustained plaintiffs’ motion to dismiss the Company’s cross-
claims for “unjust enrichment.”

     On April 26, 2004, in the previously reported action captioned In re McKesson HBOC, Inc. Securities
Litigation, (N.D. Cal. Case No. C-99-20743-RMW) (the “Consolidated Action”), plaintiff Theodore H. Pacha filed a
request to be named Lead Plaintiff of a subclass of shareholders who primarily held McKesson Corporation
common shares before the merger. The court has not ruled on this motion, or on Lead Plaintiff’s Motion for Class
Certification, which was heard on March 12, 2004.

     We do not believe it is feasible to predict or determine the outcome or resolution of the Accounting Litigation,
or to estimate the amounts of, or potential range of, loss with respect to those proceedings. In addition, the timing of
                                                           12
McKESSON CORPORATION
                                         FINANCIAL NOTES (Continued)
                                                 (Unaudited)

the final resolution of these proceedings is uncertain. The range of possible resolutions of these proceedings could
include judgments against the Company or settlements that could require substantial payments by the Company,
which could have a material adverse impact on the Company’s financial position, results of operations and cash
flows.

    II. Other Litigation

    As previously reported, a judgment has been entered against the Company in an action brought in the California
Superior Court by a former employee for wrongful termination, disability discrimination and harassment, Charlene
Roby vs. McKesson HBOC, Inc. et al. (Action No. CV01-573), consisting of compensatory and punitive damages
awards of $3.5 million and $15.0 million, respectively. After post-trial motions, the trial court reduced the
compensatory damages portion of the judgment to $2.8 million but left the punitive damages award unchanged. The
Company will seek reversal, or alternatively reduction, of all elements of this judgment through an appeal. If this
appeal is not successful, this judgment could have an adverse impact on our consolidated financial statements.

    III. Contingency

    As discussed in our annual report on Form 10-K for the year ended March 31, 2004, in 2002, we entered into a
$500 million, ten year contract with the National Health Services Information Authority (“NHS”), an organization of
the British government charged with the responsibility of delivering healthcare in England and Wales. The contract
engages the Company to develop, implement and operate a human resources and payroll system at more than 600
NHS locations.

     To date, there have been delays to this contract which have caused increased costs and a decrease in the amount
of time in which we can earn revenues. These delays have adversely impacted the contract's projected profitability
and no material revenue has yet been recognized on this contract. As of June 30, 2004, our consolidated balance
sheet includes an investment of approximately $78 million in net assets, consisting of prepaid expenses, software
and capital assets, net of cash received, related to this contract. While we believe it is likely that we can deliver and
operate an acceptable system and recover our investment in this contract, we are currently negotiating with the NHS
to amend certain key terms and conditions in the contract, and there is no certainty we will agree on an updated
implementation plan. We expect this negotiation to be completed in the second half of calendar year 2004.
However, the timing and the outcome of these negotiations is uncertain and failure to reach agreement on an updated
implementation plan and amend certain key contract terms and conditions, and/or further delays in the
implementation may result in losses that could be material. Even if we agree on amended contract terms and
conditions and an updated implementation plan, it is possible that the terms of that agreement may result in the
impairment of our net assets related to the contract as well as substantial penalties and charges, which could have a
material adverse impact on our consolidated financial statements.


12. Segment Information

     In April 2004, we reconfigured our operating segments to better align product development and selling efforts
with the evolving needs of the healthcare market. As a result, commencing in the first quarter of 2005, we are
reporting the following three operating segments: Pharmaceutical Solutions, Medical-Surgical Solutions and
Provider Technologies. Prior period amounts have been reclassified to conform to the 2005 segment presentation.
We evaluate the performance of our operating segments based on operating profit before interest expense, income
taxes and results from discontinued operations. Our Corporate segment includes expenses associated with Corporate
functions and projects and certain employee benefits. Corporate expenses are allocated to the operating segments to
the extent that these items can be directly attributable to the segment.

    The Pharmaceutical Solutions segment distributes ethical and proprietary drugs and health and beauty care
products throughout North America. This segment also manufactures and sells automated pharmaceutical
dispensing systems for retail pharmacies, medical management and pharmaceutical solutions for biotech and
pharmaceutical manufacturers, patient and payor services, and consulting and outsourcing services to pharmacies.
We have added the Clinical Auditing and Compliance business, which was previously included in our former
Information Solutions segment, to this segment’s expanded payor services business. This business sells software to
payors for auditing professional claims.

                                                           13
McKESSON CORPORATION
                                        FINANCIAL NOTES (Concluded)
                                                (Unaudited)

     The Medical-Surgical Solutions segment distributes medical-surgical supplies and equipment and provides
logistics and related services within the United States. This segment now includes Zee Medical, which was formerly
included in our Pharmaceutical Solutions segment. Zee Medical provides first aid and safety products and training
services to corporate customers. The operating results of this segment for the quarter ended June 30, 2004 also
reflect the impact of the acquisition of MMC.

     The Provider Technologies segment consists of the former Information Solutions segment plus the McKesson
Inpatient Automation business, which was previously included in our Pharmaceutical Solutions segment, and the
Corporate Solutions group, which was previously managed by our Corporate group. This segment continues to
deliver enterprise-wide patient care, clinical, financial, supply chain, managed care and strategic management
software solutions as well as outsourcing and other services to healthcare organizations throughout North America,
the United Kingdom and Europe. McKesson Inpatient Automation provides automation and robotics for the
hospital market, and the Corporate Solutions group continues to be responsible for the sales coordination of complex
provider engagements that include strategic product and service solutions from multiple business units. Expenses
incurred by Corporate Solutions on behalf of other business segments are allocated to the applicable business
segments.

     Financial information relating to our segments is as follows:

                                                                                   Quarter Ended June 30,
                                                                                   2004             2003
(In millions)
Revenues
Pharmaceutical Solutions                                                     $     18,179.7       $    15,543.4
Medical-Surgical Solutions                                                            707.2               710.1
Provider Technologies                                                                 299.7               270.7
     Total                                                                   $     19,186.6       $    16,524.2
Operating profit
Pharmaceutical Solutions                                                     $        290.5       $       265.0
Medical-Surgical Solutions                                                             28.6                25.8
Provider Technologies                                                                  14.3                 4.7
     Total                                                                            333.4               295.5
Corporate                                                                             (57.7)              (32.0)
Interest expense                                                                      (29.6)              (29.8)
Income before income taxes                                                   $        246.1       $       233.7


                                                                                  June 30,            March 31,
                                                                                   2004                2004
(In millions)
Segment assets, at period end
Pharmaceutical Solutions                                                     $     12,802.6       $    12,050.5
Medical-Surgical Solutions                                                          1,600.3             1,539.2
Provider Technologies                                                               1,381.4             1,402.7
    Total                                                                          15,784.3            14,992.4
Corporate
  Cash, cash equivalents, and marketable securities                                   846.8               717.8
  Other                                                                               512.3               530.0
    Total                                                                    $     17,143.4       $    16,240.2

     During the first quarter of 2005, we received $41.2 million as our share of a settlement of an antitrust class
action lawsuit involving a drug manufacturer. This settlement was recorded as a credit in cost of sales within our
Pharmaceutical Solutions segment in our condensed consolidated statements of operations.

    Corporate expenses for 2005 include pension settlement charges as discussed in Financial Note 8. Corporate
expenses for 2004 include an $8.5 million gain on the sale of a surplus property.


                                                          14
McKESSON CORPORATION
                                           FINANCIAL REVIEW
                                               (Unaudited)

Item 2. Management’s Discussion and Analysis of Results of Operations and Financial Condition

Financial Overview

                                                                           Quarter Ended June 30,
                                                               2004                 2003              Change
(In millions, except per share data)
Revenues                                                 $     19,186.6      $     16,524.2              16%
Income Before Income Taxes                                        246.1               233.7               5
Net Income                                                        163.6               155.6               5
Diluted Earnings Per Share                               $          0.55     $         0.53               4

    Revenues for the first quarter of 2005 grew by 16% to $19.2 billion from $16.5 billion for the first quarter of
2004. Net income increased 5% to $163.6 million in the first quarter of 2005 compared to the same period a year
ago and diluted earnings per share increased 4% to $0.55. Increases in net income and diluted earnings per share
primarily reflect revenue and operating profit growth in our Pharmaceutical Solutions and Provider Technologies
segments, offset in part by additional Corporate expenses.

Results of Operations

     Revenues:
                                                                           Quarter Ended June 30,
                                                               2004                 2003              Change
(In millions)
Pharmaceutical Solutions
  U.S. Healthcare direct distribution & services         $     11,011.3       $     9,335.0                18%
  U.S. Healthcare sales to customers’ warehouses                5,916.2             5,164.4                15
      Subtotal                                                 16,927.5            14,499.4                17
  Canada distribution & services                                1,252.2             1,044.0                20
      Total Pharmaceutical Solutions                           18,179.7            15,543.4                17

Medical-Surgical Solutions                                        707.2               710.1                  -

Provider Technologies
  Software & software systems                                      50.6                45.6                11
  Services                                                        222.2               204.3                 9
  Hardware                                                         26.9                20.8                29
      Total Provider Technologies                                 299.7               270.7                11

Total Revenues                                           $     19,186.6       $    16,524.2                16

    Revenues for the first quarter of 2005 grew by 16% to $19.2 billion compared to the first quarter of 2004. The
growth in revenue was primarily due to our Pharmaceutical Solutions segment, which accounted for over 94% of
our consolidated revenues.

     Increases in U.S. Healthcare pharmaceutical direct distribution and services revenues for the first quarter of
2005 primarily reflect market growth rates as well as new institutional customers in our pharmaceutical distribution
business. Market growth rates reflect growing drug utilization and price increases, which are offset in part by the
increased use of lower priced generics. In May 2004, we began implementation on a new pharmaceutical
distribution contract with the Department of Veterans Affairs, which contributed to the segment’s total increase in
revenues. Annual revenues on this contract are expected to exceed $3.5 billion. U.S. Healthcare sales to customers’
warehouses also increased in the first quarter of 2005 primarily as a result of several expanded agreements with
existing customers and growth from existing customers.

     Canadian pharmaceutical revenues increased in the first quarter of 2005 reflecting market growth rates, new
business from manufacturers who formerly engaged in direct distribution activities and to a lesser extent, favorable
foreign exchange rates. On a constant currency basis, revenues from our Canadian operations would have increased
approximately 17% compared to the same period a year ago.


                                                        15
McKESSON CORPORATION
                                        FINANCIAL REVIEW (Continued)
                                                (Unaudited)

    Medical-Surgical Solutions segment distribution revenues were flat in the first quarter of 2005. Increases in our
primary care sector, including revenues derived from our recent acquisition of Moore Medical Corporation
(“MMC”), were fully offset by a decline in revenues in the acute care sector due to the transition of the loss of the
segment’s largest customer. On April 1, 2004, we acquired all of the issued and outstanding shares of MMC, of
New Britain, Connecticut, for an aggregate cash purchase price of approximately $37 million. MMC is an Internet-
enabled, multi-channel marketer and distributor of medical-surgical and pharmaceutical products to non-hospital
provider settings.

     Provider Technologies segment revenues increased in the first quarter of 2005 primarily from increased demand
for our clinical application offerings and to a lesser extent, from our Automation products.

     Gross Profit:
                                                                             Quarter Ended June 30,
                                                                  2004                2003                 Change
(In millions)
Gross Profit
  Pharmaceutical Solutions                                 $         560.4      $         518.2                  8%
  Medical-Surgical Solutions                                         158.7                146.0                  9
  Provider Technologies                                              132.9                122.3                  9
    Total                                                  $         852.0      $         786.5                  8
Gross Profit Margin
  Pharmaceutical Solutions                                            3.08%                3.33%              (25) bp
  Medical-Surgical Solutions                                         22.44                20.56               188
  Provider Technologies                                              44.34                45.18               (84)
    Total                                                             4.44                 4.76               (32)

     Gross profit increased 8% to $852.0 million in the first quarter of 2005. As a percentage of revenues, gross
profit margins declined 32 basis points in 2005. Declines in our gross profit margins primarily reflect a higher
proportion of our revenue being attributable to our Pharmaceutical Solutions segment, which has lower margins
relative to our other segments and which had a decline in margins compared to the same period a year ago. Gross
profit margins increased in our Medical-Surgical Solutions segment and decreased in our Provider Technologies
segment primarily due to product mix.

     During the first quarter of 2005, gross margin for our Pharmaceutical Solutions segment was impacted by:

     •    lower selling margins within our U.S. Pharmaceutical distribution business which reflect competitive
          pricing pressure. We have also been experiencing pressure on our buy side margin over the past few
          quarters as the industry is evolving, including the ways in which distributors are being compensated by
          manufacturers. Certain types of vendor product incentives and sources of supply, such as certain inventory
          purchases in the secondary market, are not available at historical levels to the major distributors which have
          the impact of reducing gross margins. Much of this change results from the manufacturers’ desire to limit
          the amount of inventory in the channel. We have been actively working with manufacturers through
          restructured distribution agreements to ensure that we are appropriately compensated for the services we
          provide,

     •    a higher proportion of revenues attributed to institutional customers, which have lower gross profit
          margins,

     •    partially offsetting the above decreases, the benefit of increased sales of generic drugs with higher margins,

     •    a higher proportion of supplier cash discounts to revenues reflecting a change in customer mix, and

     •    a reduction in cost of sales due to a receipt of $41.2 million cash proceeds representing our share of a
          settlement of an antitrust class action lawsuit brought against a drug manufacturer.


                                                           16
McKESSON CORPORATION
                                       FINANCIAL REVIEW (Continued)
                                               (Unaudited)

     Operating Expenses and Other Income:
                                                                             Quarter Ended June 30,
                                                                 2004                 2003               Change
(In millions)
Operating Expenses
 Pharmaceutical Solutions                                 $         275.4       $       259.1                  6%
 Medical-Surgical Solutions                                         131.1               121.4                  8
 Provider Technologies                                              119.8               119.7                  -
 Corporate                                                           64.9                34.7                 87
   Total                                                  $         591.2       $       534.9                 11
Operating Expenses as a Percentage of Revenues
 Pharmaceutical Solutions                                            1.51%               1.67%               (16) bp
 Medical-Surgical Solutions                                         18.54               17.10                144
 Provider Technologies                                              39.97               44.22               (425)
   Total                                                             3.08                3.24                (16)

Other Income
  Pharmaceutical Solutions                                $           5.5       $         5.9                 (7)%
  Medical-Surgical Solutions                                          1.0                 1.2                (17)
  Provider Technologies                                               1.2                 2.1                (43)
  Corporate                                                           7.2                 2.7                167
    Total                                                 $          14.9       $       11.9                  25

     Operating expenses increased 11% to $591.2 million in the first quarter of 2005. As a percentage of revenues,
operating expenses decreased 16 basis points in 2005. Increases in operating expense dollars were primarily due to
additional costs to support our sales volume growth, approximately $12 million of settlement charges pertaining to a
non-qualified pension plan and additional legal costs associated with our pending securities litigation. In addition,
operating expenses for the first quarter of 2004 benefited from an $8.5 million gain on the sale of a surplus property.
As a percentage of revenues, operating expenses decreased primarily due to the leveraging of our fixed cost
infrastructure and productivity improvements in back-office and field operations within our Pharmaceutical
Solutions segment. Other income increased in the first quarter of 2005 primarily due to higher interest income.

     Segment Operating Profit and Corporate Expenses:
                                                                             Quarter Ended June 30,
                                                                 2004                 2003               Change
(In millions)
Segment Operating Profit (1)
  Pharmaceutical Solutions                                $         290.5       $       265.0                 10%
  Medical-Surgical Solutions                                         28.6                 25.8                11
  Provider Technologies                                              14.3                  4.7               204
     Total                                                          333.4               295.5                 13
Corporate Expenses                                                  (57.7)               (32.0)               80
Interest Expense                                                    (29.6)               (29.8)               (1)
Income Before Income Taxes                                $         246.1       $       233.7                  5

Segment Operating Profit Margin
  Pharmaceutical Solutions                                           1.60%                1.70%              (10) bp
  Medical-Surgical Solutions                                         4.04                 3.63                41
  Provider Technologies                                              4.77                 1.74               303

(1) Segment operating profit includes gross margin, net of operating expenses plus other income for our three business
    segments.

    Operating profit as a percentage of revenues decreased in our Pharmaceutical Solutions segment in the first
quarter of 2005 primarily reflecting a decline in gross margins, offset in part by favorable leveraging of the
segment’s fixed cost infrastructure and productivity improvements in back-office and field operations.

    Medical-Surgical Solutions segment’s operating profit as a percentage of revenues increased in the first quarter
of 2005 primarily reflecting improvements in gross profit margin which was offset in part by an increase in
                                                          17
McKESSON CORPORATION
                                        FINANCIAL REVIEW (Continued)
                                                (Unaudited)

operating expenses. Operating expenses increased in both dollars as well as a percentage of revenues primarily due
to the acquisition of MMC as well as from additional costs incurred to serve the segment’s alternate site customers.
During the second quarter of 2005, the segment anticipates completing an evaluation of its distribution center
network as a result of its MMC acquisition. In accordance with accounting standards, certain costs that will be
incurred to consolidate operations with acquired businesses will be treated as part of the cost of the acquisition
whereas other related costs will be expensed.

     Provider Technologies segment’s operating profit as a percentage of revenues increased in the first quarter of
2005 primarily reflecting a decrease in gross profit margin which was more than offset by a lower ratio of operating
expenses as a percentage of sales. Despite an increase in revenues, operating expense dollars for the quarter were
flat compared to the same period a year ago primarily reflecting the segment’s control of expenses. In addition,
operating expenses for the first quarter of 2004 included incremental product development expenses.

     Corporate expenses increased in the first quarter of 2005 primarily reflecting settlement charges of
approximately $12 million pertaining to a non-qualified pension plan and additional legal costs associated with our
pending securities litigation. These expenses were partially offset by higher interest income. During the first
quarter of 2005, we made several lump sum cash payments totaling approximately $42 million from an unfunded
U.S. pension plan. In accordance with accounting standards, additional charges for settlements associated with lump
sum payments of pension obligations are expensed in the period in which the payments are made. Accordingly,
expenses for the quarter include charges associated with these payments. In addition, expenses for the comparable
prior year period benefited from an $8.5 million gain pertaining to the sale of a surplus property.

    Interest Expense: Interest expense approximated that of the prior comparable period as the benefit of lower
average borrowings were almost fully offset by increases in our effective interest rate.

     Income Taxes: The Company’s effective income tax rate was 33.5% and 33.4% for the quarters ended June 30,
2004 and 2003. During the first quarter of 2005, we sold a business for a pre-tax loss of $1.1 million and an after-
tax loss of $4.6 million. Partially offsetting the tax impact of this disposition, we recorded a net benefit relating to
favorable tax settlements and adjustments.

   Weighted Average Diluted Shares Outstanding: Diluted earnings per share was calculated based on an average
number of shares outstanding of 300.1 million and 298.1 million for the quarters ended June 30, 2004 and 2003.

Financial Condition, Liquidity, and Capital Resources

     Operating activities provided cash flow of $128.3 million and $40.8 million during the first quarters of 2005
and 2004. Net cash flow for 2005 includes an incremental non-cash add back of $68.2 million in deferred income
taxes partially offset by an increase in net taxes paid of $53.9 million. Net uses of cash for working capital
approximated that of the first quarter of last year as additional working capital required to support our revenue
growth and an increase in investment inventory were offset by favorable working capital management.
Additionally, our new customer, the Department of Veterans Affairs, has prompt payment terms. Operating
activities for 2005 also includes approximately $42 million of lump sum pension settlement payments.

     Investing activities utilized cash of $96.8 million and $63.4 million during the first quarters of 2005 and 2004.
The increased usage in 2005 primarily reflects a payment of approximately $37 million for the acquisition of MMC
as well as greater issuances of notes receivable. During the first quarter of 2005, we converted a $40.0 million credit
facility guarantee in favor of a customer (that recently emerged from bankruptcy) to a note receivable due from this
customer. These increases in cash usage were partially offset by the receipt of $21.0 million from the sale of notes
receivable and a decrease in expenditures for capitalized software.

     Financing activities provided cash of $97.2 million and used cash of $54.2 million in the first quarters of 2005
and 2004. Financing activities for 2005 include $23.4 million of short-term borrowings and an incremental $48.3
million from common stock issuances primarily resulting from an increase in employees’ exercises of stock options.
2004 financing activities included the use of $75.3 million for stock repurchases.


                                                          18
McKESSON CORPORATION
                                           FINANCIAL REVIEW (Continued)
                                                   (Unaudited)

Selected Measures of Liquidity and Capital Resources
                                                                                            June 30,           March 31,
                                                                                             2004               2004
(Dollars in millions)
Cash, cash equivalents and marketable securities                                       $        846.8        $     717.8
Working capital                                                                               3,803.9            3,587.9
Debt net of cash, cash equivalents and marketable securities                                    644.8              766.8
Debt to capital ratio (1)                                                                        21.6%              22.3%
Net debt to net capital employed (2)                                                             10.6               12.9
Return on stockholders’ equity (3)                                                               13.1               13.4

(1) Ratio is computed as total debt divided by total debt and stockholders’ equity.
(2) Ratio is computed as total debt, net of cash, cash equivalents and marketable securities (“net debt”), divided by net debt and
    stockholders’ equity (“net capital employed”).
(3) Ratio is computed as net income, divided by a five-quarter average of stockholders’ equity.

    Working capital primarily includes receivables and inventories, net of drafts and accounts payable and deferred
revenue. Our Pharmaceutical Solutions segment requires a substantial investment in working capital that is
susceptible to large variations during the year as a result of inventory purchase patterns and seasonal demands.
Inventory purchase activity is a function of sales activity, new customer build-up requirements and the desired level
of investment inventory. Consolidated working capital has increased primarily as a result of our higher sales
volume, as well as an increase in cash and cash equivalents.

    We reduced our ratio of net debt to net capital employed as growth in our operating income was in excess of the
growth in working capital and other investments needed to fund increases in revenue.

Credit Resources

     We fund our working capital requirements primarily with cash, short-term borrowings and our receivables sale
facility. We have a $650.0 million 364-day revolving credit agreement that expires in September 2004 and a $550.0
million three-year revolving credit facility that expires in September 2005. These facilities are primarily intended to
support our commercial paper borrowings. We also have a $1.4 billion accounts receivable sales facility, which was
renewed in June 2004, the terms of which are substantially similar to those previously in place with the exception
that the facility was increased by $300.0 million. No amounts were utilized under any of these facilities at June 30,
2004.

     Our various borrowing facilities and long-term debt are subject to certain covenants. Our principal debt
covenant is our debt to capital ratio, which cannot exceed 56.5%. If we exceed this ratio, repayment of debt
outstanding under the revolving credit facility and $335.0 million of term debt could be accelerated. At June 30,
2004, this ratio was 21.6% and we were in compliance with our other financial covenants. A reduction in our credit
ratings or the lack of compliance with our covenants could negatively impact our ability to finance operations
through our credit facilities, or issue additional debt at the interest rates then currently available.

    Funds necessary for future debt maturities and our other cash requirements are expected to be met by existing
cash balances, cash flows from operations, existing credit sources and other capital market transactions.

New Accounting Pronouncements

    There are a number of new accounting pronouncements that may impact our financial results. These new
accounting pronouncements are described in Financial Note 1, “Significant Accounting Policies,” to the
accompanying condensed consolidated financial statements.

FACTORS AFFECTING FORWARD-LOOKING STATEMENTS

     In addition to historical information, management’s discussion and analysis includes certain forward-looking
statements within the meaning of section 27A of the Securities Act of 1933, as amended and section 21E of the
Securities Exchange Act of 1934, as amended. Some of the forward-looking statements can be identified by use of
forward-looking words such as “believes,” “expects,” “anticipates,” “may,” “will,” “should,” “seeks,”
“approximates,” “intends,” “plans,” or “estimates,” or the negative of these words, or other comparable terminology.
                                                               19
McKESSON CORPORATION
                                        FINANCIAL REVIEW (Concluded)
                                                (Unaudited)

The discussion of financial trends, strategy, plans or intentions may also include forward-looking statements.
Forward-looking statements involve risks and uncertainties that could cause actual results to differ materially from
those projected. Although it is not possible to predict or identify all such risks and uncertainties, they may include,
but are not limited to, the following factors. The readers should not consider this list to be a complete statement of
all potential risks and uncertainties.

•   the resolution or outcome of pending shareholder litigation regarding the 1999 restatement of our historical
    financial statements;
•   the changing U.S. healthcare environment, including the impact of current and potential future mandated
    benefits, changes in private and governmental reimbursement or in the delivery systems for healthcare products
    and services and governmental efforts to regulate the pharmaceutical supply chain;
•   consolidation of competitors, suppliers and customers and the development of large, sophisticated purchasing
    groups;
•   the ability to successfully market both new and existing products domestically and internationally;
•   changes in manufacturers’ pricing, selling, inventory, distribution or supply policies or practices;
•   substantial defaults in payment by large customers;
•   material reduction in purchases or the loss of a large customer or supplier relationship;
•   challenges in integrating or implementing our software or software-related system products, or the slowing or
    deferral of demand for these products;
•   the use of estimates used in accounting for contracts;
•   the malfunction or failure of our segments’ information systems;
•   our ability to successfully identify, consummate and integrate strategic acquisitions;
•   changes in generally accepted accounting principles;
•   tax legislation initiatives;
•   foreign currency fluctuations; and
•   general economic and market conditions.

     These and other risks and uncertainties are described herein or in our Forms 10-K, 10-Q, 8-K and other public
documents filed with the Securities and Exchange Commission. Readers are cautioned not to place undue reliance
on these forward-looking statements, which speak only as of the date hereof. We undertake no obligation to
publicly release the result of any revisions to these forward-looking statements to reflect events or circumstances
after this date or to reflect the occurrence of unanticipated events.

Item 3. Quantitative and Qualitative Disclosures about Market Risk

    We believe there has been no material change in our exposure to risks associated with fluctuations in interest
and foreign currency exchange rates discussed in our 2004 Annual Report on Form 10-K.

Item 4. Controls and Procedures

     Our Chief Executive Officer and our Chief Financial Officer, after evaluating the effectiveness of the
Company’s “disclosure controls and procedures” (as defined in the Exchange Act Rules 13a-15(e)) as of the end of
the period covered by this quarterly report, have concluded that our disclosure controls and procedures are effective
based on their evaluation of these controls and procedures required by paragraph (b) of Exchange Act Rules 13a-15
or 15d-15.

    There were no changes in our internal control over financial reporting identified in connection with the
evaluation required by paragraph (d) of Exchange Act Rules 13a-15 or 15d-15 that occurred during our last fiscal
quarter that have materially affected, or are reasonably likely to materially affect, our internal controls over financial
reporting.


                                                           20
McKESSON CORPORATION

                                      PART II. OTHER INFORMATION

Item 1. Legal Proceedings

    See Financial Note 11, “Other Commitments and Contingent Liabilities,” of our unaudited condensed
consolidated financial statements contained in Part I of this Quarterly Report on Form 10-Q.

Item 2. Changes in Securities, Use of Proceeds and Issuer Purchases of Equity Securities

     The Company made no share repurchases during the first quarter of 2005. The dollar value of shares that may
yet be purchased under our share repurchase program is approximately $209 million.

Item 6. Exhibits and Reports on Form 8-K

(a) Exhibits

    Exhibit 31.1 Certification Pursuant to 18 U.S.C. Section 1350, as Adopted Pursuant to Section 302 of the
    Sarbanes-Oxley Act of 2002.

    Exhibit 31.2 Certification Pursuant to 18 U.S.C. Section 1350, as Adopted Pursuant to Section 302 of the
    Sarbanes-Oxley Act of 2002.

    Exhibit 32 Certification Pursuant to 18 U.S.C. Section 1350, as Adopted Pursuant to Section 906 of the
    Sarbanes-Oxley Act of 2002.

(b) Reports on Form 8-K

    The following report on Form 8-K was filed during the three months ended June 30, 2004:

        Form 8-K date of report April 29, 2004 relating to a press release announcing the Company’s preliminary
        financial results for its fourth quarter and fiscal year ended March 31, 2004.

        Form 8-K date of report April 30, 2004 relating to recast condensed consolidated operating information by
        business segment for fiscal 2003 and fiscal 2004

        Form 8-K date of report May 4, 2004 relating to an employment litigation verdict against the Company.

    The following report on Form 8-K was filed during the period between July 1, 2004 and the date of this filing:

        Form 8-K date of report July 22, 2004 relating to a press release announcing the Company’s preliminary
        financial results for its first quarter of fiscal year 2005.


                                                 SIGNATURES

     Pursuant to the requirements of the Securities Exchange Act of 1934, the Registrant has duly caused this report
to be signed on its behalf by the undersigned, thereunto duly authorized.

                                                             McKesson Corporation

Dated: July 29, 2004
                                                             By /s/ Jeffrey C. Campbell
                                                                Jeffrey C. Campbell
                                                                Executive Vice President and Chief Financial
                                                                Officer


                                                             By /s/ Nigel A. Rees
                                                                Nigel A. Rees
                                                                Vice President and Controller
                                                        21
Exhibit 31.1

                                        CERTIFICATION PURSUANT TO
            RULE 13a-14(a) AND RULE 15d-14(a) OF THE SECURITIES EXCHANGE ACT, AS AMENDED


I, John H. Hammergren, certify that:

1.   I have reviewed this quarterly report on Form 10-Q of McKesson Corporation;

2.   Based on my knowledge, this report does not contain any untrue statement of a material fact or omit to state a material
     fact necessary in order to make the statements made, in light of the circumstances under which such statements were
     made, not misleading with respect to the period covered by this report;

3.   Based on my knowledge, the financial statements, and other financial information included in this report, fairly present
     in all material respects the financial condition, results of operations and cash flows of the registrant as of, and for, the
     periods presented in this report;

4.   The registrant’s other certifying officer and I are responsible for establishing and maintaining disclosure controls and
     procedures (as defined in Exchange Act Rules 13a-15(e) and 15d-15(e)) for the registrant and have:

     a) Designed such disclosure controls and procedures, or caused such disclosure controls and procedures to be designed
       under our supervision, to ensure that material information relating to the registrant, including its consolidated
       subsidiaries, is made known to us by others within those entities, particularly during the period in which this annual
       report is being prepared;

     b) Evaluated the effectiveness of the registrant’s disclosure controls and procedures and presented in this report our
       conclusions about the effectiveness of the disclosure controls and procedures, as of the end of the period covered by
       this report based on such evaluation; and

     c) Disclosed in this report any change in the registrant’s internal control over financial reporting that occurred during
       the registrant’s fourth fiscal quarter that has materially affected, or is reasonably likely to materially affect, the
       registrant’s internal control over financial reporting; and

5.   The registrant’s other certifying officer and I have disclosed, based on our most recent evaluation of internal control
     over financial reporting, to the registrant’s auditors and the audit committee of registrant’s board of directors (or
     persons performing the equivalent functions):

     a) All significant deficiencies and material weaknesses in the design or operation of internal controls over financial
       reporting which are reasonably likely to adversely affect the registrant’s ability to record, process, summarize and
       report financial information; and

     b) Any fraud, whether or not material, that involves management or other employees who have a significant role in the
       registrant’s internal controls over financial reporting.


     Date: July 29, 2004                                              /s/ John H. Hammergren
                                                                      John H. Hammergren
                                                                      Chairman, President and Chief Executive Officer
Exhibit 31.2

                                        CERTIFICATION PURSUANT TO
            RULE 13a-14(a) AND RULE 15d-14(a) OF THE SECURITIES EXCHANGE ACT, AS AMENDED


I, Jeffrey C. Campbell, certify that:

1.   I have reviewed this quarterly report on Form 10-Q of McKesson Corporation;

2.   Based on my knowledge, this report does not contain any untrue statement of a material fact or omit to state a material
     fact necessary in order to make the statements made, in light of the circumstances under which such statements were
     made, not misleading with respect to the period covered by this report;

3.   Based on my knowledge, the financial statements, and other financial information included in this report, fairly present
     in all material respects the financial condition, results of operations and cash flows of the registrant as of, and for, the
     periods presented in this report;

4.   The registrant’s other certifying officer and I are responsible for establishing and maintaining disclosure controls and
     procedures (as defined in Exchange Act Rules 13a-15(e) and 15d-15(e)) for the registrant and have:

     a) Designed such disclosure controls and procedures, or caused such disclosure controls and procedures to be designed
       under our supervision, to ensure that material information relating to the registrant, including its consolidated
       subsidiaries, is made known to us by others within those entities, particularly during the period in which this annual
       report is being prepared;

     b) Evaluated the effectiveness of the registrant’s disclosure controls and procedures and presented in this report our
       conclusions about the effectiveness of the disclosure controls and procedures, as of the end of the period covered by
       this report based on such evaluation; and

     c) Disclosed in this report any change in the registrant’s internal control over financial reporting that occurred during
       the registrant’s fourth fiscal quarter that has materially affected, or is reasonably likely to materially affect, the
       registrant’s internal control over financial reporting; and

5.   The registrant’s other certifying officer and I have disclosed, based on our most recent evaluation of internal control
     over financial reporting, to the registrant’s auditors and the audit committee of registrant’s board of directors (or
     persons performing the equivalent functions):

     a) All significant deficiencies and material weaknesses in the design or operation of internal controls over financial
       reporting which are reasonably likely to adversely affect the registrant’s ability to record, process, summarize and
       report financial information; and

     b) Any fraud, whether or not material, that involves management or other employees who have a significant role in the
       registrant’s internal controls over financial reporting.


     Date: July 29, 2004                                              /s/ Jeffrey C. Campbell
                                                                      Jeffrey C. Campbell
                                                                      Executive Vice President and Chief Financial Officer
Exhibit 32

                             CERTIFICATION PURSUANT TO
                                18 U.S.C SECTION 1350,
        AS ADOPTED PURSUANT TO SECTION 906 OF THE SARBANES-OXLEY ACT OF 2002


In connection with the quarterly report of McKesson Corporation (the “Company”) on Form 10-Q for the quarter
ended June 30, 2004 as filed with the Securities and Exchange Commission on the date hereof (the “Report”), the
undersigned, in the capacities and on the dates indicated below, each hereby certify, pursuant to 18 U.S.C. § 1350,
as adopted pursuant to § 906 of the Sarbanes-Oxley Act of 2002, that to the best of their knowledge:

(1)     The Report fully complies with the requirements of section 13(a) or 15(d) of the Securities Exchange Act
        of 1934; and

(2)     The information contained in the Report fairly presents, in all material respects, the financial condition and
        results of operations of the Company.


/s/ John H. Hammergren
John H. Hammergren
Chairman, President and Chief Executive Officer
July 29, 2004


/s/ Jeffrey C. Campbell
Jeffrey C. Campbell
Executive Vice President and Chief Financial Officer
July 29, 2004


    This certification accompanies the Report pursuant to § 906 of the Sarbanes-Oxley Act of 2002, and shall not,
except to the extent required by the Sarbanes-Oxley Act of 2002, be deemed filed by the Company for the purposes
of Section 18 of the Securities Exchange Act of 1934, as amended.

    A signed original of this written statement required by Section 906 has been provided to McKesson Corporation
and will be retained by the Company and furnished to the Securities and Exchange Commission or its staff upon
request.

More Related Content

What's hot

danaher 04-1Q-Q
danaher 04-1Q-Qdanaher 04-1Q-Q
danaher 04-1Q-Qfinance24
 
johnson controls FY2005 3rd Quarter Form 10-QA
johnson controls  FY2005 3rd Quarter Form 10-QA  johnson controls  FY2005 3rd Quarter Form 10-QA
johnson controls FY2005 3rd Quarter Form 10-QA finance8
 
johnson controls FY2005 1st Quarter Form 10-QA
johnson controls  FY2005 1st Quarter Form 10-QA  johnson controls  FY2005 1st Quarter Form 10-QA
johnson controls FY2005 1st Quarter Form 10-QA finance8
 
Mekesson Quarterly Reports 2002 3rd
Mekesson Quarterly Reports 2002 3rdMekesson Quarterly Reports 2002 3rd
Mekesson Quarterly Reports 2002 3rdfinance2
 
danaher 04-2Q-10Q
danaher 04-2Q-10Qdanaher 04-2Q-10Q
danaher 04-2Q-10Qfinance24
 
danaher 07_3Q_10Q
danaher 07_3Q_10Qdanaher 07_3Q_10Q
danaher 07_3Q_10Qfinance24
 
thermo fisher Q107_10Q
thermo fisher Q107_10Qthermo fisher Q107_10Q
thermo fisher Q107_10Qfinance40
 
western digital 2278-001005-A02
western digital  2278-001005-A02western digital  2278-001005-A02
western digital 2278-001005-A02finance37
 
PCARMar2003_10-Q
PCARMar2003_10-QPCARMar2003_10-Q
PCARMar2003_10-Qfinance17
 
family dollar stores Second Quarter 10Q 2006
family dollar stores Second Quarter 10Q 2006family dollar stores Second Quarter 10Q 2006
family dollar stores Second Quarter 10Q 2006finance33
 
thermo fisher Q307_10Q
thermo fisher Q307_10Qthermo fisher Q307_10Q
thermo fisher Q307_10Qfinance40
 
thermo fisher Q207_10Q
thermo fisher Q207_10Qthermo fisher Q207_10Q
thermo fisher Q207_10Qfinance40
 
danaher 04-3Q-10Q
danaher 04-3Q-10Qdanaher 04-3Q-10Q
danaher 04-3Q-10Qfinance24
 
danaher 06-2Q-10Q
danaher 06-2Q-10Qdanaher 06-2Q-10Q
danaher 06-2Q-10Qfinance24
 
cit 2007%20Q3%20-%2010-Q
cit 2007%20Q3%20-%2010-Qcit 2007%20Q3%20-%2010-Q
cit 2007%20Q3%20-%2010-Qfinance28
 
valero energy Quarterly and Other SEC Reports 2004 2nd
valero energy  Quarterly and Other SEC Reports  2004 2ndvalero energy  Quarterly and Other SEC Reports  2004 2nd
valero energy Quarterly and Other SEC Reports 2004 2ndfinance2
 
FY2004 1st Quarter Form 10-Q
 FY2004 1st Quarter Form 10-Q   FY2004 1st Quarter Form 10-Q
FY2004 1st Quarter Form 10-Q finance8
 

What's hot (17)

danaher 04-1Q-Q
danaher 04-1Q-Qdanaher 04-1Q-Q
danaher 04-1Q-Q
 
johnson controls FY2005 3rd Quarter Form 10-QA
johnson controls  FY2005 3rd Quarter Form 10-QA  johnson controls  FY2005 3rd Quarter Form 10-QA
johnson controls FY2005 3rd Quarter Form 10-QA
 
johnson controls FY2005 1st Quarter Form 10-QA
johnson controls  FY2005 1st Quarter Form 10-QA  johnson controls  FY2005 1st Quarter Form 10-QA
johnson controls FY2005 1st Quarter Form 10-QA
 
Mekesson Quarterly Reports 2002 3rd
Mekesson Quarterly Reports 2002 3rdMekesson Quarterly Reports 2002 3rd
Mekesson Quarterly Reports 2002 3rd
 
danaher 04-2Q-10Q
danaher 04-2Q-10Qdanaher 04-2Q-10Q
danaher 04-2Q-10Q
 
danaher 07_3Q_10Q
danaher 07_3Q_10Qdanaher 07_3Q_10Q
danaher 07_3Q_10Q
 
thermo fisher Q107_10Q
thermo fisher Q107_10Qthermo fisher Q107_10Q
thermo fisher Q107_10Q
 
western digital 2278-001005-A02
western digital  2278-001005-A02western digital  2278-001005-A02
western digital 2278-001005-A02
 
PCARMar2003_10-Q
PCARMar2003_10-QPCARMar2003_10-Q
PCARMar2003_10-Q
 
family dollar stores Second Quarter 10Q 2006
family dollar stores Second Quarter 10Q 2006family dollar stores Second Quarter 10Q 2006
family dollar stores Second Quarter 10Q 2006
 
thermo fisher Q307_10Q
thermo fisher Q307_10Qthermo fisher Q307_10Q
thermo fisher Q307_10Q
 
thermo fisher Q207_10Q
thermo fisher Q207_10Qthermo fisher Q207_10Q
thermo fisher Q207_10Q
 
danaher 04-3Q-10Q
danaher 04-3Q-10Qdanaher 04-3Q-10Q
danaher 04-3Q-10Q
 
danaher 06-2Q-10Q
danaher 06-2Q-10Qdanaher 06-2Q-10Q
danaher 06-2Q-10Q
 
cit 2007%20Q3%20-%2010-Q
cit 2007%20Q3%20-%2010-Qcit 2007%20Q3%20-%2010-Q
cit 2007%20Q3%20-%2010-Q
 
valero energy Quarterly and Other SEC Reports 2004 2nd
valero energy  Quarterly and Other SEC Reports  2004 2ndvalero energy  Quarterly and Other SEC Reports  2004 2nd
valero energy Quarterly and Other SEC Reports 2004 2nd
 
FY2004 1st Quarter Form 10-Q
 FY2004 1st Quarter Form 10-Q   FY2004 1st Quarter Form 10-Q
FY2004 1st Quarter Form 10-Q
 

Viewers also liked

Cardinal Health Updates FY09 Outlook Transcript
Cardinal Health Updates FY09 Outlook TranscriptCardinal Health Updates FY09 Outlook Transcript
Cardinal Health Updates FY09 Outlook Transcriptfinance2
 
أين دارك Fizan binnaam
أين دارك Fizan binnaamأين دارك Fizan binnaam
أين دارك Fizan binnaamguest5205f
 
Freedom Pass Guide
Freedom Pass GuideFreedom Pass Guide
Freedom Pass Guidekoutly
 
How to setup a DVR for Cheap 
How to setup a DVR for Cheap How to setup a DVR for Cheap 
How to setup a DVR for Cheap Manesh Lad
 
cardinal health UBS Global Healthcare Services Conference 2009
cardinal health UBS Global Healthcare Services Conference 2009cardinal health UBS Global Healthcare Services Conference 2009
cardinal health UBS Global Healthcare Services Conference 2009finance2
 
Mekesson Quarterly Reports 2008 3rd
Mekesson Quarterly Reports 2008  3rdMekesson Quarterly Reports 2008  3rd
Mekesson Quarterly Reports 2008 3rdfinance2
 
valero energy Quarterly and Other SEC Reports 2005 3rd
valero energy  Quarterly and Other SEC Reports 2005 3rdvalero energy  Quarterly and Other SEC Reports 2005 3rd
valero energy Quarterly and Other SEC Reports 2005 3rdfinance2
 
morgan stanley Earnings Archive 2000 3rd
morgan stanley Earnings Archive 2000 3rdmorgan stanley Earnings Archive 2000 3rd
morgan stanley Earnings Archive 2000 3rdfinance2
 
goldman sachs Consolidated Statement of Financial Condition
goldman sachs Consolidated Statement of Financial Conditiongoldman sachs Consolidated Statement of Financial Condition
goldman sachs Consolidated Statement of Financial Conditionfinance2
 
home depot Annual Report 1989
home depot Annual Report 1989home depot Annual Report 1989
home depot Annual Report 1989finance2
 
Smark Brands & Communities 2014
Smark Brands & Communities 2014 Smark Brands & Communities 2014
Smark Brands & Communities 2014 Dana Pascu
 
Content Creation on the iPad
Content Creation on the iPadContent Creation on the iPad
Content Creation on the iPadManesh Lad
 
Fizan binnaam إلى أصدقائي
Fizan binnaam  إلى أصدقائيFizan binnaam  إلى أصدقائي
Fizan binnaam إلى أصدقائيguest5205f
 
BERKSHIRE HATHAWAY INC Annual & Interim Reports 2005 1st
BERKSHIRE HATHAWAY INC Annual & Interim Reports 2005 1stBERKSHIRE HATHAWAY INC Annual & Interim Reports 2005 1st
BERKSHIRE HATHAWAY INC Annual & Interim Reports 2005 1stfinance2
 
Smark Romanian Youth Focus 2014
Smark Romanian Youth Focus 2014Smark Romanian Youth Focus 2014
Smark Romanian Youth Focus 2014Dana Pascu
 
Merrill Lynch Health Services Investor Conference
	 Merrill Lynch Health Services Investor Conference	 Merrill Lynch Health Services Investor Conference
Merrill Lynch Health Services Investor Conferencefinance2
 

Viewers also liked (20)

Cardinal Health Updates FY09 Outlook Transcript
Cardinal Health Updates FY09 Outlook TranscriptCardinal Health Updates FY09 Outlook Transcript
Cardinal Health Updates FY09 Outlook Transcript
 
أين دارك Fizan binnaam
أين دارك Fizan binnaamأين دارك Fizan binnaam
أين دارك Fizan binnaam
 
Freedom Pass Guide
Freedom Pass GuideFreedom Pass Guide
Freedom Pass Guide
 
Wikiwijs presentatie op Plugfest 2010
Wikiwijs presentatie op Plugfest 2010Wikiwijs presentatie op Plugfest 2010
Wikiwijs presentatie op Plugfest 2010
 
How to setup a DVR for Cheap 
How to setup a DVR for Cheap How to setup a DVR for Cheap 
How to setup a DVR for Cheap 
 
cardinal health UBS Global Healthcare Services Conference 2009
cardinal health UBS Global Healthcare Services Conference 2009cardinal health UBS Global Healthcare Services Conference 2009
cardinal health UBS Global Healthcare Services Conference 2009
 
Mekesson Quarterly Reports 2008 3rd
Mekesson Quarterly Reports 2008  3rdMekesson Quarterly Reports 2008  3rd
Mekesson Quarterly Reports 2008 3rd
 
Going green
Going greenGoing green
Going green
 
valero energy Quarterly and Other SEC Reports 2005 3rd
valero energy  Quarterly and Other SEC Reports 2005 3rdvalero energy  Quarterly and Other SEC Reports 2005 3rd
valero energy Quarterly and Other SEC Reports 2005 3rd
 
morgan stanley Earnings Archive 2000 3rd
morgan stanley Earnings Archive 2000 3rdmorgan stanley Earnings Archive 2000 3rd
morgan stanley Earnings Archive 2000 3rd
 
goldman sachs Consolidated Statement of Financial Condition
goldman sachs Consolidated Statement of Financial Conditiongoldman sachs Consolidated Statement of Financial Condition
goldman sachs Consolidated Statement of Financial Condition
 
Tebak Ukuran
Tebak UkuranTebak Ukuran
Tebak Ukuran
 
The Dutch Case With Oer At Opened
The Dutch Case With Oer At OpenedThe Dutch Case With Oer At Opened
The Dutch Case With Oer At Opened
 
home depot Annual Report 1989
home depot Annual Report 1989home depot Annual Report 1989
home depot Annual Report 1989
 
Smark Brands & Communities 2014
Smark Brands & Communities 2014 Smark Brands & Communities 2014
Smark Brands & Communities 2014
 
Content Creation on the iPad
Content Creation on the iPadContent Creation on the iPad
Content Creation on the iPad
 
Fizan binnaam إلى أصدقائي
Fizan binnaam  إلى أصدقائيFizan binnaam  إلى أصدقائي
Fizan binnaam إلى أصدقائي
 
BERKSHIRE HATHAWAY INC Annual & Interim Reports 2005 1st
BERKSHIRE HATHAWAY INC Annual & Interim Reports 2005 1stBERKSHIRE HATHAWAY INC Annual & Interim Reports 2005 1st
BERKSHIRE HATHAWAY INC Annual & Interim Reports 2005 1st
 
Smark Romanian Youth Focus 2014
Smark Romanian Youth Focus 2014Smark Romanian Youth Focus 2014
Smark Romanian Youth Focus 2014
 
Merrill Lynch Health Services Investor Conference
	 Merrill Lynch Health Services Investor Conference	 Merrill Lynch Health Services Investor Conference
Merrill Lynch Health Services Investor Conference
 

Similar to Mekesson Quarterly Reports 2005 1st

PCARJune2003_10-Q
PCARJune2003_10-QPCARJune2003_10-Q
PCARJune2003_10-Qfinance17
 
PCAR Mar 2004_10-Q
PCAR Mar 2004_10-QPCAR Mar 2004_10-Q
PCAR Mar 2004_10-Qfinance17
 
PCAR June 2004_10-Q
PCAR June 2004_10-QPCAR June 2004_10-Q
PCAR June 2004_10-Qfinance17
 
PCAR Sept 2004_10-Q
PCAR Sept 2004_10-QPCAR Sept 2004_10-Q
PCAR Sept 2004_10-Qfinance17
 
PCARSept2003_10-Q
PCARSept2003_10-QPCARSept2003_10-Q
PCARSept2003_10-Qfinance17
 
johnson controls FY2005 2nd Quarter Form 10-QA
johnson controls  FY2005 2nd Quarter Form 10-QA  johnson controls  FY2005 2nd Quarter Form 10-QA
johnson controls FY2005 2nd Quarter Form 10-QA finance8
 
micron technollogy Q3_01_10Q
micron technollogy Q3_01_10Qmicron technollogy Q3_01_10Q
micron technollogy Q3_01_10Qfinance36
 
thermo fisher Q107_10Q
thermo fisher Q107_10Qthermo fisher Q107_10Q
thermo fisher Q107_10Qfinance40
 
thermo fisher Q207_10Q
thermo fisher Q207_10Qthermo fisher Q207_10Q
thermo fisher Q207_10Qfinance40
 
PCAR June 2002_10-Q
PCAR June 2002_10-QPCAR June 2002_10-Q
PCAR June 2002_10-Qfinance17
 
xcel energy 10qxcel1q04
xcel energy 10qxcel1q04xcel energy 10qxcel1q04
xcel energy 10qxcel1q04finance26
 
10q xcel1q04
10q xcel1q0410q xcel1q04
10q xcel1q04finance26
 
johnson controls FY2006 1st Quarter Form 10-Q
johnson controls  FY2006 1st Quarter Form 10-Q  johnson controls  FY2006 1st Quarter Form 10-Q
johnson controls FY2006 1st Quarter Form 10-Q finance8
 
micron technollogy Q3_00_10Q
micron technollogy Q3_00_10Qmicron technollogy Q3_00_10Q
micron technollogy Q3_00_10Qfinance36
 
johnson controls FY2006 2nd Quarter Form 10-Q
johnson controls  FY2006 2nd Quarter Form 10-Q  johnson controls  FY2006 2nd Quarter Form 10-Q
johnson controls FY2006 2nd Quarter Form 10-Q finance8
 
micron technollogy Q1_01_10Q
micron technollogy Q1_01_10Qmicron technollogy Q1_01_10Q
micron technollogy Q1_01_10Qfinance36
 
thermo fisher Q307_10Q
thermo fisher Q307_10Qthermo fisher Q307_10Q
thermo fisher Q307_10Qfinance40
 
unisys 2Q04_10Q
unisys 2Q04_10Qunisys 2Q04_10Q
unisys 2Q04_10Qfinance36
 
PCAR Sept 2002_10-Q
PCAR Sept 2002_10-QPCAR Sept 2002_10-Q
PCAR Sept 2002_10-Qfinance17
 
micron technollogy Q2_00_10Q
micron technollogy Q2_00_10Qmicron technollogy Q2_00_10Q
micron technollogy Q2_00_10Qfinance36
 

Similar to Mekesson Quarterly Reports 2005 1st (20)

PCARJune2003_10-Q
PCARJune2003_10-QPCARJune2003_10-Q
PCARJune2003_10-Q
 
PCAR Mar 2004_10-Q
PCAR Mar 2004_10-QPCAR Mar 2004_10-Q
PCAR Mar 2004_10-Q
 
PCAR June 2004_10-Q
PCAR June 2004_10-QPCAR June 2004_10-Q
PCAR June 2004_10-Q
 
PCAR Sept 2004_10-Q
PCAR Sept 2004_10-QPCAR Sept 2004_10-Q
PCAR Sept 2004_10-Q
 
PCARSept2003_10-Q
PCARSept2003_10-QPCARSept2003_10-Q
PCARSept2003_10-Q
 
johnson controls FY2005 2nd Quarter Form 10-QA
johnson controls  FY2005 2nd Quarter Form 10-QA  johnson controls  FY2005 2nd Quarter Form 10-QA
johnson controls FY2005 2nd Quarter Form 10-QA
 
micron technollogy Q3_01_10Q
micron technollogy Q3_01_10Qmicron technollogy Q3_01_10Q
micron technollogy Q3_01_10Q
 
thermo fisher Q107_10Q
thermo fisher Q107_10Qthermo fisher Q107_10Q
thermo fisher Q107_10Q
 
thermo fisher Q207_10Q
thermo fisher Q207_10Qthermo fisher Q207_10Q
thermo fisher Q207_10Q
 
PCAR June 2002_10-Q
PCAR June 2002_10-QPCAR June 2002_10-Q
PCAR June 2002_10-Q
 
xcel energy 10qxcel1q04
xcel energy 10qxcel1q04xcel energy 10qxcel1q04
xcel energy 10qxcel1q04
 
10q xcel1q04
10q xcel1q0410q xcel1q04
10q xcel1q04
 
johnson controls FY2006 1st Quarter Form 10-Q
johnson controls  FY2006 1st Quarter Form 10-Q  johnson controls  FY2006 1st Quarter Form 10-Q
johnson controls FY2006 1st Quarter Form 10-Q
 
micron technollogy Q3_00_10Q
micron technollogy Q3_00_10Qmicron technollogy Q3_00_10Q
micron technollogy Q3_00_10Q
 
johnson controls FY2006 2nd Quarter Form 10-Q
johnson controls  FY2006 2nd Quarter Form 10-Q  johnson controls  FY2006 2nd Quarter Form 10-Q
johnson controls FY2006 2nd Quarter Form 10-Q
 
micron technollogy Q1_01_10Q
micron technollogy Q1_01_10Qmicron technollogy Q1_01_10Q
micron technollogy Q1_01_10Q
 
thermo fisher Q307_10Q
thermo fisher Q307_10Qthermo fisher Q307_10Q
thermo fisher Q307_10Q
 
unisys 2Q04_10Q
unisys 2Q04_10Qunisys 2Q04_10Q
unisys 2Q04_10Q
 
PCAR Sept 2002_10-Q
PCAR Sept 2002_10-QPCAR Sept 2002_10-Q
PCAR Sept 2002_10-Q
 
micron technollogy Q2_00_10Q
micron technollogy Q2_00_10Qmicron technollogy Q2_00_10Q
micron technollogy Q2_00_10Q
 

More from finance2

The Home Depot Celebrates Hispanic Culture Through Color and Paint With Color...
The Home Depot Celebrates Hispanic Culture Through Color and Paint With Color...The Home Depot Celebrates Hispanic Culture Through Color and Paint With Color...
The Home Depot Celebrates Hispanic Culture Through Color and Paint With Color...finance2
 
The Home Depot and AARP Launch Nationwide Workshops
The Home Depot and AARP Launch Nationwide WorkshopsThe Home Depot and AARP Launch Nationwide Workshops
The Home Depot and AARP Launch Nationwide Workshopsfinance2
 
Nearly Half of Americans Fail to Check Home Safety Devices at Daylight-Saving...
Nearly Half of Americans Fail to Check Home Safety Devices at Daylight-Saving...Nearly Half of Americans Fail to Check Home Safety Devices at Daylight-Saving...
Nearly Half of Americans Fail to Check Home Safety Devices at Daylight-Saving...finance2
 
View Summary The Home Depot Celebrates the Olympic Spirit With Special Kids...
View Summary  	The Home Depot Celebrates the Olympic Spirit With Special Kids...View Summary  	The Home Depot Celebrates the Olympic Spirit With Special Kids...
View Summary The Home Depot Celebrates the Olympic Spirit With Special Kids...finance2
 
The Home Depot Announces First Quarter Results
The Home Depot Announces First Quarter ResultsThe Home Depot Announces First Quarter Results
The Home Depot Announces First Quarter Resultsfinance2
 
home depot Craig Menear Presentation
home depot Craig Menear Presentationhome depot Craig Menear Presentation
home depot Craig Menear Presentationfinance2
 
home depot 2008 Annual Meeting of Stockholders
home depot 2008 Annual Meeting of Stockholdershome depot 2008 Annual Meeting of Stockholders
home depot 2008 Annual Meeting of Stockholdersfinance2
 
home depot Transcript
home depot 	Transcript home depot 	Transcript
home depot Transcript finance2
 
home depot PDF Carol Tomé Presentation
home depot  PDF  	Carol Tomé Presentation home depot  PDF  	Carol Tomé Presentation
home depot PDF Carol Tomé Presentation finance2
 
home depot Paul Raines Presentation
home depot Paul Raines Presentation home depot Paul Raines Presentation
home depot Paul Raines Presentation finance2
 
home depot http://ir.homedepot.com/common/download/download.cfm?companyid=HD&...
home depot http://ir.homedepot.com/common/download/download.cfm?companyid=HD&...home depot http://ir.homedepot.com/common/download/download.cfm?companyid=HD&...
home depot http://ir.homedepot.com/common/download/download.cfm?companyid=HD&...finance2
 
home depot Annual Report 1982
home depot Annual Report 1982home depot Annual Report 1982
home depot Annual Report 1982finance2
 
home depot PDF Frank Blake Presentation
home depot  PDF  	Frank Blake Presentation home depot  PDF  	Frank Blake Presentation
home depot PDF Frank Blake Presentation finance2
 
home depotForward Looking & Non-GAAP Disclosures
home depotForward Looking & Non-GAAP Disclosures home depotForward Looking & Non-GAAP Disclosures
home depotForward Looking & Non-GAAP Disclosures finance2
 
home depot Bank of America 38th Annual Investment Conference
home depot Bank of America 38th Annual Investment Conferencehome depot Bank of America 38th Annual Investment Conference
home depot Bank of America 38th Annual Investment Conferencefinance2
 
2008 Home Depot Inc. Earnings Conference
2008 Home Depot Inc. Earnings Conference  2008 Home Depot Inc. Earnings Conference
2008 Home Depot Inc. Earnings Conference finance2
 
home depot Quarterly Earnings 2008 3rd
home depot  Quarterly Earnings 2008 3rdhome depot  Quarterly Earnings 2008 3rd
home depot Quarterly Earnings 2008 3rdfinance2
 
home depot Annual Report 1983
home depot Annual Report 1983home depot Annual Report 1983
home depot Annual Report 1983finance2
 
home depot Annual Report 1984
home depot Annual Report 1984home depot Annual Report 1984
home depot Annual Report 1984finance2
 
home depot Annual Report 1985
home depot Annual Report 1985home depot Annual Report 1985
home depot Annual Report 1985finance2
 

More from finance2 (20)

The Home Depot Celebrates Hispanic Culture Through Color and Paint With Color...
The Home Depot Celebrates Hispanic Culture Through Color and Paint With Color...The Home Depot Celebrates Hispanic Culture Through Color and Paint With Color...
The Home Depot Celebrates Hispanic Culture Through Color and Paint With Color...
 
The Home Depot and AARP Launch Nationwide Workshops
The Home Depot and AARP Launch Nationwide WorkshopsThe Home Depot and AARP Launch Nationwide Workshops
The Home Depot and AARP Launch Nationwide Workshops
 
Nearly Half of Americans Fail to Check Home Safety Devices at Daylight-Saving...
Nearly Half of Americans Fail to Check Home Safety Devices at Daylight-Saving...Nearly Half of Americans Fail to Check Home Safety Devices at Daylight-Saving...
Nearly Half of Americans Fail to Check Home Safety Devices at Daylight-Saving...
 
View Summary The Home Depot Celebrates the Olympic Spirit With Special Kids...
View Summary  	The Home Depot Celebrates the Olympic Spirit With Special Kids...View Summary  	The Home Depot Celebrates the Olympic Spirit With Special Kids...
View Summary The Home Depot Celebrates the Olympic Spirit With Special Kids...
 
The Home Depot Announces First Quarter Results
The Home Depot Announces First Quarter ResultsThe Home Depot Announces First Quarter Results
The Home Depot Announces First Quarter Results
 
home depot Craig Menear Presentation
home depot Craig Menear Presentationhome depot Craig Menear Presentation
home depot Craig Menear Presentation
 
home depot 2008 Annual Meeting of Stockholders
home depot 2008 Annual Meeting of Stockholdershome depot 2008 Annual Meeting of Stockholders
home depot 2008 Annual Meeting of Stockholders
 
home depot Transcript
home depot 	Transcript home depot 	Transcript
home depot Transcript
 
home depot PDF Carol Tomé Presentation
home depot  PDF  	Carol Tomé Presentation home depot  PDF  	Carol Tomé Presentation
home depot PDF Carol Tomé Presentation
 
home depot Paul Raines Presentation
home depot Paul Raines Presentation home depot Paul Raines Presentation
home depot Paul Raines Presentation
 
home depot http://ir.homedepot.com/common/download/download.cfm?companyid=HD&...
home depot http://ir.homedepot.com/common/download/download.cfm?companyid=HD&...home depot http://ir.homedepot.com/common/download/download.cfm?companyid=HD&...
home depot http://ir.homedepot.com/common/download/download.cfm?companyid=HD&...
 
home depot Annual Report 1982
home depot Annual Report 1982home depot Annual Report 1982
home depot Annual Report 1982
 
home depot PDF Frank Blake Presentation
home depot  PDF  	Frank Blake Presentation home depot  PDF  	Frank Blake Presentation
home depot PDF Frank Blake Presentation
 
home depotForward Looking & Non-GAAP Disclosures
home depotForward Looking & Non-GAAP Disclosures home depotForward Looking & Non-GAAP Disclosures
home depotForward Looking & Non-GAAP Disclosures
 
home depot Bank of America 38th Annual Investment Conference
home depot Bank of America 38th Annual Investment Conferencehome depot Bank of America 38th Annual Investment Conference
home depot Bank of America 38th Annual Investment Conference
 
2008 Home Depot Inc. Earnings Conference
2008 Home Depot Inc. Earnings Conference  2008 Home Depot Inc. Earnings Conference
2008 Home Depot Inc. Earnings Conference
 
home depot Quarterly Earnings 2008 3rd
home depot  Quarterly Earnings 2008 3rdhome depot  Quarterly Earnings 2008 3rd
home depot Quarterly Earnings 2008 3rd
 
home depot Annual Report 1983
home depot Annual Report 1983home depot Annual Report 1983
home depot Annual Report 1983
 
home depot Annual Report 1984
home depot Annual Report 1984home depot Annual Report 1984
home depot Annual Report 1984
 
home depot Annual Report 1985
home depot Annual Report 1985home depot Annual Report 1985
home depot Annual Report 1985
 

Recently uploaded

Quantitative Analysis of Retail Sector Companies
Quantitative Analysis of Retail Sector CompaniesQuantitative Analysis of Retail Sector Companies
Quantitative Analysis of Retail Sector Companiesprashantbhati354
 
High Class Call Girls Nagpur Grishma Call 7001035870 Meet With Nagpur Escorts
High Class Call Girls Nagpur Grishma Call 7001035870 Meet With Nagpur EscortsHigh Class Call Girls Nagpur Grishma Call 7001035870 Meet With Nagpur Escorts
High Class Call Girls Nagpur Grishma Call 7001035870 Meet With Nagpur Escortsranjana rawat
 
call girls in Nand Nagri (DELHI) 🔝 >༒9953330565🔝 genuine Escort Service 🔝✔️✔️
call girls in  Nand Nagri (DELHI) 🔝 >༒9953330565🔝 genuine Escort Service 🔝✔️✔️call girls in  Nand Nagri (DELHI) 🔝 >༒9953330565🔝 genuine Escort Service 🔝✔️✔️
call girls in Nand Nagri (DELHI) 🔝 >༒9953330565🔝 genuine Escort Service 🔝✔️✔️9953056974 Low Rate Call Girls In Saket, Delhi NCR
 
Dharavi Russian callg Girls, { 09892124323 } || Call Girl In Mumbai ...
Dharavi Russian callg Girls, { 09892124323 } || Call Girl In Mumbai ...Dharavi Russian callg Girls, { 09892124323 } || Call Girl In Mumbai ...
Dharavi Russian callg Girls, { 09892124323 } || Call Girl In Mumbai ...Pooja Nehwal
 
Independent Lucknow Call Girls 8923113531WhatsApp Lucknow Call Girls make you...
Independent Lucknow Call Girls 8923113531WhatsApp Lucknow Call Girls make you...Independent Lucknow Call Girls 8923113531WhatsApp Lucknow Call Girls make you...
Independent Lucknow Call Girls 8923113531WhatsApp Lucknow Call Girls make you...makika9823
 
Best VIP Call Girls Noida Sector 18 Call Me: 8448380779
Best VIP Call Girls Noida Sector 18 Call Me: 8448380779Best VIP Call Girls Noida Sector 18 Call Me: 8448380779
Best VIP Call Girls Noida Sector 18 Call Me: 8448380779Delhi Call girls
 
Andheri Call Girls In 9825968104 Mumbai Hot Models
Andheri Call Girls In 9825968104 Mumbai Hot ModelsAndheri Call Girls In 9825968104 Mumbai Hot Models
Andheri Call Girls In 9825968104 Mumbai Hot Modelshematsharma006
 
OAT_RI_Ep19 WeighingTheRisks_Apr24_TheYellowMetal.pptx
OAT_RI_Ep19 WeighingTheRisks_Apr24_TheYellowMetal.pptxOAT_RI_Ep19 WeighingTheRisks_Apr24_TheYellowMetal.pptx
OAT_RI_Ep19 WeighingTheRisks_Apr24_TheYellowMetal.pptxhiddenlevers
 
20240417-Calibre-April-2024-Investor-Presentation.pdf
20240417-Calibre-April-2024-Investor-Presentation.pdf20240417-Calibre-April-2024-Investor-Presentation.pdf
20240417-Calibre-April-2024-Investor-Presentation.pdfAdnet Communications
 
How Automation is Driving Efficiency Through the Last Mile of Reporting
How Automation is Driving Efficiency Through the Last Mile of ReportingHow Automation is Driving Efficiency Through the Last Mile of Reporting
How Automation is Driving Efficiency Through the Last Mile of ReportingAggregage
 
Call Girls In Yusuf Sarai Women Seeking Men 9654467111
Call Girls In Yusuf Sarai Women Seeking Men 9654467111Call Girls In Yusuf Sarai Women Seeking Men 9654467111
Call Girls In Yusuf Sarai Women Seeking Men 9654467111Sapana Sha
 
VIP Call Girls in Saharanpur Aarohi 8250192130 Independent Escort Service Sah...
VIP Call Girls in Saharanpur Aarohi 8250192130 Independent Escort Service Sah...VIP Call Girls in Saharanpur Aarohi 8250192130 Independent Escort Service Sah...
VIP Call Girls in Saharanpur Aarohi 8250192130 Independent Escort Service Sah...Suhani Kapoor
 
The Economic History of the U.S. Lecture 17.pdf
The Economic History of the U.S. Lecture 17.pdfThe Economic History of the U.S. Lecture 17.pdf
The Economic History of the U.S. Lecture 17.pdfGale Pooley
 
Log your LOA pain with Pension Lab's brilliant campaign
Log your LOA pain with Pension Lab's brilliant campaignLog your LOA pain with Pension Lab's brilliant campaign
Log your LOA pain with Pension Lab's brilliant campaignHenry Tapper
 
Interimreport1 January–31 March2024 Elo Mutual Pension Insurance Company
Interimreport1 January–31 March2024 Elo Mutual Pension Insurance CompanyInterimreport1 January–31 March2024 Elo Mutual Pension Insurance Company
Interimreport1 January–31 March2024 Elo Mutual Pension Insurance CompanyTyöeläkeyhtiö Elo
 
Lundin Gold April 2024 Corporate Presentation v4.pdf
Lundin Gold April 2024 Corporate Presentation v4.pdfLundin Gold April 2024 Corporate Presentation v4.pdf
Lundin Gold April 2024 Corporate Presentation v4.pdfAdnet Communications
 
Instant Issue Debit Cards - High School Spirit
Instant Issue Debit Cards - High School SpiritInstant Issue Debit Cards - High School Spirit
Instant Issue Debit Cards - High School Spiritegoetzinger
 
Stock Market Brief Deck for 4/24/24 .pdf
Stock Market Brief Deck for 4/24/24 .pdfStock Market Brief Deck for 4/24/24 .pdf
Stock Market Brief Deck for 4/24/24 .pdfMichael Silva
 
VVIP Pune Call Girls Katraj (7001035870) Pune Escorts Nearby with Complete Sa...
VVIP Pune Call Girls Katraj (7001035870) Pune Escorts Nearby with Complete Sa...VVIP Pune Call Girls Katraj (7001035870) Pune Escorts Nearby with Complete Sa...
VVIP Pune Call Girls Katraj (7001035870) Pune Escorts Nearby with Complete Sa...Call Girls in Nagpur High Profile
 

Recently uploaded (20)

Quantitative Analysis of Retail Sector Companies
Quantitative Analysis of Retail Sector CompaniesQuantitative Analysis of Retail Sector Companies
Quantitative Analysis of Retail Sector Companies
 
High Class Call Girls Nagpur Grishma Call 7001035870 Meet With Nagpur Escorts
High Class Call Girls Nagpur Grishma Call 7001035870 Meet With Nagpur EscortsHigh Class Call Girls Nagpur Grishma Call 7001035870 Meet With Nagpur Escorts
High Class Call Girls Nagpur Grishma Call 7001035870 Meet With Nagpur Escorts
 
call girls in Nand Nagri (DELHI) 🔝 >༒9953330565🔝 genuine Escort Service 🔝✔️✔️
call girls in  Nand Nagri (DELHI) 🔝 >༒9953330565🔝 genuine Escort Service 🔝✔️✔️call girls in  Nand Nagri (DELHI) 🔝 >༒9953330565🔝 genuine Escort Service 🔝✔️✔️
call girls in Nand Nagri (DELHI) 🔝 >༒9953330565🔝 genuine Escort Service 🔝✔️✔️
 
Dharavi Russian callg Girls, { 09892124323 } || Call Girl In Mumbai ...
Dharavi Russian callg Girls, { 09892124323 } || Call Girl In Mumbai ...Dharavi Russian callg Girls, { 09892124323 } || Call Girl In Mumbai ...
Dharavi Russian callg Girls, { 09892124323 } || Call Girl In Mumbai ...
 
Independent Lucknow Call Girls 8923113531WhatsApp Lucknow Call Girls make you...
Independent Lucknow Call Girls 8923113531WhatsApp Lucknow Call Girls make you...Independent Lucknow Call Girls 8923113531WhatsApp Lucknow Call Girls make you...
Independent Lucknow Call Girls 8923113531WhatsApp Lucknow Call Girls make you...
 
Best VIP Call Girls Noida Sector 18 Call Me: 8448380779
Best VIP Call Girls Noida Sector 18 Call Me: 8448380779Best VIP Call Girls Noida Sector 18 Call Me: 8448380779
Best VIP Call Girls Noida Sector 18 Call Me: 8448380779
 
Andheri Call Girls In 9825968104 Mumbai Hot Models
Andheri Call Girls In 9825968104 Mumbai Hot ModelsAndheri Call Girls In 9825968104 Mumbai Hot Models
Andheri Call Girls In 9825968104 Mumbai Hot Models
 
OAT_RI_Ep19 WeighingTheRisks_Apr24_TheYellowMetal.pptx
OAT_RI_Ep19 WeighingTheRisks_Apr24_TheYellowMetal.pptxOAT_RI_Ep19 WeighingTheRisks_Apr24_TheYellowMetal.pptx
OAT_RI_Ep19 WeighingTheRisks_Apr24_TheYellowMetal.pptx
 
20240417-Calibre-April-2024-Investor-Presentation.pdf
20240417-Calibre-April-2024-Investor-Presentation.pdf20240417-Calibre-April-2024-Investor-Presentation.pdf
20240417-Calibre-April-2024-Investor-Presentation.pdf
 
How Automation is Driving Efficiency Through the Last Mile of Reporting
How Automation is Driving Efficiency Through the Last Mile of ReportingHow Automation is Driving Efficiency Through the Last Mile of Reporting
How Automation is Driving Efficiency Through the Last Mile of Reporting
 
Call Girls In Yusuf Sarai Women Seeking Men 9654467111
Call Girls In Yusuf Sarai Women Seeking Men 9654467111Call Girls In Yusuf Sarai Women Seeking Men 9654467111
Call Girls In Yusuf Sarai Women Seeking Men 9654467111
 
VIP Call Girls in Saharanpur Aarohi 8250192130 Independent Escort Service Sah...
VIP Call Girls in Saharanpur Aarohi 8250192130 Independent Escort Service Sah...VIP Call Girls in Saharanpur Aarohi 8250192130 Independent Escort Service Sah...
VIP Call Girls in Saharanpur Aarohi 8250192130 Independent Escort Service Sah...
 
The Economic History of the U.S. Lecture 17.pdf
The Economic History of the U.S. Lecture 17.pdfThe Economic History of the U.S. Lecture 17.pdf
The Economic History of the U.S. Lecture 17.pdf
 
Log your LOA pain with Pension Lab's brilliant campaign
Log your LOA pain with Pension Lab's brilliant campaignLog your LOA pain with Pension Lab's brilliant campaign
Log your LOA pain with Pension Lab's brilliant campaign
 
Interimreport1 January–31 March2024 Elo Mutual Pension Insurance Company
Interimreport1 January–31 March2024 Elo Mutual Pension Insurance CompanyInterimreport1 January–31 March2024 Elo Mutual Pension Insurance Company
Interimreport1 January–31 March2024 Elo Mutual Pension Insurance Company
 
Lundin Gold April 2024 Corporate Presentation v4.pdf
Lundin Gold April 2024 Corporate Presentation v4.pdfLundin Gold April 2024 Corporate Presentation v4.pdf
Lundin Gold April 2024 Corporate Presentation v4.pdf
 
Instant Issue Debit Cards - High School Spirit
Instant Issue Debit Cards - High School SpiritInstant Issue Debit Cards - High School Spirit
Instant Issue Debit Cards - High School Spirit
 
🔝+919953056974 🔝young Delhi Escort service Pusa Road
🔝+919953056974 🔝young Delhi Escort service Pusa Road🔝+919953056974 🔝young Delhi Escort service Pusa Road
🔝+919953056974 🔝young Delhi Escort service Pusa Road
 
Stock Market Brief Deck for 4/24/24 .pdf
Stock Market Brief Deck for 4/24/24 .pdfStock Market Brief Deck for 4/24/24 .pdf
Stock Market Brief Deck for 4/24/24 .pdf
 
VVIP Pune Call Girls Katraj (7001035870) Pune Escorts Nearby with Complete Sa...
VVIP Pune Call Girls Katraj (7001035870) Pune Escorts Nearby with Complete Sa...VVIP Pune Call Girls Katraj (7001035870) Pune Escorts Nearby with Complete Sa...
VVIP Pune Call Girls Katraj (7001035870) Pune Escorts Nearby with Complete Sa...
 

Mekesson Quarterly Reports 2005 1st

  • 1. SECURITIES AND EXCHANGE COMMISSION Washington, D.C. 20549 FORM 10-Q (Mark One) ⌧ QUARTERLY REPORT PURSUANT TO SECTION 13 OR 15(d) OF THE SECURITIES EXCHANGE ACT OF 1934 For quarter ended June 30, 2004 TRANSITION REPORT PURSUANT TO SECTION 13 OR 15(d) OF THE SECURITIES EXCHANGE ACT OF 1934 For the transition period from to Commission file number 1-13252 McKESSON CORPORATION (Exact name of Registrant as specified in its charter) Delaware 94-3207296 (State or other jurisdiction of incorporation or organization) (IRS Employer Identification No.) One Post Street, San Francisco, California 94104 (Address of principal executive offices) (Zip Code) (415) 983-8300 (Registrant’s telephone number, including area code) Indicate by check mark whether the Registrant (1) has filed all reports required to be filed by Section 13 or 15(d) of the Securities Exchange Act of 1934 during the preceding 12 months (or for such shorter period that the Registrant was required to file such reports), and (2) has been subject to such filing requirements for the past 90 days. Yes ⌧ No Indicate by check mark whether the registrant is an accelerated filer. Yes ⌧ No Indicate the number of shares outstanding of each of the issuer’s classes of common stock, as of the latest practicable date. Class Outstanding at June 30, 2004 Common stock, $0.01 par value 293,590,306 shares 1
  • 2. McKESSON CORPORATION TABLE OF CONTENTS Item Page PART I. FINANCIAL INFORMATION 1. Condensed Financial Statements Consolidated Balance Sheets June 30, 2004 and March 31, 2004 ...................................................................................... 3 Consolidated Statements of Operations Quarter ended June 30, 2004 and 2003 ................................................................................ 4 Consolidated Statements of Cash Flows Quarter ended June 30, 2004 and 2003 ................................................................................ 5 Financial Notes............................................................................................................................ 6-14 2. Management’s Discussion and Analysis of Results of Operations and Financial Condition Financial Review.................................................................................................................. 15-20 3. Quantitative and Qualitative Disclosures about Market Risk...................................................... 20 4. Controls and Procedures.............................................................................................................. 20 PART II. OTHER INFORMATION 1. Legal Proceedings ....................................................................................................................... 21 2. Changes in Securities, Use of Proceeds and Issuer Purchases of Equity Securities.................... 21 6. Exhibits and Reports on Form 8-K.............................................................................................. 21 Signatures.................................................................................................................................... 21 2
  • 3. McKESSON CORPORATION PART I. FINANCIAL INFORMATION CONDENSED CONSOLIDATED BALANCE SHEETS (In millions, except per share amounts) (Unaudited) June 30, March 31, 2004 2004 ASSETS Current Assets Cash and cash equivalents $ 836.7 $ 708.0 Marketable securities available for sale 10.1 9.8 Receivables, net 5,448.4 5,418.8 Inventories 7,379.2 6,735.1 Prepaid expenses and other 141.9 132.5 Total 13,816.3 13,004.2 Property, Plant and Equipment, net 594.4 599.9 Capitalized Software Held for Sale 129.2 129.4 Notes Receivable 200.0 172.2 Goodwill and Other Intangibles 1,503.0 1,490.2 Other Assets 900.5 844.3 Total Assets $ 17,143.4 $ 16,240.2 LIABILITIES AND STOCKHOLDERS’ EQUITY Current Liabilities Drafts and accounts payable $ 8,253.6 $ 7,364.0 Deferred revenue 469.8 503.2 Short-term borrowings 23.4 - Current portion of long-term debt 263.0 274.8 Other 1,002.6 1,274.3 Total 10,012.4 9,416.3 Postretirement Obligations and Other Noncurrent Liabilities 502.8 448.8 Long-Term Debt 1,205.2 1,209.8 Other Commitments and Contingent Liabilities (Note 11) Stockholders’ Equity Preferred stock, $0.01 par value, 100.0 shares authorized, no shares issued or outstanding - - Common stock, $0.01 par value, 800.0 shares authorized, shares issued: June 30, 2004 – 300.4 and March 31, 2004 – 297.1 3.0 3.0 Additional paid-in capital 2,155.0 2,047.1 Other (45.1) (43.2) Retained earnings 3,566.7 3,420.6 Accumulated other comprehensive losses (22.3) (15.6) ESOP notes and guarantees (40.0) (52.5) Treasury shares, at cost, June 30, 2004 and March 31, 2004 – 6.8 (194.3) (194.1) Total Stockholders’ Equity 5,423.0 5,165.3 Total Liabilities and Stockholders’ Equity $ 17,143.4 $ 16,240.2 See Financial Notes 3
  • 4. McKESSON CORPORATION CONDENSED CONSOLIDATED STATEMENTS OF OPERATIONS (In millions, except per share amounts) (Unaudited) Quarter Ended June 30, 2004 2003 Revenues $ 19,186.6 $ 16,524.2 Cost of Sales 18,334.6 15,737.7 Gross Profit 852.0 786.5 Operating Expenses 591.2 534.9 Operating Income 260.8 251.6 Interest Expense (29.6) (29.8) Other Income, Net 14.9 11.9 Income Before Income Taxes 246.1 233.7 Income Taxes (82.5) (78.1) Net Income $ 163.6 $ 155.6 Earnings Per Common Share Diluted $ 0.55 $ 0.53 Basic $ 0.56 $ 0.54 Dividends Declared Per Common Share $ 0.06 $ 0.06 Weighted Average Shares Diluted 300.1 298.1 Basic 291.4 289.8 See Financial Notes 4
  • 5. McKESSON CORPORATION CONDENSED CONSOLIDATED STATEMENTS OF CASH FLOWS (In millions) (Unaudited) Quarter Ended June 30, 2004 2003 Operating Activities Net income $ 163.6 $ 155.6 Adjustments to reconcile to net cash provided (used) by operating activities: Depreciation 27.4 25.1 Amortization 33.9 27.9 Provision for bad debts 6.7 2.6 Deferred taxes on income 107.2 39.0 Other non-cash items (1.0) (1.9) Total 337.8 248.3 Effects of changes in: Receivables (65.9) (464.5) Inventories (636.4) 76.3 Drafts and accounts payable 664.1 317.2 Deferred revenue (35.3) (36.5) Taxes (49.2) 4.7 Other (86.8) (104.7) Total (209.5) (207.5) Net cash provided by operating activities 128.3 40.8 Investing Activities Property acquisitions (22.9) (30.3) Capitalized software expenditures (37.0) (50.8) Acquisitions of businesses, less cash and cash equivalents acquired (37.4) (0.6) Notes receivable issuances, net (28.0) (4.0) Proceeds from sale of notes receivable 21.0 - Proceeds from sale of business 12.3 - Other (4.8) 22.3 Net cash used by investing activities (96.8) (63.4) Financing Activities Proceeds from issuance of debt 23.4 - Repayment of debt (12.9) (5.4) Capital stock transactions: Issuances 83.0 34.7 Share repurchases - (75.3) ESOP notes and guarantees 12.5 4.9 Dividends paid (17.5) (17.5) Other 8.7 4.4 Net cash provided (used) by financing activities 97.2 (54.2) Net increase (decrease) in cash and cash equivalents 128.7 (76.8) Cash and cash equivalents at beginning of period 708.0 522.0 Cash and cash equivalents at end of period $ 836.7 $ 445.2 See Financial Notes 5
  • 6. McKESSON CORPORATION FINANCIAL NOTES (Unaudited) 1. Significant Accounting Policies Basis of Presentation. The condensed consolidated financial statements of McKesson Corporation (“McKesson,” the “Company,” or “we” and other similar pronouns) include the financial statements of all majority- owned or controlled companies. Significant intercompany transactions and balances have been eliminated. In our opinion, these unaudited condensed consolidated financial statements include all adjustments necessary for a fair presentation of the Company’s financial position as of June 30, 2004, and the results of operations and cash flows for the quarters ended June 30, 2004 and 2003. The results of operations for the quarters ended June 30, 2004 and 2003 are not necessarily indicative of the results that may be expected for the entire year. These interim financial statements should be read in conjunction with the annual audited financial statements, accounting policies and financial notes included in our 2004 consolidated financial statements previously filed with the Securities and Exchange Commission (“SEC”). As described in our Annual Report on Form 10-K for the year ended March 31, 2004, we reorganized our businesses on April 1, 2004. This reorganization resulted in changes to our reporting segments. On April 29 and 30, 2004, we provided financial information about this reorganization, as it relates to prior periods, in a Form 8-K. Certain prior period amounts have been reclassified to conform to the current period presentation. The Company’s fiscal year begins on April 1 and ends on March 31. Unless otherwise noted, all references to a particular year shall mean the Company’s fiscal year. New Accounting Pronouncements. In June 2001, the Financial Accounting Standards Board (“FASB”) issued Statement of Financial Accounting Standard (“SFAS”) No. 143, “Accounting for Asset Retirement Obligations,” which addresses financial accounting requirements for retirement obligations associated with tangible long-lived assets. In May 2002, the FASB issued SFAS No. 145, “Rescission of FASB Statements 4, 44, 64, Amendment to FASB Statement No. 13, and Technical Corrections as of April 2002.” SFAS No. 145 amends other existing authoritative pronouncements to make various technical corrections, clarify meanings, or describe their applicability under changed conditions. SFAS Nos. 143 and 145 became effective for 2004. The adoption of these standards did not have a material impact on our consolidated financial statements. In January 2003, the FASB issued Interpretation (“FIN”) No. 46, “Consolidation of Variable Interest Entities” and in December 2003, a revised interpretation was issued (FIN No. 46(R)). In general, a variable interest entity (“VIE”) is a corporation, partnership, trust, or any other legal structure used for business purposes that either does not have equity investors with voting rights or has equity investors that do not provide sufficient financial resources for the entity to support its activities. FIN No. 46 requires a VIE to be consolidated by a company if that company is designated as the primary beneficiary. The interpretation applies to VIEs created after January 31, 2003, and for all financial statements issued after December 15, 2003 for VIEs in which an enterprise held a variable interest that it acquired before February 1, 2003. We implemented FIN Nos. 46 and 46(R) on a retroactive basis as required in 2004. As a result of the implementation, the Company no longer consolidates its investment in the McKesson Financing Trust (the “Trust”) as the Company was not designated as the Trust’s primary beneficiary. In accordance with this accounting standard, the Company now recognizes the debentures issued to the Trust as long-term debt in its consolidated financial statements in lieu of the preferred securities that the Trust issued to third parties. Additionally, the consolidated financial statements include interest expense on the debentures and no longer report dividends on the preferred securities, net of tax. These changes increased the Company’s net debt to net capital employed ratio slightly but did not have a material impact on our consolidated financial statements, including diluted earnings per share. In April 2003, the FASB issued SFAS No. 149, “Amendment of Statement 133 on Derivative Instruments and Hedging Activities.” SFAS No. 149 amends SFAS No. 133 for decisions made as part of the FASB’s Derivatives Implementation Group process, other FASB projects dealing with financial instruments, and in connection with implementation issues raised in relation to the application of the definition of a derivative. This statement is generally effective for contracts entered into or modified after June 30, 2003 and for hedging relationships designated after June 30, 2003. The adoption of this standard did not have a material impact on our consolidated financial statements. In May 2003, the FASB issued SFAS No. 150, “Accounting for Certain Financial Instruments with Characteristics of both Liabilities and Equity.” SFAS No. 150 clarifies the definition of a liability as currently 6
  • 7. McKESSON CORPORATION FINANCIAL NOTES (Continued) (Unaudited) defined in FASB Concepts Statement No. 6, “Elements of Financial Statements,” as well as other planned revisions. This statement requires a financial instrument that embodies an obligation of an issuer to be classified as a liability. In addition, the statement establishes standards for the initial and subsequent measurement of these financial instruments and disclosure requirements. SFAS No. 150 is effective for financial instruments entered into or modified after May 31, 2003 and for all other matters, at the beginning of our second quarter 2004. The adoption of this standard did not have a material impact on our consolidated financial statements. In December 2003, the Staff of the SEC issued Staff Accounting Bulletin (“SAB”) No. 104, “Revenue Recognition,” which supersedes SAB No. 101, “Revenue Recognition in Financial Statements.” SAB No. 104’s primary purpose is to rescind the accounting guidance contained in SAB No. 101 related to multiple-element revenue arrangements that was superseded as a result of the issuance of Emerging Issues Task Force (“EITF”) Issue No. 00-21. Additionally, SAB No. 104 rescinds the SEC’s related Revenue Recognition in Financial Statements Frequently Asked Questions and Answers issued with SAB No. 101 that had previously been codified by the SEC. While the wording of SAB No. 104 reflects the issuance of EITF Issue No. 00-21, the revenue recognition principles of SAB No. 101 remain largely unchanged by the issuance of SAB No. 104, which was effective upon issuance. The adoption of SAB No. 104 did not have a material effect on our consolidated financial position or results of operations. In January 2004, the FASB issued Financial Staff Position (“FSP”) 106-1, “Accounting and Disclosure Requirements Related to the Medicare Prescription Drug, Improvement and Modernization Act of 2003.” As permitted by FSP No. 106-1, we elected to defer recognizing the effects of the Medicare Prescription Drug, Improvement and Modernization Act of 2003 (the “Act”) until authoritative guidance on accounting for the new federal subsidy is issued. In May 2004, the FASB issued FSP No. 106-2 which provides accounting guidance for this new subsidy. The Company sponsors a number of postretirement benefit plans which may benefit from the subsidy and as a result, we are currently evaluating the impact of FSP No. 106-2, which we are required to adopt in our second quarter of 2005. Employee Stock-Based Compensation. We account for our employee stock-based compensation plans using the intrinsic value method under Accounting Principles Board (“APB”) Opinion No. 25, “Accounting for Stock Issued to Employees.” We apply the disclosure provisions of SFAS No. 123, “Accounting for Stock-Based Compensation,” as amended by SFAS No. 148, “Accounting for Stock-Based Compensation – Transition and Disclosure.” Had compensation cost for our employee stock-based compensation been recognized based on the fair value method, consistent with the provisions of SFAS No. 123, net income and earnings per share would have been as follows: Quarter Ended June 30, 2004 2003 (In millions, except per share amounts) Net income, as reported $ 163.6 $ 155.6 Compensation expense, net of tax: APB Opinion No. 25 expense included in net income 1.4 0.8 SFAS No. 123 expense (7.6) (26.7) Pro forma net income $ 157.4 $ 129.7 Earnings per common share: Diluted – as reported $ 0.55 $ 0.53 Diluted – pro forma 0.53 0.44 Basic – as reported 0.56 0.54 Basic – pro forma 0.54 0.45 SFAS No. 123 compensation expense, as indicated in the above table, decreased in the first quarter of 2005 compared to the same period a year ago. The decrease is primarily attributable to accelerated vesting of substantially all unvested stock options outstanding during the fourth quarter of 2004. SFAS No. 123 compensation expense is typically amortized over the related vesting period; as a result, these fully vested stock options did not have an impact on the expense during the current quarter. Partially offsetting this decrease, during the first quarter of 2005, we granted 6.0 million stock options that vest on or before March 31, 2005 and have a seven year term. Historically, options granted by the Company generally vest over four years and have a term of ten years. 7
  • 8. McKESSON CORPORATION FINANCIAL NOTES (Continued) (Unaudited) 2. Acquisitions and Divestiture On April 1, 2004, we acquired all of the issued and outstanding shares of Moore Medical Corp. (“MMC”), of New Britain, Connecticut, for an aggregate cash purchase price of approximately $37 million. MMC is an Internet- enabled, multi-channel marketer and distributor of medical-surgical and pharmaceutical products to non-hospital provider settings. Approximately $24 million of the purchase price has been assigned to goodwill, none of which is deductible for tax purposes. The results of MMC’s operations have been included in the condensed consolidated financial statements within our Medical-Surgical Solutions segment since the acquisition date. We also completed several smaller acquisitions in 2004 within our Medical-Surgical Solutions and Provider Technologies segments. Pro forma results of operations for our business acquisitions have not been presented because the effects were not material to the condensed consolidated financial statements on either an individual or aggregate basis. During the first quarter of 2005, we sold a business for net cash proceeds of $12.3 million. The disposition resulted in a pre-tax loss of $1.1 million and an after-tax loss of $4.6 million. Financial results for this business were included in our Pharmaceutical Solutions segment and were not material to our condensed consolidated financial statements. 3. Restructuring Activities Net charges from restructuring activities for the first quarter of 2005 and 2004 were $0.6 million and $1.3 million. These charges primarily related to a number of smaller initiatives offset in part by a reversal of prior years’ restructuring reserves due to a change in estimated costs to complete these activities. The following table summarizes restructuring activities for the quarter ended June 30, 2004: Pharmaceutical Medical-Surgical Provider Solutions Solutions Technologies Corporate Exit- Exit- Exit- (In millions) Severance Related Severance Related Severance Related Severance Total $ 0.4 $ 5.2 $ 1.7 $ 1.9 $ 0.2 $ 1.9 $ 10.5 $ 21.8 Balance, March 31, 2004 Current year expenses - - 0.8 - - - - 0.8 Adjustments to prior years’ expenses - - (0.2) - - - - (0.2) Net expense for the period - - 0.6 - - - - 0.6 Liabilities related to the MMC acquisition - - 4.0 - - - - 4.0 Cash expenditures (0.2) (0.5) (0.8) (0.3) - (0.1) (9.1) (11.0) $ 0.2 $ 4.7 $ 5.5 $ 1.6 $ 0.2 $ 1.8 $ 1.4 $ 15.4 Balance, June 30, 2004 Accrued restructuring liabilities are included in other liabilities in the accompanying condensed consolidated balance sheets. In connection with the acquisition of MMC, we recorded $4.0 million of restructuring reserves related to employee termination costs. These costs have been recognized as liabilities assumed in the purchase price of MMC. In addition to the above restructuring activities, we are still managing a 2001/2000 restructuring plan associated with customer settlements for the discontinuance of overlapping and nonstrategic products and other product development projects within our Provider Technologies segment. Customer settlement allowances, which are included as a reduction of accounts receivable in the accompanying condensed consolidated balance sheets, were reduced by $0.4 million in non-cash settlements during the first quarter of 2005 to $5.8 million at June 30, 2004 from $6.2 million at March 31, 2004. Total cash and non-cash settlements of $45.3 million and $95.4 million have been incurred since the inception of this restructuring plan. Non-cash settlements represent write-offs of customer receivables. There have been no significant offsetting changes in estimates that increased the provision for customer settlements. At March 31, 2004, we substantially completed our negotiations with the affected customers. As a result, we do not anticipate additional significant increases to the allowance for customer settlements. However, as 8
  • 9. McKESSON CORPORATION FINANCIAL NOTES (Continued) (Unaudited) settlement negotiations with the remaining customers are finalized, additional adjustments to the reserve may be necessary. 4. Earnings Per Share Basic earnings per share is computed by dividing net income by the weighted average number of common shares outstanding during the reporting period. Diluted earnings per share is computed similarly except that it reflects the potential dilution that could occur if dilutive securities or other obligations to issue common stock were exercised or converted into common stock. The computations for basic and diluted earnings per share are as follows: Quarter Ended June 30, 2004 2003 (In millions, except per share amounts) Net income $ 163.6 $ 155.6 Interest expense on convertible junior subordinated debentures, net of tax benefit 1.5 1.5 Net income – diluted $ 165.1 $ 157.1 Weighted average common shares outstanding: Basic 291.4 289.8 Effect of dilutive securities: Options to purchase common stock 3.2 2.3 Convertible junior subordinated debentures 5.4 5.4 Restricted stock 0.1 0.6 Diluted 300.1 298.1 Earnings per common share: Basic $ 0.56 $ 0.54 Diluted $ 0.55 $ 0.53 Approximately 34 million and 43 million stock options were excluded from the computations of diluted net earnings per share for the quarters ended June 30, 2004 and 2003 as their exercise price was higher than the Company’s average stock price. 5. Goodwill and Other Intangibles Changes in the carrying amount of goodwill for the quarter ended June 30, 2004, are as follows: Medical- Pharmaceutical Surgical Provider Total Solutions Solutions Technologies (In millions) $ 297.7 $ 725.2 $ 382.9 $ 1,405.8 Balance, March 31, 2004 Goodwill acquired - 23.7 - 23.7 Sale of business (10.3) - - (10.3) Translation adjustments (1.0) - (1.4) (2.4) $ 286.4 $ 748.9 $ 381.5 $ 1,416.8 Balance, June 30, 2004 9
  • 10. McKESSON CORPORATION FINANCIAL NOTES (Continued) (Unaudited) Information regarding other intangibles is as follows: June 30, March 31, 2004 2004 (In millions) Customer lists $ 97.9 $ 92.9 Technology 63.7 61.2 Trademarks and other 23.7 23.8 Total other intangibles, gross 185.3 177.9 Accumulated amortization (99.1) (93.5) Total other intangibles, net $ 86.2 $ 84.4 Amortization expense of other intangibles was $6.2 million and $4.6 million for the quarters ended June 30, 2004 and 2003. The weighted average remaining amortization periods for customer lists, technology and trademarks and other intangible assets at June 30, 2004 were: 8 years, 4 years and 5 years. Estimated future annual amortization expense of these assets is as follows: $16.5 million, $14.9 million, $15.1 million, $15.7 million and $6.1 million for 2005 through 2009, and $9.1 million thereafter. At June 30, 2004, there was $15.0 million of other intangibles not subject to amortization. 6. Financing Activity In June 2004, we renewed our committed accounts receivable sales facility under substantially similar terms to those previously in place with the exception that the facility was increased by $300.0 million to $1.4 billion. The renewed facility expires in June 2005. At June 30, 2004, there were no amounts utilized under this facility. 7. Convertible Junior Subordinated Debentures In February 1997, we issued 5% Convertible Junior Subordinated Debentures (the “Debentures”) in an aggregate principal amount of $206,186,000. The Debentures, which are included in long-term debt, mature on June 1, 2027, bear interest at an annual rate of 5%, payable quarterly, and are currently redeemable by us at 101.5% of the principal amount. The Debentures were purchased by the Trust, which is wholly owned by the Company, with proceeds from its issuance of four million shares of preferred securities to the public and 123,720 common securities to us. These preferred securities are convertible at the holder’s option into the Company’s common stock. The Debentures represent the sole assets of the Trust. Holders of the preferred securities are entitled to cumulative cash distributions at an annual rate of 5% of the liquidation amount of $50 per security. Each preferred security is convertible at the rate of 1.3418 shares of the Company’s common stock, subject to adjustment in certain circumstances. The preferred securities will be redeemed upon repayment of the Debentures and are callable by us on or after March 4, 2000, in whole or in part, initially at 103.5% of the liquidation preference per share, and thereafter at prices declining at 0.5% per annum to 100% of the liquidation preference on and after March 4, 2007 plus, in each case, accumulated, accrued and unpaid distributions, if any, to the redemption date. We have guaranteed, on a subordinated basis, distributions and other payments due on the preferred securities (the “Guarantee”). The Guarantee, when taken together with our obligations under the Debentures, and in the indenture pursuant to which the Debentures were issued, and our obligations under the Amended and Restated Declaration of Trust governing the Trust, provides a full and unconditional guarantee of amounts due on the preferred securities. 10
  • 11. McKESSON CORPORATION FINANCIAL NOTES (Continued) (Unaudited) 8. Pension and Other Postretirement Benefit Plans The following table provides the components of the net periodic expense for the Company’s defined benefit pension and postretirement plans: Quarter Ended June 30, Pension Postretirement 2004 2003 2004 2003 (In millions) Service cost—benefits earned during the period $ 1.4 $ 1.6 $ 0.5 $ 0.5 Interest cost on projected benefit obligation 6.4 6.8 2.9 2.9 Expected return on assets (7.4) (6.4) - - Amortization of unrecognized loss and prior service costs 2.2 3.0 7.1 5.8 Immediate recognition of pension cost 0.7 - - - Settlements and other 16.6 - - - Net periodic expense $ 19.9 $ 5.0 $ 10.5 $ 9.2 In April 2004, we made several lump sum payments totaling approximately $42 million from an unfunded U.S. pension plan. In accordance with SFAS No. 88, “Employers’ Accounting for Settlements and Curtailments of Defined Benefit Pension Plans and for Termination Benefits”, approximately $12 million in settlement charges associated with these payments were expensed in the first quarter of 2005. Substantially all of this expense was recorded in the Corporate segment. 9. Stockholders’ Equity Comprehensive income is as follows: Quarter Ended June 30, 2004 2003 (In millions) Net income $ 163.6 $ 155.6 Foreign currency translation adjustments (6.7) 33.5 Comprehensive income $ 156.9 $ 189.1 10. Financial Guarantees and Warranties Financial Guarantees We have agreements with certain of our customers’ financial institutions under which we have guaranteed the repurchase of inventory (primarily for our Canadian businesses), at a discount, in the event these customers are unable to meet certain obligations to those financial institutions. Among other limitations, these inventories must be in resalable condition. We have also guaranteed loans, credit facilities and the payment of leases for some customers; and we are a secured lender for substantially all of these guarantees. During the first quarter of 2005, we converted a $40.0 million credit facility guarantee in favor of a customer (that recently emerged from bankruptcy) to a note receivable due from this customer. This secured note bears interest and is repayable in various payments through 2007. Customer guarantees range from one to ten years and were primarily provided to facilitate financing for certain strategic customers. At June 30, 2004, the maximum amounts of inventory repurchase guarantees and other customer guarantees were approximately $155 million and $15 million of which a nominal amount has been accrued. At June 30, 2004, we had commitments of $11.0 million, primarily consisting of the purchase of services from our equity-held investments, for which no amounts had been accrued. 11
  • 12. McKESSON CORPORATION FINANCIAL NOTES (Continued) (Unaudited) In addition, our banks and insurance companies have issued $85.2 million of standby letters of credit and surety bonds on our behalf in order to meet the security requirements for statutory licenses and permits, court and fiduciary obligations, and our workers’ compensation and automotive liability programs. Our software license agreements generally include certain provisions for indemnifying customers against liabilities if our software products infringe a third party’s intellectual property rights. To date, we have not incurred any material costs as a result of such indemnification agreements and have not accrued any liabilities related to such obligations. In conjunction with certain transactions, primarily divestitures, we may provide routine indemnification agreements (such as retention of previously existing environmental, tax and employee liabilities) whose terms vary in duration and often are not explicitly defined. Where appropriate, obligations for such indemnifications are recorded as liabilities. Because the amounts of these indemnification obligations often are not explicitly stated, the overall maximum amount of these commitments cannot be reasonably estimated. Other than obligations recorded as liabilities at the time of divestiture, we have historically not made significant payments as a result of these indemnification provisions. Warranties In the normal course of business, we provide certain warranties and indemnification protection for our products and services. For example, we provide warranties that the pharmaceutical and medical-surgical products we distribute are in compliance with the Food, Drug and Cosmetic Act and other applicable laws and regulations. We have received the same warranties from our suppliers, who customarily are the manufacturers of the products. In addition, we have indemnity obligations to our customers for these products, which have also been provided to us from our suppliers, either through express agreement or by operation of law. We also provide warranties regarding the performance of software and automation products we sell. Our liability under these warranties is to bring the product into compliance with previously agreed upon specifications. For software products, this may result in additional project costs which are reflected in our estimates used for the percentage-of-completion method of accounting for software installation services within these contracts. In addition, most of our customers who purchase our software and automation products also purchase annual maintenance agreements. Revenue from these maintenance agreements is recognized on a straight-line basis over the contract period and the cost of servicing product warranties is charged to expense when claims become estimable. Accrued warranty costs were not material to the condensed consolidated balance sheets. 11. Other Commitments and Contingent Liabilities In our annual report on Form 10-K for the year ended March 31, 2004, we reported on numerous legal proceedings including those arising out of our announcement on April 28, 1999, regarding accounting improprieties at HBO & Company, now known as McKesson Information Solutions LLC (the “Accounting Litigation”), and other litigation and contingencies. Since the date of that report the only significant developments were as follows: I. Accounting Litigation On April 7, 2004, in the previously reported action captioned The State of Oregon Public Employees Retirement Board v. McKesson HBOC, Inc. et al. (Master File No. 307619), the Honorable Donald S. Mitchell in the California Superior Court, City and County of San Francisco sustained plaintiffs’ motion to dismiss the Company’s cross- claims for “unjust enrichment.” On April 26, 2004, in the previously reported action captioned In re McKesson HBOC, Inc. Securities Litigation, (N.D. Cal. Case No. C-99-20743-RMW) (the “Consolidated Action”), plaintiff Theodore H. Pacha filed a request to be named Lead Plaintiff of a subclass of shareholders who primarily held McKesson Corporation common shares before the merger. The court has not ruled on this motion, or on Lead Plaintiff’s Motion for Class Certification, which was heard on March 12, 2004. We do not believe it is feasible to predict or determine the outcome or resolution of the Accounting Litigation, or to estimate the amounts of, or potential range of, loss with respect to those proceedings. In addition, the timing of 12
  • 13. McKESSON CORPORATION FINANCIAL NOTES (Continued) (Unaudited) the final resolution of these proceedings is uncertain. The range of possible resolutions of these proceedings could include judgments against the Company or settlements that could require substantial payments by the Company, which could have a material adverse impact on the Company’s financial position, results of operations and cash flows. II. Other Litigation As previously reported, a judgment has been entered against the Company in an action brought in the California Superior Court by a former employee for wrongful termination, disability discrimination and harassment, Charlene Roby vs. McKesson HBOC, Inc. et al. (Action No. CV01-573), consisting of compensatory and punitive damages awards of $3.5 million and $15.0 million, respectively. After post-trial motions, the trial court reduced the compensatory damages portion of the judgment to $2.8 million but left the punitive damages award unchanged. The Company will seek reversal, or alternatively reduction, of all elements of this judgment through an appeal. If this appeal is not successful, this judgment could have an adverse impact on our consolidated financial statements. III. Contingency As discussed in our annual report on Form 10-K for the year ended March 31, 2004, in 2002, we entered into a $500 million, ten year contract with the National Health Services Information Authority (“NHS”), an organization of the British government charged with the responsibility of delivering healthcare in England and Wales. The contract engages the Company to develop, implement and operate a human resources and payroll system at more than 600 NHS locations. To date, there have been delays to this contract which have caused increased costs and a decrease in the amount of time in which we can earn revenues. These delays have adversely impacted the contract's projected profitability and no material revenue has yet been recognized on this contract. As of June 30, 2004, our consolidated balance sheet includes an investment of approximately $78 million in net assets, consisting of prepaid expenses, software and capital assets, net of cash received, related to this contract. While we believe it is likely that we can deliver and operate an acceptable system and recover our investment in this contract, we are currently negotiating with the NHS to amend certain key terms and conditions in the contract, and there is no certainty we will agree on an updated implementation plan. We expect this negotiation to be completed in the second half of calendar year 2004. However, the timing and the outcome of these negotiations is uncertain and failure to reach agreement on an updated implementation plan and amend certain key contract terms and conditions, and/or further delays in the implementation may result in losses that could be material. Even if we agree on amended contract terms and conditions and an updated implementation plan, it is possible that the terms of that agreement may result in the impairment of our net assets related to the contract as well as substantial penalties and charges, which could have a material adverse impact on our consolidated financial statements. 12. Segment Information In April 2004, we reconfigured our operating segments to better align product development and selling efforts with the evolving needs of the healthcare market. As a result, commencing in the first quarter of 2005, we are reporting the following three operating segments: Pharmaceutical Solutions, Medical-Surgical Solutions and Provider Technologies. Prior period amounts have been reclassified to conform to the 2005 segment presentation. We evaluate the performance of our operating segments based on operating profit before interest expense, income taxes and results from discontinued operations. Our Corporate segment includes expenses associated with Corporate functions and projects and certain employee benefits. Corporate expenses are allocated to the operating segments to the extent that these items can be directly attributable to the segment. The Pharmaceutical Solutions segment distributes ethical and proprietary drugs and health and beauty care products throughout North America. This segment also manufactures and sells automated pharmaceutical dispensing systems for retail pharmacies, medical management and pharmaceutical solutions for biotech and pharmaceutical manufacturers, patient and payor services, and consulting and outsourcing services to pharmacies. We have added the Clinical Auditing and Compliance business, which was previously included in our former Information Solutions segment, to this segment’s expanded payor services business. This business sells software to payors for auditing professional claims. 13
  • 14. McKESSON CORPORATION FINANCIAL NOTES (Concluded) (Unaudited) The Medical-Surgical Solutions segment distributes medical-surgical supplies and equipment and provides logistics and related services within the United States. This segment now includes Zee Medical, which was formerly included in our Pharmaceutical Solutions segment. Zee Medical provides first aid and safety products and training services to corporate customers. The operating results of this segment for the quarter ended June 30, 2004 also reflect the impact of the acquisition of MMC. The Provider Technologies segment consists of the former Information Solutions segment plus the McKesson Inpatient Automation business, which was previously included in our Pharmaceutical Solutions segment, and the Corporate Solutions group, which was previously managed by our Corporate group. This segment continues to deliver enterprise-wide patient care, clinical, financial, supply chain, managed care and strategic management software solutions as well as outsourcing and other services to healthcare organizations throughout North America, the United Kingdom and Europe. McKesson Inpatient Automation provides automation and robotics for the hospital market, and the Corporate Solutions group continues to be responsible for the sales coordination of complex provider engagements that include strategic product and service solutions from multiple business units. Expenses incurred by Corporate Solutions on behalf of other business segments are allocated to the applicable business segments. Financial information relating to our segments is as follows: Quarter Ended June 30, 2004 2003 (In millions) Revenues Pharmaceutical Solutions $ 18,179.7 $ 15,543.4 Medical-Surgical Solutions 707.2 710.1 Provider Technologies 299.7 270.7 Total $ 19,186.6 $ 16,524.2 Operating profit Pharmaceutical Solutions $ 290.5 $ 265.0 Medical-Surgical Solutions 28.6 25.8 Provider Technologies 14.3 4.7 Total 333.4 295.5 Corporate (57.7) (32.0) Interest expense (29.6) (29.8) Income before income taxes $ 246.1 $ 233.7 June 30, March 31, 2004 2004 (In millions) Segment assets, at period end Pharmaceutical Solutions $ 12,802.6 $ 12,050.5 Medical-Surgical Solutions 1,600.3 1,539.2 Provider Technologies 1,381.4 1,402.7 Total 15,784.3 14,992.4 Corporate Cash, cash equivalents, and marketable securities 846.8 717.8 Other 512.3 530.0 Total $ 17,143.4 $ 16,240.2 During the first quarter of 2005, we received $41.2 million as our share of a settlement of an antitrust class action lawsuit involving a drug manufacturer. This settlement was recorded as a credit in cost of sales within our Pharmaceutical Solutions segment in our condensed consolidated statements of operations. Corporate expenses for 2005 include pension settlement charges as discussed in Financial Note 8. Corporate expenses for 2004 include an $8.5 million gain on the sale of a surplus property. 14
  • 15. McKESSON CORPORATION FINANCIAL REVIEW (Unaudited) Item 2. Management’s Discussion and Analysis of Results of Operations and Financial Condition Financial Overview Quarter Ended June 30, 2004 2003 Change (In millions, except per share data) Revenues $ 19,186.6 $ 16,524.2 16% Income Before Income Taxes 246.1 233.7 5 Net Income 163.6 155.6 5 Diluted Earnings Per Share $ 0.55 $ 0.53 4 Revenues for the first quarter of 2005 grew by 16% to $19.2 billion from $16.5 billion for the first quarter of 2004. Net income increased 5% to $163.6 million in the first quarter of 2005 compared to the same period a year ago and diluted earnings per share increased 4% to $0.55. Increases in net income and diluted earnings per share primarily reflect revenue and operating profit growth in our Pharmaceutical Solutions and Provider Technologies segments, offset in part by additional Corporate expenses. Results of Operations Revenues: Quarter Ended June 30, 2004 2003 Change (In millions) Pharmaceutical Solutions U.S. Healthcare direct distribution & services $ 11,011.3 $ 9,335.0 18% U.S. Healthcare sales to customers’ warehouses 5,916.2 5,164.4 15 Subtotal 16,927.5 14,499.4 17 Canada distribution & services 1,252.2 1,044.0 20 Total Pharmaceutical Solutions 18,179.7 15,543.4 17 Medical-Surgical Solutions 707.2 710.1 - Provider Technologies Software & software systems 50.6 45.6 11 Services 222.2 204.3 9 Hardware 26.9 20.8 29 Total Provider Technologies 299.7 270.7 11 Total Revenues $ 19,186.6 $ 16,524.2 16 Revenues for the first quarter of 2005 grew by 16% to $19.2 billion compared to the first quarter of 2004. The growth in revenue was primarily due to our Pharmaceutical Solutions segment, which accounted for over 94% of our consolidated revenues. Increases in U.S. Healthcare pharmaceutical direct distribution and services revenues for the first quarter of 2005 primarily reflect market growth rates as well as new institutional customers in our pharmaceutical distribution business. Market growth rates reflect growing drug utilization and price increases, which are offset in part by the increased use of lower priced generics. In May 2004, we began implementation on a new pharmaceutical distribution contract with the Department of Veterans Affairs, which contributed to the segment’s total increase in revenues. Annual revenues on this contract are expected to exceed $3.5 billion. U.S. Healthcare sales to customers’ warehouses also increased in the first quarter of 2005 primarily as a result of several expanded agreements with existing customers and growth from existing customers. Canadian pharmaceutical revenues increased in the first quarter of 2005 reflecting market growth rates, new business from manufacturers who formerly engaged in direct distribution activities and to a lesser extent, favorable foreign exchange rates. On a constant currency basis, revenues from our Canadian operations would have increased approximately 17% compared to the same period a year ago. 15
  • 16. McKESSON CORPORATION FINANCIAL REVIEW (Continued) (Unaudited) Medical-Surgical Solutions segment distribution revenues were flat in the first quarter of 2005. Increases in our primary care sector, including revenues derived from our recent acquisition of Moore Medical Corporation (“MMC”), were fully offset by a decline in revenues in the acute care sector due to the transition of the loss of the segment’s largest customer. On April 1, 2004, we acquired all of the issued and outstanding shares of MMC, of New Britain, Connecticut, for an aggregate cash purchase price of approximately $37 million. MMC is an Internet- enabled, multi-channel marketer and distributor of medical-surgical and pharmaceutical products to non-hospital provider settings. Provider Technologies segment revenues increased in the first quarter of 2005 primarily from increased demand for our clinical application offerings and to a lesser extent, from our Automation products. Gross Profit: Quarter Ended June 30, 2004 2003 Change (In millions) Gross Profit Pharmaceutical Solutions $ 560.4 $ 518.2 8% Medical-Surgical Solutions 158.7 146.0 9 Provider Technologies 132.9 122.3 9 Total $ 852.0 $ 786.5 8 Gross Profit Margin Pharmaceutical Solutions 3.08% 3.33% (25) bp Medical-Surgical Solutions 22.44 20.56 188 Provider Technologies 44.34 45.18 (84) Total 4.44 4.76 (32) Gross profit increased 8% to $852.0 million in the first quarter of 2005. As a percentage of revenues, gross profit margins declined 32 basis points in 2005. Declines in our gross profit margins primarily reflect a higher proportion of our revenue being attributable to our Pharmaceutical Solutions segment, which has lower margins relative to our other segments and which had a decline in margins compared to the same period a year ago. Gross profit margins increased in our Medical-Surgical Solutions segment and decreased in our Provider Technologies segment primarily due to product mix. During the first quarter of 2005, gross margin for our Pharmaceutical Solutions segment was impacted by: • lower selling margins within our U.S. Pharmaceutical distribution business which reflect competitive pricing pressure. We have also been experiencing pressure on our buy side margin over the past few quarters as the industry is evolving, including the ways in which distributors are being compensated by manufacturers. Certain types of vendor product incentives and sources of supply, such as certain inventory purchases in the secondary market, are not available at historical levels to the major distributors which have the impact of reducing gross margins. Much of this change results from the manufacturers’ desire to limit the amount of inventory in the channel. We have been actively working with manufacturers through restructured distribution agreements to ensure that we are appropriately compensated for the services we provide, • a higher proportion of revenues attributed to institutional customers, which have lower gross profit margins, • partially offsetting the above decreases, the benefit of increased sales of generic drugs with higher margins, • a higher proportion of supplier cash discounts to revenues reflecting a change in customer mix, and • a reduction in cost of sales due to a receipt of $41.2 million cash proceeds representing our share of a settlement of an antitrust class action lawsuit brought against a drug manufacturer. 16
  • 17. McKESSON CORPORATION FINANCIAL REVIEW (Continued) (Unaudited) Operating Expenses and Other Income: Quarter Ended June 30, 2004 2003 Change (In millions) Operating Expenses Pharmaceutical Solutions $ 275.4 $ 259.1 6% Medical-Surgical Solutions 131.1 121.4 8 Provider Technologies 119.8 119.7 - Corporate 64.9 34.7 87 Total $ 591.2 $ 534.9 11 Operating Expenses as a Percentage of Revenues Pharmaceutical Solutions 1.51% 1.67% (16) bp Medical-Surgical Solutions 18.54 17.10 144 Provider Technologies 39.97 44.22 (425) Total 3.08 3.24 (16) Other Income Pharmaceutical Solutions $ 5.5 $ 5.9 (7)% Medical-Surgical Solutions 1.0 1.2 (17) Provider Technologies 1.2 2.1 (43) Corporate 7.2 2.7 167 Total $ 14.9 $ 11.9 25 Operating expenses increased 11% to $591.2 million in the first quarter of 2005. As a percentage of revenues, operating expenses decreased 16 basis points in 2005. Increases in operating expense dollars were primarily due to additional costs to support our sales volume growth, approximately $12 million of settlement charges pertaining to a non-qualified pension plan and additional legal costs associated with our pending securities litigation. In addition, operating expenses for the first quarter of 2004 benefited from an $8.5 million gain on the sale of a surplus property. As a percentage of revenues, operating expenses decreased primarily due to the leveraging of our fixed cost infrastructure and productivity improvements in back-office and field operations within our Pharmaceutical Solutions segment. Other income increased in the first quarter of 2005 primarily due to higher interest income. Segment Operating Profit and Corporate Expenses: Quarter Ended June 30, 2004 2003 Change (In millions) Segment Operating Profit (1) Pharmaceutical Solutions $ 290.5 $ 265.0 10% Medical-Surgical Solutions 28.6 25.8 11 Provider Technologies 14.3 4.7 204 Total 333.4 295.5 13 Corporate Expenses (57.7) (32.0) 80 Interest Expense (29.6) (29.8) (1) Income Before Income Taxes $ 246.1 $ 233.7 5 Segment Operating Profit Margin Pharmaceutical Solutions 1.60% 1.70% (10) bp Medical-Surgical Solutions 4.04 3.63 41 Provider Technologies 4.77 1.74 303 (1) Segment operating profit includes gross margin, net of operating expenses plus other income for our three business segments. Operating profit as a percentage of revenues decreased in our Pharmaceutical Solutions segment in the first quarter of 2005 primarily reflecting a decline in gross margins, offset in part by favorable leveraging of the segment’s fixed cost infrastructure and productivity improvements in back-office and field operations. Medical-Surgical Solutions segment’s operating profit as a percentage of revenues increased in the first quarter of 2005 primarily reflecting improvements in gross profit margin which was offset in part by an increase in 17
  • 18. McKESSON CORPORATION FINANCIAL REVIEW (Continued) (Unaudited) operating expenses. Operating expenses increased in both dollars as well as a percentage of revenues primarily due to the acquisition of MMC as well as from additional costs incurred to serve the segment’s alternate site customers. During the second quarter of 2005, the segment anticipates completing an evaluation of its distribution center network as a result of its MMC acquisition. In accordance with accounting standards, certain costs that will be incurred to consolidate operations with acquired businesses will be treated as part of the cost of the acquisition whereas other related costs will be expensed. Provider Technologies segment’s operating profit as a percentage of revenues increased in the first quarter of 2005 primarily reflecting a decrease in gross profit margin which was more than offset by a lower ratio of operating expenses as a percentage of sales. Despite an increase in revenues, operating expense dollars for the quarter were flat compared to the same period a year ago primarily reflecting the segment’s control of expenses. In addition, operating expenses for the first quarter of 2004 included incremental product development expenses. Corporate expenses increased in the first quarter of 2005 primarily reflecting settlement charges of approximately $12 million pertaining to a non-qualified pension plan and additional legal costs associated with our pending securities litigation. These expenses were partially offset by higher interest income. During the first quarter of 2005, we made several lump sum cash payments totaling approximately $42 million from an unfunded U.S. pension plan. In accordance with accounting standards, additional charges for settlements associated with lump sum payments of pension obligations are expensed in the period in which the payments are made. Accordingly, expenses for the quarter include charges associated with these payments. In addition, expenses for the comparable prior year period benefited from an $8.5 million gain pertaining to the sale of a surplus property. Interest Expense: Interest expense approximated that of the prior comparable period as the benefit of lower average borrowings were almost fully offset by increases in our effective interest rate. Income Taxes: The Company’s effective income tax rate was 33.5% and 33.4% for the quarters ended June 30, 2004 and 2003. During the first quarter of 2005, we sold a business for a pre-tax loss of $1.1 million and an after- tax loss of $4.6 million. Partially offsetting the tax impact of this disposition, we recorded a net benefit relating to favorable tax settlements and adjustments. Weighted Average Diluted Shares Outstanding: Diluted earnings per share was calculated based on an average number of shares outstanding of 300.1 million and 298.1 million for the quarters ended June 30, 2004 and 2003. Financial Condition, Liquidity, and Capital Resources Operating activities provided cash flow of $128.3 million and $40.8 million during the first quarters of 2005 and 2004. Net cash flow for 2005 includes an incremental non-cash add back of $68.2 million in deferred income taxes partially offset by an increase in net taxes paid of $53.9 million. Net uses of cash for working capital approximated that of the first quarter of last year as additional working capital required to support our revenue growth and an increase in investment inventory were offset by favorable working capital management. Additionally, our new customer, the Department of Veterans Affairs, has prompt payment terms. Operating activities for 2005 also includes approximately $42 million of lump sum pension settlement payments. Investing activities utilized cash of $96.8 million and $63.4 million during the first quarters of 2005 and 2004. The increased usage in 2005 primarily reflects a payment of approximately $37 million for the acquisition of MMC as well as greater issuances of notes receivable. During the first quarter of 2005, we converted a $40.0 million credit facility guarantee in favor of a customer (that recently emerged from bankruptcy) to a note receivable due from this customer. These increases in cash usage were partially offset by the receipt of $21.0 million from the sale of notes receivable and a decrease in expenditures for capitalized software. Financing activities provided cash of $97.2 million and used cash of $54.2 million in the first quarters of 2005 and 2004. Financing activities for 2005 include $23.4 million of short-term borrowings and an incremental $48.3 million from common stock issuances primarily resulting from an increase in employees’ exercises of stock options. 2004 financing activities included the use of $75.3 million for stock repurchases. 18
  • 19. McKESSON CORPORATION FINANCIAL REVIEW (Continued) (Unaudited) Selected Measures of Liquidity and Capital Resources June 30, March 31, 2004 2004 (Dollars in millions) Cash, cash equivalents and marketable securities $ 846.8 $ 717.8 Working capital 3,803.9 3,587.9 Debt net of cash, cash equivalents and marketable securities 644.8 766.8 Debt to capital ratio (1) 21.6% 22.3% Net debt to net capital employed (2) 10.6 12.9 Return on stockholders’ equity (3) 13.1 13.4 (1) Ratio is computed as total debt divided by total debt and stockholders’ equity. (2) Ratio is computed as total debt, net of cash, cash equivalents and marketable securities (“net debt”), divided by net debt and stockholders’ equity (“net capital employed”). (3) Ratio is computed as net income, divided by a five-quarter average of stockholders’ equity. Working capital primarily includes receivables and inventories, net of drafts and accounts payable and deferred revenue. Our Pharmaceutical Solutions segment requires a substantial investment in working capital that is susceptible to large variations during the year as a result of inventory purchase patterns and seasonal demands. Inventory purchase activity is a function of sales activity, new customer build-up requirements and the desired level of investment inventory. Consolidated working capital has increased primarily as a result of our higher sales volume, as well as an increase in cash and cash equivalents. We reduced our ratio of net debt to net capital employed as growth in our operating income was in excess of the growth in working capital and other investments needed to fund increases in revenue. Credit Resources We fund our working capital requirements primarily with cash, short-term borrowings and our receivables sale facility. We have a $650.0 million 364-day revolving credit agreement that expires in September 2004 and a $550.0 million three-year revolving credit facility that expires in September 2005. These facilities are primarily intended to support our commercial paper borrowings. We also have a $1.4 billion accounts receivable sales facility, which was renewed in June 2004, the terms of which are substantially similar to those previously in place with the exception that the facility was increased by $300.0 million. No amounts were utilized under any of these facilities at June 30, 2004. Our various borrowing facilities and long-term debt are subject to certain covenants. Our principal debt covenant is our debt to capital ratio, which cannot exceed 56.5%. If we exceed this ratio, repayment of debt outstanding under the revolving credit facility and $335.0 million of term debt could be accelerated. At June 30, 2004, this ratio was 21.6% and we were in compliance with our other financial covenants. A reduction in our credit ratings or the lack of compliance with our covenants could negatively impact our ability to finance operations through our credit facilities, or issue additional debt at the interest rates then currently available. Funds necessary for future debt maturities and our other cash requirements are expected to be met by existing cash balances, cash flows from operations, existing credit sources and other capital market transactions. New Accounting Pronouncements There are a number of new accounting pronouncements that may impact our financial results. These new accounting pronouncements are described in Financial Note 1, “Significant Accounting Policies,” to the accompanying condensed consolidated financial statements. FACTORS AFFECTING FORWARD-LOOKING STATEMENTS In addition to historical information, management’s discussion and analysis includes certain forward-looking statements within the meaning of section 27A of the Securities Act of 1933, as amended and section 21E of the Securities Exchange Act of 1934, as amended. Some of the forward-looking statements can be identified by use of forward-looking words such as “believes,” “expects,” “anticipates,” “may,” “will,” “should,” “seeks,” “approximates,” “intends,” “plans,” or “estimates,” or the negative of these words, or other comparable terminology. 19
  • 20. McKESSON CORPORATION FINANCIAL REVIEW (Concluded) (Unaudited) The discussion of financial trends, strategy, plans or intentions may also include forward-looking statements. Forward-looking statements involve risks and uncertainties that could cause actual results to differ materially from those projected. Although it is not possible to predict or identify all such risks and uncertainties, they may include, but are not limited to, the following factors. The readers should not consider this list to be a complete statement of all potential risks and uncertainties. • the resolution or outcome of pending shareholder litigation regarding the 1999 restatement of our historical financial statements; • the changing U.S. healthcare environment, including the impact of current and potential future mandated benefits, changes in private and governmental reimbursement or in the delivery systems for healthcare products and services and governmental efforts to regulate the pharmaceutical supply chain; • consolidation of competitors, suppliers and customers and the development of large, sophisticated purchasing groups; • the ability to successfully market both new and existing products domestically and internationally; • changes in manufacturers’ pricing, selling, inventory, distribution or supply policies or practices; • substantial defaults in payment by large customers; • material reduction in purchases or the loss of a large customer or supplier relationship; • challenges in integrating or implementing our software or software-related system products, or the slowing or deferral of demand for these products; • the use of estimates used in accounting for contracts; • the malfunction or failure of our segments’ information systems; • our ability to successfully identify, consummate and integrate strategic acquisitions; • changes in generally accepted accounting principles; • tax legislation initiatives; • foreign currency fluctuations; and • general economic and market conditions. These and other risks and uncertainties are described herein or in our Forms 10-K, 10-Q, 8-K and other public documents filed with the Securities and Exchange Commission. Readers are cautioned not to place undue reliance on these forward-looking statements, which speak only as of the date hereof. We undertake no obligation to publicly release the result of any revisions to these forward-looking statements to reflect events or circumstances after this date or to reflect the occurrence of unanticipated events. Item 3. Quantitative and Qualitative Disclosures about Market Risk We believe there has been no material change in our exposure to risks associated with fluctuations in interest and foreign currency exchange rates discussed in our 2004 Annual Report on Form 10-K. Item 4. Controls and Procedures Our Chief Executive Officer and our Chief Financial Officer, after evaluating the effectiveness of the Company’s “disclosure controls and procedures” (as defined in the Exchange Act Rules 13a-15(e)) as of the end of the period covered by this quarterly report, have concluded that our disclosure controls and procedures are effective based on their evaluation of these controls and procedures required by paragraph (b) of Exchange Act Rules 13a-15 or 15d-15. There were no changes in our internal control over financial reporting identified in connection with the evaluation required by paragraph (d) of Exchange Act Rules 13a-15 or 15d-15 that occurred during our last fiscal quarter that have materially affected, or are reasonably likely to materially affect, our internal controls over financial reporting. 20
  • 21. McKESSON CORPORATION PART II. OTHER INFORMATION Item 1. Legal Proceedings See Financial Note 11, “Other Commitments and Contingent Liabilities,” of our unaudited condensed consolidated financial statements contained in Part I of this Quarterly Report on Form 10-Q. Item 2. Changes in Securities, Use of Proceeds and Issuer Purchases of Equity Securities The Company made no share repurchases during the first quarter of 2005. The dollar value of shares that may yet be purchased under our share repurchase program is approximately $209 million. Item 6. Exhibits and Reports on Form 8-K (a) Exhibits Exhibit 31.1 Certification Pursuant to 18 U.S.C. Section 1350, as Adopted Pursuant to Section 302 of the Sarbanes-Oxley Act of 2002. Exhibit 31.2 Certification Pursuant to 18 U.S.C. Section 1350, as Adopted Pursuant to Section 302 of the Sarbanes-Oxley Act of 2002. Exhibit 32 Certification Pursuant to 18 U.S.C. Section 1350, as Adopted Pursuant to Section 906 of the Sarbanes-Oxley Act of 2002. (b) Reports on Form 8-K The following report on Form 8-K was filed during the three months ended June 30, 2004: Form 8-K date of report April 29, 2004 relating to a press release announcing the Company’s preliminary financial results for its fourth quarter and fiscal year ended March 31, 2004. Form 8-K date of report April 30, 2004 relating to recast condensed consolidated operating information by business segment for fiscal 2003 and fiscal 2004 Form 8-K date of report May 4, 2004 relating to an employment litigation verdict against the Company. The following report on Form 8-K was filed during the period between July 1, 2004 and the date of this filing: Form 8-K date of report July 22, 2004 relating to a press release announcing the Company’s preliminary financial results for its first quarter of fiscal year 2005. SIGNATURES Pursuant to the requirements of the Securities Exchange Act of 1934, the Registrant has duly caused this report to be signed on its behalf by the undersigned, thereunto duly authorized. McKesson Corporation Dated: July 29, 2004 By /s/ Jeffrey C. Campbell Jeffrey C. Campbell Executive Vice President and Chief Financial Officer By /s/ Nigel A. Rees Nigel A. Rees Vice President and Controller 21
  • 22. Exhibit 31.1 CERTIFICATION PURSUANT TO RULE 13a-14(a) AND RULE 15d-14(a) OF THE SECURITIES EXCHANGE ACT, AS AMENDED I, John H. Hammergren, certify that: 1. I have reviewed this quarterly report on Form 10-Q of McKesson Corporation; 2. Based on my knowledge, this report does not contain any untrue statement of a material fact or omit to state a material fact necessary in order to make the statements made, in light of the circumstances under which such statements were made, not misleading with respect to the period covered by this report; 3. Based on my knowledge, the financial statements, and other financial information included in this report, fairly present in all material respects the financial condition, results of operations and cash flows of the registrant as of, and for, the periods presented in this report; 4. The registrant’s other certifying officer and I are responsible for establishing and maintaining disclosure controls and procedures (as defined in Exchange Act Rules 13a-15(e) and 15d-15(e)) for the registrant and have: a) Designed such disclosure controls and procedures, or caused such disclosure controls and procedures to be designed under our supervision, to ensure that material information relating to the registrant, including its consolidated subsidiaries, is made known to us by others within those entities, particularly during the period in which this annual report is being prepared; b) Evaluated the effectiveness of the registrant’s disclosure controls and procedures and presented in this report our conclusions about the effectiveness of the disclosure controls and procedures, as of the end of the period covered by this report based on such evaluation; and c) Disclosed in this report any change in the registrant’s internal control over financial reporting that occurred during the registrant’s fourth fiscal quarter that has materially affected, or is reasonably likely to materially affect, the registrant’s internal control over financial reporting; and 5. The registrant’s other certifying officer and I have disclosed, based on our most recent evaluation of internal control over financial reporting, to the registrant’s auditors and the audit committee of registrant’s board of directors (or persons performing the equivalent functions): a) All significant deficiencies and material weaknesses in the design or operation of internal controls over financial reporting which are reasonably likely to adversely affect the registrant’s ability to record, process, summarize and report financial information; and b) Any fraud, whether or not material, that involves management or other employees who have a significant role in the registrant’s internal controls over financial reporting. Date: July 29, 2004 /s/ John H. Hammergren John H. Hammergren Chairman, President and Chief Executive Officer
  • 23. Exhibit 31.2 CERTIFICATION PURSUANT TO RULE 13a-14(a) AND RULE 15d-14(a) OF THE SECURITIES EXCHANGE ACT, AS AMENDED I, Jeffrey C. Campbell, certify that: 1. I have reviewed this quarterly report on Form 10-Q of McKesson Corporation; 2. Based on my knowledge, this report does not contain any untrue statement of a material fact or omit to state a material fact necessary in order to make the statements made, in light of the circumstances under which such statements were made, not misleading with respect to the period covered by this report; 3. Based on my knowledge, the financial statements, and other financial information included in this report, fairly present in all material respects the financial condition, results of operations and cash flows of the registrant as of, and for, the periods presented in this report; 4. The registrant’s other certifying officer and I are responsible for establishing and maintaining disclosure controls and procedures (as defined in Exchange Act Rules 13a-15(e) and 15d-15(e)) for the registrant and have: a) Designed such disclosure controls and procedures, or caused such disclosure controls and procedures to be designed under our supervision, to ensure that material information relating to the registrant, including its consolidated subsidiaries, is made known to us by others within those entities, particularly during the period in which this annual report is being prepared; b) Evaluated the effectiveness of the registrant’s disclosure controls and procedures and presented in this report our conclusions about the effectiveness of the disclosure controls and procedures, as of the end of the period covered by this report based on such evaluation; and c) Disclosed in this report any change in the registrant’s internal control over financial reporting that occurred during the registrant’s fourth fiscal quarter that has materially affected, or is reasonably likely to materially affect, the registrant’s internal control over financial reporting; and 5. The registrant’s other certifying officer and I have disclosed, based on our most recent evaluation of internal control over financial reporting, to the registrant’s auditors and the audit committee of registrant’s board of directors (or persons performing the equivalent functions): a) All significant deficiencies and material weaknesses in the design or operation of internal controls over financial reporting which are reasonably likely to adversely affect the registrant’s ability to record, process, summarize and report financial information; and b) Any fraud, whether or not material, that involves management or other employees who have a significant role in the registrant’s internal controls over financial reporting. Date: July 29, 2004 /s/ Jeffrey C. Campbell Jeffrey C. Campbell Executive Vice President and Chief Financial Officer
  • 24. Exhibit 32 CERTIFICATION PURSUANT TO 18 U.S.C SECTION 1350, AS ADOPTED PURSUANT TO SECTION 906 OF THE SARBANES-OXLEY ACT OF 2002 In connection with the quarterly report of McKesson Corporation (the “Company”) on Form 10-Q for the quarter ended June 30, 2004 as filed with the Securities and Exchange Commission on the date hereof (the “Report”), the undersigned, in the capacities and on the dates indicated below, each hereby certify, pursuant to 18 U.S.C. § 1350, as adopted pursuant to § 906 of the Sarbanes-Oxley Act of 2002, that to the best of their knowledge: (1) The Report fully complies with the requirements of section 13(a) or 15(d) of the Securities Exchange Act of 1934; and (2) The information contained in the Report fairly presents, in all material respects, the financial condition and results of operations of the Company. /s/ John H. Hammergren John H. Hammergren Chairman, President and Chief Executive Officer July 29, 2004 /s/ Jeffrey C. Campbell Jeffrey C. Campbell Executive Vice President and Chief Financial Officer July 29, 2004 This certification accompanies the Report pursuant to § 906 of the Sarbanes-Oxley Act of 2002, and shall not, except to the extent required by the Sarbanes-Oxley Act of 2002, be deemed filed by the Company for the purposes of Section 18 of the Securities Exchange Act of 1934, as amended. A signed original of this written statement required by Section 906 has been provided to McKesson Corporation and will be retained by the Company and furnished to the Securities and Exchange Commission or its staff upon request.