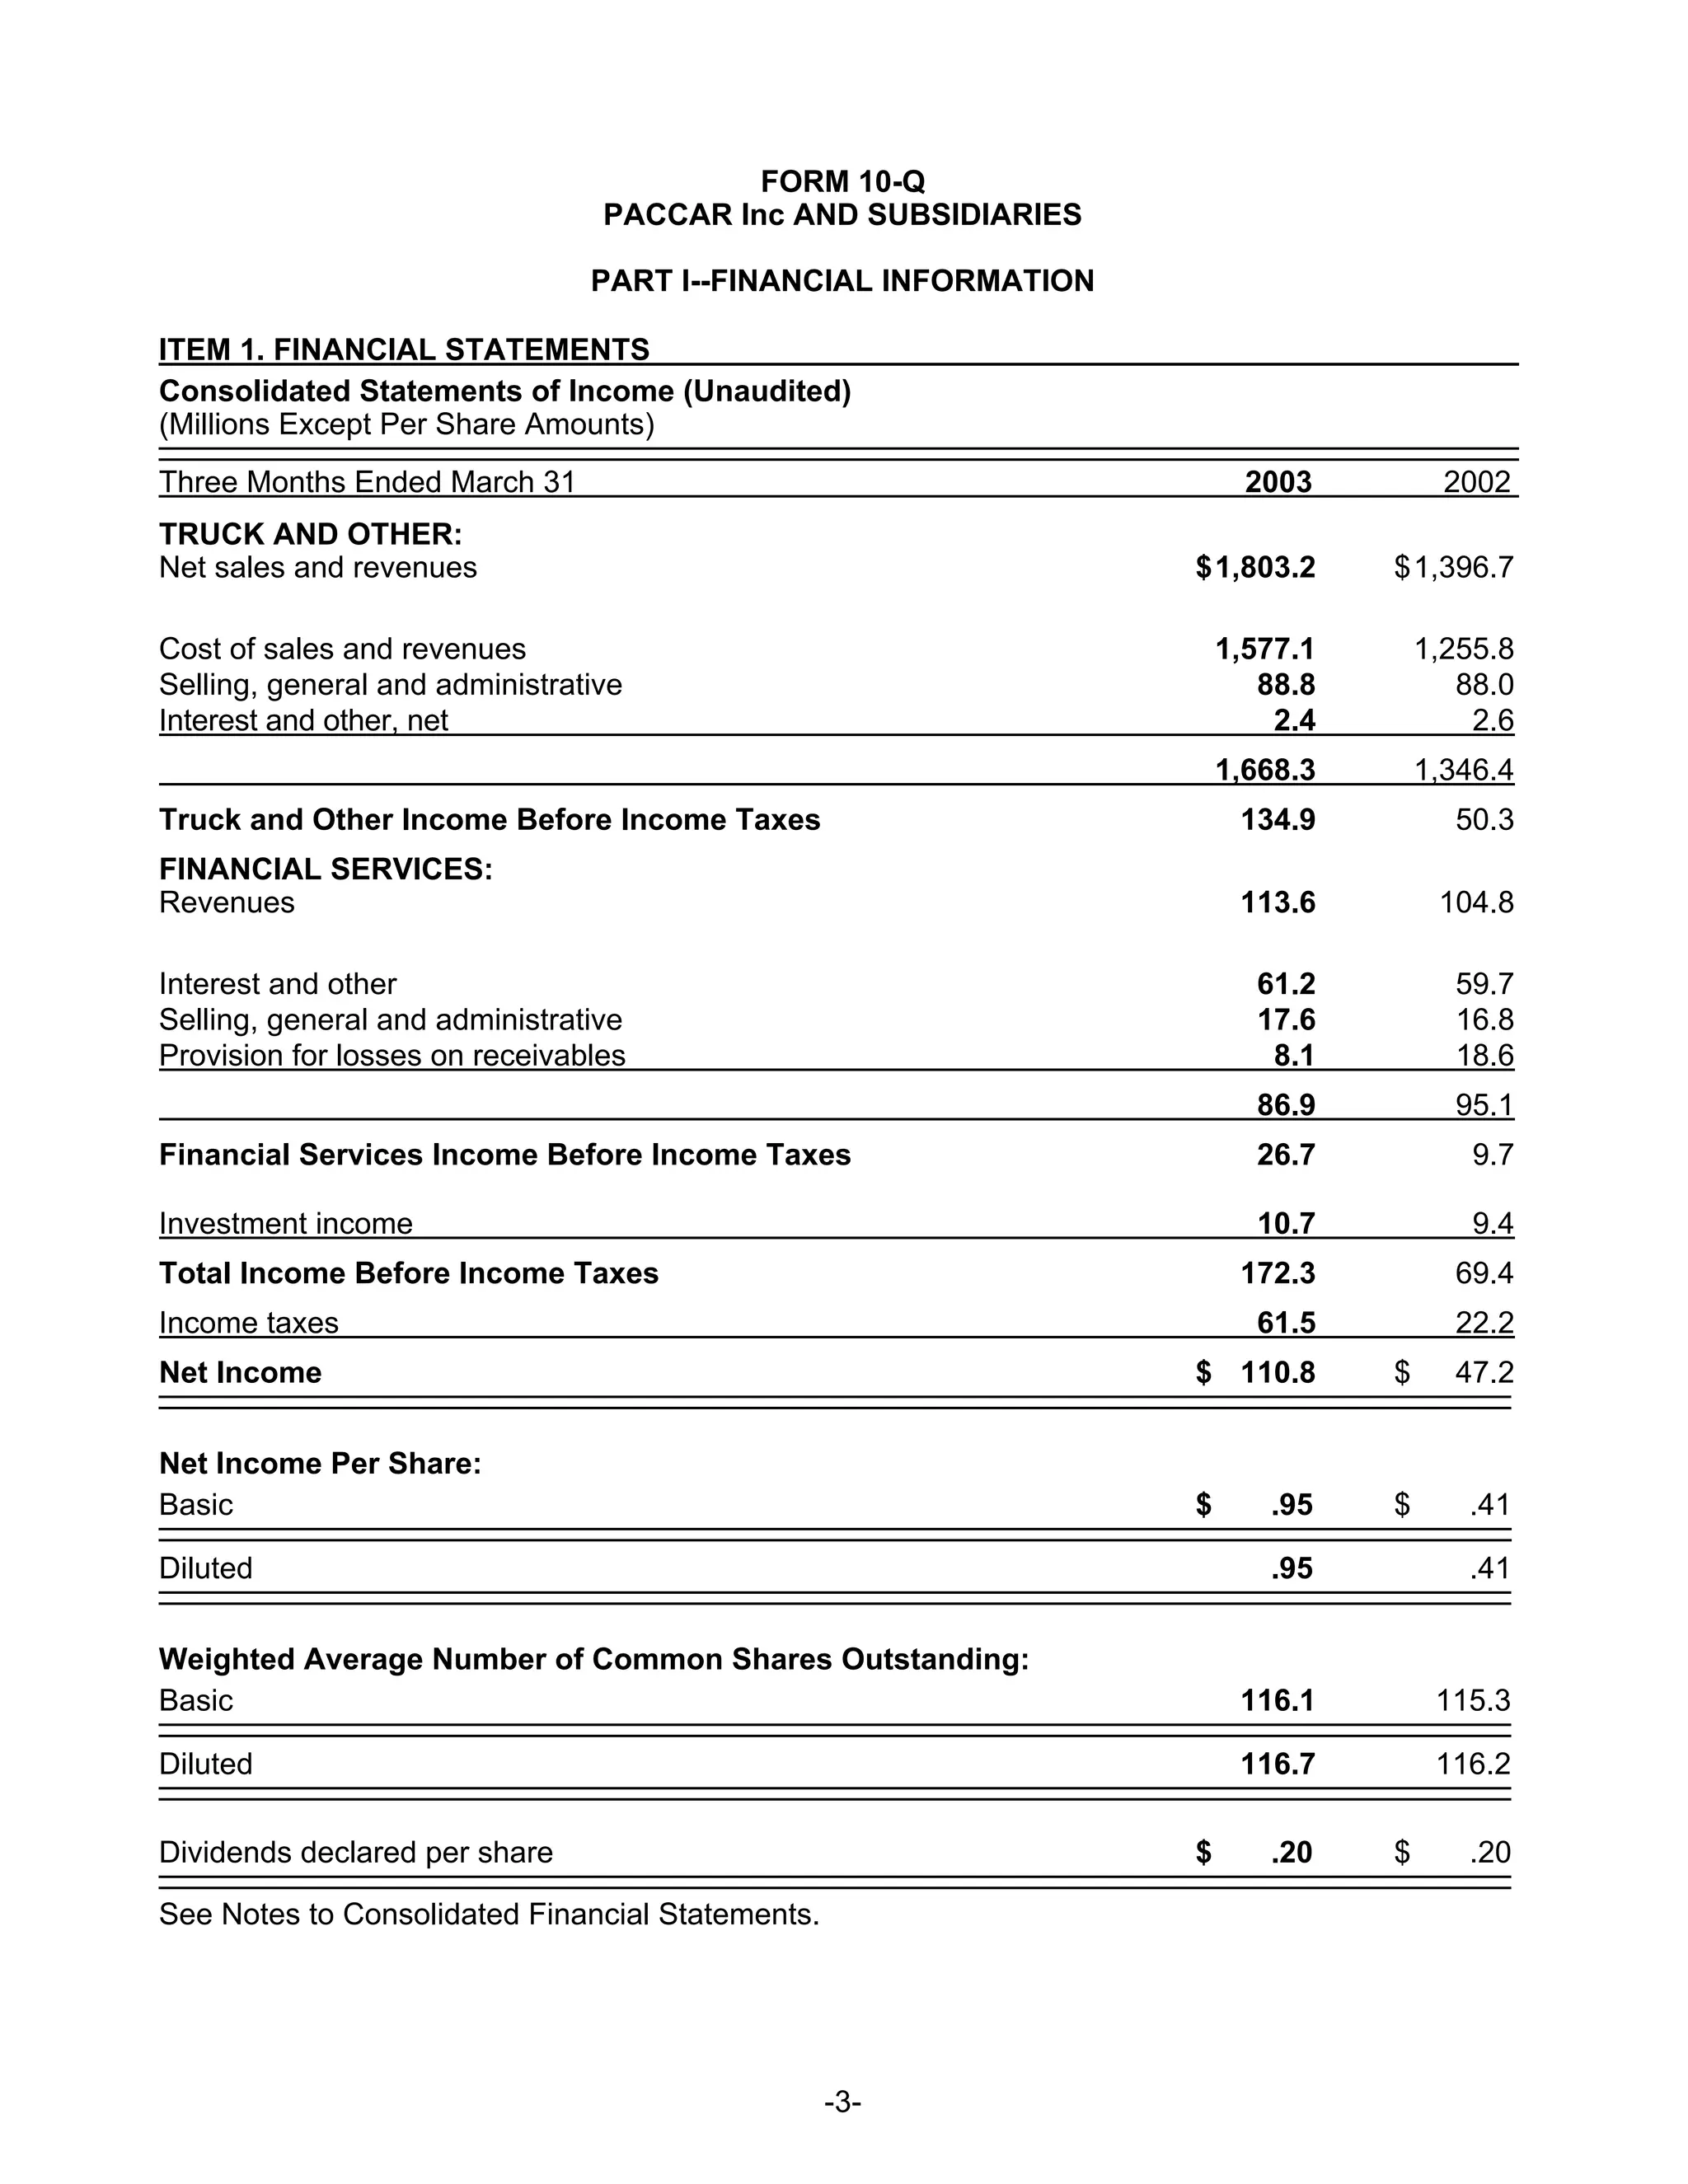
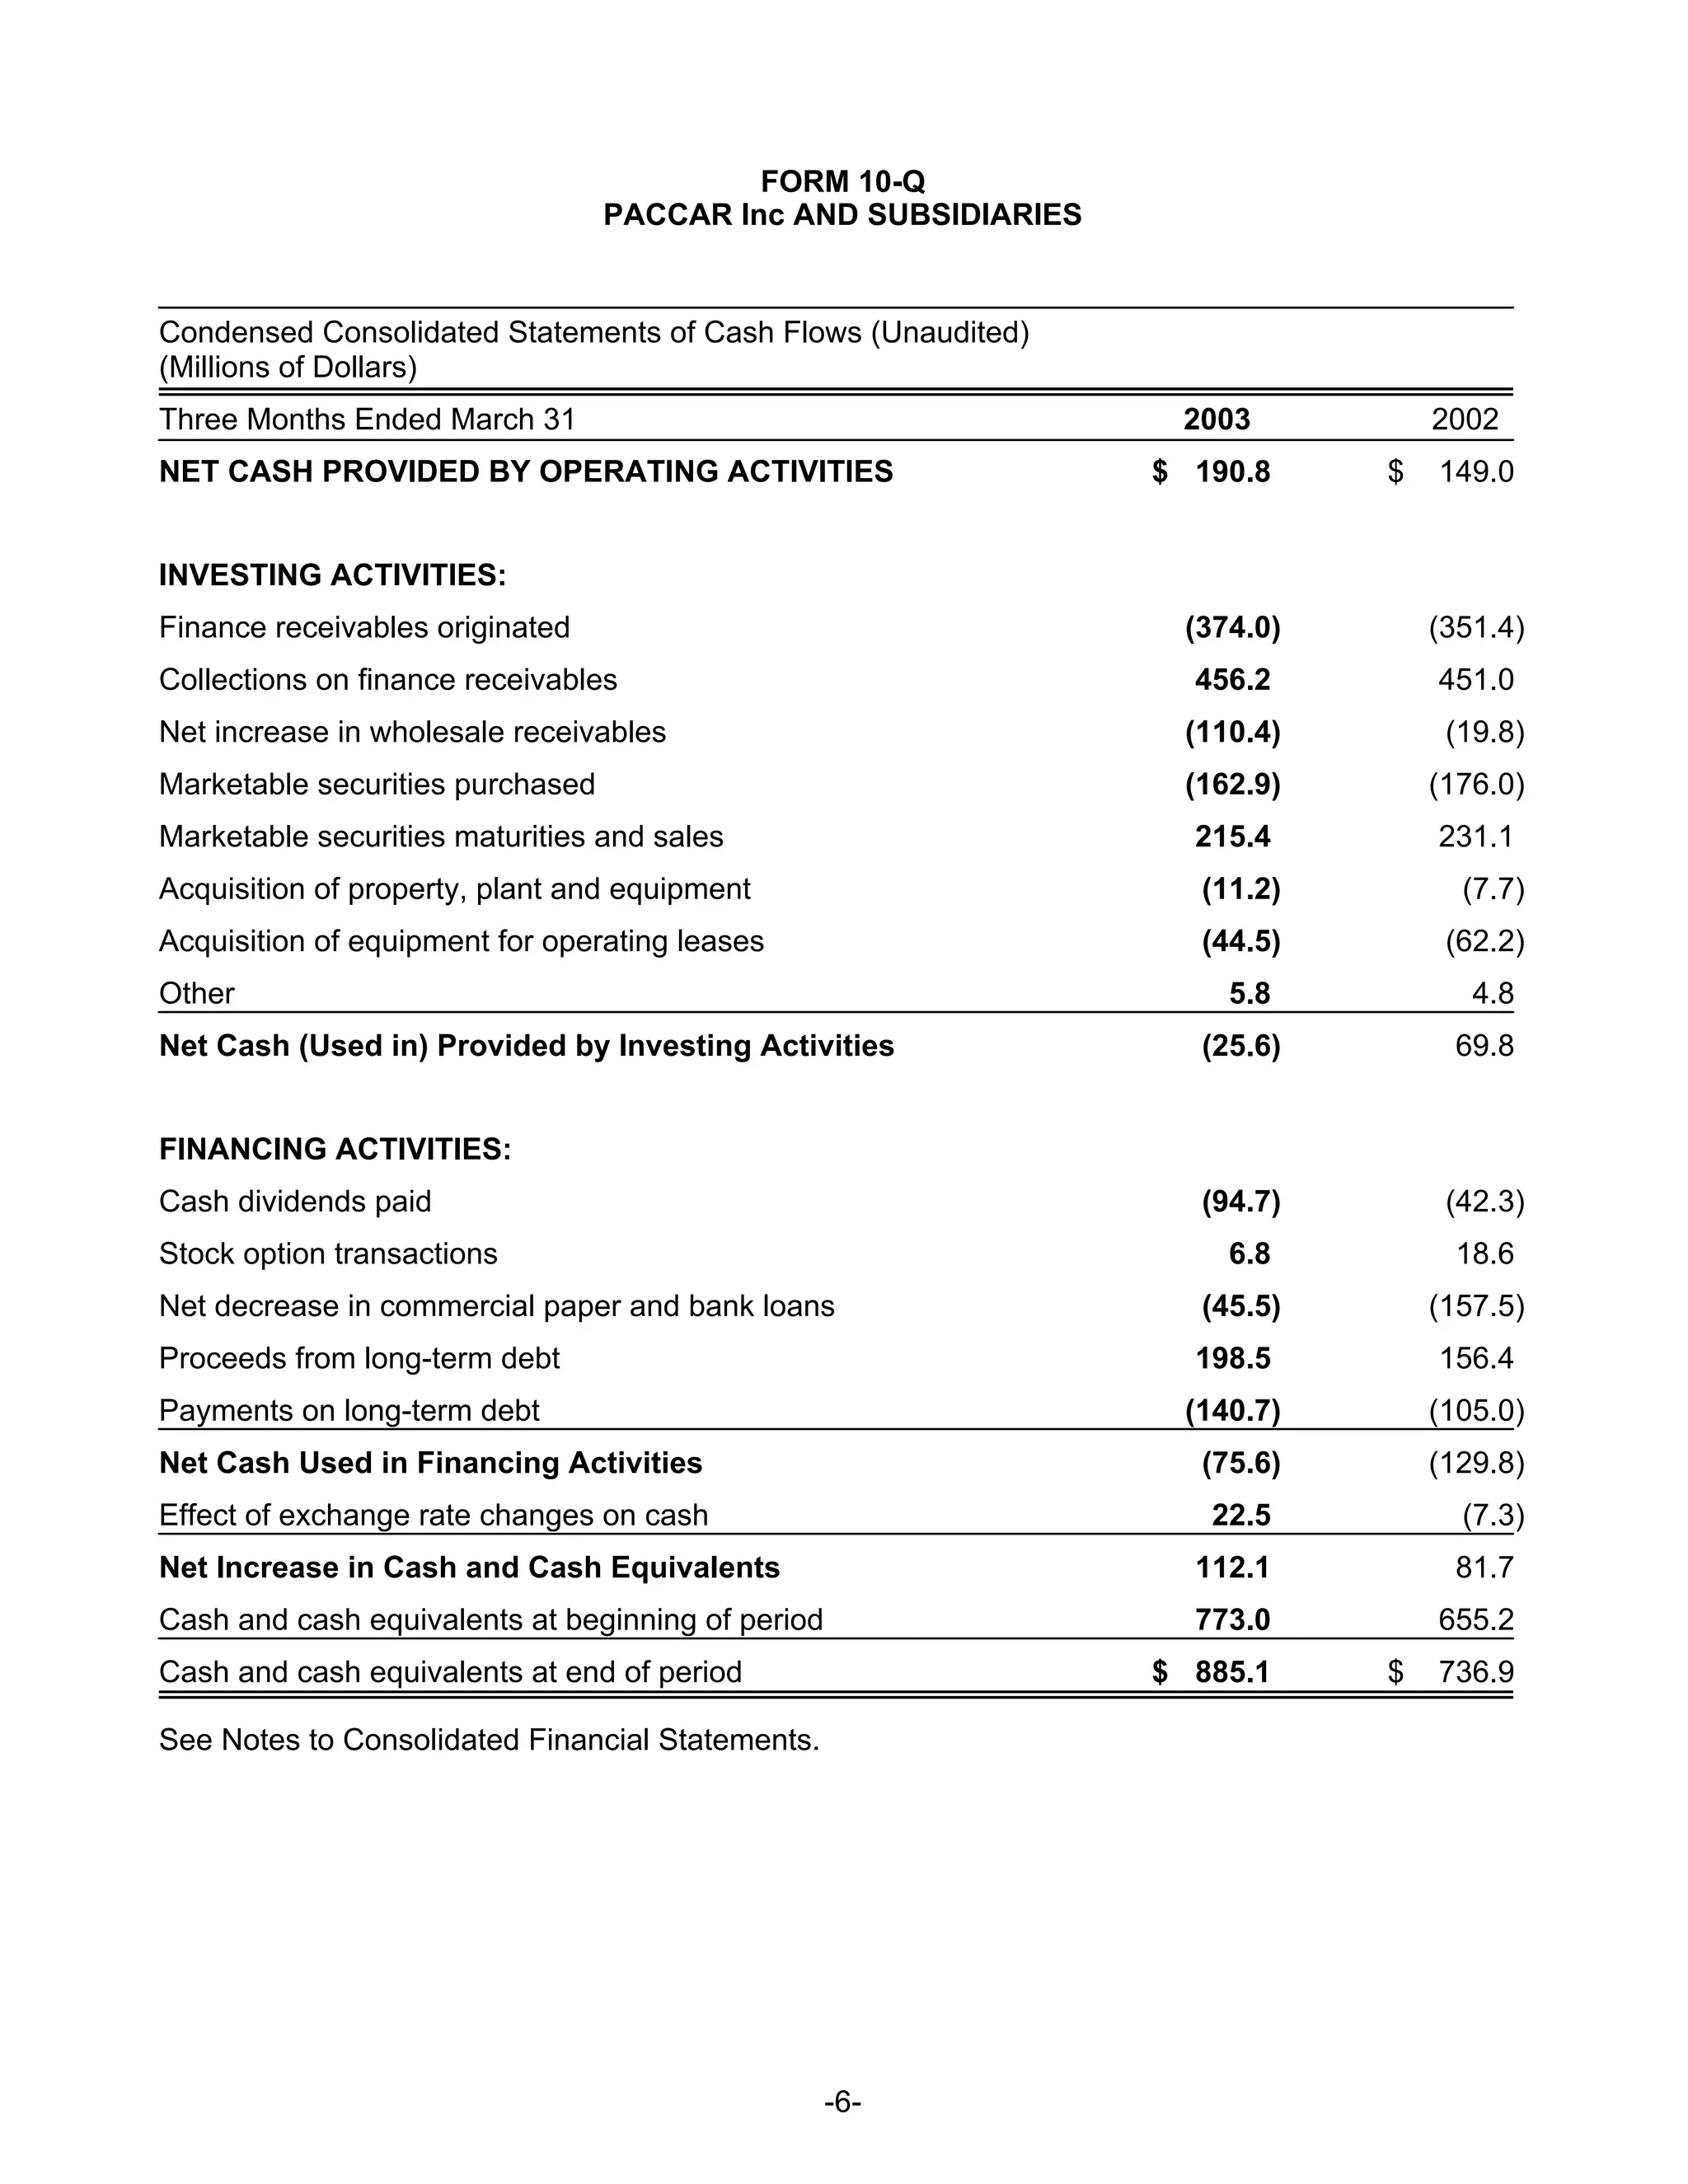
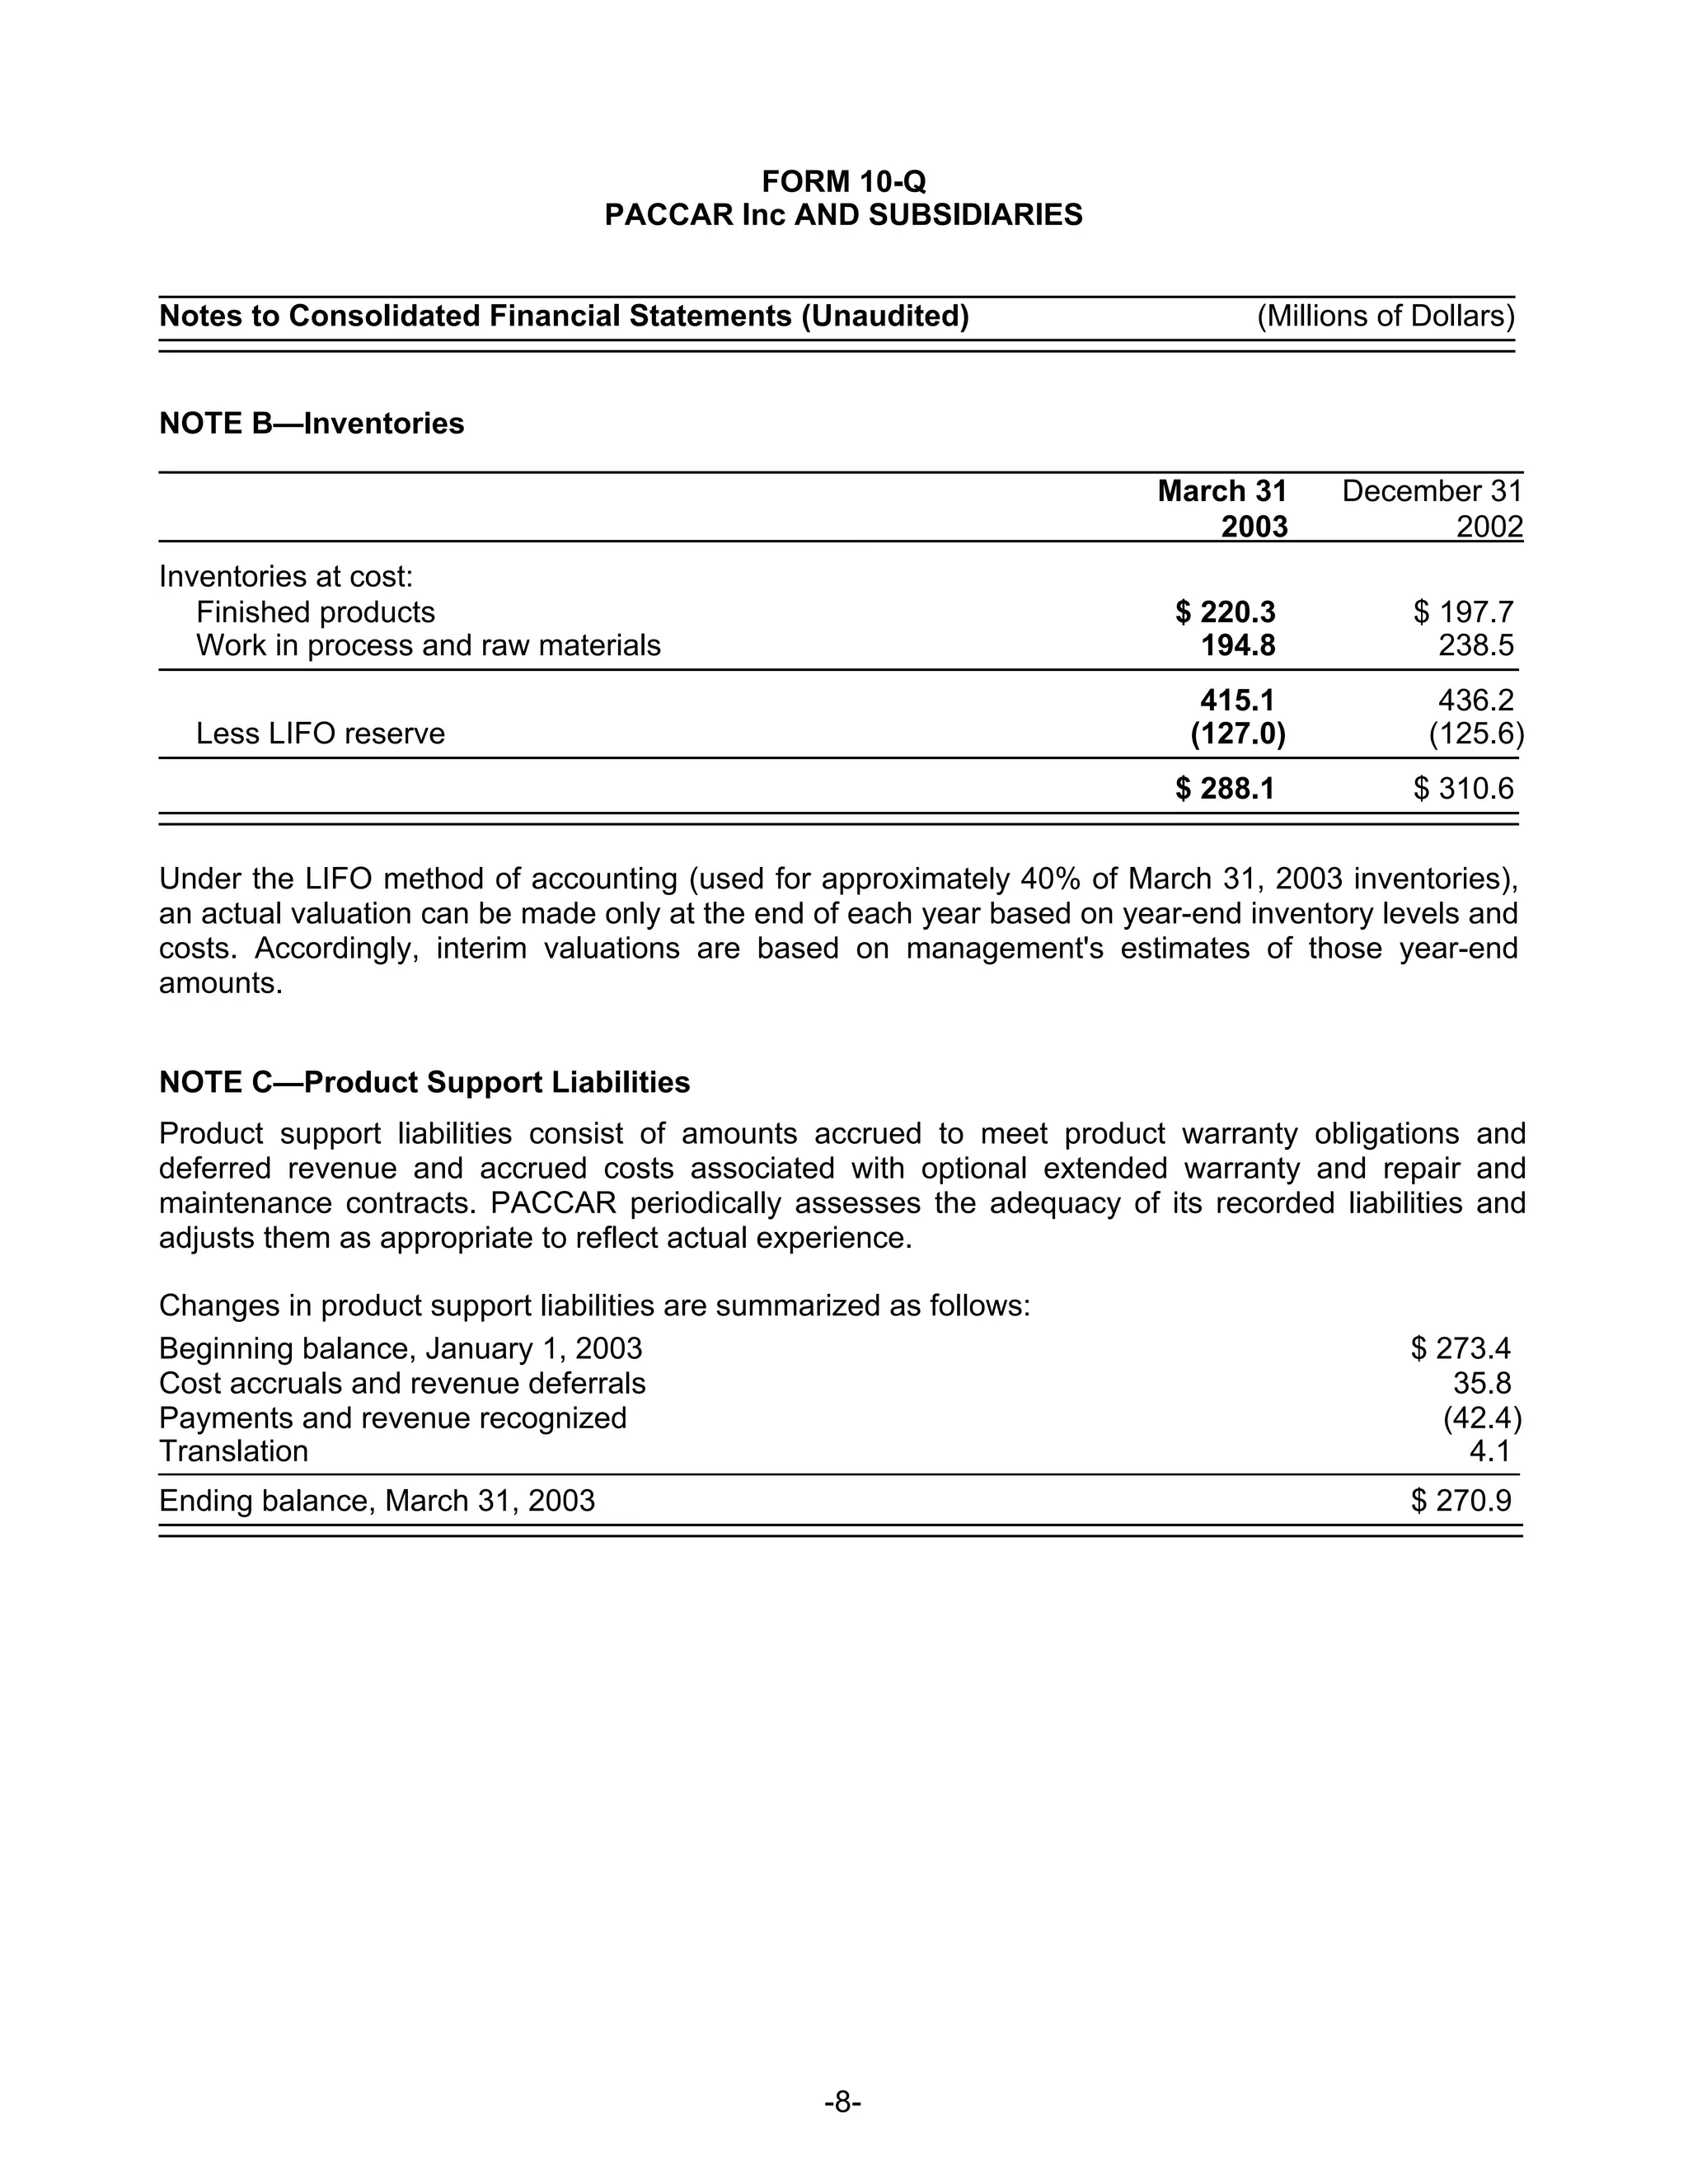
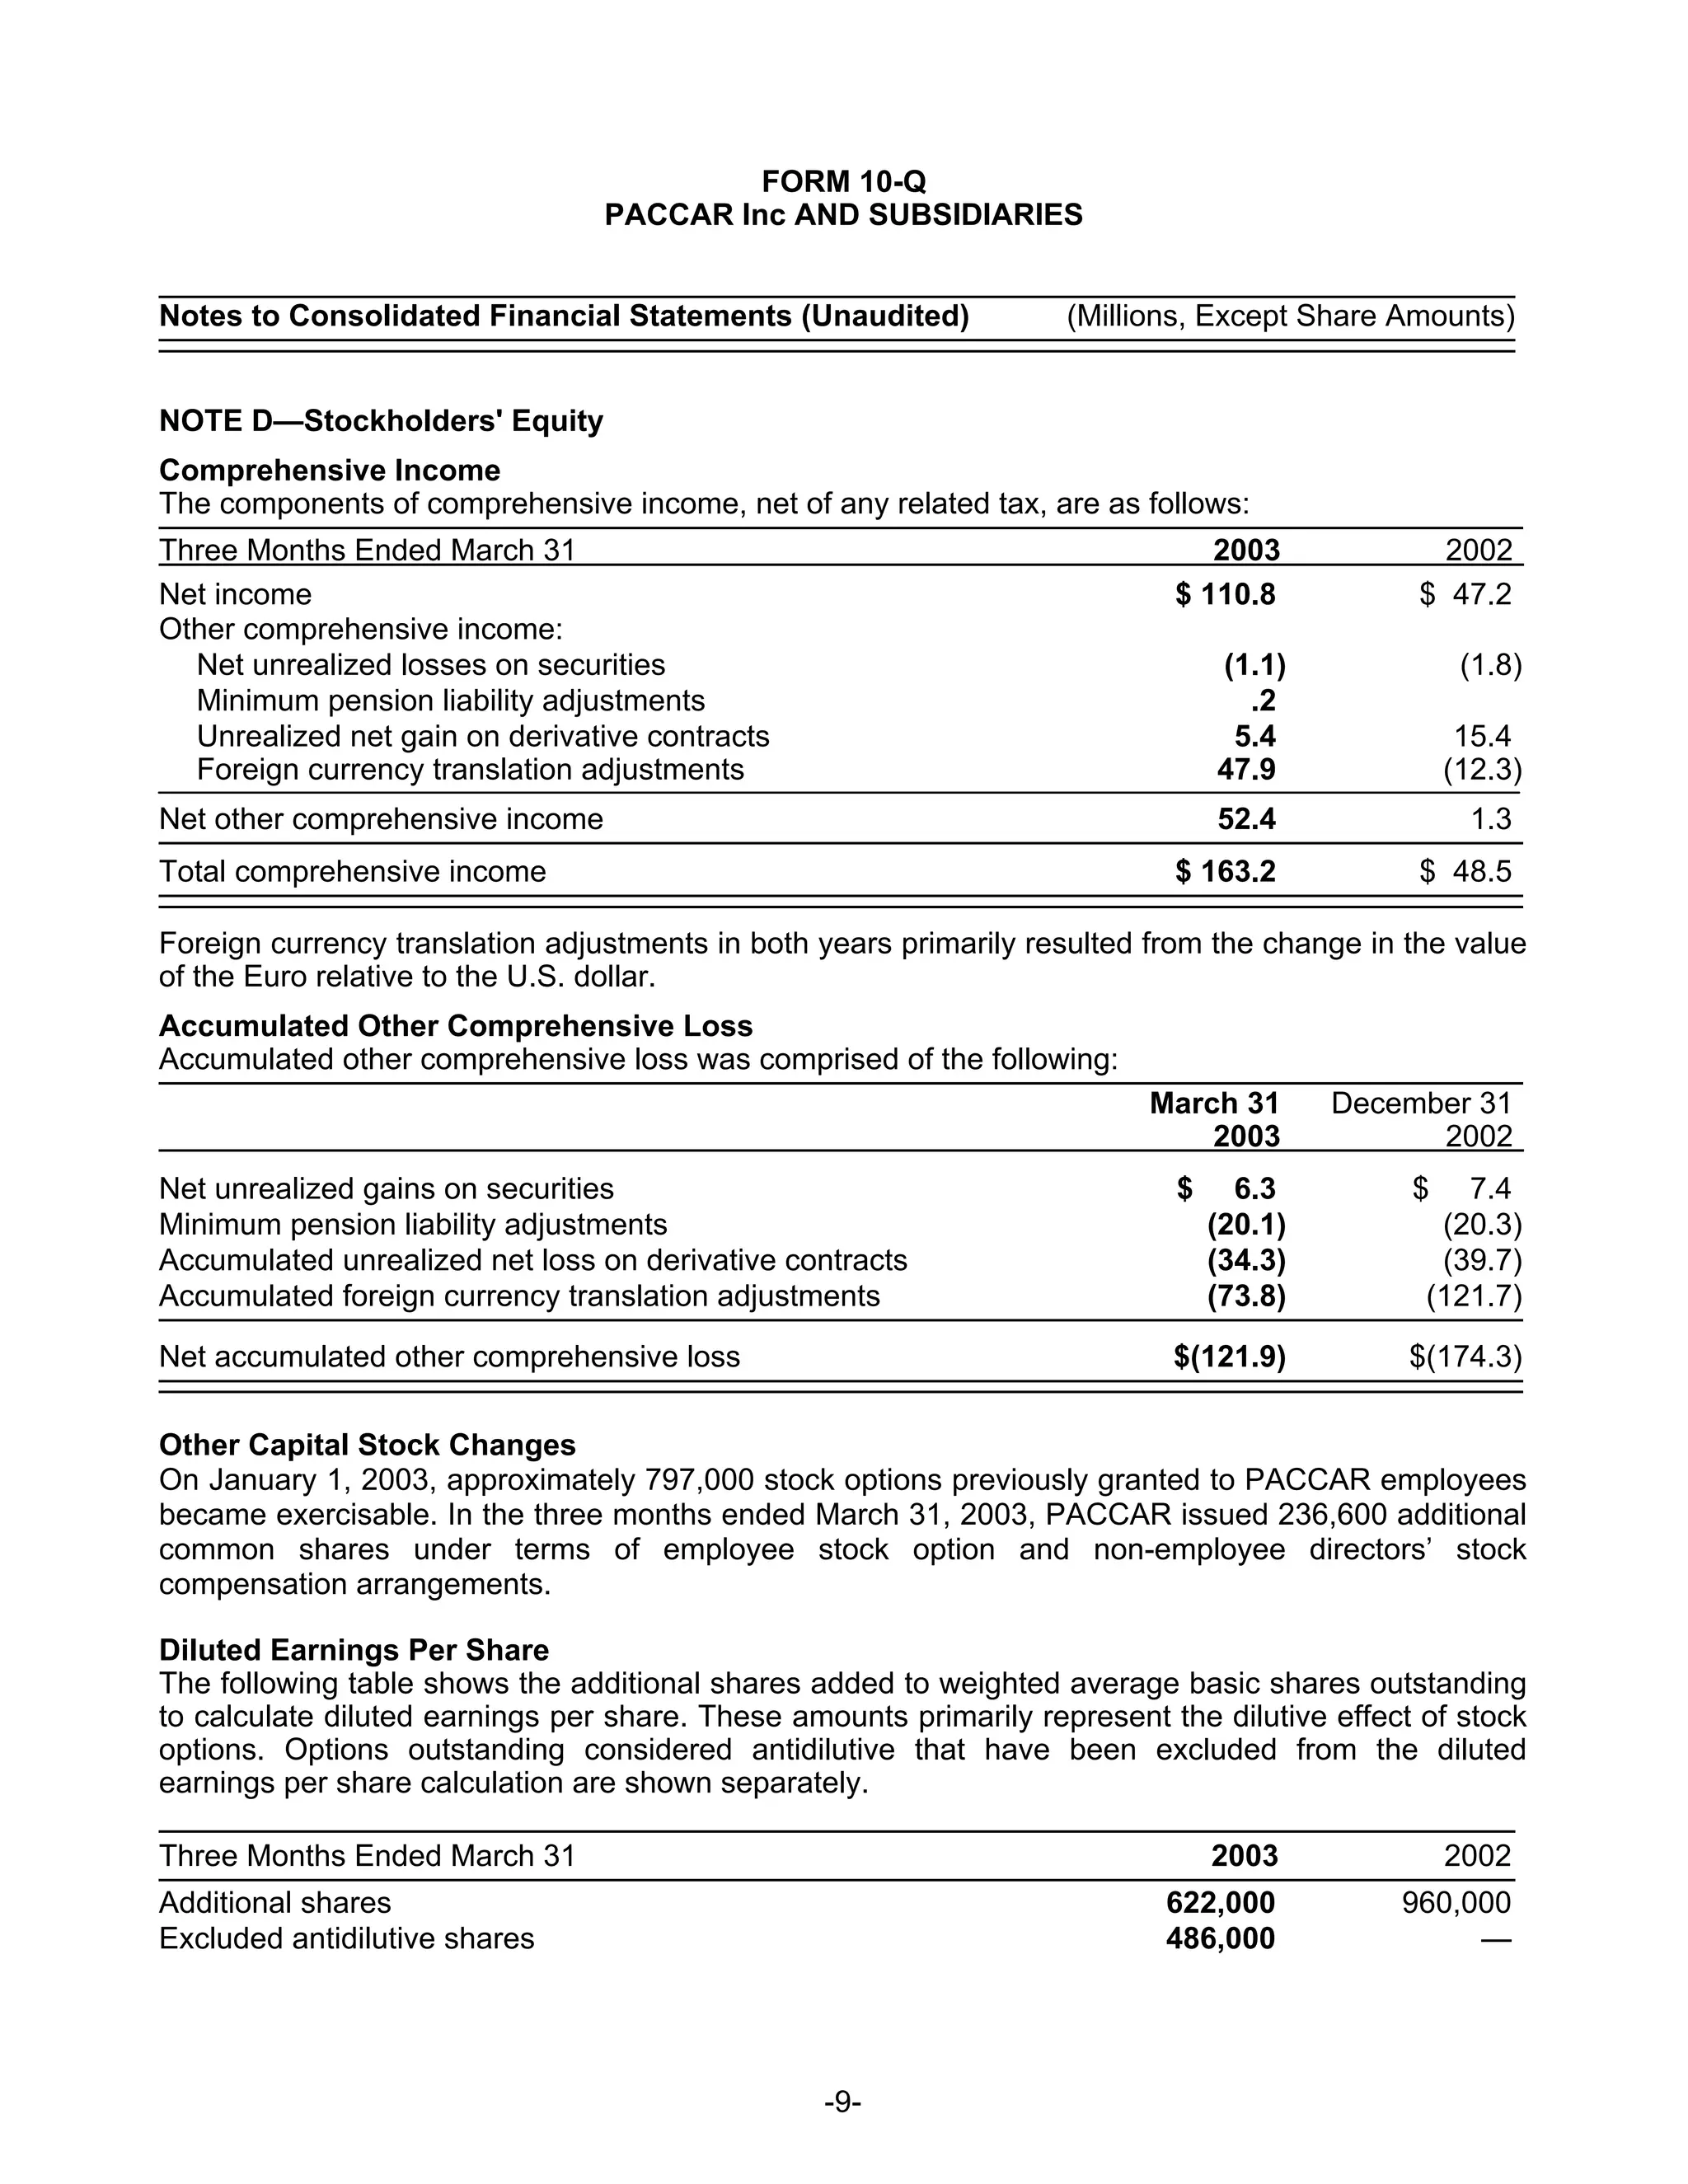
This document is PACCAR Inc's quarterly report filed with the SEC for the quarter ended March 31, 2003. It includes:
1) Financial statements such as the consolidated balance sheet, income statement, and statement of cash flows for the quarter.
2) Notes to the financial statements providing additional details.
3) Disclosure of accounting changes related to stock-based compensation.
4) Details of comprehensive income and accumulated other comprehensive loss.
- PACCAR Inc filed a quarterly report on Form 10-Q with the SEC for the quarter ended March 31, 2004.
- The report includes consolidated financial statements and notes for PACCAR and its subsidiaries for the quarter.
- Highlights include net income of $182.2 million for the quarter, up from $110.8 million in the same quarter of the previous year, with net income per share of $1.04.
This document is PACCAR Inc's quarterly report (Form 10-Q) filed with the SEC for the quarter ended June 30, 2003. It includes:
1) Financial statements including income statements, balance sheets, and cash flow statements for the quarter and year-to-date.
2) Notes to the financial statements providing additional details on accounting policies, inventory valuation, and new accounting standards.
3) Certification by management of the accuracy of the financial statements and disclosure of any material changes to internal controls.
The report provides investors with PACCAR's consolidated financial position and operating results for the quarter in compliance with SEC regulations.
This document is PACCAR Inc's quarterly report on Form 10-Q for the period ending March 31, 2005. It provides condensed financial statements and notes for the company, including consolidated statements of income and cash flows for the quarters ending March 31, 2005 and 2004, and consolidated balance sheets as of March 31, 2005 and December 31, 2004. It also provides information on accounting policies, inventory valuations, and product support liabilities.
This document is PACCAR Inc's quarterly report (Form 10-Q) for the period ending June 30, 2004 filed with the SEC. It includes:
1) Financial statements such as the consolidated balance sheet, income statement, and cash flow statement for the quarter.
2) Notes to the financial statements providing additional information and disclosure.
3) Certification by management of the accuracy of the financial statements and internal controls.
The summary highlights that this is PACCAR's regulatory filing, includes their quarterly financial statements, and notes to those statements as required by the SEC. It covers the essential information in 3 sentences as requested.
This document is PACCAR's quarterly report filed with the SEC for the quarter ended June 30, 2005. It includes PACCAR's consolidated financial statements and notes. The financial statements show revenues of $3.4 billion and net income of $241.5 million for the quarter. For the six months ended June 30, 2005, revenues were $6.5 billion and net income was $515.5 million. The report also discusses PACCAR's truck manufacturing and financial services businesses, accounting policies, and compliance with SEC filing requirements.
PACCAR Inc filed a quarterly report on Form 10-Q with the SEC for the period ending March 31, 2006. The report includes the company's consolidated financial statements and notes. It summarizes that PACCAR's net income increased to $342 million for Q1 2006 compared to $274 million for Q1 2005. Total revenues increased 16% to $3.9 billion. The report provides PACCAR's condensed consolidated financial position as of March 31, 2006 and December 31, 2005.
This document is PACCAR Inc's quarterly report on Form 10-Q for the period ending September 30, 2002 filed with the SEC. It includes PACCAR's consolidated financial statements and notes. The financial statements show that net sales for PACCAR's Truck and Other segment increased 35% to $1.9 billion for the third quarter of 2002 compared to $1.4 billion for the same period of 2001. Net income increased to $128.9 million for the third quarter of 2002 from $39.4 million in the third quarter of 2001. For the first nine months of the year, net income increased to $249.8 million from $123.2 million in the same period of 2001.
PACCAR reported net income of $47.2 million for the first quarter of 2002, compared to $44.3 million for the same period in 2001. Truck segment revenues declined slightly to $1.38 billion due to lower industry truck sales in Europe, which decreased 15% from near-record levels in 2001, though PACCAR's European subsidiary DAF increased its market share to a record high of 13%. Financial services income declined from $11.7 million to $9.7 million. Overall consolidated revenues fell 2% to $1.50 billion due to lower financial services results partially offsetting improved profits from truck operations.
This document is PACCAR Inc's quarterly report on Form 10-Q for the quarter ended September 30, 2003. It provides condensed financial statements and notes for the company, including consolidated balance sheets, income statements, and cash flow statements. Some key details include that net income for the quarter was $132.5 million and $367.4 million for the nine months. Total assets were $9.486 billion and stockholders' equity was $3.092 billion. Accounting changes related to consolidation of variable interest entities and the adoption of fair value accounting for stock options were also noted.
This document is McKesson Corporation's quarterly report filed with the SEC for the quarter ended December 31, 2001 on Form 10-Q. The summary includes:
1) McKesson provides condensed consolidated financial statements including the balance sheet, income statement, and cash flow statement for the quarter and nine months ended December 31, 2001 compared to the same periods in 2000.
2) Management's discussion and analysis is provided to discuss the company's financial condition, results of operations, liquidity, capital resources and critical accounting policies.
3) Disclosure is made regarding the company's exposure to market risks from foreign currency exchange rates and interest rates.
johnson controls FY2007 1st Quarter Form 10-Q finance8
This document is a Form 10-Q quarterly report filed by Johnson Controls with the SEC for the quarter ended December 31, 2006. It includes:
1) Financial statements such as the balance sheet, income statement, and cash flow statement for the quarter.
2) A discussion of the company's financial condition and results of operations for the quarter.
3) Information on legal proceedings, risks, shareholder votes, and certifications by management.
This document provides a quarterly financial report for PACCAR Inc for the period ending June 30, 2002. It includes an unaudited consolidated balance sheet, income statement, and statement of cash flows. It also provides notes to the financial statements regarding the basis of presentation, new accounting standards, inventory valuation, stockholders' equity, comprehensive income, and segment information. In summary, it presents PACCAR's financial position and operating results for the second quarter of 2002.
- PACCAR Inc. filed a quarterly report on Form 10-Q with the SEC for the quarter ended June 30, 2006.
- The report includes consolidated financial statements and notes covering PACCAR's truck and other operations as well as its financial services segment.
- Highlights include net sales of $3.94 billion for truck and other operations, and net income of $370 million for the company as a whole in the second quarter of 2006.
This document is PACCAR Inc's quarterly report filed with the SEC for the quarter ended September 30, 2005. It includes PACCAR's consolidated financial statements and notes. The financial statements show that for the quarter, PACCAR's net sales increased 20% to $3.35 billion, net income increased 23% to $304.8 million, and earnings per share increased 26% to $1.79. For the nine months, net sales increased 27% to $9.87 billion, net income increased 23% to $820.3 million, and earnings per share increased 25% to $4.76. The balance sheet shows total assets of $13.04 billion, with $5.13
- McKesson Corporation filed a Form 10-Q with the SEC for the quarter ended December 31, 2004.
- Total revenues for the quarter increased 14% to $20.8 billion compared to $18.2 billion in the prior year quarter. However, net income decreased to a loss of $665.4 million compared to net income of $120.2 million in the prior year quarter, driven by a $1.2 billion securities litigation charge.
- For the nine months ended December 31, 2004, total revenues increased 16% to $59.9 billion compared to $51.6 billion in the prior year period. However, net income decreased to a loss of $415.7 million compared
This document is McKesson Corporation's Form 10-Q quarterly report filed with the SEC for the quarter ended December 31, 2002. It includes condensed financial statements and notes. The financial statements show that for the quarter, McKesson reported revenues of $14.9 billion, net income of $134.3 million, and basic earnings per share of $0.46. For the nine months ended December 31, 2002, revenues were $42.2 billion, net income was $376.4 million, and basic EPS was $1.30. The notes provide additional details on new accounting pronouncements and the company's adoption of new standards.
- The document is McKesson Corporation's Form 10-Q quarterly report filed with the SEC for the quarter ended December 31, 2003.
- It includes condensed consolidated financial statements such as the balance sheet, income statement, and cash flow statement for the quarter and year-to-date periods, as well as notes to the financial statements.
- Highlights include total revenues of $18.2 billion for the quarter and $51.6 billion year-to-date, and net income of $120.2 million for the quarter and $432.3 million year-to-date.
This document is PACCAR Inc's quarterly report on Form 10-Q for the quarter ended September 30, 2004. It includes PACCAR's consolidated financial statements and notes to the financial statements for the third quarter of 2004. The financial statements show that PACCAR's net income for the third quarter was $246.7 million, up from $132.5 million in the third quarter of 2003. For the first nine months of 2004, net income was $665.4 million compared to $367.4 million for the same period in 2003. The balance sheet provides details on PACCAR's assets and liabilities as of September 30, 2004, including cash, receivables, inventory, property and equipment
This document is Tenet Healthcare Corporation's quarterly report filed with the SEC for the quarter ended February 28, 2003. It includes condensed consolidated financial statements and notes. In the quarter, Tenet recorded $383 million in impairment charges for long-lived assets at 10 general hospitals, 1 psychiatric hospital, and other properties due to changes indicating the carrying amounts may not be recoverable. Tenet also announced a plan to dispose of 14 general hospitals that no longer fit its core operating strategy.
johnson controls FY2009 First Quarter Form 10-Q Report finance8
This document is Johnson Controls' quarterly report filed with the SEC for the quarter ended December 31, 2008. It includes their condensed consolidated financial statements, notes to the financial statements, and other disclosures. The financial statements show a net loss of $608 million for the quarter on net sales of $7.3 billion, compared to net income of $235 million on net sales of $9.5 billion in the prior year quarter. Current assets decreased to $8.7 billion from $10.7 billion at the end of the previous fiscal year.
- McKesson Corporation filed a quarterly report with the SEC for the quarter ended June 30, 2002.
- The report includes condensed consolidated financial statements and notes, as well as management's discussion and analysis of financial condition and results of operations.
- As of June 30, 2002, McKesson had total assets of $13.5 billion including $10.8 billion in current assets, and total liabilities of $7.9 billion including $7.6 billion in current liabilities.
This document is a Form 8-K filed by YRC Worldwide Inc. with the Securities and Exchange Commission on February 13, 2006. It summarizes that YRC is revising its previously reported diluted earnings per share for the three and twelve months ended December 31, 2005 due to an accounting error related to foreign currency entries at its Canadian subsidiary Reimer Express. The revision has no impact on operating income. YRC also reports lower than estimated capital expenditures for 2005.
This document is a quarterly report filed with the SEC by Tenet Healthcare Corporation for the quarter ended March 31, 2003. It includes condensed consolidated financial statements and notes. Key details include: Tenet reported a net loss of $20 million for the quarter compared to net income of $278 million in the prior year quarter. It also announced a plan to dispose of 14 hospitals that no longer fit its core strategy. An impairment charge of $61 million was recorded related to assets held for sale for these hospitals. Restructuring charges of $9 million were incurred related to plans to reduce operating expenses.
This document is a Form 10-Q quarterly report filed by The Black & Decker Corporation with the SEC for the quarter ended September 30, 2007. It includes an unaudited consolidated statement of earnings, balance sheet, statement of cash flows, and notes to the financial statements. The financial statements show that for the quarter ended September 30, 2007, Black & Decker had sales of $1.63 billion, net earnings of $104.6 million, and earnings per share of $1.59 on a diluted basis. Total assets as of September 30, 2007 were $5.58 billion, with stockholders' equity of $1.06 billion.
johnson controls FY2006 2nd Quarter Form 10-Q finance8
This document is Johnson Controls' Form 10-Q quarterly report filed with the SEC for the quarter ended March 31, 2006. It includes an unaudited condensed consolidated statement of financial position, consolidated statements of income, condensed consolidated statements of cash flows, and notes to the condensed consolidated financial statements. The notes provide details on new accounting standards adopted, the acquisition of York International Corporation, and segment information.
This document is a quarterly report filed by Tenet Healthcare Corporation with the SEC for the quarterly period ended November 30, 2002. It includes condensed consolidated financial statements and notes. Tenet is currently involved in significant legal proceedings including shareholder derivative lawsuits, federal securities class actions, qui tam lawsuits related to Medicare billing, and government investigations into Medicare outlier payments and physician relationships. The financial statements show that for the six months ended November 30, 2002, Tenet had net income of $653 million on revenues of $7.4 billion, compared to net income of $244 million on revenues of $6.7 billion in the prior year period.
This document is PACCAR Inc's quarterly report filed with the SEC for the quarter ended September 30, 2006. It includes condensed financial statements and notes. The financial statements show that for the quarter, net sales increased 18% to $3.96 billion, net income increased 32% to $404 million, and earnings per share increased 36% to $1.62. For the first nine months of the year, net sales increased 17% to $11.53 billion, net income increased 36% to $1.12 billion, and earnings per share increased 40% to $4.45. The balance sheet shows total assets of $15.46 billion at quarter-end, with $6.18 billion in
This document is McKesson Corporation's Form 10-Q quarterly report filed with the SEC for the quarter ended June 30, 2003. It includes condensed consolidated financial statements and notes. The financial statements show that for the quarter ended June 30, 2003, McKesson's revenues increased 21% to $16.5 billion compared to the same period in 2002, while net income increased 33% to $155.6 million. McKesson's total assets as of June 30, 2003 were $14.8 billion, with current assets of $11.6 billion including $5.1 billion in receivables and $6 billion in inventories.
- McKesson Corporation filed a quarterly report with the SEC for the quarter ended June 30, 2004.
- As of June 30, 2004 McKesson had total assets of $17.1 billion including $8.4 billion in current liabilities and $5.4 billion in stockholders' equity.
- For the quarter ended June 30, 2004 McKesson reported revenues of $19.2 billion and net income of $146.1 million, an increase from revenues of $16.5 billion and net income of $131.6 million for the same quarter the previous year.
This document is a quarterly report filed with the SEC by The Black & Decker Corporation for the quarter ended March 30, 2008. It includes the consolidated statement of earnings, balance sheet, statement of stockholders' equity, and statement of cash flows for the quarter, as well as notes to the financial statements. The financial statements show that net earnings for the quarter were $67.4 million on sales of $1.495 billion, with basic earnings per share of $1.11. Cash flow from operating activities was negative $86.9 million for the quarter. Total stockholders' equity as of March 30, 2008 was $1.389 billion.
This document is a quarterly report filed with the SEC by The Black & Decker Corporation for the quarter ended March 30, 2008. It includes the consolidated statement of earnings, balance sheet, statement of stockholders' equity, and statement of cash flows for the quarter, as well as notes to the financial statements. The financial statements show that for the quarter, net earnings were $67.4 million on sales of $1.495 billion, with basic earnings per share of $1.11. Total assets as of March 30, 2008 were $5.555 billion, with stockholders' equity of $1.389 billion.
This document is a Form 10-Q quarterly report filed by The Black & Decker Corporation with the SEC for the quarter ended September 30, 2007. It includes an unaudited consolidated statement of earnings, balance sheet, statement of cash flows, and notes to the financial statements. The financial statements show that for the quarter ended September 30, 2007, Black & Decker had sales of $1.63 billion, net earnings of $104.6 million, and earnings per share of $1.59 on a diluted basis. Total assets as of September 30, 2007 were $5.58 billion, with stockholders' equity of $1.06 billion.
This document is PACCAR Inc's quarterly report on Form 10-Q for the quarter ended June 30, 2007 filed with the SEC. It includes PACCAR's consolidated financial statements and notes. The financial statements show that for the quarter, PACCAR's net sales increased 12% to $3.9 billion, net income increased 24% to $370 million, and earnings per share increased 23% to $1.48. On the balance sheet, total assets increased slightly to $16.5 billion, with cash and marketable securities totaling $2.4 billion.
This document is Unisys Corporation's quarterly report filed with the SEC for the third quarter of 2003. It includes Unisys' consolidated balance sheet, income statement, and cash flow statement for the periods ended September 30, 2003 and 2002. Key details include total revenue of $1.45 billion for Q3 2003, net income of $56.2 million, and basic earnings per share of $0.17. For the nine months ended September 30, 2003, total revenue was $4.27 billion and net income was $147.2 million.
This document is a quarterly report filed by The Black & Decker Corporation with the US Securities and Exchange Commission for the quarter ended September 28, 2008. It includes the company's consolidated financial statements and notes. The financial statements show that for the quarter, net earnings were $85.8 million on sales of $1.57 billion, compared to net earnings of $104.6 million on sales of $1.63 billion in the same quarter last year. For the nine months, net earnings were $249.9 million on sales of $4.71 billion, compared to net earnings of $330.7 million on sales of $4.91 billion in the same period last year. The notes provide accounting policies and
This document is a Form 10-Q quarterly report filed by The Black & Decker Corporation with the SEC for the quarter ended September 28, 2008. It includes the company's consolidated financial statements and notes. The financial statements show that for the quarter, net earnings were $85.8 million on sales of $1.57 billion, compared to net earnings of $104.6 million on sales of $1.63 billion in the same quarter of the previous year. For the nine months, net earnings were $249.9 million on sales of $4.71 billion, compared to net earnings of $330.7 million on sales of $4.91 billion in the previous year. The notes provide accounting policies and
This document is Micron Technology's 10-Q quarterly report filed with the SEC for the quarter ended December 2, 2004. It includes Micron's consolidated financial statements and notes. The financial statements show that for the quarter, Micron's net sales increased 14% to $1.26 billion and net income increased significantly to $154.9 million compared to $1.1 million in the same quarter the previous year. Cash provided by operating activities was $291.4 million. The report provides details on Micron's financial performance, position, and cash flows for the quarter.
- The document is Goodyear Tire & Rubber Company's Form 10-Q/A for the quarterly period ended March 31, 2004, which includes restated financial statements and notes for that period as well as the comparable period in 2003.
- Goodyear is restating its financial statements for 2003 and prior periods due to accounting errors. The restatement adjustments are described in Note 1A and Note 2.
- For the quarter ended March 31, 2004, Goodyear reported a net loss of $78.1 million compared to a net loss of $200.5 million in the comparable period of 2003.
This SEC filing is Unisys Corporation's quarterly report on Form 10-Q for the quarter ended June 30, 2004. It includes Unisys' consolidated financial statements, including their balance sheet, income statement, and statement of cash flows for the quarter. It also provides notes to the financial statements and breaks down revenue and operating results by business segment. The filing provides investors with Unisys' financial performance and position for the quarter according to US GAAP and SEC regulations.
aetna Download Documentation Form 10-Q 2005 3rdfinance9
This document is a quarterly report filed with the SEC by Aetna Inc. for the quarter ended September 30, 2005. It includes Aetna's consolidated financial statements and notes. The financial statements show that for the quarter, Aetna reported total revenue of $5.7 billion and net income of $377.8 million. For the nine months ended September 30, 2005, Aetna reported total revenue of $16.6 billion and net income of $1.2 billion. The balance sheet shows that as of September 30, 2005, Aetna had total assets of $43.3 billion and total liabilities of $33.9 billion.
aetna Download Documentation Form 10-Q2008 3rdfinance9
This document is an SEC Form 10-Q quarterly report filed by Aetna Inc. for the quarterly period ended September 30, 2008. It includes Aetna's consolidated financial statements and notes. The financial statements show that for the quarter Aetna reported total revenue of $7.6 billion, net income of $277 million, and earnings per share of $0.58. For the nine months ended September 30, Aetna reported total revenue of $23.2 billion, net income of $1.2 billion, and earnings per share of $2.40. The balance sheet shows total assets of $37.3 billion and total liabilities of $28 billion.
This document is Danaher Corporation's Form 10-Q quarterly report filed with the SEC for the quarter ended September 26, 2008. It includes Danaher's consolidated condensed financial statements and notes. Some key details include:
- Net earnings for the quarter were $371.9 million compared to $483.7 million in the prior year.
- Total current assets increased to $4.1 billion from $4 billion at the end of 2007.
- Sales for the quarter increased to $3.2 billion from $2.7 billion in the prior year.
- Cash flows from operating activities for the nine months ended was $1.3 billion.
johnson controls FY2005 2nd Quarter Form 10-QA finance8
This document is Johnson Controls' Form 10-Q/A for the quarterly period ending March 31, 2005. It provides restated financial statements and notes to correct for the improper consolidation of a North American joint venture. The restatement impacts the presentation of certain financial data but does not change previously reported income, net income, or earnings per share. The document includes unaudited consolidated statements of financial position, income, and cash flows for the periods presented. It also provides notes to the financial statements and management's discussion and analysis of financial condition and results of operations.
aetna Download Documentation Form 10-Q2007 3rdfinance9
This document is a quarterly report filed by Aetna Inc. with the Securities and Exchange Commission for the quarterly period ended September 30, 2007. It includes Aetna's consolidated financial statements and notes. The financial statements show that for the quarter, Aetna reported total revenue of $6.96 billion, income from continuing operations of $496.7 million, and net income of $496.7 million. For the nine months ended September 30, 2007, Aetna reported total revenue of $20.46 billion, income from continuing operations of $1.38 billion, and net income of $1.38 billion. The balance sheet shows total assets of $50.06 billion and total liabilities
The document is Unisys Corporation's Form 10-Q filing for the quarterly period ended June 30, 2006. It includes:
- Consolidated balance sheets showing total assets of $5.1 billion including cash of $655.1 million and total liabilities and stockholders' equity of $5.1 billion.
- Consolidated statements of income showing a net loss of $194.6 million for the quarter and $222.5 million for the six months.
- Consolidated statements of cash flows showing cash provided by operating activities of $166 million for the six months.
This document outlines Computer Sciences Corporation's equity grant policy, including the types of equity grants awarded, grant dates, approval process, and reporting requirements. It states that CSC issues equity grants to directors and employees to attract, retain, and motivate them. Equity grants include stock options, restricted stock, and restricted stock units. Grant dates depend on whether the recipient is a director, new hire, promotion, or current employee. Senior executive grants require higher levels of approval than non-senior grants. The company must stay within an approved annual equity grant budget.
The document outlines the bylaws of Computer Sciences Corporation. It details the principal office location, procedures for annual and special stockholder meetings, requirements for submitting items and nominations for consideration at meetings, and election of directors. Key details include timelines for submitting proposals/nominations, information required to be provided, and requirements for stockholders to present submitted items at meetings.
This document restates the articles of incorporation of Computer Sciences Corporation. It outlines the corporation's name, principal office location, nature of business, capital stock structure including 750 million shares of common stock and 1 million shares of preferred stock. It provides the board of directors authority to establish terms for preferred stock series and outlines shareholder rights and restrictions.
This document outlines a supplemental code of ethics specifically for a company's Chairman and Chief Executive Officer, Vice President and Chief Financial Officer, and Vice President and Chief Accounting Officer. The code builds upon the company's existing code of ethics and standards of conduct applicable to all directors, officers, and employees. It requires these executives to act with honesty and integrity, avoid conflicts of interest, ensure full financial disclosure, comply with all applicable laws and regulations, and promptly report any unethical or illegal conduct. Violations will be reported to the board of directors who will determine appropriate accountability actions.
This document outlines the Code of Ethics and Standards of Conduct for Computer Sciences Corporation (CSC). It discusses CSC's commitment to ethics, integrity and social responsibility. It also summarizes the principles of avoiding conflicts of interest, protecting company and customer property, providing accurate records and reports, maintaining a professional work environment, and procedures for reporting violations. Adherence to the Code is required by all CSC directors, employees and representatives.
This document outlines the corporate governance guidelines for Computer Sciences Corporation. It addresses the role of the board of directors in overseeing management and acting in good faith. It also covers the composition of the board, including the size, selection process, and independence of directors. The document provides qualifications for directors, including limits on other board service and procedures for changes in job responsibilities. It describes board committees, conduct of meetings, access to management and advisors, performance evaluations, director compensation, orientation, education, and succession planning.
This document provides an investor highlights report for Computer Sciences Corporation (CSC) for the first quarter of fiscal year 1997. It summarizes that CSC reported a 20% increase in net income and 20.5% increase in revenue compared to the same quarter the previous year. It also announces three acquisitions that further expanded CSC's industry-specific consulting services. CSC operates in strong markets for information technology services and sees continued growth opportunities.
CSC reported $1.36 billion in revenue for the second quarter of FY1997, a 20.1% increase over the previous year. CSC earned $49.3 million excluding a one-time $48.9 million charge related to an acquisition. For the first six months of FY1997, CSC reported $2.66 billion in revenue and $94.6 million in net income excluding the charge. CSC operates in commercial and government IT markets, with growing demand for outsourcing and consulting services.
Computer Sciences Corporation reported a 15.5% increase in earnings per share for the first quarter of fiscal year 1998. Revenue rose 14.2% to $1.488 billion, with growth in commercial, European, and other international sectors. While US federal revenue declined slightly due to contract completions, the company expects this sector to improve over the fiscal year as new contracts are implemented. Overall, CSC's business continues to demonstrate strong growth trends across its consulting, systems integration, and outsourcing services.
Computer Sciences Corporation reported financial results for the second quarter of fiscal year 1998, ended September 26, 1997. Revenue increased 16.5% to $1.58 billion compared to the previous year. Net income grew 18.8% to $58.6 million. The company provides management consulting, systems integration, and outsourcing services worldwide to industry and government clients. New contracts were announced during the quarter, and the company expects continued revenue growth for the remainder of the fiscal year.
The document is a quarterly report from Computer Sciences Corporation (CSC) providing key financial information and highlights for investors. It summarizes that CSC's revenue increased 17.1% in the third quarter of fiscal year 1998 compared to the previous year. Net income also rose 20.5% over the same period. The report further outlines CSC's business segments and global operations, as well as new contracts and growth in key market sectors during the quarter.
Computer Sciences Corporation (CSC) reported higher revenue and earnings for the first quarter of fiscal year 1999 compared to the same period the previous year. Revenue increased 17.8% to $1.75 billion while net income rose 22.2% to $64.3 million. The company also announced $2.8 billion in new contract awards during the quarter and saw growth across all of its major service categories. CSC's chairman attributed the strong results to continued expansion in key markets like financial services and healthcare as well as new strategic partnerships.
Computer Sciences Corporation (CSC) reported a 21.6% increase in earnings per share for the second quarter of fiscal year 1999 compared to the previous year. Revenue increased 17% to $1.85 billion driven by strong growth in Europe and the federal sector. For the first half of the fiscal year, net income rose 23.6% and revenues increased 17.4% over the previous year. CSC also acquired a majority stake in a French consulting firm, increasing its presence in that country.
Computer Sciences Corporation reported a 22.7% increase in earnings per share for the third quarter of fiscal year 1999 compared to the previous year. Net income increased 25.9% while revenues rose 15.9%. Growth was driven by strong performance in European operations, consulting, financial services, and lower interest costs. For the first nine months of the fiscal year, net income increased 24.5% while revenues were up 16.9% year-over-year.
Computer Sciences Corporation (CSC) reported a 20% increase in earnings per share and a 21.7% increase in net income for the first quarter of fiscal year 2000 compared to the same quarter the previous year. Revenue increased 17.6% to $2.06 billion driven by increased demand for outsourcing, enterprise solutions, e-business, and systems integration. CSC also announced over $4.7 billion in new business awards during the quarter and expects e-business revenue to triple to nearly $600 million for the full fiscal year.
Computer Sciences Corporation (CSC) reported higher earnings and revenue for the second quarter of fiscal year 2000 compared to the same period last year. Earnings per share rose 22.2% and net income increased 22.7% due to strong global commercial growth and improved operating performance. CSC continues to see significant demand for outsourcing and other services and rapid growth in requests for e-business solutions.
Computer Sciences Corporation (CSC) reported financial results for the third quarter of fiscal year 2000, ending December 31, 1999. Revenue was up 14.9% to $2.4 billion compared to the previous year. Earnings per share, excluding special items, were 66 cents, a 20% increase over the previous year. CSC received $3.5 billion in new business awards during the quarter and $9.6 billion year-to-date. Research analysts from various firms cover CSC stock, which trades on the New York Stock Exchange.
Computer Sciences Corporation (CSC) reported financial results for the first quarter of fiscal year 2001, ended June 30, 2000. Revenues increased 11.8% to $2.46 billion due to strong growth in the U.S. federal government, Asia-Pacific, and commercial outsourcing sectors. Net income grew 13.5% to $96 million and earnings per share increased to 56 cents. CSC also secured $3.3 billion in new business awards during the quarter and remains on track to achieve its target of $1 billion in e-business revenue for the fiscal year.
Computer Sciences Corporation (CSC) reported strong financial results for the second quarter of fiscal year 2001, with revenues increasing 12% to $2.5 billion and net income growing 17.1% to $109 million. For the first six months of the fiscal year, revenues were up 11.9% to $5 billion and net income increased 15.4% to $205 million. The company secured $7.7 billion in new contracts for the first half, fueling anticipated growth in the second half of the year.
Computer Sciences Corporation (CSC) reported financial results for the third quarter of fiscal year 2001, ended December 29, 2000. Revenues increased 12.9% to $2.7 billion due to growth in the federal government vertical market and commercial outsourcing. Earnings before special items increased 9.6% to $122.9 million. Major new business awards totaled $1.8 billion for the quarter. For the nine-month period, revenues increased 12.2% to $7.6 billion and earnings before special items increased 13.1% to $327.9 million, though results were impacted by currency effects and restructuring costs. CSC also discussed several new contracts and engagements.
Seminar: Gender Board Diversity through Ownership NetworksGRAPE
Seminar on gender diversity spillovers through ownership networks at FAME|GRAPE. Presenting novel research. Studies in economics and management using econometrics methods.
5 Tips for Creating Standard Financial ReportsEasyReports
Well-crafted financial reports serve as vital tools for decision-making and transparency within an organization. By following the undermentioned tips, you can create standardized financial reports that effectively communicate your company's financial health and performance to stakeholders.
"Does Foreign Direct Investment Negatively Affect Preservation of Culture in the Global South? Case Studies in Thailand and Cambodia."
Do elements of globalization, such as Foreign Direct Investment (FDI), negatively affect the ability of countries in the Global South to preserve their culture? This research aims to answer this question by employing a cross-sectional comparative case study analysis utilizing methods of difference. Thailand and Cambodia are compared as they are in the same region and have a similar culture. The metric of difference between Thailand and Cambodia is their ability to preserve their culture. This ability is operationalized by their respective attitudes towards FDI; Thailand imposes stringent regulations and limitations on FDI while Cambodia does not hesitate to accept most FDI and imposes fewer limitations. The evidence from this study suggests that FDI from globally influential countries with high gross domestic products (GDPs) (e.g. China, U.S.) challenges the ability of countries with lower GDPs (e.g. Cambodia) to protect their culture. Furthermore, the ability, or lack thereof, of the receiving countries to protect their culture is amplified by the existence and implementation of restrictive FDI policies imposed by their governments.
My study abroad in Bali, Indonesia, inspired this research topic as I noticed how globalization is changing the culture of its people. I learned their language and way of life which helped me understand the beauty and importance of cultural preservation. I believe we could all benefit from learning new perspectives as they could help us ideate solutions to contemporary issues and empathize with others.
Independent Study - College of Wooster Research (2023-2024) FDI, Culture, Glo...AntoniaOwensDetwiler
"Does Foreign Direct Investment Negatively Affect Preservation of Culture in the Global South? Case Studies in Thailand and Cambodia."
Do elements of globalization, such as Foreign Direct Investment (FDI), negatively affect the ability of countries in the Global South to preserve their culture? This research aims to answer this question by employing a cross-sectional comparative case study analysis utilizing methods of difference. Thailand and Cambodia are compared as they are in the same region and have a similar culture. The metric of difference between Thailand and Cambodia is their ability to preserve their culture. This ability is operationalized by their respective attitudes towards FDI; Thailand imposes stringent regulations and limitations on FDI while Cambodia does not hesitate to accept most FDI and imposes fewer limitations. The evidence from this study suggests that FDI from globally influential countries with high gross domestic products (GDPs) (e.g. China, U.S.) challenges the ability of countries with lower GDPs (e.g. Cambodia) to protect their culture. Furthermore, the ability, or lack thereof, of the receiving countries to protect their culture is amplified by the existence and implementation of restrictive FDI policies imposed by their governments.
My study abroad in Bali, Indonesia, inspired this research topic as I noticed how globalization is changing the culture of its people. I learned their language and way of life which helped me understand the beauty and importance of cultural preservation. I believe we could all benefit from learning new perspectives as they could help us ideate solutions to contemporary issues and empathize with others.
Financial Assets: Debit vs Equity Securities.pptxWrito-Finance
financial assets represent claim for future benefit or cash. Financial assets are formed by establishing contracts between participants. These financial assets are used for collection of huge amounts of money for business purposes.
Two major Types: Debt Securities and Equity Securities.
Debt Securities are Also known as fixed-income securities or instruments. The type of assets is formed by establishing contracts between investor and issuer of the asset.
• The first type of Debit securities is BONDS. Bonds are issued by corporations and government (both local and national government).
• The second important type of Debit security is NOTES. Apart from similarities associated with notes and bonds, notes have shorter term maturity.
• The 3rd important type of Debit security is TRESURY BILLS. These securities have short-term ranging from three months, six months, and one year. Issuer of such securities are governments.
• Above discussed debit securities are mostly issued by governments and corporations. CERTIFICATE OF DEPOSITS CDs are issued by Banks and Financial Institutions. Risk factor associated with CDs gets reduced when issued by reputable institutions or Banks.
Following are the risk attached with debt securities: Credit risk, interest rate risk and currency risk
There are no fixed maturity dates in such securities, and asset’s value is determined by company’s performance. There are two major types of equity securities: common stock and preferred stock.
Common Stock: These are simple equity securities and bear no complexities which the preferred stock bears. Holders of such securities or instrument have the voting rights when it comes to select the company’s board of director or the business decisions to be made.
Preferred Stock: Preferred stocks are sometime referred to as hybrid securities, because it contains elements of both debit security and equity security. Preferred stock confers ownership rights to security holder that is why it is equity instrument
<a href="https://www.writofinance.com/equity-securities-features-types-risk/" >Equity securities </a> as a whole is used for capital funding for companies. Companies have multiple expenses to cover. Potential growth of company is required in competitive market. So, these securities are used for capital generation, and then uses it for company’s growth.
Concluding remarks
Both are employed in business. Businesses are often established through debit securities, then what is the need for equity securities. Companies have to cover multiple expenses and expansion of business. They can also use equity instruments for repayment of debits. So, there are multiple uses for securities. As an investor, you need tools for analysis. Investment decisions are made by carefully analyzing the market. For better analysis of the stock market, investors often employ financial analysis of companies.
STREETONOMICS: Exploring the Uncharted Territories of Informal Markets throug...sameer shah
Delve into the world of STREETONOMICS, where a team of 7 enthusiasts embarks on a journey to understand unorganized markets. By engaging with a coffee street vendor and crafting questionnaires, this project uncovers valuable insights into consumer behavior and market dynamics in informal settings."
What price will pi network be listed on exchangesDOT TECH
The rate at which pi will be listed is practically unknown. But due to speculations surrounding it the predicted rate is tends to be from 30$ — 50$.
So if you are interested in selling your pi network coins at a high rate tho. Or you can't wait till the mainnet launch in 2026. You can easily trade your pi coins with a merchant.
A merchant is someone who buys pi coins from miners and resell them to Investors looking forward to hold massive quantities till mainnet launch.
I will leave the what's app number of my personal pi vendor to trade with.
+12349014282
G20 summit held in India. Proper presentation for G20 summit
PCARMar2003_10-Q
1. CONFORMED COPY
SECURITIES AND EXCHANGE COMMISSION
Washington, D.C. 20549
FORM 10-Q
[x] Quarterly Report Pursuant to Section 13 or 15(d) of the Securities Exchange Act of 1934
For the quarterly period ended March 31, 2003
or
[ ] Transition Report Pursuant to Section 13 or 15(d) of the Securities Exchange Act of 1934
For the transition period from _________ to _________
Commission File No. 001-14817
PACCAR Inc
(Exact name of Registrant as specified in its charter)
Delaware 91-0351110
(State or other jurisdiction of (I.R.S. Employer Identification No.)
incorporation or organization)
777 - 106th Ave. N.E., Bellevue, WA 98004
(Address of principal executive offices) (Zip Code)
(425) 468-7400
(Registrant's telephone number, including area code)
Indicate by check mark whether the registrant (1) has filed all reports required to be filed by Section
13 or 15(d) of the Securities Exchange Act of 1934 during the preceding 12 months (or for such
shorter period that the registrant was required to file such reports), and (2) has been subject to such
filing requirements for at least the past 90 days. Yes X No___
Indicate by check mark whether the registrant is an accelerated filer (as defined in Rule 12b-2 of the
Exchange Act). Yes X No___
Indicate the number of shares outstanding of each of the issuer's classes of common stock, as of the
latest practicable date.
Common Stock, $1 par value—116,247,266 shares as of April 30, 2003
2. FORM 10-Q
PACCAR Inc AND SUBSIDIARIES
INDEX
Page
PART I. FINANCIAL INFORMATION:
ITEM 1. FINANCIAL STATEMENTS:
Consolidated Statements of Income --
Three Months Ended March 31, 2003 and 2002 (unaudited) ............................................ 3
Consolidated Balance Sheets --
March 31, 2003 (unaudited), and December 31, 2002 ...................................................... 4
Condensed Consolidated Statements of Cash Flows --
Three Months Ended March 31, 2003 and 2002 (unaudited) ............................................ 6
Notes to Consolidated Financial Statements (unaudited)........................................................ 7
ITEM 2. MANAGEMENT'S DISCUSSION AND ANALYSIS OF RESULTS OF
OPERATIONS AND FINANCIAL CONDITION ............................................................ 11
ITEM 3. QUANTITATIVE AND QUALITATIVE DISCLOSURES ABOUT MARKET RISK......... 12
ITEM 4. CONTROLS AND PROCEDURES .............................................................................. 13
PART II. OTHER INFORMATION:
ITEM 4. SUBMISSION OF MATTERS TO A VOTE OF SECURITY HOLDERS....................... 13
ITEM 6. EXHIBITS AND REPORTS ON FORM 8-K ................................................................. 14
SIGNATURE ..................................................................................................................................... 15
CERTIFICATIONS............................................................................................................................. 16
INDEX TO EXHIBITS ........................................................................................................................ 18
-2-
3. FORM 10-Q
PACCAR Inc AND SUBSIDIARIES
PART I--FINANCIAL INFORMATION
ITEM 1. FINANCIAL STATEMENTS
Consolidated Statements of Income (Unaudited)
(Millions Except Per Share Amounts)
Three Months Ended March 31 2003 2002
TRUCK AND OTHER:
Net sales and revenues $ 1,803.2 $ 1,396.7
Cost of sales and revenues 1,577.1 1,255.8
Selling, general and administrative 88.8 88.0
Interest and other, net 2.4 2.6
1,668.3 1,346.4
Truck and Other Income Before Income Taxes 134.9 50.3
FINANCIAL SERVICES:
Revenues 113.6 104.8
Interest and other 61.2 59.7
Selling, general and administrative 17.6 16.8
Provision for losses on receivables 8.1 18.6
86.9 95.1
Financial Services Income Before Income Taxes 26.7 9.7
Investment income 10.7 9.4
Total Income Before Income Taxes 172.3 69.4
Income taxes 61.5 22.2
Net Income $ 110.8 $ 47.2
Net Income Per Share:
Basic $ .95 $ .41
Diluted .95 .41
Weighted Average Number of Common Shares Outstanding:
Basic 116.1 115.3
Diluted 116.7 116.2
Dividends declared per share $ .20 $ .20
See Notes to Consolidated Financial Statements.
-3-
4. FORM 10-Q
PACCAR Inc AND SUBSIDIARIES
Consolidated Balance Sheets March 31 December 31
ASSETS (Millions of Dollars) 2003 2002*
TRUCK AND OTHER: (Unaudited)
Current Assets
Cash and cash equivalents $ 842.4 $ 738.1
Trade and other receivables, net of allowance for losses 500.1 404.7
Marketable debt securities 480.9 535.3
Inventories 288.1 310.6
Deferred taxes and other current assets 105.6 112.9
Total Truck and Other Current Assets 2,217.1 2,101.6
Equipment on operating leases, net 465.8 447.3
Goodwill and other 237.3 222.9
Property, plant and equipment, net 816.7 818.4
Total Truck and Other Assets 3,736.9 3,590.2
FINANCIAL SERVICES:
Cash and cash equivalents 42.7 34.9
Finance and other receivables, net of allowance for losses 4,753.0 4,659.2
Equipment on operating leases, net 322.2 310.9
Other assets 121.7 107.3
Total Financial Services Assets 5,239.6 5,112.3
$ 8,976.5 $8,702.5
-4-
5. FORM 10-Q
PACCAR Inc AND SUBSIDIARIES
March 31 December 31
LIABILITIES AND STOCKHOLDERS' EQUITY 2003 2002*
TRUCK AND OTHER: (Unaudited)
Current Liabilities
Accounts payable and accrued expenses $ 1,237.9 $ 1,149.3
Current portion of long-term debt and commercial paper 17.7 37.7
Dividend payable 71.4
Total Truck and Other Current Liabilities 1,255.6 1,258.4
Long-term debt and commercial paper 36.4 33.9
Residual value guarantees and deferred revenues 534.7 516.4
Deferred taxes and other liabilities 322.8 289.9
Total Truck and Other Liabilities 2,149.5 2,098.6
FINANCIAL SERVICES:
Accounts payable, accrued expenses and other 121.2 125.9
Commercial paper and bank loans 2,037.8 2,009.8
Term debt 1,575.9 1,517.8
Deferred taxes and other liabilities 341.9 349.7
Total Financial Services Liabilities 4,076.8 4,003.2
STOCKHOLDERS' EQUITY
Preferred stock, no par value:
Authorized 1.0 million shares, none issued
Common stock, $1 par value: Authorized 200.0 million shares,
116.2 million shares issued and outstanding 116.2 115.9
Additional paid-in capital 555.1 545.8
Retained earnings 2,200.8 2,113.3
Accumulated other comprehensive loss (121.9) (174.3)
Total Stockholders' Equity 2,750.2 2,600.7
$ 8,976.5 $ 8,702.5
* The December 31 2002, consolidated balance sheet has been derived from audited financial
statements.
See Notes to Consolidated Financial Statements.
-5-
6. FORM 10-Q
PACCAR Inc AND SUBSIDIARIES
Condensed Consolidated Statements of Cash Flows (Unaudited)
(Millions of Dollars)
Three Months Ended March 31 2003 2002
NET CASH PROVIDED BY OPERATING ACTIVITIES $ 190.8 $ 149.0
INVESTING ACTIVITIES:
Finance receivables originated (374.0) (351.4)
Collections on finance receivables 456.2 451.0
Net increase in wholesale receivables (110.4) (19.8)
Marketable securities purchased (162.9) (176.0)
Marketable securities maturities and sales 215.4 231.1
Acquisition of property, plant and equipment (11.2) (7.7)
Acquisition of equipment for operating leases (44.5) (62.2)
Other 5.8 4.8
Net Cash (Used in) Provided by Investing Activities (25.6) 69.8
FINANCING ACTIVITIES:
Cash dividends paid (94.7) (42.3)
Stock option transactions 6.8 18.6
Net decrease in commercial paper and bank loans (45.5) (157.5)
Proceeds from long-term debt 198.5 156.4
Payments on long-term debt (140.7) (105.0)
Net Cash Used in Financing Activities (75.6) (129.8)
Effect of exchange rate changes on cash 22.5 (7.3)
Net Increase in Cash and Cash Equivalents 112.1 81.7
Cash and cash equivalents at beginning of period 773.0 655.2
Cash and cash equivalents at end of period $ 885.1 $ 736.9
See Notes to Consolidated Financial Statements.
-6-
7. FORM 10-Q
PACCAR Inc AND SUBSIDIARIES
Notes to Consolidated Financial Statements (Unaudited) (Millions, Except Per Share Amounts)
NOTE A—Basis of Presentation
The accompanying unaudited consolidated financial statements have been prepared in accordance
with the instructions to Form 10-Q and Article 10 of Regulation S-X. Accordingly, they do not include
all of the information and footnotes required by generally accepted accounting principles for complete
financial statements. In the opinion of management, all adjustments (consisting of normal recurring
accruals) considered necessary for a fair presentation have been included. Operating results for the
three month period ended March 31, 2003 are not necessarily indicative of the results that may be
expected for the year ended December 31, 2003. For further information, refer to the consolidated
financial statements and footnotes included in the Company's annual report on Form 10-K for the year
ended December 31, 2002.
On May 28, 2002, PACCAR paid a 50% stock dividend to stockholders. All 2002 share and per share
figures presented are adjusted for the effects of the stock dividend.
Accounting Change: Under provisions of FAS No. 148, Accounting for Stock Based Compensation-
Transition and Disclosure, effective January 1, 2003, PACCAR adopted prospectively the fair value
recognition provisions of FAS No. 123, Accounting for Stock-Based Compensation, for all new em-
ployee stock option awards. Under these provisions, expense is recognized for the estimated fair
value over the option vesting period, generally three years for the Company. The expense related to
stock-based employee compensation included in the determination of net income for the first quarter
of 2003 was less than that which would be recognized if the fair value method were applied to all
awards since the original effective date of FAS No. 123. Through the end of 2002, the Company used
the intrinsic value method of accounting for these awards. Under the intrinsic value method, when the
exercise price of option grants equals the market value of the underlying common stock at the date of
grant, no compensation expense is reflected in the Company’s net income. The following table
illustrates the effect on net income and earnings per share as if the fair value method had been
applied to all outstanding and unvested awards in each period.
Three Months Ended March 31 2003 2002
Net income, as reported $110.8 $ 47.2
Add: stock-based employee compensation expense included in reported
net income, net of related tax effects .5
Deduct: Total stock-based employee compensation expense determined
under fair value method for all awards, net of related tax effects (1.4) (1.4)
Pro forma net income $109.9 $ 45.8
Earnings per share:
Basic—as reported $ .95 $ .41
Basic—pro forma .95 .40
Diluted—as reported $ .95 $ .41
Diluted—pro forma .94 .39
-7-
8. FORM 10-Q
PACCAR Inc AND SUBSIDIARIES
Notes to Consolidated Financial Statements (Unaudited) (Millions of Dollars)
NOTE B—Inventories
March 31 December 31
2003 2002
Inventories at cost:
Finished products $ 220.3 $ 197.7
Work in process and raw materials 194.8 238.5
415.1 436.2
Less LIFO reserve (127.0) (125.6)
$ 288.1 $ 310.6
Under the LIFO method of accounting (used for approximately 40% of March 31, 2003 inventories),
an actual valuation can be made only at the end of each year based on year-end inventory levels and
costs. Accordingly, interim valuations are based on management's estimates of those year-end
amounts.
NOTE C—Product Support Liabilities
Product support liabilities consist of amounts accrued to meet product warranty obligations and
deferred revenue and accrued costs associated with optional extended warranty and repair and
maintenance contracts. PACCAR periodically assesses the adequacy of its recorded liabilities and
adjusts them as appropriate to reflect actual experience.
Changes in product support liabilities are summarized as follows:
Beginning balance, January 1, 2003 $ 273.4
Cost accruals and revenue deferrals 35.8
Payments and revenue recognized (42.4)
Translation 4.1
Ending balance, March 31, 2003 $ 270.9
-8-
9. FORM 10-Q
PACCAR Inc AND SUBSIDIARIES
Notes to Consolidated Financial Statements (Unaudited) (Millions, Except Share Amounts)
NOTE D—Stockholders' Equity
Comprehensive Income
The components of comprehensive income, net of any related tax, are as follows:
Three Months Ended March 31 2003 2002
Net income $ 110.8 $ 47.2
Other comprehensive income:
Net unrealized losses on securities (1.1) (1.8)
Minimum pension liability adjustments .2
Unrealized net gain on derivative contracts 5.4 15.4
Foreign currency translation adjustments 47.9 (12.3)
Net other comprehensive income 52.4 1.3
Total comprehensive income $ 163.2 $ 48.5
Foreign currency translation adjustments in both years primarily resulted from the change in the value
of the Euro relative to the U.S. dollar.
Accumulated Other Comprehensive Loss
Accumulated other comprehensive loss was comprised of the following:
March 31 December 31
2003 2002
Net unrealized gains on securities $ 6.3 $ 7.4
Minimum pension liability adjustments (20.1) (20.3)
Accumulated unrealized net loss on derivative contracts (34.3) (39.7)
Accumulated foreign currency translation adjustments (73.8) (121.7)
Net accumulated other comprehensive loss $(121.9) $(174.3)
Other Capital Stock Changes
On January 1, 2003, approximately 797,000 stock options previously granted to PACCAR employees
became exercisable. In the three months ended March 31, 2003, PACCAR issued 236,600 additional
common shares under terms of employee stock option and non-employee directors’ stock
compensation arrangements.
Diluted Earnings Per Share
The following table shows the additional shares added to weighted average basic shares outstanding
to calculate diluted earnings per share. These amounts primarily represent the dilutive effect of stock
options. Options outstanding considered antidilutive that have been excluded from the diluted
earnings per share calculation are shown separately.
Three Months Ended March 31 2003 2002
Additional shares 622,000 960,000
Excluded antidilutive shares 486,000 —
-9-
10. FORM 10-Q
PACCAR Inc AND SUBSIDIARIES
Notes to Consolidated Financial Statements (Unaudited) (Millions, Except Share Amounts)
NOTE E—Segment Information
Three Months Ended March 31 2003 2002
Net sales and revenues:
Truck
Total $ 1,815.4 $ 1,410.8
Less intersegment (26.6) (26.5)
External customers 1,788.8 1,384.3
All other 14.4 12.4
1,803.2 1,396.7
Financial Services 113.6 104.8
$ 1,916.8 $ 1,501.5
Income (loss) before income taxes:
Truck $ 138.6 $ 53.4
All other (3.7) (3.1)
134.9 50.3
Financial Services income before income taxes 26.7 9.7
Investment income 10.7 9.4
$ 172.3 $ 69.4
Included in “All other” is PACCAR’s industrial winch manufacturing business and other sales, income
and expense not attributable to a reportable segment, including a portion of corporate expense.
quot;All otherquot; income (loss) before taxes includes intercompany interest income on cash advances to the
Company's financial services subsidiaries. Interest charged to financial services amounted to $2.4 for
the three months ended March 31, 2003 compared to $2.2 for the three months ended March 31,
2002.
-10-
11. FORM 10-Q
PACCAR Inc AND SUBSIDIARIES
ITEM 2. MANAGEMENT'S DISCUSSION AND ANALYSIS OF RESULTS OF OPERATIONS AND
FINANCIAL CONDITION
RESULTS OF OPERATIONS:
PACCAR’s first quarter 2003 total net sales and revenues increased 28% to $1.92 billion
compared to the $1.50 billion reported for the first quarter in 2002. First quarter 2003 net
income of $110.8 million increased 135% from the $47.2 million earned in the first quarter
of 2002. Both the Truck and Financial Services segments, as discussed further below,
contributed to the improved financial results.
Truck segment net sales and revenues of $1.79 billion increased 29% in the first quarter of
2003 from $1.38 billion in the first quarter of 2002. Truck segment income before income
taxes of $138.6 million increased 160% compared to the $53.4 million recorded in the first
quarter of 2002.
Truck segment results in the first quarter of 2003 benefited from higher heavy-duty truck
production rates in all of the Company’s primary markets. Gross margins improved to
12.5% in the first quarter of 2003 from 10.1% in the first quarter of 2002 from increased
selling prices, greater utilization of factory capacity and factory operating efficiencies.
Selling, general and administrative expense as a percent of sales decreased to 4.9% from
6.3% as the Company continues to maintain cost controls despite higher sales levels. The
increase in first quarter 2003 sales included $125 million from a stronger euro versus the
U.S. dollar. The positive impact of the stronger euro on pretax income was $15 million.
North American heavy-duty truck industry orders were 32% lower in the first quarter of
2003 compared to the first quarter of 2002, due in part to orders received in March last year
to ensure production prior to the October 1, 2002 engine-emission changes. It is currently
anticipated that 2003 industry truck sales will be comparable to last year. In Europe, the
Company estimates a 5-10% reduction in industry truck sales compared to last year.
Financial Services segment revenues increased 8% to $113.6 million from $104.8 million
last year due to higher asset levels. Financial Services income before income taxes of
$26.7 million in the first quarter 2003 increased 175% compared to the $9.7 million earned
in the first quarter of 2002. The improvement is due to lower credit losses and higher
finance margins. The lower credit losses compared to first quarter 2002 reflect lower truck
repossessions and higher used truck prices. Results for the remainder of 2003 are
dependent on new business and numerous factors which impact the ability of customers to
make timely payments, including the recent volatility in fuel prices and higher insurance
costs.
PACCAR’s effective income tax rate for the first quarter of 2003 increased to 35.7% from
32.0% for the first quarter of 2002. The higher effective rate in 2003 was primarily due to a
higher proportion of income earned in the U.S. and a lower percentage of non-taxable
investment income.
-11-
12. FORM 10-Q
PACCAR Inc AND SUBSIDIARIES
LIQUIDITY AND CAPITAL RESOURCES:
PACCAR's Truck and Other working capital (current assets minus current liabilities)
increased $118 million during the first quarter of 2003 due to the positive operating results
during the period. Total Truck and Other cash and marketable debt securities increased
$50 million to $1.32 billion at the end of the first quarter of 2003.
The increase in net cash provided by operating activities in 2003 was due primarily to
higher net income in the current year. During the first quarter of 2003, the Company used
cash to pay dividends, reduce truck and other borrowings and make capital additions.
PACCAR’s largest financial services subsidiary, PACCAR Financial Corp., filed a shelf
registration in March of 2000 under the Securities Act of 1933 which provides for the
issuance of up to $2.5 billion of senior debt securities to the public. At the end of March
2003, $440 million of such securities remain available for issuance. The Company plans to
file a new shelf registration prior to the end of 2003.
Other information on liquidity and sources of capital as presented in the 2002 Annual
Report to Stockholders continues to be relevant.
FORWARD LOOKING STATEMENTS:
Certain information presented in this report contains forward-looking statements made
pursuant to the Private Securities Litigation Reform Act of 1995, which are subject to risks
and uncertainties that may affect actual results. Risks and uncertainties include, but are not
limited to: a significant decline in industry sales; competitive pressures; reduced market
share; reduced availability of or higher prices for fuel; increased safety, emissions, or other
regulations resulting in higher costs and/or sales restrictions; currency or commodity price
fluctuations; insufficient or under-utilization of manufacturing capacity; supplier interrup-
tions; increased warranty costs or litigation, or legislative and governmental regulations.
ITEM 3. QUANTITATIVE AND QUALITATIVE DISCLOSURES ABOUT MARKET RISK
There have been no material changes in the Company’s market risk during the three
months ended March 31, 2003. For additional information, refer to Item 7a as presented in
the 2002 Annual Report on Form 10-K.
-12-
13. FORM 10-Q
PACCAR Inc AND SUBSIDIARIES
ITEM 4. CONTROLS AND PROCEDURES
The Company’s principal executive officer and principal financial officer evaluated the Com-
pany’s disclosure controls and procedures (as defined in rule 13a-14(c) and 15d-14(c)
under the Securities Exchange Act of 1934, as amended) as of a date within 90 days
before the filing of this quarterly report (the Evaluation Date). Based on that evaluation, the
principal executive officer and principal financial officer of the Company concluded that, as
of the Evaluation Date, the disclosure controls and procedures in place at the Company
were adequate to ensure that information required to be disclosed by the Company,
including its consolidated subsidiaries, in reports that the Company files or submits under
the Exchange Act, is recorded, processed, summarized and reported on a timely basis in
accordance with applicable rules and regulations. There have been no significant changes
in the Company’s internal controls or in other factors that could significantly affect internal
controls subsequent to the Evaluation Date.
PART II--OTHER INFORMATION
For Items 1, 2, 3 and 5, there was no reportable information for any of the three months ended March
31, 2003.
ITEM 4. SUBMISSION OF MATTERS TO A VOTE OF SECURITY HOLDERS
(a) The annual meeting of stockholders was held on April 22, 2003.
(b) The following persons were elected to serve as directors:
Class II - Term Expiring in 2003
James C. Pigott
Mark C. Pigott
William G. Reed, Jr.
Other persons whose term of office as a director continued after the meeting:
Class III - Term Expiring in 2004
David K. Newbigging
Harry C. Stonecipher
Harold A. Wagner
Class I - Term Expiring in 2005
John M. Fluke, Jr.
Gerald Grinstein
David J. Hovind
Michael A. Tembreull
-13-
14. FORM 10-Q
PACCAR Inc AND SUBSIDIARIES
(c) Following is a brief description and vote count of all items voted upon at the annual
meeting:
ITEM NO. 1: ELECTION OF DIRECTORS
Directors were elected with the following vote:
Shares Voted Shares Broker
quot;Forquot; quot;Withheldquot; Nonvotes
James C. Pigott 92,441,907 13,033,936 _
Mark C. Pigott 104,252,758 1,223,085 _
William G. Reed, Jr. 104,133,253 1,342,590 _
ITEM NO. 2: STOCKHOLDER PROPOSAL REGARDING SHAREHOLDER RIGHTS
PLAN
Item No. 2 was not approved with the following vote:
Shares Voted Shares Voted Broker
quot;Forquot; “Against” Abstentions Nonvotes
40,923,160 55,238,859 1,049,427 8,264,397
ITEM NO. 3: STOCKHOLDER PROPOSAL REGARDING THE ANNUAL ELECTION OF
THE ENTIRE BOARD OF DIRECTORS
Item No. 3 was not approved with the following vote:
Shares Voted Shares Voted Broker
quot;Forquot; “Against” Abstentions Nonvotes
42,638,124 53,723,245 850,077 8,264,397
ITEM NO. 4: STOCKHOLDER PROPOSAL REGARDING THE SEPARATION OF THE
POSITIONS OF CHAIRMAN AND CHIEF EXECUTIVE OFFICER
Item No. 4 was not approved with the following vote:
Shares Voted Shares Voted Broker
quot;Forquot; “Against” Abstentions Nonvotes
25,231,140 71,044,629 935,677 8,264,397
(d) None
ITEM 6. EXHIBITS AND REPORTS ON FORM 8-K
(a) Any exhibits filed herewith are listed in the accompanying index to exhibits.
(b) No reports on Form 8-K have been filed for the quarter ended March 31, 2003.
-14-
15. FORM 10-Q
PACCAR Inc AND SUBSIDIARIES
SIGNATURE
Pursuant to the requirements of the Securities Exchange Act of 1934, the Registrant has duly caused
this report to be signed on its behalf by the undersigned thereunto duly authorized.
PACCAR Inc
(Registrant)
Date May 12, 2003 By /s/ R. E. Armstrong
R. E. Armstrong
Vice President and Controller
(Authorized Officer and Chief Accounting Officer)
-15-
16. FORM 10-Q
PACCAR Inc AND SUBSIDIARIES
CERTIFICATIONS
I, Mark C. Pigott, Chairman and Chief Executive Officer, certify that:
1. I have reviewed this quarterly report on Form 10-Q of PACCAR Inc;
2. Based on my knowledge, this quarterly report does not contain any untrue statement of a material
fact or omit to state a material fact necessary to make the statements made, in light of the
circumstances under which such statements were made, not misleading with respect to the period
covered by this quarterly report;
3. Based on my knowledge, the financial statements, and other financial information included in this
quarterly report, fairly present in all material respects the financial condition, results of operations
and cash flows of the registrant as of, and for, the periods presented in this quarterly report;
4. The registrant's other certifying officers and I are responsible for establishing and maintaining
disclosure controls and procedures (as defined in Exchange Act Rules 13a-14 and 15d-14) for the
registrant and we have:
a) designed such disclosure controls and procedures to ensure that material information relating to
the registrant, including its consolidated subsidiaries, is made known to us by others within
those entities, particularly during the period in which this quarterly report is being prepared;
b) evaluated the effectiveness of the registrant's disclosure controls and procedures as of a date
within 90 days prior to the filing date of this quarterly report (the quot;Evaluation Datequot;); and
c) presented in this quarterly report our conclusions about the effectiveness of the disclosure
controls and procedures based on our evaluation as of the Evaluation Date;
5. The registrant's other certifying officers and I have disclosed, based on our most recent evaluation,
to the registrant's auditors and the audit committee of registrant's board of directors (or persons
performing the equivalent functions):
a) all significant deficiencies in the design or operation of internal controls which could adversely
affect the registrant's ability to record, process, summarize and report financial data and have
identified for the registrant's auditors any material weaknesses in internal controls; and
b) any fraud, whether or not material, that involves management or other employees who have a
significant role in the registrant's internal controls; and
6. The registrant's other certifying officers and I have indicated in this quarterly report whether or not
there were significant changes in internal controls or in other factors that could significantly affect
internal controls subsequent to the date of our most recent evaluation, including any corrective
actions with regard to significant deficiencies and material weaknesses.
Date May 12, 2003
/s/ Mark C. Pigott
Mark C. Pigott
Chairman and Chief Executive Officer
(Principal Executive Officer)
-16-
17. FORM 10-Q
PACCAR Inc AND SUBSIDIARIES
I, Michael A. Tembreull, Vice Chairman, certify that:
1. I have reviewed this quarterly report on Form 10-Q of PACCAR Inc;
2. Based on my knowledge, this quarterly report does not contain any untrue statement of a material
fact or omit to state a material fact necessary to make the statements made, in light of the
circumstances under which such statements were made, not misleading with respect to the period
covered by this quarterly report;
3. Based on my knowledge, the financial statements, and other financial information included in this
quarterly report, fairly present in all material respects the financial condition, results of operations
and cash flows of the registrant as of, and for, the periods presented in this quarterly report;
4. The registrant's other certifying officers and I are responsible for establishing and maintaining
disclosure controls and procedures (as defined in Exchange Act Rules 13a-14 and 15d-14) for the
registrant and we have:
a) designed such disclosure controls and procedures to ensure that material information relating to
the registrant, including its consolidated subsidiaries, is made known to us by others within
those entities, particularly during the period in which this quarterly report is being prepared;
b) evaluated the effectiveness of the registrant's disclosure controls and procedures as of a date
within 90 days prior to the filing date of this quarterly report (the quot;Evaluation Datequot;); and
c) presented in this quarterly report our conclusions about the effectiveness of the disclosure
controls and procedures based on our evaluation as of the Evaluation Date;
5. The registrant's other certifying officers and I have disclosed, based on our most recent evaluation,
to the registrant's auditors and the audit committee of registrant's board of directors (or persons
performing the equivalent functions):
a) all significant deficiencies in the design or operation of internal controls which could adversely
affect the registrant's ability to record, process, summarize and report financial data and have
identified for the registrant's auditors any material weaknesses in internal controls; and
b) any fraud, whether or not material, that involves management or other employees who have a
significant role in the registrant's internal controls; and
6. The registrant's other certifying officers and I have indicated in this quarterly report whether or not
there were significant changes in internal controls or in other factors that could significantly affect
internal controls subsequent to the date of our most recent evaluation, including any corrective
actions with regard to significant deficiencies and material weaknesses.
Date May 12, 2003
/s/ Michael A. Tembreull
Michael A. Tembreull
Vice Chairman
(Principal Financial Officer)
-17-
18. FORM 10-Q
PACCAR Inc AND SUBSIDIARIES
INDEX TO EXHIBITS
Exhibit (in order of assigned index numbers)
3 Articles of incorporation and bylaws:
(a) PACCAR Inc Certificate of Incorporation, as amended to April 29, 1997 (incorporated by
reference to the Quarterly Report on Form 10-Q for the quarter ended March 31, 1997).
(b) PACCAR Inc Bylaws, as amended to April 26, 1994 (incorporated by reference to the
Quarterly Report on Form 10-Q for the quarter ended March 31, 1994), and Bylaw Article
III, as amended to July 10, 2001 (incorporated by reference to the Quarterly Report on
Form 10-Q for the quarter ended June 30, 2001).
4 Instruments defining the rights of security holders, including indentures:
(a) Rights agreement dated as of December 10, 1998 between PACCAR Inc and First Chicago
Trust Company of New York setting forth the terms of the Series A Junior Participating
Preferred Stock, no par value per share (incorporated by reference to Exhibit 4.1 of the
Current Report on Form 8-K of PACCAR Inc dated December 21, 1998).
(b) Amendment Number 1 to rights agreement dated as of December 10, 1998 between
PACCAR Inc and First Chicago Trust Company of New York appointing Wells Fargo Bank
N.A. as successor rights agent, effective as of the close of business September 15, 2000
(incorporated by reference to Exhibit (4)(b) of the Quarterly Report on Form 10-Q for the
quarter ended September 30, 2000).
(c) Indenture for Senior Debt Securities dated as of December 1, 1983, and first Supplemental
Indenture dated as of June 19, 1989, between PACCAR Financial Corp. and Citibank,
N.A., Trustee (incorporated by reference to Exhibit 4.1 of the Annual Report on Form 10-K
of PACCAR Financial Corp. dated March 26, 1984, File Number 0-12553 and Exhibit 4.2
to PACCAR Financial Corp.'s registration statement on Form S-3 dated June 23, 1989,
Registration Number 33-29434).
(d) Forms of Medium-Term Note, Series I (incorporated by reference to Exhibits 4.2A and
4.2B to PACCAR Financial Corp.'s Registration Statement on Form S-3 dated September
10, 1998, Registration Number 333-63153).
Form of Letter of Representation among PACCAR Financial Corp., Citibank, N.A. and the
Depository Trust Company, Series I (incorporated by reference to Exhibit 4.3 to PACCAR
Financial Corp.'s Registration Statement on Form S-3 dated September 10, 1998, Regis-
tration Number 333-63153).
-18-
19. FORM 10-Q
PACCAR Inc AND SUBSIDIARIES
INDEX TO EXHIBITS
Exhibit (in order of assigned index numbers)
(e) Forms of Medium-Term Note, Series J (incorporated by reference to Exhibits 4.2A and
4.2B to PACCAR Financial Corp.'s Registration Statement on Form S-3 dated March 2,
2000, Registration Number 333-31502).
Form of Letter of Representation among PACCAR Financial Corp., Citibank, N.A. and the
Depository Trust Company, Series J (incorporated by reference to Exhibit 4.3 to PACCAR
Financial Corp.'s Registration Statement on Form S-3 dated March 2, 2000, Registration
Number 333-31502)
10 Material contracts:
(a) PACCAR Inc Incentive Compensation Plan (incorporated by reference to Exhibit (10)(a) of
the Annual Report on Form 10-K for the year ended December 31, 1980).
(b) Amended and Restated Supplemental Retirement Plan (incorporated by reference to
Exhibit (10)(b) of the Quarterly Report on Form 10-Q for the quarter ended September 30,
2000).
(c) Amended and Restated Deferred Incentive Compensation Plan (incorporated by reference
to Exhibit (10)(g) of the Quarterly Report on Form 10-Q for the quarter ended September
30, 2000).
(d) PACCAR Inc Restricted Stock and Deferred Compensation Plan for Non-employee Di-
rectors (incorporated by reference to Appendix A of the 2000 Proxy Statement, dated
March 16, 2000).
(e) PACCAR Inc Long Term Incentive Plan (incorporated by reference to Appendix A of the
2002 Proxy Statement, dated March 19, 2002).
(f) PACCAR Inc Senior Executive Yearly Incentive Compensation Plan (incorporated by
reference to Appendix B of the 2002 Proxy Statement, dated March 19, 2002).
99 Additional Exhibits:
(a) Certification pursuant to section 906 of the Sarbanes-Oxley Act of 2002 (18 U.S.C. section
1350).
(b) Certification pursuant to section 906 of the Sarbanes-Oxley Act of 2002 (18 U.S.C. section
1350).
-19-
20. EXHIBIT 99 (a)
CERTIFICATION PURSUANT TO SECTION 906
OF THE SARBANES-OXLEY ACT OF 2002 (18 U.S.C. SECTION 1350)
In connection with the Quarterly Report of PACCAR Inc (the “Company”) on Form 10-Q for the quarter
ended March 31, 2003 as filed with the Securities and Exchange Commission on the date hereof (the
“Report”), I, Mark C. Pigott, Chairman and Chief Executive Officer of the Company, certify, pursuant to
section 906 of the Sarbanes-Oxley Act of 2002 (18 U.S.C. section 1350), that to the best of my
knowledge and belief:
(1) The Report fully complies with the requirements of section 13(a) or 15(d) of the Securities
Exchange Act of 1934; and
(2) The information contained in the Report fairly presents, in all material respects, the financial
condition and results of operations of the Company.
/s/ Mark C. Pigott
Mark C. Pigott
Chairman and
Chief Executive Officer
PACCAR Inc
May 12, 2003
A signed original of this written statement required by Section 906 has been provided to the Company
and will be retained by the Company and furnished to the Securities and Exchange Commission or its
staff upon request.
21. EXHIBIT 99 (b)
CERTIFICATION PURSUANT TO SECTION 906
OF THE SARBANES-OXLEY ACT OF 2002 (18 U.S.C. SECTION 1350)
In connection with the Quarterly Report of PACCAR Inc (the “Company”) on Form 10-Q for the quarter
ended March 31, 2003 as filed with the Securities and Exchange Commission on the date hereof (the
“Report”), I, Michael A. Tembreull, Vice Chairman of the Company, certify, pursuant to section 906 of
the Sarbanes-Oxley Act of 2002 (18 U.S.C. section 1350), that to the best of my knowledge and
belief:
(1) The Report fully complies with the requirements of section 13(a) or 15(d) of the Securities
Exchange Act of 1934; and
(2) The information contained in the Report fairly presents, in all material respects, the financial
condition and results of operations of the Company.
/s/ Michael A. Tembreull
Michael A. Tembreull
Vice Chairman
PACCAR Inc
(chief financial officer)
May 12, 2003
A signed original of this written statement required by Section 906 has been provided to the Company
and will be retained by the Company and furnished to the Securities and Exchange Commission or its
staff upon request.