SlideShare a Scribd company logo
1 of 24
Download to read offline
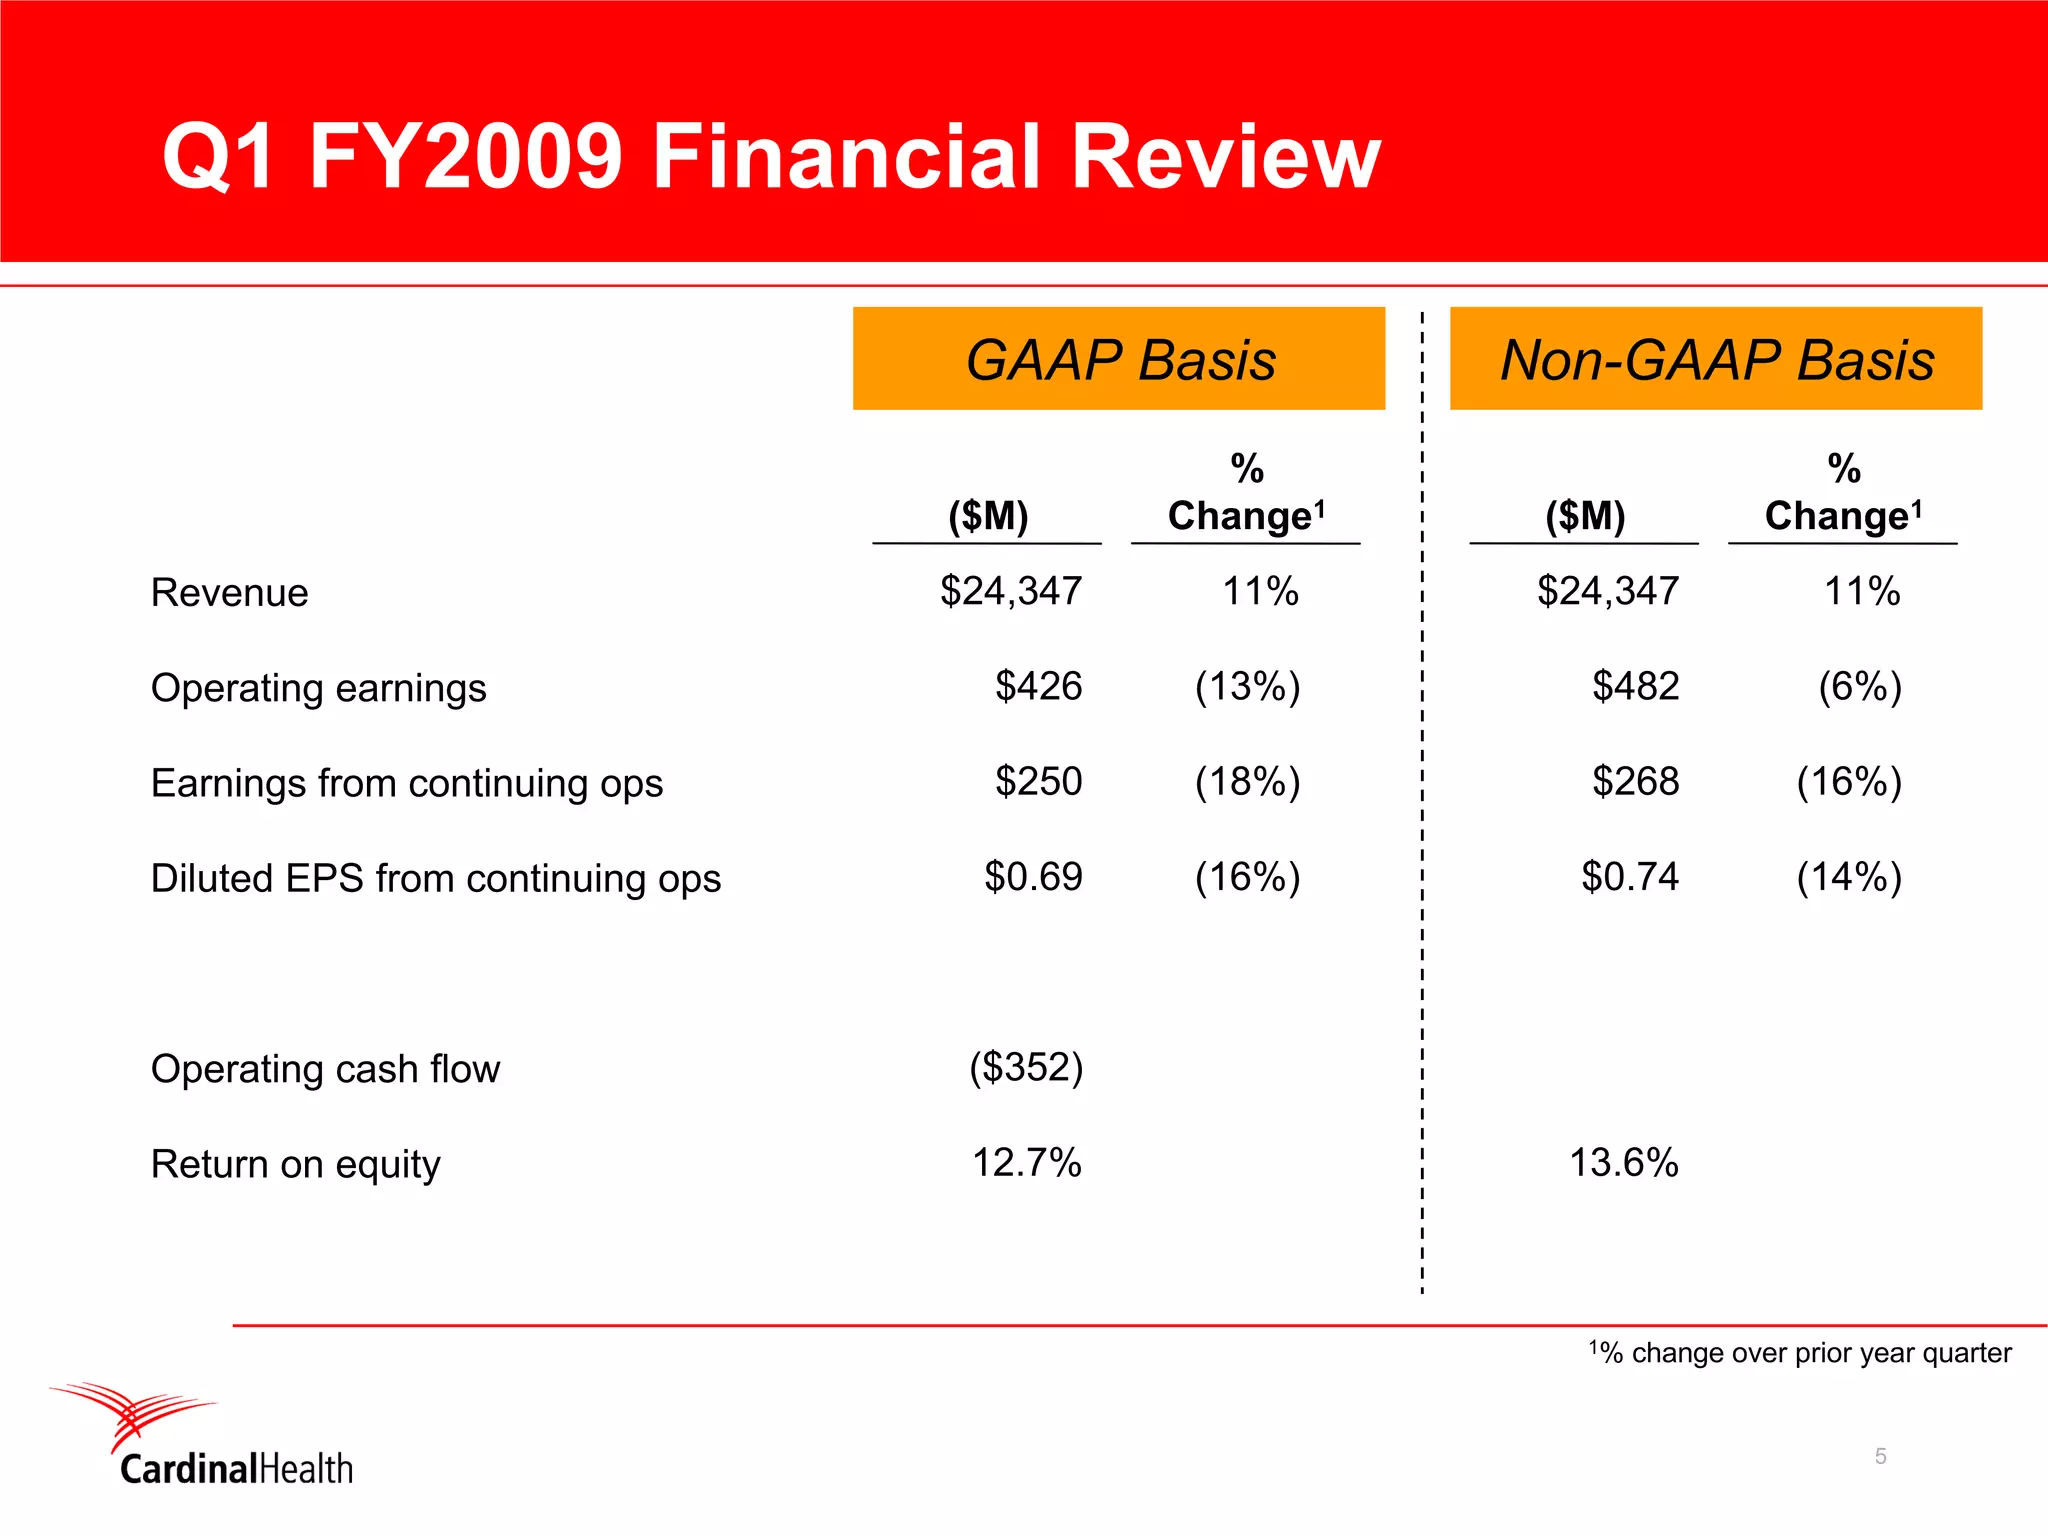
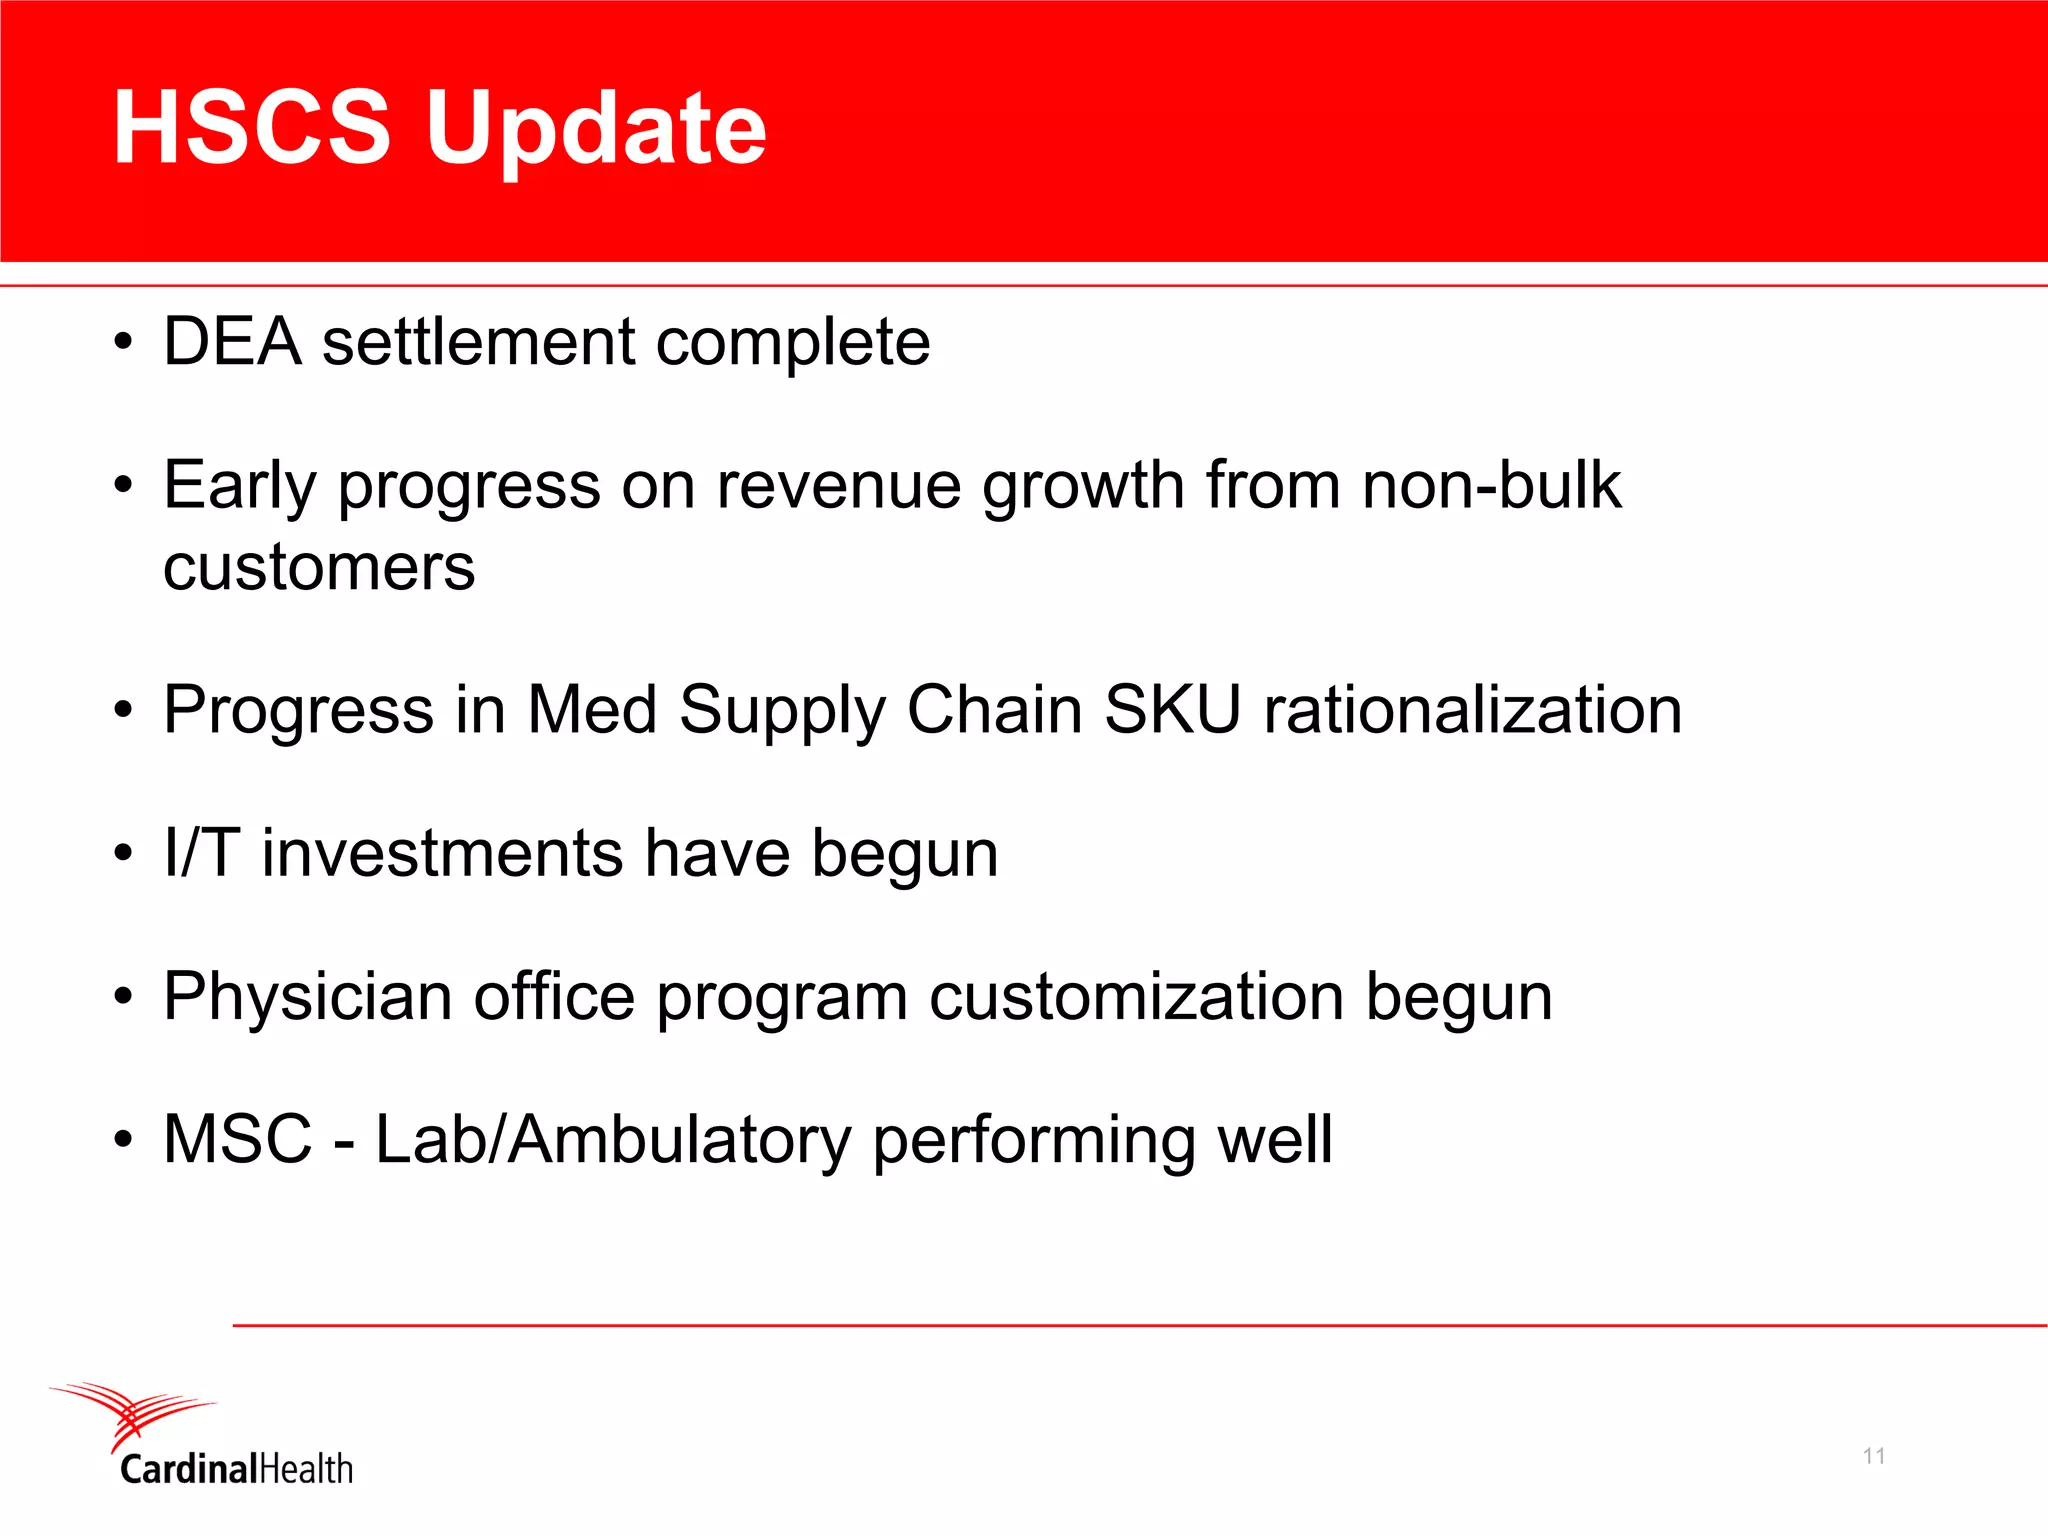
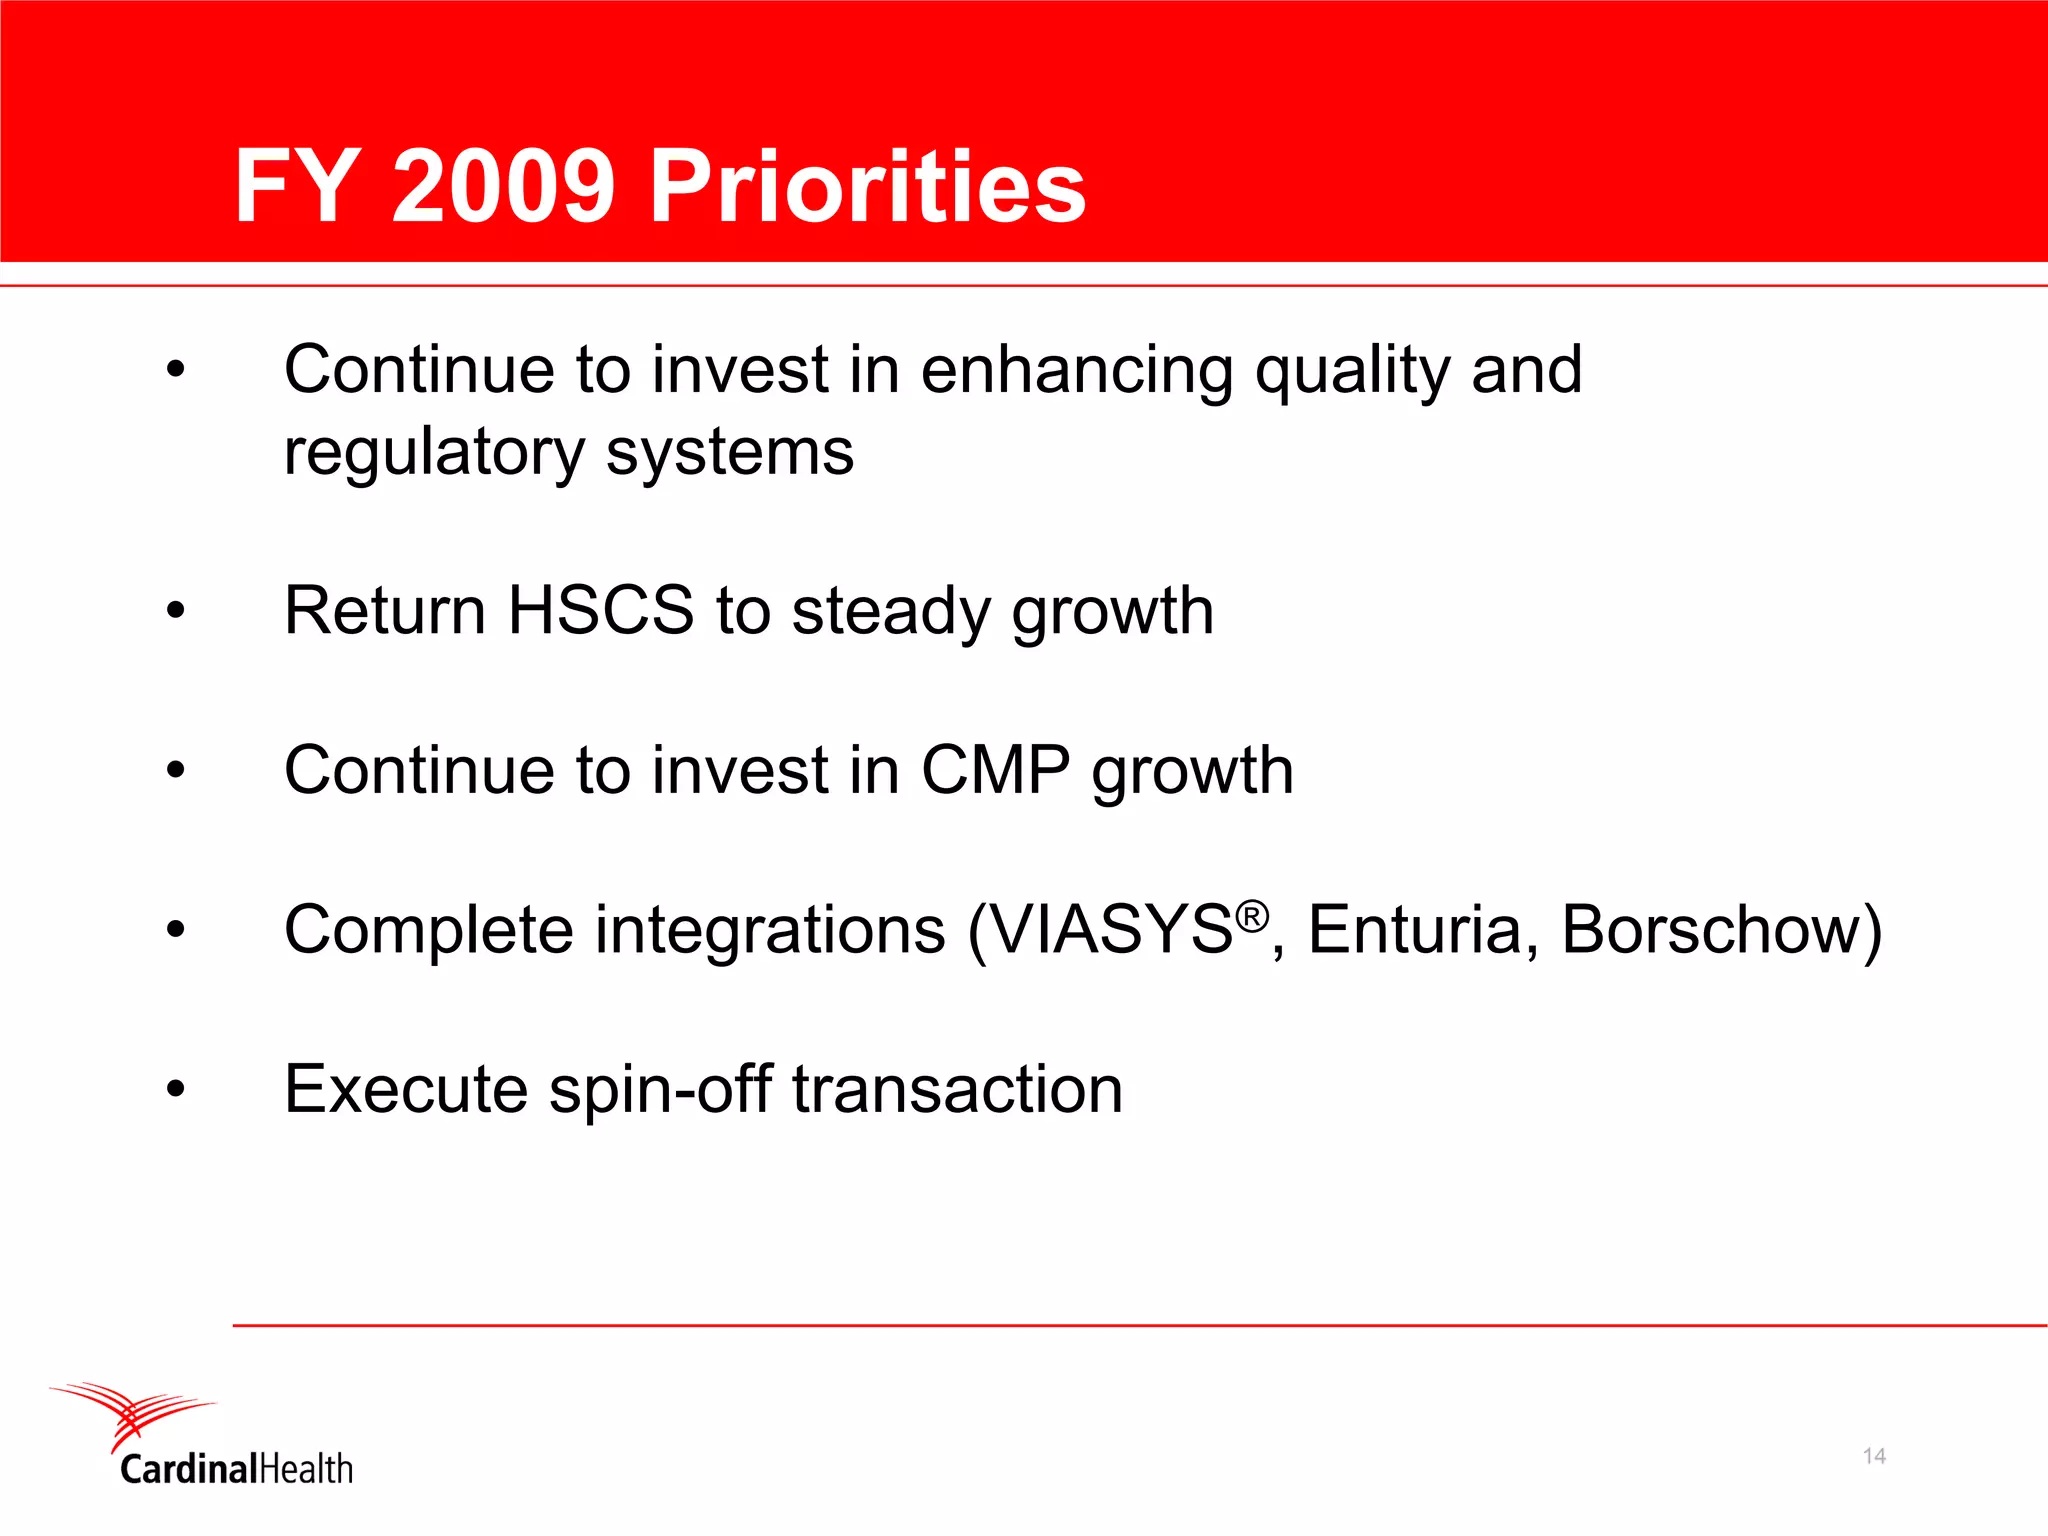
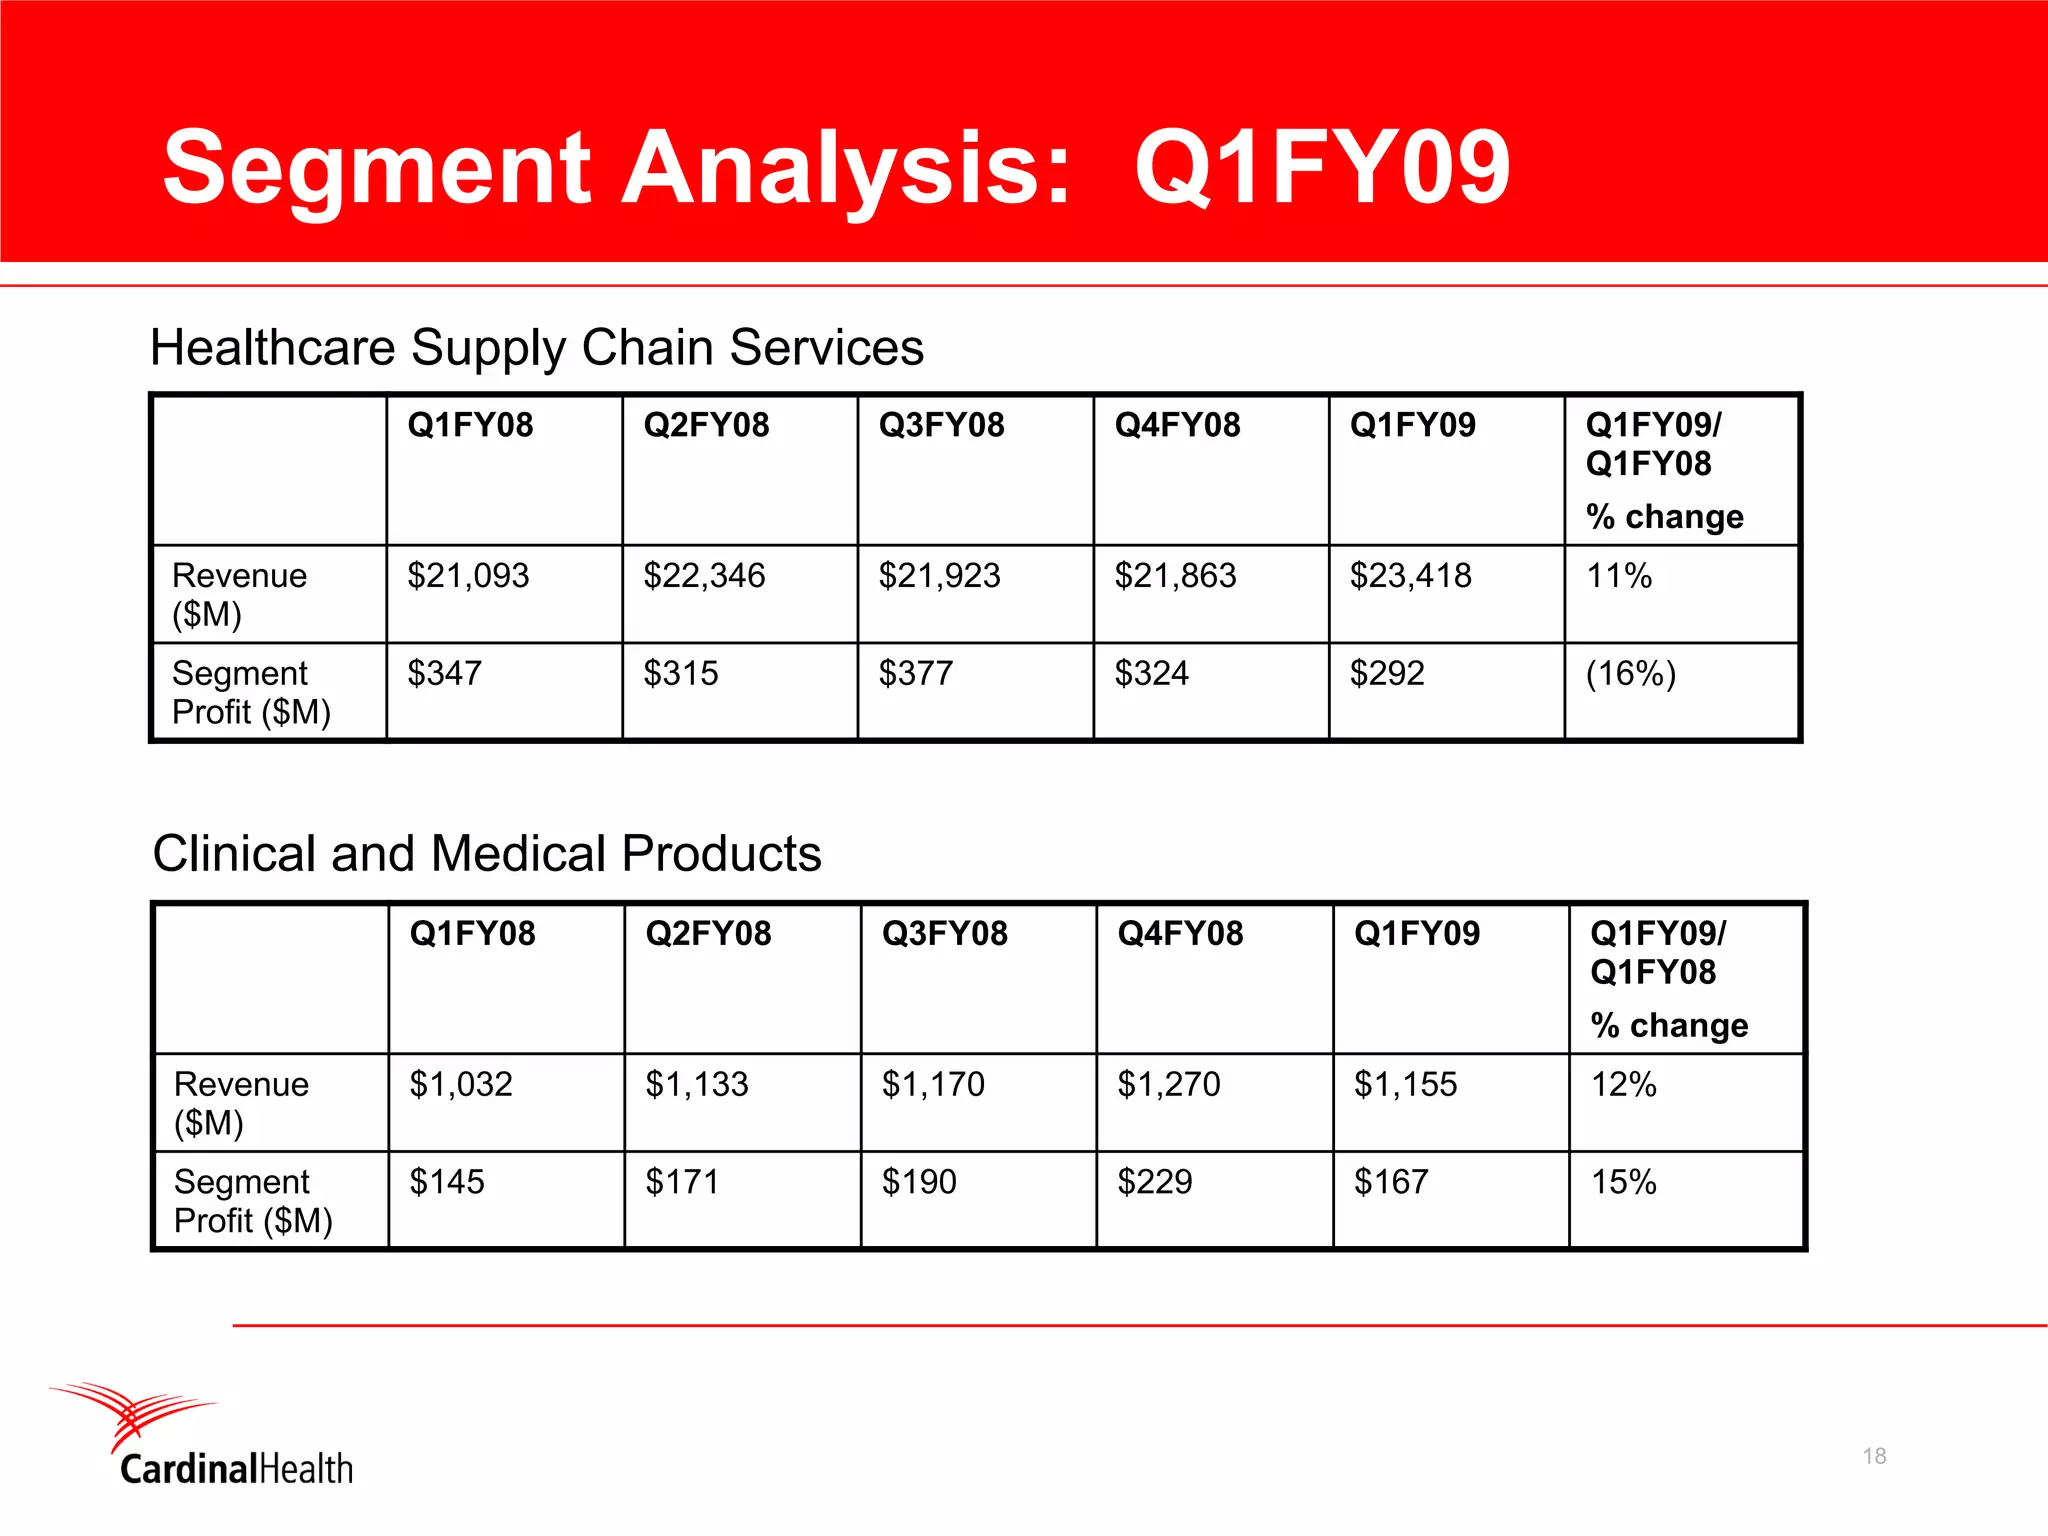
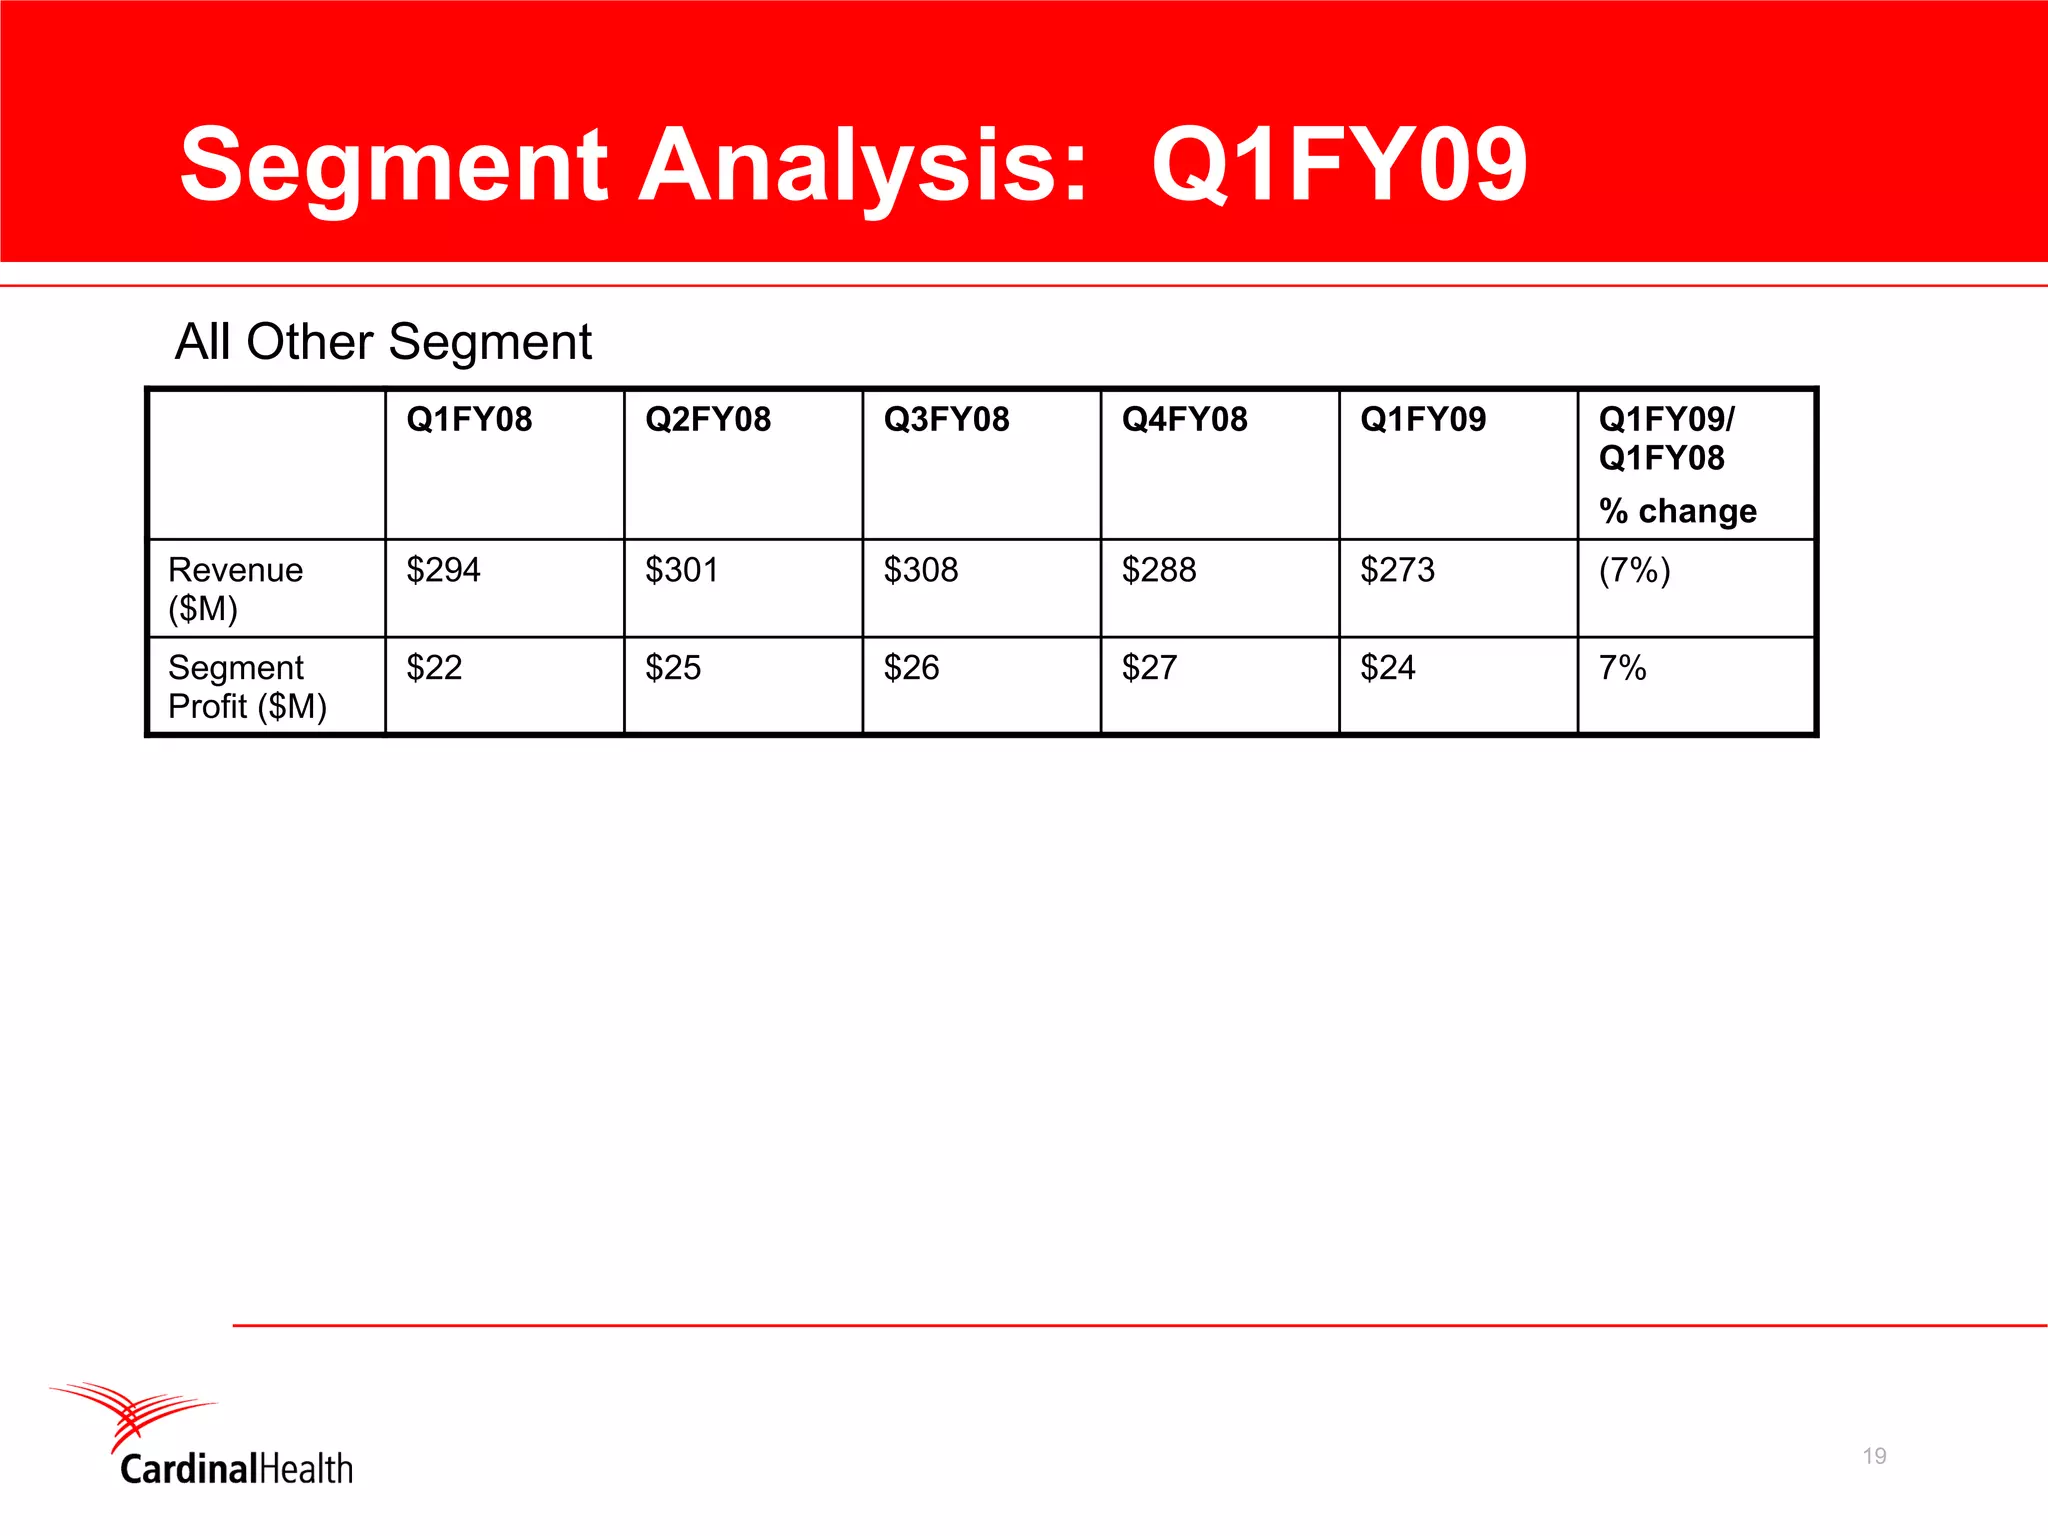
Q1FY2009
                    Investor/Analyst Call


Essential to care


                               October 29, 2008
Forward-looking statements and
     GAAP reconciliation
This presentation contains forward-looking statements addressing expectations, prospects, estimates and other matters that are
dependent upon future events or developments. These matters are subject to risks and uncertainties that could cause actual
results to differ materially from those projected, anticipated or implied. The most significant of these uncertainties are described in
Cardinal Health's Form 10-K, Form 10-Q and Form 8-K reports (including all amendments to those reports) and exhibits to those
reports, and include (but are not limited to) the following: uncertainties regarding the planned spin-off of the clinical and medical
products businesses as a new stand-alone entity, including the timing and terms of any such spin-off and whether such spin-off will
be completed, and uncertainties regarding the impact of the planned spin-off on Cardinal Health, the new clinical and medical
products company and the potential market for their respective securities; competitive pressures in Cardinal Health's various lines
of business; the loss of one or more key customer or supplier relationships or changes to the terms of those relationships;
uncertainties relating to timing of generic and branded pharmaceutical introductions and the frequency or rate of branded
pharmaceutical price appreciation or generic pharmaceutical price deflation; changes in the distribution patterns or reimbursement
rates for health-care products and/or services; the results, consequences, effects or timing of any inquiry or investigation by any
regulatory authority or any legal or administrative proceedings; future actions of regulatory bodies or government authorities relating
to Cardinal Health's manufacturing or sale of products and other costs or claims that could arise from its manufacturing,
compounding or repackaging operations or from its other services; the costs, difficulties and uncertainties related to the integration
of acquired businesses; uncertainties related to the recent disruptions in the financial markets, including uncertainties related to the
availability and/or cost of credit and the impact of the financial market disruptions on Cardinal Health’s customers and vendors; and
conditions in the pharmaceutical market and general economic and market conditions. This presentation reflects management’s
views as of October 29, 2008. Except to the extent required by applicable law, Cardinal Health undertakes no obligation to update
or revise any forward-looking statement. In addition, this presentation includes non-GAAP financial measures. Cardinal Health
provides definitions and reconciling information at the end of this presentation and on its investor relations page at
www.cardinalhealth.com. A transcript of the conference call will be available on the investor relations page at
www.cardinalhealth.com


                                                                                                                                2
Agenda
Opening remarks      Kerry Clark
                     Chairman and Chief Executive Officer

Financial overview   Jeff Henderson
                     Chief Financial Officer

HSCS comments        George Barrett
                     Vice Chairman and CEO
                     Healthcare Supply Chain Services

CMP comments         Dave Schlotterbeck
                     Vice Chairman and CEO
                     Clinical and Medical Products

Q&A


                                                            3
Q1 FY2009 Results


                    4
Q1 FY2009 Financial Review

                                   GAAP Basis         Non-GAAP Basis
                                              %                           %
                                            Change1                     Change1
                                  ($M)                 ($M)
                                  $24,347     11%      $24,347               11%
Revenue

                                    $426     (13%)       $482               (6%)
Operating earnings

                                    $250     (18%)       $268             (16%)
Earnings from continuing ops

                                    $0.69    (16%)       $0.74            (14%)
Diluted EPS from continuing ops


                                   ($352)
Operating cash flow

                                   12.7%                13.6%
Return on equity


                                                         1%   change over prior year quarter


                                                                                 5
Q1 FY2009 Operating Earnings and EPS
                                        Q1 FY 2009                                          Q1 FY 2008
                                              Diluted EPS from                                    Diluted EPS from
                               Operating          Continuing                       Operating          Continuing
                             Earnings ($M)        Operations                     Earnings ($M)        Operations


GAAP Consolidated                  $426                     $0.69                      $490                     $0.82


Special Items                       $52                     $0.10                       $23                     $0.04
Impairments,
(gain)/loss on sale of
assets and other, net               $4                      ($0.05)                      --                         --
Non-GAAP
Consolidated                       $482                     $0.74                      $512                     $0.86
  • Going forward, costs associated with the spin-off and the separation of the two companies will be
    identified separately
        –   A significant portion of the incremental costs that will be incurred will be classified as special items in
            accordance with company practices.
        –   The total costs incurred, including special items, in Q1FY09 related to the spin-off were less than $1M.


                                                                                                                          6
Healthcare Supply Chain Services
    Business Analysis

                                                                            Q1 FY09                       Q1 FY08
                                                                             ($M)                          ($M)                           % Change
Revenue                                                                           23,418                        21,093                      11%
Segment Profit                                                                          292                           347                  (16%)

Highlights:
• Revenue up 11% on growth in pharma and medical supply chain business
• Revenue from bulk1 customers up 20% on increased volumes from existing customers and
  customer wins
• Revenue from non-bulk2 customers up 4%, driven by growth in retail chain and hospital markets
• Segment profit down 16%, driven by pharma customer repricings, controlled substance anti-
  diversion impact and branded price inflation, partially offset by revenue growth and increased
  profit dollars from generic products
• Increase in IT investments has begun

                 1Bulk customers consist of Healthcare Supply Chain Services customers to which the segment distributes pharmaceutical,

                 radiopharmaceutical and over-the-counter health care products to the customers’ centralized warehouse operations and
                 mail order businesses
                 2Non-bulk customers consist of Healthcare Supply Chain Services customers to which the segment distributes
                                                                                                                                                   7
                 pharmaceutical, radiopharmaceutical and over-the-counter health care products other than bulk customers
Clinical and Medical Products
    Business Analysis

                                                   Q1 FY09           Q1 FY08
                                                    ($M)              ($M)          % Change
Revenue                                                 1,155             1,032         12%
Segment Profit                                             167              145         15%


Highlights:
• Segment revenue up 12% over prior year on Pyxis revenue, growth in international, and the Enturia
  acquisition
• Segment profit up 15% on the Enturia acquisition and organic growth, dampened in part by the
  increased cost of commodities
• VIASYS® integration continues on track; Enturia integration going very well
• Increase in R&D investment has begun


                                                                                                 8
FY09 Financial Goals

                                 October 29, 2008

Total revenue growth:
                                           6-7%


Non-GAAP EPS1:                             $3.80 - $3.95
                                                    Revenue                       Profit
Segment                                             Growth                       Growth

Healthcare Supply Chain Services (HSCS)               >6%                      Flat to (5%)


Clinical and Medical Products (CMP)                  >10%                         >20%


                              1 Non-GAAP   diluted earnings per share from continuing operations
                                                                                                   9
FY09 Assumptions Update

 •   Capital deployment
      – Share repurchases to no more than offset equity compensation issuances
      – Continue regular $0.14 quarterly dividend until spin-off is completed
 •   Portfolio rationalization/review
      – MedSystems sale closed 8/29/08
      – Tecomet sale closed 9/26/08
      – Review of MSI and Pharmacy Services ongoing
 •   Non-GAAP effective tax rate of ~34% for the year, with Q2 rate close to Q1
 •   Interest and other slightly above $200M for the year; Q2 slightly less than Q1
 •   Special items and/or other expenses / charges related to spin-off not included in
     guidance
      – Anticipate a significant portion of costs related to spin-off may be classified as special
        items in accordance with company practices


                                                                                             10
HSCS Update
• DEA settlement complete

• Early progress on revenue growth from non-bulk
  customers

• Progress in Med Supply Chain SKU rationalization

• I/T investments have begun

• Physician office program customization begun

• MSC - Lab/Ambulatory performing well


                                                     11
CMP Update
• Q1 results solid
   – Strong customer relationships in uncertain economic
      environment
   – No change in competitive landscape
• Progress with strategic investments
   – MedMined™
   – Pyxis® supply
• Strong annuity stream with disposables
• Product remediation on track for calendar year-end
  completion
• Continue to invest, increasing R&D as % of sales

                                                           12
Summary


          13
FY 2009 Priorities
•    Continue to invest in enhancing quality and
     regulatory systems

•    Return HSCS to steady growth

•    Continue to invest in CMP growth

•    Complete integrations (VIASYS®, Enturia, Borschow)

•    Execute spin-off transaction


                                                      14
Q&A
Q1FY09 Trailing Five Quarters


                                17
Segment Analysis: Q1FY09
Healthcare Supply Chain Services
               Q1FY08    Q2FY08    Q3FY08    Q4FY08    Q1FY09    Q1FY09/
                                                                 Q1FY08
                                                                 % change
Revenue        $21,093   $22,346   $21,923   $21,863   $23,418   11%
($M)
Segment        $347      $315      $377      $324      $292      (16%)
Profit ($M)


Clinical and Medical Products
               Q1FY08    Q2FY08    Q3FY08    Q4FY08    Q1FY09    Q1FY09/
                                                                 Q1FY08
                                                                 % change
 Revenue       $1,032    $1,133    $1,170    $1,270    $1,155    12%
 ($M)
 Segment       $145      $171      $190      $229      $167      15%
 Profit ($M)


                                                                            18
Segment Analysis: Q1FY09
All Other Segment
              Q1FY08   Q2FY08   Q3FY08   Q4FY08   Q1FY09   Q1FY09/
                                                           Q1FY08
                                                           % change
Revenue       $294     $301     $308     $288     $273     (7%)
($M)
Segment       $22      $25      $26      $27      $24      7%
Profit ($M)


                                                                      19
GAAP to Non-GAAP
Reconciliation Statements


                            20
CARDINAL HEALTH, INC. AND SUBSIDIARIES
                                            GAAP / NON-GAAP RECONCILIATION


                                                                              First Quarter 2009


                                                                                         Impairments,
                                                                                        (Gain)/Loss on
                                                                                        Sale of Assets
                                                               GAAP     Special Items   and Other, Net   Non-GAAP
(in millions, except per Common Share amounts)


Operating Earnings
Amount                                                         $426         $52               $4           $482
Growth Rate                                                    (13)%                                       (6)%

Provision for Income Taxes                                     $114         $17              $21           $152

Earnings from Continuing Operations
                                                               $250         $35              ($17)        $268
Amount
Growth Rate                                                    (18)%                                      (16)%

Diluted EPS from Continuing Operations
Amount                                                         $0.69       $0.10            ($0.05)       $0.74
                                                               (16)%                                      (14)%
Growth Rate


                                                                              First Quarter 2008


                                                                                         Impairments,
                                                                                        (Gain)/Loss on
                                                                                        Sale of Assets
                                                               GAAP     Special Items   and Other, Net   Non-GAAP


Operating Earnings
Amount                                                         $490         $23                -           $512
Growth Rate                                                     9%                                          8%

Provision for Income Taxes                                     $144          $8                -           $151

Earnings from Continuing Operations
Amount                                                         $303         $15                -           $318
Growth Rate                                                     4%                                          3%

Diluted EPS from Continuing Operations
Amount                                                          $0.82      $0.04               -          $0.86
Growth Rate                                                     15%                                        15%


                                                                                                                    21
The sum of the components may not equal the total due to rounding
22
CARDINAL HEALTH, INC. AND SUBSIDIARIES
                                         GAAP / NON-GAAP RECONCILIATION


                                                                                               First Quarter
    (in millions)                                                                          2009             2008


    GAAP Effective Tax Rate from Continuing Operations                                        31.4%             32.2%


    Non-GAAP Effective Tax Rate from Continuing Operations
                                                                                      $       363.9
    Earnings before income taxes and discontinued operations                                            $       446.9
    Special items                                                                              52.4              22.5
                                                                                                3.6
    Impairments, (gain)/loss on sale of assets and other, net                                                    (0.2)
                                                                                      $       419.9
     Adjusted earnings before income taxes and discontinued operations                                  $       469.2

                                                                                      $       114.1
    Provision for income taxes                                                                          $       143.7
                                                                                               17.1
    Special items tax benefit                                                                                     7.7
    Impairments, (gain)/loss on sale of assets and other, net, tax impact                      20.9              (0.1)
                                                                                      $       152.1
     Adjusted provision for income taxes                                                                $       151.3

    Non-GAAP effective tax rate from continuing operations 1                                  36.2%             32.2%


                                                                                               First Quarter
                                                                                           2009             2008


    Debt to Total Capital                                                                       32%                35%

    Net Debt to Capital
    Current portion of long-term obligations and other short-term borrowings          $       166.5     $        386.8
    Long-term obligations, less current portion and other short-term borrowings             3,597.0            3,347.5
     Debt                                                                             $     3,763.5     $      3,734.3
    Cash and equivalents                                                                     (672.2)          (1,289.6)
     Net debt                                                                         $     3,091.3     $      2,444.7
    Total shareholders' equity                                                        $     7,918.1     $      7,068.2
    Capital                                                                           $    11,009.4     $      9,512.9
     Net debt to capital                                                                        28%                26%


    Forward-Looking Non-GAAP Financial Measures
    The Company presents non-GAAP earnings from continuing operations and non-GAAP effective tax rate from
    continuing operations (and presentations derived from these financial measures) on a forward-looking basis. The most
    directly comparable forward-looking GAAP measures are earnings from continuing operations and effective tax rate
    from continuing operations. The Company is unable to provide a quantitative reconciliation of these forward-looking
    non-GAAP measures to the most comparable forward-looking GAAP measures because the Company cannot reliably
    forecast special items and impairments, (gain)/loss on sale of assets and other, net, which are difficult to predict and
    estimate and are primarily dependent on future events. Please note that the unavailable reconciling items could
    significantly impact the Company’s future financial results.
                                                                                                                               23
    See definitions for explanation of changes in method of calculating these financial measures from prior quarters.
1
CARDINAL HEALTH, INC. AND SUBSIDIARIES
                                                    DEFINITIONS

    GAAP
    Debt: long-term obligations plus short-term borrowings
    Debt to Total Capital: debt divided by (debt plus total shareholders' equity)
    Diluted EPS from Continuing Operations: earnings from continuing operations divided by diluted weighted average
    shares outstanding
    Effective Tax Rate from Continuing Operations: provision for income taxes divided by earnings before income taxes
    and discontinued operations
    Operating Cash Flow: net cash provided by / (used in) operating activities from continuing operations
    Segment Profit: segment revenue minus (segment cost of products sold and segment selling, general and
    administrative expenses)
    Segment Profit Margin: segment profit divided by segment revenue
    Segment Profit Mix: segment profit divided by total segment profit for all segments
    Return on Equity: annualized net earnings divided by average shareholders' equity
    Return on Invested Capital: annualized net earnings plus interest expense and other divided by (average total
                                                             1
    shareholders’ equity plus debt plus unrecorded goodwill)
    Revenue Mix: segment revenue divided by total segment revenue for all segments

    NON-GAAP
    Net Debt to Capital: net debt divided by (net debt plus total shareholders' equity)
    Net Debt: debt minus (cash and equivalents and short-term investments available for sale)
    Non-GAAP Diluted EPS from Continuing Operations: non-GAAP earnings from continuing operations divided by
    diluted weighted average shares outstanding
    Non-GAAP Diluted EPS from Continuing Operations Growth Rate: (current period non-GAAP diluted EPS from
    continuing operations minus prior period non-GAAP diluted EPS from continuing operations) divided by prior period non-
    GAAP diluted EPS from continuing operations
    Non-GAAP Earnings from Continuing Operations: earnings from continuing operations excluding special items and
    impairments, (gain)/loss on sale of assets and other, net, both net of tax
    Non-GAAP Earnings from Continuing Operations Growth Rate: (current period non-GAAP earnings from continuing
    operations minus prior period non-GAAP earnings from continuing operations) divided by prior period non-GAAP
    earnings from continuing operations
    Non-GAAP Effective Tax Rate from Continuing Operations: (provision for income taxes adjusted for special items
    and impairments, (gain)/loss on sale of assets and other, net) divided by (earnings before income taxes and discontinued
                                                                                                            2
    operations adjusted for special items and impairments, (gain)/loss on sale of assets and other, net)
    Non-GAAP Operating Earnings: operating earnings excluding special items and impairments, (gain)/loss on sale of
    assets and other, net
    Non-GAAP Operating Earnings Growth Rate: (current period non-GAAP operating earnings minus prior period non-
    GAAP operating earnings) divided by prior period non-GAAP operating earnings
    Non-GAAP Return on Equity: (annualized current period net earnings excluding special items and impairments,
                                                                                                             2
    (gain)/loss on sale of assets and other, net, both net of tax) divided by average shareholders' equity
    Non-GAAP Return on Invested Capital: (annualized net earnings excluding special items, impairments, (gain)/loss on
    sale of assets and other, net and interest expense and other all net of tax) divided by (average total shareholders’ equity
                                          2
    plus debt plus unrecorded goodwill)

    During the first quarter of fiscal 2009, the Company began to exclude interest expense from the calculation of GAAP
1

    return on invested capital. Prior year results have been recast to reflect the new calculation methodology.
    During the first quarter of fiscal 2009, the Company began to exclude the impact of impairments, (gain)/loss on sale of
2

    assets and other, net, net of tax from the calculation of non-GAAP effective tax rate from continuing operations, non-
                                                                                                                                  24
    GAAP return on equity and non-GAAP return on invested capital consistent with the calculation of other non-GAAP
    financial measures. Prior year results have been recast to reflect the new calculation methodology.

More Related Content

What's hot

cardinal health Q1 2007 Earnings Presentation
cardinal health Q1 2007 Earnings Presentationcardinal health Q1 2007 Earnings Presentation
cardinal health Q1 2007 Earnings Presentationfinance2
 
tenet healthcare Q4_2007Conf_Call_D_13_FINAL_FINAL
tenet healthcare Q4_2007Conf_Call_D_13_FINAL_FINALtenet healthcare Q4_2007Conf_Call_D_13_FINAL_FINAL
tenet healthcare Q4_2007Conf_Call_D_13_FINAL_FINALfinance42
 
cardinal health Q2 2007 Earnings Presentation
cardinal health Q2 2007 Earnings Presentationcardinal health Q2 2007 Earnings Presentation
cardinal health Q2 2007 Earnings Presentationfinance2
 
aetna 2005 Annual Report
aetna 2005 Annual Reportaetna 2005 Annual Report
aetna 2005 Annual Reportfinance9
 
meadwestvaco 1Q08_Earnings_Slides
 meadwestvaco 1Q08_Earnings_Slides meadwestvaco 1Q08_Earnings_Slides
meadwestvaco 1Q08_Earnings_Slidesfinance33
 
RYDERFINAL 3Q06Presentation
RYDERFINAL 3Q06PresentationRYDERFINAL 3Q06Presentation
RYDERFINAL 3Q06Presentationfinance44
 
RYDERFINAL Q407ryderearningsreport
RYDERFINAL Q407ryderearningsreportRYDERFINAL Q407ryderearningsreport
RYDERFINAL Q407ryderearningsreportfinance44
 
aetna Download Documentation Earnings Release and Tables2008 1st
aetna Download Documentation	Earnings Release and Tables2008 1staetna Download Documentation	Earnings Release and Tables2008 1st
aetna Download Documentation Earnings Release and Tables2008 1stfinance9
 
CSChemicalConference_2006_Handout
CSChemicalConference_2006_HandoutCSChemicalConference_2006_Handout
CSChemicalConference_2006_Handoutfinance45
 
RYDERFINAL Q406presentation
RYDERFINAL Q406presentationRYDERFINAL Q406presentation
RYDERFINAL Q406presentationfinance44
 
goodrich 1Q08slides
goodrich  1Q08slidesgoodrich  1Q08slides
goodrich 1Q08slidesfinance44
 
air products & chemicals fy 08 q2 earnings
air products & chemicals fy 08 q2 earningsair products & chemicals fy 08 q2 earnings
air products & chemicals fy 08 q2 earningsfinance26
 

What's hot (13)

cardinal health Q1 2007 Earnings Presentation
cardinal health Q1 2007 Earnings Presentationcardinal health Q1 2007 Earnings Presentation
cardinal health Q1 2007 Earnings Presentation
 
tenet healthcare Q4_2007Conf_Call_D_13_FINAL_FINAL
tenet healthcare Q4_2007Conf_Call_D_13_FINAL_FINALtenet healthcare Q4_2007Conf_Call_D_13_FINAL_FINAL
tenet healthcare Q4_2007Conf_Call_D_13_FINAL_FINAL
 
cardinal health Q2 2007 Earnings Presentation
cardinal health Q2 2007 Earnings Presentationcardinal health Q2 2007 Earnings Presentation
cardinal health Q2 2007 Earnings Presentation
 
aetna 2005 Annual Report
aetna 2005 Annual Reportaetna 2005 Annual Report
aetna 2005 Annual Report
 
meadwestvaco 1Q08_Earnings_Slides
 meadwestvaco 1Q08_Earnings_Slides meadwestvaco 1Q08_Earnings_Slides
meadwestvaco 1Q08_Earnings_Slides
 
RYDERFINAL 3Q06Presentation
RYDERFINAL 3Q06PresentationRYDERFINAL 3Q06Presentation
RYDERFINAL 3Q06Presentation
 
RYDERFINAL Q407ryderearningsreport
RYDERFINAL Q407ryderearningsreportRYDERFINAL Q407ryderearningsreport
RYDERFINAL Q407ryderearningsreport
 
Q1 2009 Earning Report of Boston Scientific
Q1 2009 Earning Report of Boston ScientificQ1 2009 Earning Report of Boston Scientific
Q1 2009 Earning Report of Boston Scientific
 
aetna Download Documentation Earnings Release and Tables2008 1st
aetna Download Documentation	Earnings Release and Tables2008 1staetna Download Documentation	Earnings Release and Tables2008 1st
aetna Download Documentation Earnings Release and Tables2008 1st
 
CSChemicalConference_2006_Handout
CSChemicalConference_2006_HandoutCSChemicalConference_2006_Handout
CSChemicalConference_2006_Handout
 
RYDERFINAL Q406presentation
RYDERFINAL Q406presentationRYDERFINAL Q406presentation
RYDERFINAL Q406presentation
 
goodrich 1Q08slides
goodrich  1Q08slidesgoodrich  1Q08slides
goodrich 1Q08slides
 
air products & chemicals fy 08 q2 earnings
air products & chemicals fy 08 q2 earningsair products & chemicals fy 08 q2 earnings
air products & chemicals fy 08 q2 earnings
 

Viewers also liked

mckesson Letter to Stockholders 2005
mckesson Letter to Stockholders 2005mckesson Letter to Stockholders 2005
mckesson Letter to Stockholders 2005finance2
 
The Home Depot Announces First Quarter Results
The Home Depot Announces First Quarter ResultsThe Home Depot Announces First Quarter Results
The Home Depot Announces First Quarter Resultsfinance2
 
David & Melissa, Post-Wedding Dinner, August 2009
David & Melissa, Post-Wedding Dinner, August 2009David & Melissa, Post-Wedding Dinner, August 2009
David & Melissa, Post-Wedding Dinner, August 2009SLHCommunications
 
Microsoft Xbox 360 with Kinect
Microsoft Xbox 360 with KinectMicrosoft Xbox 360 with Kinect
Microsoft Xbox 360 with KinectManesh Lad
 
"De la idee la fapte" - Dana Pascu pentru Adrev5
"De la idee la fapte" - Dana Pascu pentru Adrev5"De la idee la fapte" - Dana Pascu pentru Adrev5
"De la idee la fapte" - Dana Pascu pentru Adrev5Dana Pascu
 
goldman sachs Consolidated Statement of Financial Condition
goldman sachs Consolidated Statement of Financial Conditiongoldman sachs Consolidated Statement of Financial Condition
goldman sachs Consolidated Statement of Financial Conditionfinance2
 
morgan stanley Earnings Archive 2005 4th
morgan stanley Earnings Archive 2005 4th morgan stanley Earnings Archive 2005 4th
morgan stanley Earnings Archive 2005 4th finance2
 
Mekesson Quarterly Reports 2008 3rd
Mekesson Quarterly Reports 2008  3rdMekesson Quarterly Reports 2008  3rd
Mekesson Quarterly Reports 2008 3rdfinance2
 
DigitalMR social media research sept 2011
DigitalMR social media research sept 2011DigitalMR social media research sept 2011
DigitalMR social media research sept 2011Michalis A. Michael
 
Switching to a mac
Switching to a macSwitching to a mac
Switching to a macManesh Lad
 
Cardinal Health Updates FY09 Outlook Transcript
Cardinal Health Updates FY09 Outlook TranscriptCardinal Health Updates FY09 Outlook Transcript
Cardinal Health Updates FY09 Outlook Transcriptfinance2
 
Mekesson Quarterly Reports 2009 3rd
Mekesson Quarterly Reports 2009  3rdMekesson Quarterly Reports 2009  3rd
Mekesson Quarterly Reports 2009 3rdfinance2
 
Baird Conference Presentation
	 Baird Conference Presentation	 Baird Conference Presentation
Baird Conference Presentationfinance2
 
SMLF Opening Presentation London Dec 2014
SMLF Opening Presentation London Dec 2014SMLF Opening Presentation London Dec 2014
SMLF Opening Presentation London Dec 2014Daniel Kraft
 
Candy & Aspirin In Action At Boston Enterprise 20 Event
Candy & Aspirin In Action At Boston Enterprise 20 EventCandy & Aspirin In Action At Boston Enterprise 20 Event
Candy & Aspirin In Action At Boston Enterprise 20 EventDaniel Kraft
 
morgan stanley Earnings Archive 2001 1st
morgan stanley Earnings Archive 2001 1st morgan stanley Earnings Archive 2001 1st
morgan stanley Earnings Archive 2001 1st finance2
 
morgan stanley Earnings Archive 2006 4th
morgan stanley Earnings Archive 2006 4th morgan stanley Earnings Archive 2006 4th
morgan stanley Earnings Archive 2006 4th finance2
 

Viewers also liked (20)

mckesson Letter to Stockholders 2005
mckesson Letter to Stockholders 2005mckesson Letter to Stockholders 2005
mckesson Letter to Stockholders 2005
 
The Home Depot Announces First Quarter Results
The Home Depot Announces First Quarter ResultsThe Home Depot Announces First Quarter Results
The Home Depot Announces First Quarter Results
 
David & Melissa, Post-Wedding Dinner, August 2009
David & Melissa, Post-Wedding Dinner, August 2009David & Melissa, Post-Wedding Dinner, August 2009
David & Melissa, Post-Wedding Dinner, August 2009
 
Microsoft Xbox 360 with Kinect
Microsoft Xbox 360 with KinectMicrosoft Xbox 360 with Kinect
Microsoft Xbox 360 with Kinect
 
"De la idee la fapte" - Dana Pascu pentru Adrev5
"De la idee la fapte" - Dana Pascu pentru Adrev5"De la idee la fapte" - Dana Pascu pentru Adrev5
"De la idee la fapte" - Dana Pascu pentru Adrev5
 
goldman sachs Consolidated Statement of Financial Condition
goldman sachs Consolidated Statement of Financial Conditiongoldman sachs Consolidated Statement of Financial Condition
goldman sachs Consolidated Statement of Financial Condition
 
morgan stanley Earnings Archive 2005 4th
morgan stanley Earnings Archive 2005 4th morgan stanley Earnings Archive 2005 4th
morgan stanley Earnings Archive 2005 4th
 
Mekesson Quarterly Reports 2008 3rd
Mekesson Quarterly Reports 2008  3rdMekesson Quarterly Reports 2008  3rd
Mekesson Quarterly Reports 2008 3rd
 
DigitalMR social media research sept 2011
DigitalMR social media research sept 2011DigitalMR social media research sept 2011
DigitalMR social media research sept 2011
 
Switching to a mac
Switching to a macSwitching to a mac
Switching to a mac
 
Cardinal Health Updates FY09 Outlook Transcript
Cardinal Health Updates FY09 Outlook TranscriptCardinal Health Updates FY09 Outlook Transcript
Cardinal Health Updates FY09 Outlook Transcript
 
Mekesson Quarterly Reports 2009 3rd
Mekesson Quarterly Reports 2009  3rdMekesson Quarterly Reports 2009  3rd
Mekesson Quarterly Reports 2009 3rd
 
The Dutch Case With Oer At Opened
The Dutch Case With Oer At OpenedThe Dutch Case With Oer At Opened
The Dutch Case With Oer At Opened
 
Baird Conference Presentation
	 Baird Conference Presentation	 Baird Conference Presentation
Baird Conference Presentation
 
Going green
Going greenGoing green
Going green
 
SMLF Opening Presentation London Dec 2014
SMLF Opening Presentation London Dec 2014SMLF Opening Presentation London Dec 2014
SMLF Opening Presentation London Dec 2014
 
Candy & Aspirin In Action At Boston Enterprise 20 Event
Candy & Aspirin In Action At Boston Enterprise 20 EventCandy & Aspirin In Action At Boston Enterprise 20 Event
Candy & Aspirin In Action At Boston Enterprise 20 Event
 
Tebak Ukuran
Tebak UkuranTebak Ukuran
Tebak Ukuran
 
morgan stanley Earnings Archive 2001 1st
morgan stanley Earnings Archive 2001 1st morgan stanley Earnings Archive 2001 1st
morgan stanley Earnings Archive 2001 1st
 
morgan stanley Earnings Archive 2006 4th
morgan stanley Earnings Archive 2006 4th morgan stanley Earnings Archive 2006 4th
morgan stanley Earnings Archive 2006 4th
 

Similar to cardinal health Conference Call Presentation

Johnson & Johnson 4q08 Wcweldon V10 Web
Johnson & Johnson 4q08 Wcweldon V10 WebJohnson & Johnson 4q08 Wcweldon V10 Web
Johnson & Johnson 4q08 Wcweldon V10 Webearningsreport
 
johnson & johnson PDF Download Presentation
johnson & johnson  PDF  	Download Presentationjohnson & johnson  PDF  	Download Presentation
johnson & johnson PDF Download Presentationfinance4
 
johnson & johnson View Presentation
johnson & johnson View Presentation johnson & johnson View Presentation
johnson & johnson View Presentation finance4
 
ConAgra QAFY07Q1
ConAgra QAFY07Q1ConAgra QAFY07Q1
ConAgra QAFY07Q1finance21
 
Q1 fy16 earnings deck final
Q1 fy16 earnings deck finalQ1 fy16 earnings deck final
Q1 fy16 earnings deck finalCardinal_Health
 
Q2 fy15 earnings presentation
Q2 fy15 earnings presentationQ2 fy15 earnings presentation
Q2 fy15 earnings presentationCardinal_Health
 
AVY_Q308_FinancialReviewAnalysis
AVY_Q308_FinancialReviewAnalysisAVY_Q308_FinancialReviewAnalysis
AVY_Q308_FinancialReviewAnalysisfinance45
 
RYDERFINAL Q406presentation
RYDERFINAL  Q406presentationRYDERFINAL  Q406presentation
RYDERFINAL Q406presentationfinance44
 
Cardinal Health Q4 FY 2016 Earnings Presentation
Cardinal Health Q4 FY 2016 Earnings PresentationCardinal Health Q4 FY 2016 Earnings Presentation
Cardinal Health Q4 FY 2016 Earnings PresentationCardinal_Health
 
goodrich 1Q08slides
goodrich  1Q08slidesgoodrich  1Q08slides
goodrich 1Q08slidesfinance44
 
SecondQuarter2006FinancialReviewandAnalysis1
SecondQuarter2006FinancialReviewandAnalysis1SecondQuarter2006FinancialReviewandAnalysis1
SecondQuarter2006FinancialReviewandAnalysis1finance45
 
air products & chemicals Q1 FY 09 earnings
air products & chemicals Q1 FY 09 earningsair products & chemicals Q1 FY 09 earnings
air products & chemicals Q1 FY 09 earningsfinance26
 
air products & chemicals Q3 fy 08 earnings release
air products & chemicals Q3 fy 08 earnings releaseair products & chemicals Q3 fy 08 earnings release
air products & chemicals Q3 fy 08 earnings releasefinance26
 
RYDERFINAL 3Q06Presentation
RYDERFINAL 3Q06PresentationRYDERFINAL 3Q06Presentation
RYDERFINAL 3Q06Presentationfinance44
 
Ge Q4 2008 Financial Results
Ge Q4 2008 Financial ResultsGe Q4 2008 Financial Results
Ge Q4 2008 Financial Resultsearningsreport
 
meadwestvaco 1Q08_Earnings_Slides
 meadwestvaco 1Q08_Earnings_Slides meadwestvaco 1Q08_Earnings_Slides
meadwestvaco 1Q08_Earnings_Slidesfinance33
 

Similar to cardinal health Conference Call Presentation (20)

Johnson & Johnson 4q08 Wcweldon V10 Web
Johnson & Johnson 4q08 Wcweldon V10 WebJohnson & Johnson 4q08 Wcweldon V10 Web
Johnson & Johnson 4q08 Wcweldon V10 Web
 
johnson & johnson PDF Download Presentation
johnson & johnson  PDF  	Download Presentationjohnson & johnson  PDF  	Download Presentation
johnson & johnson PDF Download Presentation
 
johnson & johnson View Presentation
johnson & johnson View Presentation johnson & johnson View Presentation
johnson & johnson View Presentation
 
Q3 fy14 earnings deck
Q3 fy14 earnings deckQ3 fy14 earnings deck
Q3 fy14 earnings deck
 
Q3 fy14 earnings deck
Q3 fy14 earnings deckQ3 fy14 earnings deck
Q3 fy14 earnings deck
 
ConAgra QAFY07Q1
ConAgra QAFY07Q1ConAgra QAFY07Q1
ConAgra QAFY07Q1
 
Q1 fy16 earnings deck final
Q1 fy16 earnings deck finalQ1 fy16 earnings deck final
Q1 fy16 earnings deck final
 
Q2 fy15 earnings presentation
Q2 fy15 earnings presentationQ2 fy15 earnings presentation
Q2 fy15 earnings presentation
 
AVY_Q308_FinancialReviewAnalysis
AVY_Q308_FinancialReviewAnalysisAVY_Q308_FinancialReviewAnalysis
AVY_Q308_FinancialReviewAnalysis
 
RYDERFINAL Q406presentation
RYDERFINAL  Q406presentationRYDERFINAL  Q406presentation
RYDERFINAL Q406presentation
 
Cardinal Health Q4 FY 2016 Earnings Presentation
Cardinal Health Q4 FY 2016 Earnings PresentationCardinal Health Q4 FY 2016 Earnings Presentation
Cardinal Health Q4 FY 2016 Earnings Presentation
 
goodrich 1Q08slides
goodrich  1Q08slidesgoodrich  1Q08slides
goodrich 1Q08slides
 
First Quarter 2005 Earnings Presentation
	First Quarter 2005 Earnings Presentation	First Quarter 2005 Earnings Presentation
First Quarter 2005 Earnings Presentation
 
SecondQuarter2006FinancialReviewandAnalysis1
SecondQuarter2006FinancialReviewandAnalysis1SecondQuarter2006FinancialReviewandAnalysis1
SecondQuarter2006FinancialReviewandAnalysis1
 
air products & chemicals Q1 FY 09 earnings
air products & chemicals Q1 FY 09 earningsair products & chemicals Q1 FY 09 earnings
air products & chemicals Q1 FY 09 earnings
 
air products & chemicals Q3 fy 08 earnings release
air products & chemicals Q3 fy 08 earnings releaseair products & chemicals Q3 fy 08 earnings release
air products & chemicals Q3 fy 08 earnings release
 
RYDERFINAL 3Q06Presentation
RYDERFINAL 3Q06PresentationRYDERFINAL 3Q06Presentation
RYDERFINAL 3Q06Presentation
 
4Q 2012 Presentation
4Q 2012 Presentation4Q 2012 Presentation
4Q 2012 Presentation
 
Ge Q4 2008 Financial Results
Ge Q4 2008 Financial ResultsGe Q4 2008 Financial Results
Ge Q4 2008 Financial Results
 
meadwestvaco 1Q08_Earnings_Slides
 meadwestvaco 1Q08_Earnings_Slides meadwestvaco 1Q08_Earnings_Slides
meadwestvaco 1Q08_Earnings_Slides
 

More from finance2

The Home Depot Celebrates Hispanic Culture Through Color and Paint With Color...
The Home Depot Celebrates Hispanic Culture Through Color and Paint With Color...The Home Depot Celebrates Hispanic Culture Through Color and Paint With Color...
The Home Depot Celebrates Hispanic Culture Through Color and Paint With Color...finance2
 
The Home Depot and AARP Launch Nationwide Workshops
The Home Depot and AARP Launch Nationwide WorkshopsThe Home Depot and AARP Launch Nationwide Workshops
The Home Depot and AARP Launch Nationwide Workshopsfinance2
 
Nearly Half of Americans Fail to Check Home Safety Devices at Daylight-Saving...
Nearly Half of Americans Fail to Check Home Safety Devices at Daylight-Saving...Nearly Half of Americans Fail to Check Home Safety Devices at Daylight-Saving...
Nearly Half of Americans Fail to Check Home Safety Devices at Daylight-Saving...finance2
 
View Summary The Home Depot Celebrates the Olympic Spirit With Special Kids...
View Summary  	The Home Depot Celebrates the Olympic Spirit With Special Kids...View Summary  	The Home Depot Celebrates the Olympic Spirit With Special Kids...
View Summary The Home Depot Celebrates the Olympic Spirit With Special Kids...finance2
 
home depot Craig Menear Presentation
home depot Craig Menear Presentationhome depot Craig Menear Presentation
home depot Craig Menear Presentationfinance2
 
home depot 2008 Annual Meeting of Stockholders
home depot 2008 Annual Meeting of Stockholdershome depot 2008 Annual Meeting of Stockholders
home depot 2008 Annual Meeting of Stockholdersfinance2
 
home depot Transcript
home depot 	Transcript home depot 	Transcript
home depot Transcript finance2
 
home depot PDF Carol Tomé Presentation
home depot  PDF  	Carol Tomé Presentation home depot  PDF  	Carol Tomé Presentation
home depot PDF Carol Tomé Presentation finance2
 
home depot Paul Raines Presentation
home depot Paul Raines Presentation home depot Paul Raines Presentation
home depot Paul Raines Presentation finance2
 
home depot http://ir.homedepot.com/common/download/download.cfm?companyid=HD&...
home depot http://ir.homedepot.com/common/download/download.cfm?companyid=HD&...home depot http://ir.homedepot.com/common/download/download.cfm?companyid=HD&...
home depot http://ir.homedepot.com/common/download/download.cfm?companyid=HD&...finance2
 
home depot Annual Report 1982
home depot Annual Report 1982home depot Annual Report 1982
home depot Annual Report 1982finance2
 
home depot PDF Frank Blake Presentation
home depot  PDF  	Frank Blake Presentation home depot  PDF  	Frank Blake Presentation
home depot PDF Frank Blake Presentation finance2
 
home depotForward Looking & Non-GAAP Disclosures
home depotForward Looking & Non-GAAP Disclosures home depotForward Looking & Non-GAAP Disclosures
home depotForward Looking & Non-GAAP Disclosures finance2
 
home depot Bank of America 38th Annual Investment Conference
home depot Bank of America 38th Annual Investment Conferencehome depot Bank of America 38th Annual Investment Conference
home depot Bank of America 38th Annual Investment Conferencefinance2
 
2008 Home Depot Inc. Earnings Conference
2008 Home Depot Inc. Earnings Conference  2008 Home Depot Inc. Earnings Conference
2008 Home Depot Inc. Earnings Conference finance2
 
home depot Quarterly Earnings 2008 3rd
home depot  Quarterly Earnings 2008 3rdhome depot  Quarterly Earnings 2008 3rd
home depot Quarterly Earnings 2008 3rdfinance2
 
home depot Annual Report 1983
home depot Annual Report 1983home depot Annual Report 1983
home depot Annual Report 1983finance2
 
home depot Annual Report 1984
home depot Annual Report 1984home depot Annual Report 1984
home depot Annual Report 1984finance2
 
home depot Annual Report 1985
home depot Annual Report 1985home depot Annual Report 1985
home depot Annual Report 1985finance2
 
home depot Annual Report 1986
home depot Annual Report 1986home depot Annual Report 1986
home depot Annual Report 1986finance2
 

More from finance2 (20)

The Home Depot Celebrates Hispanic Culture Through Color and Paint With Color...
The Home Depot Celebrates Hispanic Culture Through Color and Paint With Color...The Home Depot Celebrates Hispanic Culture Through Color and Paint With Color...
The Home Depot Celebrates Hispanic Culture Through Color and Paint With Color...
 
The Home Depot and AARP Launch Nationwide Workshops
The Home Depot and AARP Launch Nationwide WorkshopsThe Home Depot and AARP Launch Nationwide Workshops
The Home Depot and AARP Launch Nationwide Workshops
 
Nearly Half of Americans Fail to Check Home Safety Devices at Daylight-Saving...
Nearly Half of Americans Fail to Check Home Safety Devices at Daylight-Saving...Nearly Half of Americans Fail to Check Home Safety Devices at Daylight-Saving...
Nearly Half of Americans Fail to Check Home Safety Devices at Daylight-Saving...
 
View Summary The Home Depot Celebrates the Olympic Spirit With Special Kids...
View Summary  	The Home Depot Celebrates the Olympic Spirit With Special Kids...View Summary  	The Home Depot Celebrates the Olympic Spirit With Special Kids...
View Summary The Home Depot Celebrates the Olympic Spirit With Special Kids...
 
home depot Craig Menear Presentation
home depot Craig Menear Presentationhome depot Craig Menear Presentation
home depot Craig Menear Presentation
 
home depot 2008 Annual Meeting of Stockholders
home depot 2008 Annual Meeting of Stockholdershome depot 2008 Annual Meeting of Stockholders
home depot 2008 Annual Meeting of Stockholders
 
home depot Transcript
home depot 	Transcript home depot 	Transcript
home depot Transcript
 
home depot PDF Carol Tomé Presentation
home depot  PDF  	Carol Tomé Presentation home depot  PDF  	Carol Tomé Presentation
home depot PDF Carol Tomé Presentation
 
home depot Paul Raines Presentation
home depot Paul Raines Presentation home depot Paul Raines Presentation
home depot Paul Raines Presentation
 
home depot http://ir.homedepot.com/common/download/download.cfm?companyid=HD&...
home depot http://ir.homedepot.com/common/download/download.cfm?companyid=HD&...home depot http://ir.homedepot.com/common/download/download.cfm?companyid=HD&...
home depot http://ir.homedepot.com/common/download/download.cfm?companyid=HD&...
 
home depot Annual Report 1982
home depot Annual Report 1982home depot Annual Report 1982
home depot Annual Report 1982
 
home depot PDF Frank Blake Presentation
home depot  PDF  	Frank Blake Presentation home depot  PDF  	Frank Blake Presentation
home depot PDF Frank Blake Presentation
 
home depotForward Looking & Non-GAAP Disclosures
home depotForward Looking & Non-GAAP Disclosures home depotForward Looking & Non-GAAP Disclosures
home depotForward Looking & Non-GAAP Disclosures
 
home depot Bank of America 38th Annual Investment Conference
home depot Bank of America 38th Annual Investment Conferencehome depot Bank of America 38th Annual Investment Conference
home depot Bank of America 38th Annual Investment Conference
 
2008 Home Depot Inc. Earnings Conference
2008 Home Depot Inc. Earnings Conference  2008 Home Depot Inc. Earnings Conference
2008 Home Depot Inc. Earnings Conference
 
home depot Quarterly Earnings 2008 3rd
home depot  Quarterly Earnings 2008 3rdhome depot  Quarterly Earnings 2008 3rd
home depot Quarterly Earnings 2008 3rd
 
home depot Annual Report 1983
home depot Annual Report 1983home depot Annual Report 1983
home depot Annual Report 1983
 
home depot Annual Report 1984
home depot Annual Report 1984home depot Annual Report 1984
home depot Annual Report 1984
 
home depot Annual Report 1985
home depot Annual Report 1985home depot Annual Report 1985
home depot Annual Report 1985
 
home depot Annual Report 1986
home depot Annual Report 1986home depot Annual Report 1986
home depot Annual Report 1986
 

Recently uploaded

Quantitative Analysis of Retail Sector Companies
Quantitative Analysis of Retail Sector CompaniesQuantitative Analysis of Retail Sector Companies
Quantitative Analysis of Retail Sector Companiesprashantbhati354
 
SBP-Market-Operations and market managment
SBP-Market-Operations and market managmentSBP-Market-Operations and market managment
SBP-Market-Operations and market managmentfactical
 
Independent Lucknow Call Girls 8923113531WhatsApp Lucknow Call Girls make you...
Independent Lucknow Call Girls 8923113531WhatsApp Lucknow Call Girls make you...Independent Lucknow Call Girls 8923113531WhatsApp Lucknow Call Girls make you...
Independent Lucknow Call Girls 8923113531WhatsApp Lucknow Call Girls make you...makika9823
 
Attachment Of Assets......................
Attachment Of Assets......................Attachment Of Assets......................
Attachment Of Assets......................AmanBajaj36
 
Financial institutions facilitate financing, economic transactions, issue fun...
Financial institutions facilitate financing, economic transactions, issue fun...Financial institutions facilitate financing, economic transactions, issue fun...
Financial institutions facilitate financing, economic transactions, issue fun...Avanish Goel
 
Q3 2024 Earnings Conference Call and Webcast Slides
Q3 2024 Earnings Conference Call and Webcast SlidesQ3 2024 Earnings Conference Call and Webcast Slides
Q3 2024 Earnings Conference Call and Webcast SlidesMarketing847413
 
OAT_RI_Ep19 WeighingTheRisks_Apr24_TheYellowMetal.pptx
OAT_RI_Ep19 WeighingTheRisks_Apr24_TheYellowMetal.pptxOAT_RI_Ep19 WeighingTheRisks_Apr24_TheYellowMetal.pptx
OAT_RI_Ep19 WeighingTheRisks_Apr24_TheYellowMetal.pptxhiddenlevers
 
20240417-Calibre-April-2024-Investor-Presentation.pdf
20240417-Calibre-April-2024-Investor-Presentation.pdf20240417-Calibre-April-2024-Investor-Presentation.pdf
20240417-Calibre-April-2024-Investor-Presentation.pdfAdnet Communications
 
government_intervention_in_business_ownership[1].pdf
government_intervention_in_business_ownership[1].pdfgovernment_intervention_in_business_ownership[1].pdf
government_intervention_in_business_ownership[1].pdfshaunmashale756
 
(办理原版一样)QUT毕业证昆士兰科技大学毕业证学位证留信学历认证成绩单补办
(办理原版一样)QUT毕业证昆士兰科技大学毕业证学位证留信学历认证成绩单补办(办理原版一样)QUT毕业证昆士兰科技大学毕业证学位证留信学历认证成绩单补办
(办理原版一样)QUT毕业证昆士兰科技大学毕业证学位证留信学历认证成绩单补办fqiuho152
 
Classical Theory of Macroeconomics by Adam Smith
Classical Theory of Macroeconomics by Adam SmithClassical Theory of Macroeconomics by Adam Smith
Classical Theory of Macroeconomics by Adam SmithAdamYassin2
 
(办理学位证)加拿大萨省大学毕业证成绩单原版一比一
(办理学位证)加拿大萨省大学毕业证成绩单原版一比一(办理学位证)加拿大萨省大学毕业证成绩单原版一比一
(办理学位证)加拿大萨省大学毕业证成绩单原版一比一S SDS
 
VIP Call Girls Service Dilsukhnagar Hyderabad Call +91-8250192130
VIP Call Girls Service Dilsukhnagar Hyderabad Call +91-8250192130VIP Call Girls Service Dilsukhnagar Hyderabad Call +91-8250192130
VIP Call Girls Service Dilsukhnagar Hyderabad Call +91-8250192130Suhani Kapoor
 
Monthly Market Risk Update: April 2024 [SlideShare]
Monthly Market Risk Update: April 2024 [SlideShare]Monthly Market Risk Update: April 2024 [SlideShare]
Monthly Market Risk Update: April 2024 [SlideShare]Commonwealth
 
BPPG response - Options for Defined Benefit schemes - 19Apr24.pdf
BPPG response - Options for Defined Benefit schemes - 19Apr24.pdfBPPG response - Options for Defined Benefit schemes - 19Apr24.pdf
BPPG response - Options for Defined Benefit schemes - 19Apr24.pdfHenry Tapper
 
House of Commons ; CDC schemes overview document
House of Commons ; CDC schemes overview documentHouse of Commons ; CDC schemes overview document
House of Commons ; CDC schemes overview documentHenry Tapper
 
Interimreport1 January–31 March2024 Elo Mutual Pension Insurance Company
Interimreport1 January–31 March2024 Elo Mutual Pension Insurance CompanyInterimreport1 January–31 March2024 Elo Mutual Pension Insurance Company
Interimreport1 January–31 March2024 Elo Mutual Pension Insurance CompanyTyöeläkeyhtiö Elo
 
letter-from-the-chair-to-the-fca-relating-to-british-steel-pensions-scheme-15...
letter-from-the-chair-to-the-fca-relating-to-british-steel-pensions-scheme-15...letter-from-the-chair-to-the-fca-relating-to-british-steel-pensions-scheme-15...
letter-from-the-chair-to-the-fca-relating-to-british-steel-pensions-scheme-15...Henry Tapper
 

Recently uploaded (20)

Quantitative Analysis of Retail Sector Companies
Quantitative Analysis of Retail Sector CompaniesQuantitative Analysis of Retail Sector Companies
Quantitative Analysis of Retail Sector Companies
 
SBP-Market-Operations and market managment
SBP-Market-Operations and market managmentSBP-Market-Operations and market managment
SBP-Market-Operations and market managment
 
Independent Lucknow Call Girls 8923113531WhatsApp Lucknow Call Girls make you...
Independent Lucknow Call Girls 8923113531WhatsApp Lucknow Call Girls make you...Independent Lucknow Call Girls 8923113531WhatsApp Lucknow Call Girls make you...
Independent Lucknow Call Girls 8923113531WhatsApp Lucknow Call Girls make you...
 
Attachment Of Assets......................
Attachment Of Assets......................Attachment Of Assets......................
Attachment Of Assets......................
 
Financial institutions facilitate financing, economic transactions, issue fun...
Financial institutions facilitate financing, economic transactions, issue fun...Financial institutions facilitate financing, economic transactions, issue fun...
Financial institutions facilitate financing, economic transactions, issue fun...
 
Q3 2024 Earnings Conference Call and Webcast Slides
Q3 2024 Earnings Conference Call and Webcast SlidesQ3 2024 Earnings Conference Call and Webcast Slides
Q3 2024 Earnings Conference Call and Webcast Slides
 
OAT_RI_Ep19 WeighingTheRisks_Apr24_TheYellowMetal.pptx
OAT_RI_Ep19 WeighingTheRisks_Apr24_TheYellowMetal.pptxOAT_RI_Ep19 WeighingTheRisks_Apr24_TheYellowMetal.pptx
OAT_RI_Ep19 WeighingTheRisks_Apr24_TheYellowMetal.pptx
 
Monthly Economic Monitoring of Ukraine No 231, April 2024
Monthly Economic Monitoring of Ukraine No 231, April 2024Monthly Economic Monitoring of Ukraine No 231, April 2024
Monthly Economic Monitoring of Ukraine No 231, April 2024
 
20240417-Calibre-April-2024-Investor-Presentation.pdf
20240417-Calibre-April-2024-Investor-Presentation.pdf20240417-Calibre-April-2024-Investor-Presentation.pdf
20240417-Calibre-April-2024-Investor-Presentation.pdf
 
government_intervention_in_business_ownership[1].pdf
government_intervention_in_business_ownership[1].pdfgovernment_intervention_in_business_ownership[1].pdf
government_intervention_in_business_ownership[1].pdf
 
(办理原版一样)QUT毕业证昆士兰科技大学毕业证学位证留信学历认证成绩单补办
(办理原版一样)QUT毕业证昆士兰科技大学毕业证学位证留信学历认证成绩单补办(办理原版一样)QUT毕业证昆士兰科技大学毕业证学位证留信学历认证成绩单补办
(办理原版一样)QUT毕业证昆士兰科技大学毕业证学位证留信学历认证成绩单补办
 
Classical Theory of Macroeconomics by Adam Smith
Classical Theory of Macroeconomics by Adam SmithClassical Theory of Macroeconomics by Adam Smith
Classical Theory of Macroeconomics by Adam Smith
 
(办理学位证)加拿大萨省大学毕业证成绩单原版一比一
(办理学位证)加拿大萨省大学毕业证成绩单原版一比一(办理学位证)加拿大萨省大学毕业证成绩单原版一比一
(办理学位证)加拿大萨省大学毕业证成绩单原版一比一
 
🔝9953056974 🔝Call Girls In Dwarka Escort Service Delhi NCR
🔝9953056974 🔝Call Girls In Dwarka Escort Service Delhi NCR🔝9953056974 🔝Call Girls In Dwarka Escort Service Delhi NCR
🔝9953056974 🔝Call Girls In Dwarka Escort Service Delhi NCR
 
VIP Call Girls Service Dilsukhnagar Hyderabad Call +91-8250192130
VIP Call Girls Service Dilsukhnagar Hyderabad Call +91-8250192130VIP Call Girls Service Dilsukhnagar Hyderabad Call +91-8250192130
VIP Call Girls Service Dilsukhnagar Hyderabad Call +91-8250192130
 
Monthly Market Risk Update: April 2024 [SlideShare]
Monthly Market Risk Update: April 2024 [SlideShare]Monthly Market Risk Update: April 2024 [SlideShare]
Monthly Market Risk Update: April 2024 [SlideShare]
 
BPPG response - Options for Defined Benefit schemes - 19Apr24.pdf
BPPG response - Options for Defined Benefit schemes - 19Apr24.pdfBPPG response - Options for Defined Benefit schemes - 19Apr24.pdf
BPPG response - Options for Defined Benefit schemes - 19Apr24.pdf
 
House of Commons ; CDC schemes overview document
House of Commons ; CDC schemes overview documentHouse of Commons ; CDC schemes overview document
House of Commons ; CDC schemes overview document
 
Interimreport1 January–31 March2024 Elo Mutual Pension Insurance Company
Interimreport1 January–31 March2024 Elo Mutual Pension Insurance CompanyInterimreport1 January–31 March2024 Elo Mutual Pension Insurance Company
Interimreport1 January–31 March2024 Elo Mutual Pension Insurance Company
 
letter-from-the-chair-to-the-fca-relating-to-british-steel-pensions-scheme-15...
letter-from-the-chair-to-the-fca-relating-to-british-steel-pensions-scheme-15...letter-from-the-chair-to-the-fca-relating-to-british-steel-pensions-scheme-15...
letter-from-the-chair-to-the-fca-relating-to-british-steel-pensions-scheme-15...
 

cardinal health Conference Call Presentation

  • 1. Q1FY2009 Investor/Analyst Call Essential to care October 29, 2008
  • 2. Forward-looking statements and GAAP reconciliation This presentation contains forward-looking statements addressing expectations, prospects, estimates and other matters that are dependent upon future events or developments. These matters are subject to risks and uncertainties that could cause actual results to differ materially from those projected, anticipated or implied. The most significant of these uncertainties are described in Cardinal Health's Form 10-K, Form 10-Q and Form 8-K reports (including all amendments to those reports) and exhibits to those reports, and include (but are not limited to) the following: uncertainties regarding the planned spin-off of the clinical and medical products businesses as a new stand-alone entity, including the timing and terms of any such spin-off and whether such spin-off will be completed, and uncertainties regarding the impact of the planned spin-off on Cardinal Health, the new clinical and medical products company and the potential market for their respective securities; competitive pressures in Cardinal Health's various lines of business; the loss of one or more key customer or supplier relationships or changes to the terms of those relationships; uncertainties relating to timing of generic and branded pharmaceutical introductions and the frequency or rate of branded pharmaceutical price appreciation or generic pharmaceutical price deflation; changes in the distribution patterns or reimbursement rates for health-care products and/or services; the results, consequences, effects or timing of any inquiry or investigation by any regulatory authority or any legal or administrative proceedings; future actions of regulatory bodies or government authorities relating to Cardinal Health's manufacturing or sale of products and other costs or claims that could arise from its manufacturing, compounding or repackaging operations or from its other services; the costs, difficulties and uncertainties related to the integration of acquired businesses; uncertainties related to the recent disruptions in the financial markets, including uncertainties related to the availability and/or cost of credit and the impact of the financial market disruptions on Cardinal Health’s customers and vendors; and conditions in the pharmaceutical market and general economic and market conditions. This presentation reflects management’s views as of October 29, 2008. Except to the extent required by applicable law, Cardinal Health undertakes no obligation to update or revise any forward-looking statement. In addition, this presentation includes non-GAAP financial measures. Cardinal Health provides definitions and reconciling information at the end of this presentation and on its investor relations page at www.cardinalhealth.com. A transcript of the conference call will be available on the investor relations page at www.cardinalhealth.com 2
  • 3. Agenda Opening remarks Kerry Clark Chairman and Chief Executive Officer Financial overview Jeff Henderson Chief Financial Officer HSCS comments George Barrett Vice Chairman and CEO Healthcare Supply Chain Services CMP comments Dave Schlotterbeck Vice Chairman and CEO Clinical and Medical Products Q&A 3
  • 5. Q1 FY2009 Financial Review GAAP Basis Non-GAAP Basis % % Change1 Change1 ($M) ($M) $24,347 11% $24,347 11% Revenue $426 (13%) $482 (6%) Operating earnings $250 (18%) $268 (16%) Earnings from continuing ops $0.69 (16%) $0.74 (14%) Diluted EPS from continuing ops ($352) Operating cash flow 12.7% 13.6% Return on equity 1% change over prior year quarter 5
  • 6. Q1 FY2009 Operating Earnings and EPS Q1 FY 2009 Q1 FY 2008 Diluted EPS from Diluted EPS from Operating Continuing Operating Continuing Earnings ($M) Operations Earnings ($M) Operations GAAP Consolidated $426 $0.69 $490 $0.82 Special Items $52 $0.10 $23 $0.04 Impairments, (gain)/loss on sale of assets and other, net $4 ($0.05) -- -- Non-GAAP Consolidated $482 $0.74 $512 $0.86 • Going forward, costs associated with the spin-off and the separation of the two companies will be identified separately – A significant portion of the incremental costs that will be incurred will be classified as special items in accordance with company practices. – The total costs incurred, including special items, in Q1FY09 related to the spin-off were less than $1M. 6
  • 7. Healthcare Supply Chain Services Business Analysis Q1 FY09 Q1 FY08 ($M) ($M) % Change Revenue 23,418 21,093 11% Segment Profit 292 347 (16%) Highlights: • Revenue up 11% on growth in pharma and medical supply chain business • Revenue from bulk1 customers up 20% on increased volumes from existing customers and customer wins • Revenue from non-bulk2 customers up 4%, driven by growth in retail chain and hospital markets • Segment profit down 16%, driven by pharma customer repricings, controlled substance anti- diversion impact and branded price inflation, partially offset by revenue growth and increased profit dollars from generic products • Increase in IT investments has begun 1Bulk customers consist of Healthcare Supply Chain Services customers to which the segment distributes pharmaceutical, radiopharmaceutical and over-the-counter health care products to the customers’ centralized warehouse operations and mail order businesses 2Non-bulk customers consist of Healthcare Supply Chain Services customers to which the segment distributes 7 pharmaceutical, radiopharmaceutical and over-the-counter health care products other than bulk customers
  • 8. Clinical and Medical Products Business Analysis Q1 FY09 Q1 FY08 ($M) ($M) % Change Revenue 1,155 1,032 12% Segment Profit 167 145 15% Highlights: • Segment revenue up 12% over prior year on Pyxis revenue, growth in international, and the Enturia acquisition • Segment profit up 15% on the Enturia acquisition and organic growth, dampened in part by the increased cost of commodities • VIASYS® integration continues on track; Enturia integration going very well • Increase in R&D investment has begun 8
  • 9. FY09 Financial Goals October 29, 2008 Total revenue growth: 6-7% Non-GAAP EPS1: $3.80 - $3.95 Revenue Profit Segment Growth Growth Healthcare Supply Chain Services (HSCS) >6% Flat to (5%) Clinical and Medical Products (CMP) >10% >20% 1 Non-GAAP diluted earnings per share from continuing operations 9
  • 10. FY09 Assumptions Update • Capital deployment – Share repurchases to no more than offset equity compensation issuances – Continue regular $0.14 quarterly dividend until spin-off is completed • Portfolio rationalization/review – MedSystems sale closed 8/29/08 – Tecomet sale closed 9/26/08 – Review of MSI and Pharmacy Services ongoing • Non-GAAP effective tax rate of ~34% for the year, with Q2 rate close to Q1 • Interest and other slightly above $200M for the year; Q2 slightly less than Q1 • Special items and/or other expenses / charges related to spin-off not included in guidance – Anticipate a significant portion of costs related to spin-off may be classified as special items in accordance with company practices 10
  • 11. HSCS Update • DEA settlement complete • Early progress on revenue growth from non-bulk customers • Progress in Med Supply Chain SKU rationalization • I/T investments have begun • Physician office program customization begun • MSC - Lab/Ambulatory performing well 11
  • 12. CMP Update • Q1 results solid – Strong customer relationships in uncertain economic environment – No change in competitive landscape • Progress with strategic investments – MedMined™ – Pyxis® supply • Strong annuity stream with disposables • Product remediation on track for calendar year-end completion • Continue to invest, increasing R&D as % of sales 12
  • 13. Summary 13
  • 14. FY 2009 Priorities • Continue to invest in enhancing quality and regulatory systems • Return HSCS to steady growth • Continue to invest in CMP growth • Complete integrations (VIASYS®, Enturia, Borschow) • Execute spin-off transaction 14
  • 15. Q&A
  • 16.
  • 17. Q1FY09 Trailing Five Quarters 17
  • 18. Segment Analysis: Q1FY09 Healthcare Supply Chain Services Q1FY08 Q2FY08 Q3FY08 Q4FY08 Q1FY09 Q1FY09/ Q1FY08 % change Revenue $21,093 $22,346 $21,923 $21,863 $23,418 11% ($M) Segment $347 $315 $377 $324 $292 (16%) Profit ($M) Clinical and Medical Products Q1FY08 Q2FY08 Q3FY08 Q4FY08 Q1FY09 Q1FY09/ Q1FY08 % change Revenue $1,032 $1,133 $1,170 $1,270 $1,155 12% ($M) Segment $145 $171 $190 $229 $167 15% Profit ($M) 18
  • 19. Segment Analysis: Q1FY09 All Other Segment Q1FY08 Q2FY08 Q3FY08 Q4FY08 Q1FY09 Q1FY09/ Q1FY08 % change Revenue $294 $301 $308 $288 $273 (7%) ($M) Segment $22 $25 $26 $27 $24 7% Profit ($M) 19
  • 21. CARDINAL HEALTH, INC. AND SUBSIDIARIES GAAP / NON-GAAP RECONCILIATION First Quarter 2009 Impairments, (Gain)/Loss on Sale of Assets GAAP Special Items and Other, Net Non-GAAP (in millions, except per Common Share amounts) Operating Earnings Amount $426 $52 $4 $482 Growth Rate (13)% (6)% Provision for Income Taxes $114 $17 $21 $152 Earnings from Continuing Operations $250 $35 ($17) $268 Amount Growth Rate (18)% (16)% Diluted EPS from Continuing Operations Amount $0.69 $0.10 ($0.05) $0.74 (16)% (14)% Growth Rate First Quarter 2008 Impairments, (Gain)/Loss on Sale of Assets GAAP Special Items and Other, Net Non-GAAP Operating Earnings Amount $490 $23 - $512 Growth Rate 9% 8% Provision for Income Taxes $144 $8 - $151 Earnings from Continuing Operations Amount $303 $15 - $318 Growth Rate 4% 3% Diluted EPS from Continuing Operations Amount $0.82 $0.04 - $0.86 Growth Rate 15% 15% 21 The sum of the components may not equal the total due to rounding
  • 22. 22
  • 23. CARDINAL HEALTH, INC. AND SUBSIDIARIES GAAP / NON-GAAP RECONCILIATION First Quarter (in millions) 2009 2008 GAAP Effective Tax Rate from Continuing Operations 31.4% 32.2% Non-GAAP Effective Tax Rate from Continuing Operations $ 363.9 Earnings before income taxes and discontinued operations $ 446.9 Special items 52.4 22.5 3.6 Impairments, (gain)/loss on sale of assets and other, net (0.2) $ 419.9 Adjusted earnings before income taxes and discontinued operations $ 469.2 $ 114.1 Provision for income taxes $ 143.7 17.1 Special items tax benefit 7.7 Impairments, (gain)/loss on sale of assets and other, net, tax impact 20.9 (0.1) $ 152.1 Adjusted provision for income taxes $ 151.3 Non-GAAP effective tax rate from continuing operations 1 36.2% 32.2% First Quarter 2009 2008 Debt to Total Capital 32% 35% Net Debt to Capital Current portion of long-term obligations and other short-term borrowings $ 166.5 $ 386.8 Long-term obligations, less current portion and other short-term borrowings 3,597.0 3,347.5 Debt $ 3,763.5 $ 3,734.3 Cash and equivalents (672.2) (1,289.6) Net debt $ 3,091.3 $ 2,444.7 Total shareholders' equity $ 7,918.1 $ 7,068.2 Capital $ 11,009.4 $ 9,512.9 Net debt to capital 28% 26% Forward-Looking Non-GAAP Financial Measures The Company presents non-GAAP earnings from continuing operations and non-GAAP effective tax rate from continuing operations (and presentations derived from these financial measures) on a forward-looking basis. The most directly comparable forward-looking GAAP measures are earnings from continuing operations and effective tax rate from continuing operations. The Company is unable to provide a quantitative reconciliation of these forward-looking non-GAAP measures to the most comparable forward-looking GAAP measures because the Company cannot reliably forecast special items and impairments, (gain)/loss on sale of assets and other, net, which are difficult to predict and estimate and are primarily dependent on future events. Please note that the unavailable reconciling items could significantly impact the Company’s future financial results. 23 See definitions for explanation of changes in method of calculating these financial measures from prior quarters. 1
  • 24. CARDINAL HEALTH, INC. AND SUBSIDIARIES DEFINITIONS GAAP Debt: long-term obligations plus short-term borrowings Debt to Total Capital: debt divided by (debt plus total shareholders' equity) Diluted EPS from Continuing Operations: earnings from continuing operations divided by diluted weighted average shares outstanding Effective Tax Rate from Continuing Operations: provision for income taxes divided by earnings before income taxes and discontinued operations Operating Cash Flow: net cash provided by / (used in) operating activities from continuing operations Segment Profit: segment revenue minus (segment cost of products sold and segment selling, general and administrative expenses) Segment Profit Margin: segment profit divided by segment revenue Segment Profit Mix: segment profit divided by total segment profit for all segments Return on Equity: annualized net earnings divided by average shareholders' equity Return on Invested Capital: annualized net earnings plus interest expense and other divided by (average total 1 shareholders’ equity plus debt plus unrecorded goodwill) Revenue Mix: segment revenue divided by total segment revenue for all segments NON-GAAP Net Debt to Capital: net debt divided by (net debt plus total shareholders' equity) Net Debt: debt minus (cash and equivalents and short-term investments available for sale) Non-GAAP Diluted EPS from Continuing Operations: non-GAAP earnings from continuing operations divided by diluted weighted average shares outstanding Non-GAAP Diluted EPS from Continuing Operations Growth Rate: (current period non-GAAP diluted EPS from continuing operations minus prior period non-GAAP diluted EPS from continuing operations) divided by prior period non- GAAP diluted EPS from continuing operations Non-GAAP Earnings from Continuing Operations: earnings from continuing operations excluding special items and impairments, (gain)/loss on sale of assets and other, net, both net of tax Non-GAAP Earnings from Continuing Operations Growth Rate: (current period non-GAAP earnings from continuing operations minus prior period non-GAAP earnings from continuing operations) divided by prior period non-GAAP earnings from continuing operations Non-GAAP Effective Tax Rate from Continuing Operations: (provision for income taxes adjusted for special items and impairments, (gain)/loss on sale of assets and other, net) divided by (earnings before income taxes and discontinued 2 operations adjusted for special items and impairments, (gain)/loss on sale of assets and other, net) Non-GAAP Operating Earnings: operating earnings excluding special items and impairments, (gain)/loss on sale of assets and other, net Non-GAAP Operating Earnings Growth Rate: (current period non-GAAP operating earnings minus prior period non- GAAP operating earnings) divided by prior period non-GAAP operating earnings Non-GAAP Return on Equity: (annualized current period net earnings excluding special items and impairments, 2 (gain)/loss on sale of assets and other, net, both net of tax) divided by average shareholders' equity Non-GAAP Return on Invested Capital: (annualized net earnings excluding special items, impairments, (gain)/loss on sale of assets and other, net and interest expense and other all net of tax) divided by (average total shareholders’ equity 2 plus debt plus unrecorded goodwill) During the first quarter of fiscal 2009, the Company began to exclude interest expense from the calculation of GAAP 1 return on invested capital. Prior year results have been recast to reflect the new calculation methodology. During the first quarter of fiscal 2009, the Company began to exclude the impact of impairments, (gain)/loss on sale of 2 assets and other, net, net of tax from the calculation of non-GAAP effective tax rate from continuing operations, non- 24 GAAP return on equity and non-GAAP return on invested capital consistent with the calculation of other non-GAAP financial measures. Prior year results have been recast to reflect the new calculation methodology.