SlideShare a Scribd company logo
1 of 27
Download to read offline
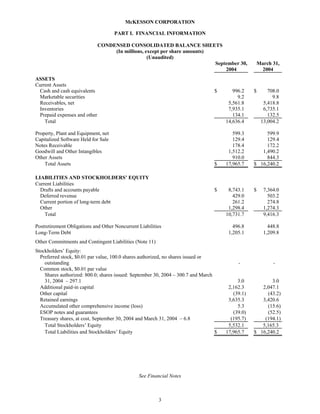
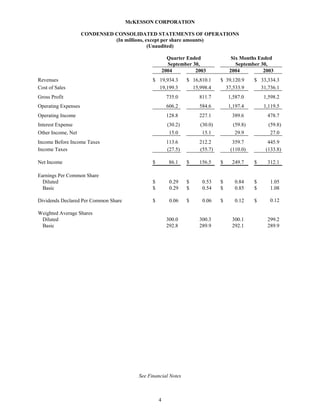
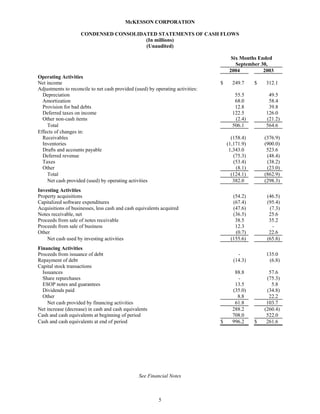
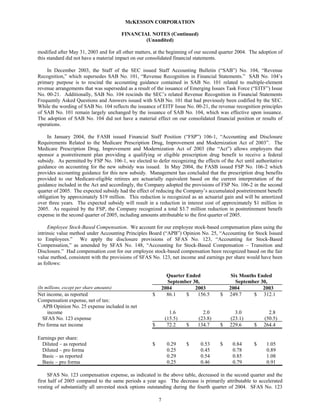
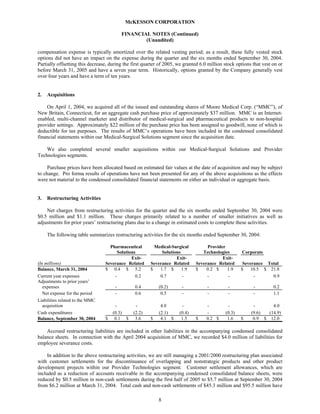
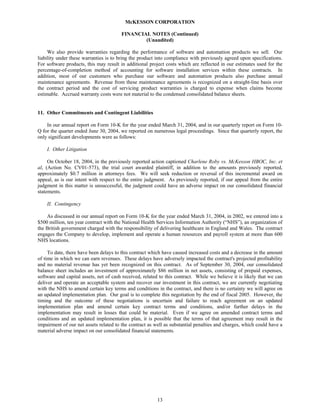
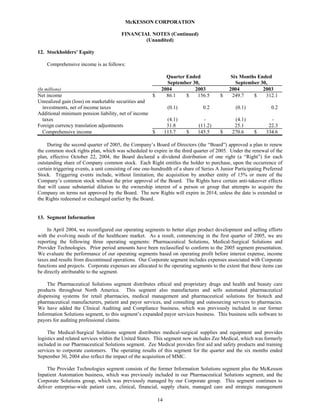
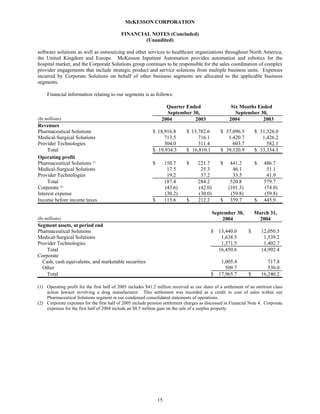
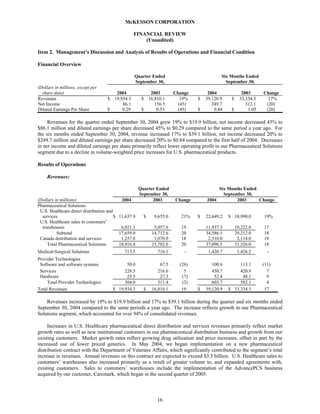
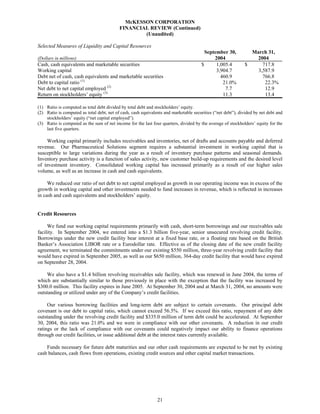
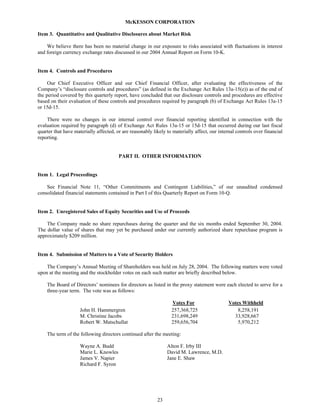
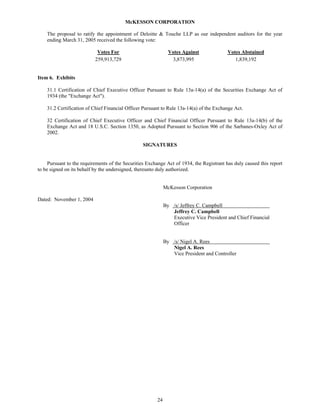
SECURITIES AND EXCHANGE COMMISSION
                                                  Washington, D.C. 20549


                                                         FORM 10-Q

(Mark One)

    ⌧ QUARTERLY REPORT PURSUANT TO SECTION 13 OR 15(d) OF THE SECURITIES
      EXCHANGE ACT OF 1934

          For quarter ended September 30, 2004

          TRANSITION REPORT PURSUANT TO SECTION 13 OR 15(d) OF THE SECURITIES
          EXCHANGE ACT OF 1934

          For the transition period from                            to


                                                Commission file number 1-13252


                                 McKESSON CORPORATION
                                          (Exact name of Registrant as specified in its charter)


                           Delaware                                                                94-3207296
   (State or other jurisdiction of incorporation or organization)                     (IRS Employer Identification No.)


      One Post Street, San Francisco, California                                                     94104
              (Address of principal executive offices)                                              (Zip Code)

                                                           (415) 983-8300
                                         (Registrant’s telephone number, including area code)


    Indicate by check mark whether the Registrant (1) has filed all reports required to be filed by Section 13 or
15(d) of the Securities Exchange Act of 1934 during the preceding 12 months (or for such shorter period that the
Registrant was required to file such reports), and (2) has been subject to such filing requirements for the past 90
days. Yes ⌧ No

    Indicate by check mark whether the registrant is an accelerated filer. Yes ⌧                      No

    Indicate the number of shares outstanding of each of the issuer’s classes of common stock, as of the latest
practicable date.

                        Class                                                    Outstanding at September 30, 2004
              Common stock, $0.01 par value                                             293,915,728 shares


                                                                         1
McKESSON CORPORATION


                                                              TABLE OF CONTENTS


Item                                                                                                                                                      Page
                                                 PART I. FINANCIAL INFORMATION

1.     Financial Statements

       Condensed Consolidated Balance Sheets
          September 30, 2004 and March 31, 2004.............................................................................                                3

       Condensed Consolidated Statements of Operations
          Quarter and six months ended September 30, 2004 and 2003 .............................................                                            4

       Condensed Consolidated Statements of Cash Flows
          Six months ended September 30, 2004 and 2003.................................................................                                     5

       Financial Notes............................................................................................................................        6-15

2.     Management’s Discussion and Analysis of Results of Operations and Financial Condition
          Financial Review..................................................................................................................               16

3.     Quantitative and Qualitative Disclosures about Market Risk......................................................                                    23

4.     Controls and Procedures..............................................................................................................               23

                                                    PART II. OTHER INFORMATION

1.     Legal Proceedings .......................................................................................................................           23

2.     Unregistered Sales of Equity Securities and Use of Proceeds.....................................................                                    23

4.     Submission of Matters to a Vote of Security Holders .................................................................                               23

6.     Exhibits .......................................................................................................................................    24

       Signatures....................................................................................................................................      24


                                                                                 2
McKESSON CORPORATION

                                     PART I. FINANCIAL INFORMATION

                              CONDENSED CONSOLIDATED BALANCE SHEETS
                                   (In millions, except per share amounts)
                                                  (Unaudited)
                                                                           September 30,           March 31,
                                                                               2004                 2004
ASSETS
Current Assets
 Cash and cash equivalents                                                       $       996.2    $      708.0
 Marketable securities                                                                     9.2             9.8
 Receivables, net                                                                      5,561.8         5,418.8
 Inventories                                                                           7,935.1         6,735.1
 Prepaid expenses and other                                                              134.1           132.5
    Total                                                                             14,636.4        13,004.2

Property, Plant and Equipment, net                                                       599.3         599.9
Capitalized Software Held for Sale                                                       129.4         129.4
Notes Receivable                                                                         178.4         172.2
Goodwill and Other Intangibles                                                         1,512.2       1,490.2
Other Assets                                                                             910.0         844.3
    Total Assets                                                                 $    17,965.7    $ 16,240.2

LIABILITIES AND STOCKHOLDERS’ EQUITY
Current Liabilities
  Drafts and accounts payable                                                    $     8,743.1    $    7,364.0
  Deferred revenue                                                                       429.0           503.2
  Current portion of long-term debt                                                      261.2           274.8
  Other                                                                                1,298.4         1,274.3
    Total                                                                             10,731.7         9,416.3

Postretirement Obligations and Other Noncurrent Liabilities                              496.8           448.8
Long-Term Debt                                                                         1,205.1         1,209.8
Other Commitments and Contingent Liabilities (Note 11)
Stockholders’ Equity:
  Preferred stock, $0.01 par value, 100.0 shares authorized, no shares issued or
    outstanding                                                                            -               -
  Common stock, $0.01 par value
    Shares authorized: 800.0; shares issued: September 30, 2004 – 300.7 and March
    31, 2004 – 297.1                                                                       3.0           3.0
  Additional paid-in capital                                                           2,162.3       2,047.1
  Other capital                                                                          (39.1)        (43.2)
  Retained earnings                                                                    3,635.3       3,420.6
  Accumulated other comprehensive income (loss)                                            5.3         (15.6)
  ESOP notes and guarantees                                                              (39.0)        (52.5)
  Treasury shares, at cost, September 30, 2004 and March 31, 2004 – 6.8                 (195.7)       (194.1)
    Total Stockholders’ Equity                                                         5,532.1       5,165.3
    Total Liabilities and Stockholders’ Equity                                    $   17,965.7    $ 16,240.2


                                                See Financial Notes


                                                         3
McKESSON CORPORATION

                     CONDENSED CONSOLIDATED STATEMENTS OF OPERATIONS
                               (In millions, except per share amounts)
                                              (Unaudited)

                                                         Quarter Ended               Six Months Ended
                                                         September 30,                 September 30,
                                                       2004         2003            2004          2003
Revenues                                       $ 19,934.3         $ 16,810.1    $ 39,120.9     $ 33,334.3
Cost of Sales                                    19,199.3           15,998.4      37,533.9       31,736.1
Gross Profit                                            735.0          811.7        1,587.0        1,598.2
Operating Expenses                                      606.2          584.6        1,197.4        1,119.5
Operating Income                                        128.8          227.1         389.6          478.7
Interest Expense                                         (30.2)        (30.0)         (59.8)         (59.8)
Other Income, Net                                        15.0           15.1          29.9           27.0
Income Before Income Taxes                              113.6          212.2         359.7          445.9
Income Taxes                                            (27.5)         (55.7)       (110.0)        (133.8)

Net Income                                     $         86.1     $    156.5    $    249.7     $    312.1

Earnings Per Common Share
  Diluted                                      $         0.29     $     0.53    $     0.84     $     1.05
  Basic                                        $         0.29     $     0.54    $     0.85     $     1.08

                                                                                                     0.12
Dividends Declared Per Common Share            $         0.06     $     0.06    $     0.12     $

Weighted Average Shares
 Diluted                                                300.0          300.3         300.1          299.2
 Basic                                                  292.8          289.9         292.1          289.9


                                         See Financial Notes


                                                   4
McKESSON CORPORATION

                    CONDENSED CONSOLIDATED STATEMENTS OF CASH FLOWS
                                       (In millions)
                                       (Unaudited)

                                                                                      Six Months Ended
                                                                                        September 30,
                                                                                     2004          2003
Operating Activities
Net income                                                                      $     249.7     $   312.1
Adjustments to reconcile to net cash provided (used) by operating activities:
  Depreciation                                                                         55.5          49.5
  Amortization                                                                         68.0          58.4
  Provision for bad debts                                                              12.8          39.8
  Deferred taxes on income                                                            122.5         126.0
  Other non-cash items                                                                 (2.4)        (21.2)
    Total                                                                             506.1         564.6
Effects of changes in:
  Receivables                                                                         (158.4)       (376.9)
  Inventories                                                                       (1,171.9)       (900.0)
  Drafts and accounts payable                                                        1,343.0         523.6
  Deferred revenue                                                                     (75.3)        (48.4)
  Taxes                                                                                (53.4)        (38.2)
  Other                                                                                 (8.1)        (23.0)
    Total                                                                             (124.1)       (862.9)
    Net cash provided (used) by operating activities                                   382.0        (298.3)
Investing Activities
Property acquisitions                                                                 (54.2)         (46.5)
Capitalized software expenditures                                                     (67.4)         (95.4)
Acquisitions of businesses, less cash and cash equivalents acquired                   (47.6)          (7.3)
Notes receivable, net                                                                 (36.5)          25.6
Proceeds from sale of notes receivable                                                 38.5           35.2
Proceeds from sale of business                                                         12.3            -
Other                                                                                  (0.7)          22.6
    Net cash used by investing activities                                            (155.6)         (65.8)
Financing Activities
Proceeds from issuance of debt                                                           -          135.0
Repayment of debt                                                                      (14.3)        (6.8)
Capital stock transactions
  Issuances                                                                            88.8           57.6
  Share repurchases                                                                     -            (75.3)
  ESOP notes and guarantees                                                            13.5            5.8
  Dividends paid                                                                      (35.0)         (34.8)
  Other                                                                                 8.8           22.2
    Net cash provided by financing activities                                          61.8          103.7
Net increase (decrease) in cash and cash equivalents                                  288.2         (260.4)
Cash and cash equivalents at beginning of period                                      708.0          522.0
Cash and cash equivalents at end of period                                      $     996.2     $    261.6


                                                See Financial Notes


                                                          5
McKESSON CORPORATION

                                                FINANCIAL NOTES
                                                   (Unaudited)

1.   Significant Accounting Policies

    Basis of Presentation. The condensed consolidated financial statements of McKesson Corporation
(“McKesson,” the “Company,” or “we” and other similar pronouns) include the financial statements of all majority-
owned or controlled companies. Significant intercompany transactions and balances have been eliminated. In our
opinion, these unaudited condensed consolidated financial statements include all adjustments necessary for a fair
presentation of the Company’s financial position as of September 30, 2004, and the results of operations for the
quarters and six months ended September 30, 2004 and 2003 and cash flows for the six months ended September 30,
2004 and 2003.

     The results of operations for the quarters and six months ended September 30, 2004 and 2003 are not
necessarily indicative of the results that may be expected for the entire year. These interim financial statements
should be read in conjunction with the annual audited financial statements, accounting policies and financial notes
included in our 2004 consolidated financial statements previously filed with the Securities and Exchange
Commission (“SEC”). As described in our Annual Report on Form 10-K for the year ended March 31, 2004, we
reorganized our businesses on April 1, 2004. This reorganization resulted in changes to our reporting segments. On
April 29 and 30, 2004, we provided financial information about this reorganization, as it relates to prior periods, in a
Form 8-K. Certain prior period amounts have been reclassified to conform to the current period presentation.

     The Company’s fiscal year begins on April 1 and ends on March 31. Unless otherwise noted, all references to a
particular year shall mean the Company’s fiscal year.

     New Accounting Pronouncements. In January 2003, the Financial Accounting Standards Board (“FASB”)
issued Interpretation (“FIN”) No. 46, “Consolidation of Variable Interest Entities” and in December 2003, a revised
interpretation was issued (FIN No. 46(R)). In general, a variable interest entity (“VIE”) is a corporation,
partnership, trust, or any other legal structure used for business purposes that either does not have equity investors
with voting rights or has equity investors that do not provide sufficient financial resources for the entity to support
its activities. FIN No. 46 requires a VIE to be consolidated by a company if that company is designated as the
primary beneficiary. The interpretation applies to VIEs created after January 31, 2003, and for all financial
statements issued after December 15, 2003 for VIEs in which an enterprise held a variable interest that it acquired
before February 1, 2003.

     We implemented FIN Nos. 46 and 46(R) on a retroactive basis as required in 2004. As a result of the
implementation, the Company no longer consolidates its investment in the McKesson Financing Trust (the “Trust”)
as the Company was not designated as the Trust’s primary beneficiary. In accordance with this accounting standard,
the Company now recognizes the debentures issued to the Trust as long-term debt in its consolidated financial
statements in lieu of the preferred securities that the Trust issued to third parties. Additionally, the consolidated
financial statements include interest expense on the debentures and no longer report dividends on the preferred
securities, net of tax. These changes increased the Company’s net debt to net capital employed ratio slightly but did
not have a material impact on our consolidated financial statements, including diluted earnings per share.

    In April 2003, the FASB issued Statement of Financial Accounting Standards (“SFAS”) No. 149, “Amendment
of Statement 133 on Derivative Instruments and Hedging Activities.” SFAS No. 149 amends SFAS No. 133 for
decisions made as part of the FASB’s Derivatives Implementation Group process, other FASB projects dealing with
financial instruments, and in connection with implementation issues raised in relation to the application of the
definition of a derivative. This statement is generally effective for contracts entered into or modified after June 30,
2003 and for hedging relationships designated after June 30, 2003. The adoption of this standard did not have a
material impact on our consolidated financial statements.

     In May 2003, the FASB issued SFAS No. 150, “Accounting for Certain Financial Instruments with
Characteristics of both Liabilities and Equity.” SFAS No. 150 clarifies the definition of a liability as currently
defined in FASB Concepts Statement No. 6, “Elements of Financial Statements,” as well as other planned revisions.
This statement requires a financial instrument that embodies an obligation of an issuer to be classified as a liability.
In addition, the statement establishes standards for the initial and subsequent measurement of these financial
instruments and disclosure requirements. SFAS No. 150 is effective for financial instruments entered into or


                                                           6
McKESSON CORPORATION

                                          FINANCIAL NOTES (Continued)
                                                  (Unaudited)

modified after May 31, 2003 and for all other matters, at the beginning of our second quarter 2004. The adoption of
this standard did not have a material impact on our consolidated financial statements.

    In December 2003, the Staff of the SEC issued Staff Accounting Bulletin (“SAB”) No. 104, “Revenue
Recognition,” which supersedes SAB No. 101, “Revenue Recognition in Financial Statements.” SAB No. 104’s
primary purpose is to rescind the accounting guidance contained in SAB No. 101 related to multiple-element
revenue arrangements that was superseded as a result of the issuance of Emerging Issues Task Force (“EITF”) Issue
No. 00-21. Additionally, SAB No. 104 rescinds the SEC’s related Revenue Recognition in Financial Statements
Frequently Asked Questions and Answers issued with SAB No. 101 that had previously been codified by the SEC.
While the wording of SAB No. 104 reflects the issuance of EITF Issue No. 00-21, the revenue recognition principles
of SAB No. 101 remain largely unchanged by the issuance of SAB No. 104, which was effective upon issuance.
The adoption of SAB No. 104 did not have a material effect on our consolidated financial position or results of
operations.

    In January 2004, the FASB issued Financial Staff Position (“FSP”) 106-1, “Accounting and Disclosure
Requirements Related to the Medicare Prescription Drug, Improvement and Modernization Act of 2003”. The
Medicare Prescription Drug, Improvement and Modernization Act of 2003 (the “Act”) allows employers that
sponsor a postretirement plan providing a qualifying or eligible prescription drug benefit to receive a federal
subsidy. As permitted by FSP No. 106-1, we elected to defer recognizing the effects of the Act until authoritative
guidance on accounting for the new subsidy was issued. In May 2004, the FASB issued FSP No. 106-2 which
provides accounting guidance for this new subsidy. Management has concluded that the prescription drug benefits
provided to our Medicare-eligible retirees are actuarially equivalent based on the current interpretation of the
guidance included in the Act and accordingly, the Company adopted the provisions of FSP No. 106-2 in the second
quarter of 2005. The expected subsidy had the effect of reducing the Company’s accumulated postretirement benefit
obligation by approximately $19 million. This reduction is recognized as an actuarial gain and will be amortized
over three years. The expected subsidy will result in a reduction in interest cost of approximately $1 million in
2005. As required by the FSP, the Company recognized a total $3.7 million reduction in postretirement benefit
expense in the second quarter of 2005, including amounts attributable to the first quarter of 2005.

     Employee Stock-Based Compensation. We account for our employee stock-based compensation plans using the
intrinsic value method under Accounting Principles Board (“APB”) Opinion No. 25, “Accounting for Stock Issued
to Employees.” We apply the disclosure provisions of SFAS No. 123, “Accounting for Stock-Based
Compensation,” as amended by SFAS No. 148, “Accounting for Stock-Based Compensation – Transition and
Disclosure.” Had compensation cost for our employee stock-based compensation been recognized based on the fair
value method, consistent with the provisions of SFAS No. 123, net income and earnings per share would have been
as follows:

                                                               Quarter Ended              Six Months Ended
                                                               September 30,                September 30,
(In millions, except per share amounts)                      2004         2003           2004          2003
Net income, as reported                              $         86.1    $   156.5     $   249.7     $ 312.1
Compensation expense, net of tax:
  APB Opinion No. 25 expense included in net
    income                                                      1.6          2.0            3.0             2.8
  SFAS No. 123 expense                                        (15.5)       (23.8)         (23.1)          (50.5)
Pro forma net income                                 $         72.2    $   134.7     $    229.6      $    264.4

Earnings per share:
  Diluted – as reported                              $         0.29    $    0.53     $     0.84      $     1.05
  Diluted – pro forma                                          0.25         0.45           0.78            0.89
  Basic – as reported                                          0.29         0.54           0.85            1.08
  Basic – pro forma                                            0.25         0.46           0.79            0.91

      SFAS No. 123 compensation expense, as indicated in the above table, decreased in the second quarter and the
first half of 2005 compared to the same periods a year ago. The decrease is primarily attributable to accelerated
vesting of substantially all unvested stock options outstanding during the fourth quarter of 2004. SFAS No. 123

                                                         7
McKESSON CORPORATION

                                          FINANCIAL NOTES (Continued)
                                                  (Unaudited)

compensation expense is typically amortized over the related vesting period; as a result, these fully vested stock
options did not have an impact on the expense during the quarter and the six months ended September 30, 2004.
Partially offsetting this decrease, during the first quarter of 2005, we granted 6.0 million stock options that vest on or
before March 31, 2005 and have a seven year term. Historically, options granted by the Company generally vest
over four years and have a term of ten years.


2.   Acquisitions

    On April 1, 2004, we acquired all of the issued and outstanding shares of Moore Medical Corp. (“MMC”), of
New Britain, Connecticut, for an aggregate cash purchase price of approximately $37 million. MMC is an Internet-
enabled, multi-channel marketer and distributor of medical-surgical and pharmaceutical products to non-hospital
provider settings. Approximately $22 million of the purchase price has been assigned to goodwill, none of which is
deductible for tax purposes. The results of MMC’s operations have been included in the condensed consolidated
financial statements within our Medical-Surgical Solutions segment since the acquisition date.

    We also completed several smaller acquisitions within our Medical-Surgical Solutions and Provider
Technologies segments.

     Purchase prices have been allocated based on estimated fair values at the date of acquisition and may be subject
to change. Pro forma results of operations have not been presented for any of the above acquisitions as the effects
were not material to the condensed consolidated financial statements on either an individual or aggregate basis.


3.   Restructuring Activities

    Net charges from restructuring activities for the quarter and the six months ended September 30, 2004 were
$0.5 million and $1.1 million. These charges primarily related to a number of smaller initiatives as well as
adjustments for prior years’ restructuring plans due to a change in estimated costs to complete these activities.

     The following table summarizes restructuring activities for the six months ended September 30, 2004:

                                   Pharmaceutical         Medical-Surgical         Provider
                                       Solutions             Solutions           Technologies        Corporate
                                              Exit-                 Exit-                 Exit-
(In millions)                    Severance Related      Severance Related     Severance Related       Severance Total
                                 $ 0.4 $ 5.2            $   1.7 $      1.9    $    0.2 $    1.9      $   10.5 $ 21.8
Balance, March 31, 2004
Current year expenses                -          0.2         0.7        -           -        -              -      0.9
Adjustments to prior years’
                                      -         0.4         (0.2)      -            -         -            -         0.2
   expenses
   Net expense for the period         -         0.6          0.5       -            -         -            -         1.1
Liabilities related to the MMC
   acquisition                        -         -            4.0       -            -         -            -       4.0
Cash expenditures                    (0.3)     (2.2)        (2.1)     (0.4)         -        (0.3)        (9.6)  (14.9)
                                 $    0.1 $     3.6     $    4.1 $     1.5    $     0.2 $     1.6    $     0.9 $ 12.0
Balance, September 30, 2004

    Accrued restructuring liabilities are included in other liabilities in the accompanying condensed consolidated
balance sheets. In connection with the April 2004 acquisition of MMC, we recorded $4.0 million of liabilities for
employee severance costs.

     In addition to the above restructuring activities, we are still managing a 2001/2000 restructuring plan associated
with customer settlements for the discontinuance of overlapping and nonstrategic products and other product
development projects within our Provider Technologies segment. Customer settlement allowances, which are
included as a reduction of accounts receivable in the accompanying condensed consolidated balance sheets, were
reduced by $0.5 million in non-cash settlements during the first half of 2005 to $5.7 million at September 30, 2004
from $6.2 million at March 31, 2004. Total cash and non-cash settlements of $45.3 million and $95.5 million have

                                                            8
McKESSON CORPORATION

                                              FINANCIAL NOTES (Continued)
                                                      (Unaudited)

been incurred since the inception of this restructuring plan. Non-cash settlements represent write-offs of customer
receivables. There have been no significant offsetting changes in estimates that increased the provision for customer
settlements. During the second quarter of 2004, $19.7 million of the allowance was reversed into operating
expenses due to favorable settlements and continued negotiations with affected customers. At March 31, 2004, we
substantially completed our negotiations with the affected customers. As a result, we do not anticipate additional
significant increases to the allowance for customer settlements. However, as settlement negotiations with the
remaining customers are finalized, additional adjustments to the reserve may be necessary.


4.   Pension and Other Postretirement Benefit Plans

    The following table provides the components of the net periodic expense for the Company’s defined benefit
pension and postretirement plans:

                                          Quarter Ended September 30,              Six Months Ended September 30,
                                          Pension         Postretirement             Pension         Postretirement
(In millions)                          2004     2003        2004    2003          2004      2003      2004     2003
Service cost – benefits earned
                                  $     1.4 $     1.6     $   0.5   $   0.5   $     2.8 $     3.2    $    1.0 $    1.0
  during the period
Interest cost on projected benefit
   obligation                            6.4       6.8        2.4       2.9        12.8      13.6         5.3      5.8
Expected return on assets               (7.4)     (6.4)       -         -         (14.8)    (12.8)        -        -
Amortization of unrecognized loss
                                        2.2       3.0         3.9       5.8         4.4       6.0        11.0     11.6
   and prior service costs
Immediate recognition of pension
                                        -         -           -         -          0.7       -            -        -
   cost
Settlements and other                   -         -           -         -         16.6       -            -        -
Net periodic expense               $    2.6 $     5.0     $   6.8   $   9.2   $   22.5 $    10.0     $   17.3 $   18.4

     We adopted the provisions of FSP No. 106-2 in the second quarter of 2005. The expected subsidy had the
effect of reducing the Company’s accumulated postretirement benefit obligation by approximately $19 million. This
reduction is recognized as an actuarial gain and will be amortized over three years. The expected subsidy will result
in a reduction in interest cost of approximately $1 million in 2005. As required by the FSP, the Company
recognized a total $3.7 million reduction in postretirement benefit expense in the second quarter of 2005, including
amounts attributable to the first quarter of 2005.

     During the quarter ended June 30, 2004, we made several lump sum payments totaling approximately $42
million from an unfunded U.S. pension plan. In accordance with SFAS No. 88, “Employers’ Accounting for
Settlements and Curtailments of Defined Benefit Pension Plans and for Termination Benefits”, approximately $12
million in settlement charges associated with these payments were expensed in the first quarter of 2005.
Substantially all of this expense was recorded in the Corporate segment.


5.   Income Taxes

     Income tax expense for the second quarter of 2005 reflects a $6.4 million income tax benefit which was
primarily due to a reduction of a portion of a valuation allowance related to state income tax net operating loss
carryforwards. We believe that the income tax benefit from a portion of these state net operating loss carryforwards
will now be realized.

     During the first quarter of 2005, we sold a business for net cash proceeds of $12.3 million. The disposition
resulted in a pre-tax loss of $1.1 million and an after-tax loss of $4.6 million. The after-tax loss on the disposition
was the result of a lower tax adjusted cost basis for the business. Financial results for this business were included in
our Pharmaceutical Solutions segment and were not material to our condensed consolidated financial statements.
Partially offsetting the tax impact of this disposition, a net income tax benefit of $2.2 million relating to favorable
tax settlements and adjustments was recorded.


                                                              9
McKESSON CORPORATION

                                          FINANCIAL NOTES (Continued)
                                                  (Unaudited)

     Income tax expense for the second quarter of 2004 includes an income tax benefit of $15.3 million relating to
favorable tax settlements with the U.S. Internal Revenue Service. These settlements pertain to amended tax returns
for the years ended December 31, 1997 and 1998 filed by our subsidiary, McKesson Information Solutions LLC,
formerly known as HBO & Company. The benefit of these tax assets was not previously recognized by the
Company.


6.   Earnings Per Share

     Basic earnings per share is computed by dividing net income by the weighted average number of common
shares outstanding during the reporting period. Diluted earnings per share is computed similarly except that it
reflects the potential dilution that could occur if dilutive securities or other obligations to issue common stock were
exercised or converted into common stock.

     The computations for basic and diluted earnings per share are as follows:

                                                              Quarter Ended                   Six Months Ended
                                                              September 30,                     September 30,
(In millions, except per share amounts)                     2004         2003                2004          2003
Net income                                             $      86.1    $   156.5         $    249.7     $ 312.1
Interest expense on convertible junior subordinated
  debentures, net of tax benefit                                  1.6          1.6             3.1               3.1
Net income – diluted                                   $         87.7   $    158.1      $    252.8        $    315.2

Weighted average common shares outstanding:
Basic                                                           292.8        289.9           292.1             289.9
Effect of dilutive securities:
  Options to purchase common stock                                1.6          4.5             2.4               3.3
  Convertible junior subordinated debentures                      5.4          5.4             5.4               5.4
  Restricted stock                                                0.2          0.5             0.2               0.6
Diluted                                                         300.0        300.3           300.1             299.2

Earnings per common share:
  Basic                                                $         0.29   $        0.54   $     0.85        $     1.08
  Diluted                                              $         0.29   $        0.53   $     0.84        $     1.05

    Approximately 40 million and 38 million stock options were excluded from the computations of diluted net
earnings per share for the quarters ended September 30, 2004 and 2003 as their exercise price was higher than the
Company’s average stock price. For the six months ended September 30, 2004 and 2003, the number of stock
options excluded was approximately 40 million and 32 million.


7.   Goodwill and Other Intangible Assets

     Changes in the carrying amount of goodwill for the six months ended September 30, 2004 are as follows:

                                            Pharmaceutical Medical-Surgical   Provider
                                              Solutions       Solutions     Technologies                      Total
(In millions)
                                            $       297.7 $          725.2 $      382.9               $       1,405.8
Balance, March 31, 2004
Goodwill acquired                                      1.2            22.2          3.5                          26.9
Sale of business                                     (10.3)            -            -                           (10.3)
Translation adjustments                                0.1             -            3.9                           4.0
                                            $       288.7 $          747.4 $      390.3               $       1,426.4
Balance, September 30, 2004


                                                           10
McKESSON CORPORATION

                                         FINANCIAL NOTES (Continued)
                                                 (Unaudited)

     Information regarding other intangibles is as follows:

                                                                                   September 30,        March 31,
                                                                                       2004              2004
(In millions)
Customer lists                                                                     $      100.9       $      92.9
Technology                                                                                 63.3              61.2
Trademarks and other                                                                       26.5              23.8
  Total other intangibles, gross                                                          190.7             177.9
Accumulated amortization                                                                 (104.9)            (93.5)
  Total other intangibles, net                                                     $       85.8       $      84.4

    Amortization expense of other intangibles was $5.4 million and $11.6 million for the quarter and six months
ended September 30, 2004 and $5.1 million and $9.7 million for the comparable prior year periods. The weighted
average remaining amortization periods for customer lists, technology and trademarks and other intangible assets at
September 30, 2004 were: 8 years, 4 years and 5 years. Estimated future annual amortization expense of these
assets is as follows: $21.1 million, $16.0 million, $15.6 million, $12.0 million and $5.9 million for 2005 through
2009, and $9.0 million thereafter. At September 30, 2004, there were $17.8 million of other intangibles not subject
to amortization.


8.   Financing Activities

    In September 2004, we entered into a $1.3 billion five-year, senior unsecured revolving credit facility.
Borrowings under the new credit facility bear interest at a fixed base rate, or a floating rate based on the British
Banker’s Association LIBOR rate or a Eurodollar rate. Effective as of the closing date of the new credit facility
agreement, we terminated the commitments under our existing $550 million, three-year revolving credit facility that
would have expired in September 2005, as well as our $650 million, 364-day credit facility that would have expired
on September 28, 2004.

    In June 2004, we renewed our committed revolving receivables sale facility under substantially similar terms to
those previously in place, with the exception that the facility was increased by $300.0 million to $1.4 billion. The
renewed facility expires in June 2005.

     At September 30, 2004 and March 31, 2004, no amounts were outstanding or utilized under any of the facilities.
In addition, in 2005 and 2004, we sold customer lease receivables for cash proceeds of $38.5 million and $35.2
million. The sale of these receivables resulted in a pre-tax gain of $0.2 million and $2.5 million which is included in
Other Income, Net in the condensed consolidated statement of operations.


9.   Convertible Junior Subordinated Securities

     In February 1997, we issued 5% Convertible Junior Subordinated Debentures (the “Debentures”) in an
aggregate principal amount of $206,186,000. The Debentures, which are included in long-term debt, mature on June
1, 2027, bear interest at an annual rate of 5%, payable quarterly, and are currently redeemable by us at 101.5% of the
principal amount. The Debentures were purchased by the Trust, which is wholly owned by the Company, with
proceeds from its issuance of four million shares of preferred securities to the public and 123,720 common securities
to us. These preferred securities are convertible at the holder’s option into the Company’s common stock. The
Debentures represent the sole assets of the Trust.

     Holders of the preferred securities are entitled to cumulative cash distributions at an annual rate of 5% of the
liquidation amount of $50 per security. Each preferred security is convertible at the rate of 1.3418 shares of the
Company’s common stock, subject to adjustment in certain circumstances. The preferred securities will be
redeemed upon repayment of the Debentures and are callable by us on or after March 4, 2000, in whole or in part,
initially at 103.5% of the liquidation preference per share, and thereafter at prices declining at 0.5% per annum to
100% of the liquidation preference on and after March 4, 2007 plus, in each case, accumulated, accrued and unpaid
distributions, if any, to the redemption date.

                                                          11
McKESSON CORPORATION

                                         FINANCIAL NOTES (Continued)
                                                 (Unaudited)

     We have guaranteed, on a subordinated basis, distributions and other payments due on the preferred securities
(the “Guarantee”). The Guarantee, when taken together with our obligations under the Debentures, and in the
indenture pursuant to which the Debentures were issued, and our obligations under the Amended and Restated
Declaration of Trust governing the Trust, provides a full and unconditional guarantee of amounts due on the
preferred securities.


10. Financial Guarantees and Warranties

    Financial Guarantees

     We have agreements with certain of our customers’ financial institutions under which we have guaranteed the
repurchase of inventory (primarily for our Canadian businesses), at a discount, in the event these customers are
unable to meet certain obligations to those financial institutions. Among other limitations, these inventories must be
in resalable condition. We have also guaranteed loans and the payment of leases for some customers; and we are a
secured lender for substantially all of these guarantees. Customer guarantees range from one to ten years and were
primarily provided to facilitate financing for certain strategic customers. At September 31, 2004, the maximum
amounts of inventory repurchase guarantees and other customer guarantees were approximately $163 million and
$14 million of which a nominal amount has been accrued.

     During the second quarter of 2004, one of our Pharmaceutical Solutions customers announced its bankruptcy.
Accordingly, we reviewed all amounts owed to us from this customer as well as financial guarantees provided to
third parties in favor of this customer, and as a result, we increased our provision for doubtful accounts by $30.0
million. During the first quarter of 2005, we converted a $40.0 million credit facility guarantee in favor of this
customer, who had recently emerged from bankruptcy, to a note receivable due from this customer. The secured
note bears interest and is repayable in various installments through 2007.

    At September 30, 2004, we had commitments of $10.2 million, primarily consisting of the purchase of services
from our equity-held investments, for which no amounts had been accrued.

    In addition, our banks and insurance companies have issued $87.2 million of standby letters of credit and surety
bonds on our behalf in order to meet the security requirements for statutory licenses and permits, court and fiduciary
obligations, and our workers’ compensation and automotive liability programs.

     Our software license agreements generally include certain provisions for indemnifying customers against
liabilities if our software products infringe a third party’s intellectual property rights. To date, we have not incurred
any material costs as a result of such indemnification agreements and have not accrued any liabilities related to such
obligations.

     In conjunction with certain transactions, primarily divestitures, we may provide routine indemnification
agreements (such as retention of previously existing environmental, tax and employee liabilities) whose terms vary
in duration and often are not explicitly defined. Where appropriate, obligations for such indemnifications are
recorded as liabilities. Because the amounts of these indemnification obligations often are not explicitly stated, the
overall maximum amount of these commitments cannot be reasonably estimated. Other than obligations recorded as
liabilities at the time of divestiture, we have historically not made significant payments as a result of these
indemnification provisions.

    Warranties

     In the normal course of business, we provide certain warranties and indemnification protection for our products
and services. For example, we provide warranties that the pharmaceutical and medical-surgical products we
distribute are in compliance with the Food, Drug and Cosmetic Act and other applicable laws and regulations. We
have received the same warranties from our suppliers, who customarily are the manufacturers of the products. In
addition, we have indemnity obligations to our customers for these products, which have also been provided to us
from our suppliers, either through express agreement or by operation of law.


                                                           12
McKESSON CORPORATION

                                        FINANCIAL NOTES (Continued)
                                                (Unaudited)

     We also provide warranties regarding the performance of software and automation products we sell. Our
liability under these warranties is to bring the product into compliance with previously agreed upon specifications.
For software products, this may result in additional project costs which are reflected in our estimates used for the
percentage-of-completion method of accounting for software installation services within these contracts. In
addition, most of our customers who purchase our software and automation products also purchase annual
maintenance agreements. Revenue from these maintenance agreements is recognized on a straight-line basis over
the contract period and the cost of servicing product warranties is charged to expense when claims become
estimable. Accrued warranty costs were not material to the condensed consolidated balance sheets.


11. Other Commitments and Contingent Liabilities

    In our annual report on Form 10-K for the year ended March 31, 2004, and in our quarterly report on Form 10-
Q for the quarter ended June 30, 2004, we reported on numerous legal proceedings. Since that quarterly report, the
only significant developments were as follows:

    I. Other Litigation

     On October 18, 2004, in the previously reported action captioned Charlene Roby vs. McKesson HBOC, Inc. et
al, (Action No. CV01-573), the trial court awarded plaintiff, in addition to the amounts previously reported,
approximately $0.7 million in attorneys fees. We will seek reduction or reversal of this incremental award on
appeal, as is our intent with respect to the entire judgment. As previously reported, if our appeal from the entire
judgment in this matter is unsuccessful, the judgment could have an adverse impact on our consolidated financial
statements.

    II. Contingency

    As discussed in our annual report on Form 10-K for the year ended March 31, 2004, in 2002, we entered into a
$500 million, ten year contract with the National Health Services Information Authority (“NHS”), an organization of
the British government charged with the responsibility of delivering healthcare in England and Wales. The contract
engages the Company to develop, implement and operate a human resources and payroll system at more than 600
NHS locations.

     To date, there have been delays to this contract which have caused increased costs and a decrease in the amount
of time in which we can earn revenues. These delays have adversely impacted the contract's projected profitability
and no material revenue has yet been recognized on this contract. As of September 30, 2004, our consolidated
balance sheet includes an investment of approximately $86 million in net assets, consisting of prepaid expenses,
software and capital assets, net of cash received, related to this contract. While we believe it is likely that we can
deliver and operate an acceptable system and recover our investment in this contract, we are currently negotiating
with the NHS to amend certain key terms and conditions in the contract, and there is no certainty we will agree on
an updated implementation plan. Our goal is to complete this negotiation by the end of fiscal 2005. However, the
timing and the outcome of these negotiations is uncertain and failure to reach agreement on an updated
implementation plan and amend certain key contract terms and conditions, and/or further delays in the
implementation may result in losses that could be material. Even if we agree on amended contract terms and
conditions and an updated implementation plan, it is possible that the terms of that agreement may result in the
impairment of our net assets related to the contract as well as substantial penalties and charges, which could have a
material adverse impact on our consolidated financial statements.


                                                         13
McKESSON CORPORATION

                                        FINANCIAL NOTES (Continued)
                                                (Unaudited)

12. Stockholders’ Equity

     Comprehensive income is as follows:

                                                              Quarter Ended                   Six Months Ended
                                                              September 30,                     September 30,
                                                            2004         2003                2004          2003
(In millions)
Net income                                          $         86.1    $   156.5         $      249.7   $    312.1
Unrealized gain (loss) on marketable securities and
  investments, net of income taxes                              (0.1)           0.2             (0.1)            0.2
Additional minimum pension liability, net of income
  taxes                                                         (4.1)          -               (4.1)             -
Foreign currency translation adjustments                        31.8         (11.2)            25.1             22.3
  Comprehensive income                              $          113.7    $    145.5      $     270.6      $     334.6

     During the second quarter of 2005, the Company’s Board of Directors (the “Board”) approved a plan to renew
the common stock rights plan, which was scheduled to expire in the third quarter of 2005. Under the renewal of the
plan, effective October 22, 2004, the Board declared a dividend distribution of one right (a “Right”) for each
outstanding share of Company common stock. Each Right entitles the holder to purchase, upon the occurrence of
certain triggering events, a unit consisting of one one-hundredth of a share of Series A Junior Participating Preferred
Stock. Triggering events include, without limitation, the acquisition by another entity of 15% or more of the
Company’s common stock without the prior approval of the Board. The Rights have certain anti-takeover effects
that will cause substantial dilution to the ownership interest of a person or group that attempts to acquire the
Company on terms not approved by the Board. The new Rights will expire in 2014, unless the date is extended or
the Rights redeemed or exchanged earlier by the Board.


13. Segment Information

    In April 2004, we reconfigured our operating segments to better align product development and selling efforts
with the evolving needs of the healthcare market. As a result, commencing in the first quarter of 2005, we are
reporting the following three operating segments: Pharmaceutical Solutions, Medical-Surgical Solutions and
Provider Technologies. Prior period amounts have been reclassified to conform to the 2005 segment presentation.
We evaluate the performance of our operating segments based on operating profit before interest expense, income
taxes and results from discontinued operations. Our Corporate segment includes expenses associated with Corporate
functions and projects. Corporate expenses are allocated to the operating segments to the extent that these items can
be directly attributable to the segment.

    The Pharmaceutical Solutions segment distributes ethical and proprietary drugs and health and beauty care
products throughout North America. This segment also manufactures and sells automated pharmaceutical
dispensing systems for retail pharmacies, medical management and pharmaceutical solutions for biotech and
pharmaceutical manufacturers, patient and payor services, and consulting and outsourcing services to pharmacies.
We have added the Clinical Auditing and Compliance business, which was previously included in our former
Information Solutions segment, to this segment’s expanded payor services business. This business sells software to
payors for auditing professional claims.

     The Medical-Surgical Solutions segment distributes medical-surgical supplies and equipment and provides
logistics and related services within the United States. This segment now includes Zee Medical, which was formerly
included in our Pharmaceutical Solutions segment. Zee Medical provides first aid and safety products and training
services to corporate customers. The operating results of this segment for the quarter and the six months ended
September 30, 2004 also reflect the impact of the acquisition of MMC.

     The Provider Technologies segment consists of the former Information Solutions segment plus the McKesson
Inpatient Automation business, which was previously included in our Pharmaceutical Solutions segment, and the
Corporate Solutions group, which was previously managed by our Corporate group. This segment continues to
deliver enterprise-wide patient care, clinical, financial, supply chain, managed care and strategic management

                                                          14
McKESSON CORPORATION

                                            FINANCIAL NOTES (Concluded)
                                                    (Unaudited)

software solutions as well as outsourcing and other services to healthcare organizations throughout North America,
the United Kingdom and Europe. McKesson Inpatient Automation provides automation and robotics for the
hospital market, and the Corporate Solutions group continues to be responsible for the sales coordination of complex
provider engagements that include strategic product and service solutions from multiple business units. Expenses
incurred by Corporate Solutions on behalf of other business segments are allocated to the applicable business
segments.

     Financial information relating to our segments is as follows:

                                                                    Quarter Ended                     Six Months Ended
                                                                    September 30,                       September 30,
(In millions)                                                     2004         2003                  2004          2003
Revenues
Pharmaceutical Solutions                                     $ 18,916.8        $ 15,782.6        $ 37,096.5        $ 31,326.0
Medical-Surgical Solutions                                        713.5             716.1           1,420.7           1,426.2
Provider Technologies                                             304.0             311.4             603.7             582.1
     Total                                                   $ 19,934.3        $ 16,810.1        $ 39,120.9        $ 33,334.3
Operating profit
Pharmaceutical Solutions (1)                                 $        150.7    $     221.7       $  441.2          $    486.7
Medical-Surgical Solutions                                             17.5           25.3           46.1                51.1
Provider Technologies                                                  19.2           37.2           33.5                41.9
     Total                                                            187.4          284.2          520.8               579.7
Corporate (2)                                                         (43.6)         (42.0)        (101.3)              (74.0)
Interest expense                                                      (30.2)         (30.0)         (59.8)              (59.8)
Income before income taxes                                   $        113.6    $     212.2       $ 359.7           $    445.9

                                                                                              September 30,        March 31,
(In millions)                                                                                     2004              2004
Segment assets, at period end
Pharmaceutical Solutions                                                                    $ 13,440.6         $       12,050.5
Medical-Surgical Solutions                                                                     1,638.5                  1,539.2
Provider Technologies                                                                          1,371.5                  1,402.7
    Total                                                                                     16,450.6                 14,992.4
Corporate
  Cash, cash equivalents, and marketable securities                                            1,005.4                    717.8
  Other                                                                                          509.7                    530.0
    Total                                                                                   $ 17,965.7         $       16,240.2

(1) Operating profit for the first half of 2005 includes $41.2 million received as our share of a settlement of an antitrust class
    action lawsuit involving a drug manufacturer. This settlement was recorded as a credit in cost of sales within our
    Pharmaceutical Solutions segment in our condensed consolidated statements of operations.
(2) Corporate expenses for the first half of 2005 include pension settlement charges as discussed in Financial Note 4. Corporate
    expenses for the first half of 2004 include an $8.5 million gain on the sale of a surplus property.


                                                                 15
McKESSON CORPORATION

                                                  FINANCIAL REVIEW
                                                      (Unaudited)

Item 2. Management’s Discussion and Analysis of Results of Operations and Financial Condition

Financial Overview

                                                  Quarter Ended                            Six Months Ended
                                                  September 30,                              September 30,
(Dollars in millions, except per
  share data)                          2004               2003         Change        2004              2003      Change
Revenues                            $ 19,934.3         $ 16,810.1         19%   $   39,120.9    $     33,334.3     17%
Net Income                                86.1              156.5        (45)          249.7             312.1    (20)
Diluted Earnings Per Share          $     0.29         $     0.53        (45)   $       0.84    $         1.05    (20)

     Revenues for the quarter ended September 30, 2004 grew 19% to $19.9 billion, net income decreased 45% to
$86.1 million and diluted earnings per share decreased 45% to $0.29 compared to the same period a year ago. For
the six months ended September 30, 2004, revenue increased 17% to $39.1 billion, net income decreased 20% to
$249.7 million and diluted earnings per share decreased 20% to $0.84 compared to the first half of 2004. Decreases
in net income and diluted earnings per share primarily reflect lower operating profit in our Pharmaceutical Solutions
segment due to a decline in volume-weighted price increases for U.S. pharmaceutical products.

Results of Operations

     Revenues:

                                                      Quarter Ended                      Six Months Ended
                                                      September 30,                        September 30,
(Dollars in millions)                       2004            2003       Change       2004         2003     Change
Pharmaceutical Solutions
 U.S. Healthcare direct distribution and
  services                               $ 11,637.9     $    9,655.0      21%   $   22,649.2   $ 18,990.0        19%
 U.S. Healthcare sales to customers’
  warehouses                                6,021.1          5,057.6      19        11,937.3        10,222.0     17
          Subtotal                         17,659.0         14,712.6      20        34,586.5        29,212.0     18
 Canada distribution and services           1,257.8          1,070.0      18         2,510.0         2,114.0     19
     Total Pharmaceutical Solutions        18,916.8         15,782.6      20        37,096.5        31,326.0     18
Medical-Surgical Solutions                   713.5            716.1        -         1,420.7         1,426.2       -
Provider Technologies
 Software and software systems               50.0               67.5     (26)          100.6        113.1        (11)
 Services                                   228.5              216.6       5           450.7        420.9          7
 Hardware                                    25.5               27.3      (7)           52.4         48.1          9
     Total Provider Technologies            304.0              311.4      (2)          603.7        582.1          4
Total Revenues                         $ 19,934.3       $   16,810.1      19    $   39,120.9   $ 33,334.3         17

    Revenues increased by 19% to $19.9 billion and 17% to $39.1 billion during the quarter and six months ended
September 30, 2004 compared to the same periods a year ago. The increase reflects growth in our Pharmaceutical
Solutions segment, which accounted for over 94% of consolidated revenues.

     Increases in U.S. Healthcare pharmaceutical direct distribution and services revenues primarily reflect market
growth rates as well as new institutional customers in our pharmaceutical distribution business and growth from our
existing customers. Market growth rates reflect growing drug utilization and price increases, offset in part by the
increased use of lower priced generics. In May 2004, we began implementation on a new pharmaceutical
distribution contract with the Department of Veterans Affairs, which significantly contributed to the segment’s total
increase in revenues. Annual revenues on this contract are expected to exceed $3.5 billion. U.S. Healthcare sales to
customers’ warehouses also increased primarily as a result of greater volume to, and expanded agreements with,
existing customers. Sales to customers’ warehouses include the implementation of the AdvancePCS business
acquired by our customer, Caremark, which began in the second quarter of 2005.


                                                              16
McKESSON CORPORATION
                                       FINANCIAL REVIEW (Continued)
                                               (Unaudited)

     Canadian pharmaceutical distribution revenues increased reflecting market growth rates, favorable exchange
rates and new business as certain manufacturers transition from direct distribution activities. On a constant currency
basis, second quarter and first half 2005 revenues from our Canadian operations would have increased
approximately 11% and 14% compared to the same periods a year ago.

     Medical-Surgical Solutions segment revenues were flat as growth in revenues in the alternate site sector was
offset by a decline in revenues in the acute care sector. Increases in our alternate site sector include revenues
derived from our recent acquisition of Moore Medical Corporation (“MMC”). On April 1, 2004, we acquired all of
the issued and outstanding shares of MMC, of New Britain, Connecticut, for an aggregate cash purchase price of
approximately $37 million. MMC is an Internet-enabled, multi-channel marketer and distributor of medical-surgical
and pharmaceutical products to non-hospital provider settings. Declines in our acute care sector reflect the transition
of the loss of the segment’s largest customer which began in the third quarter of the prior year.

    Provider Technologies segment revenues declined slightly during the quarter primarily reflecting a reduction in
software and software systems revenues due to the complexity and time required for clinical system
implementations, which slow the rate at which the related revenue is recognized. On a year-to-date basis, Provider
Technologies segment revenues increased primarily reflecting greater demand for our clinical application offerings.

    Gross Profit:

                                                Quarter Ended                            Six Months Ended
                                                September 30,                              September 30,
(Dollars in millions)                 2004             2003      Change           2004           2003        Change
Gross Profit
  Pharmaceutical Solutions       $      431.8     $     508.9      (15)%     $       992.2    $   1,027.1       (3)%
  Medical-Surgical Solutions            161.9           151.3        7               320.6          297.3        8
  Provider Technologies                 141.3           151.5       (7)              274.2          273.8        -
     Total                       $      735.0     $     811.7       (9)      $     1,587.0    $   1,598.2       (1)
Gross Profit Margin
  Pharmaceutical Solutions             2.28%            3.22%      (94) bp          2.67%          3.28%       (61) bp
  Medical-Surgical Solutions          22.69            21.13       156             22.57          20.85        172
  Provider Technologies               46.48            48.65      (217)            45.42          47.04       (162)
    Total                              3.69             4.83      (114)             4.06           4.79        (73)

     Gross profit for the second quarter and first half of 2005 decreased 9% and 1%. As a percentage of revenues,
gross profit margin decreased 114 basis points to 3.69% for the second quarter of 2005 and 73 basis points to 4.06%
for the first half of 2005 primarily reflecting a higher proportion of revenues attributable to our Pharmaceutical
Solutions segment, which has lower margins relative to our other segments, as well as a decline in this segment’s
gross margin. Gross profit margin increased in our Medical-Surgical Solutions segment primarily due to a higher
proportion of revenues being derived from our alternate site sector, which has higher margins relative to the
segment’s other sectors. Gross profit margin declined in our Provider Technologies segment primarily reflecting a
lower proportion of software and software systems revenues, which have higher margins relative to the segment’s
other revenues.

    During the second quarter and first half of 2005, gross margin for our Pharmaceutical Solutions segment was
impacted by:

    •    lower manufacturer price increases in the second quarter of 2005 for U.S. pharmaceutical products. While
         the magnitude of price increases that have been realized this year is comparable to the prior year, the
         number of volume-weighted U.S. pharmaceutical price increases in the second quarter of 2005 was at the
         lowest level since the second quarter of 2001.

         We have been actively working with manufacturers to restructure our distribution agreements to ensure that
         we are appropriately compensated for the services we provide and reduce our dependency on price
         inflation-based compensation. With many agreements already signed, we intend to substantially complete
         the process by the goal of the fiscal year end, March 31, 2005. While these new fee-for-service agreements
         are beginning to be used by certain manufacturers, our compensation from the largest manufacturers will


                                                          17
McKESSON CORPORATION
                                          FINANCIAL REVIEW (Continued)
                                                  (Unaudited)

         likely continue to be highly dependent on the level and timing of price increases through the end of fiscal
         2005,

    •    certain types of vendor product incentives and sources of supply, such as certain inventory purchases in the
         secondary market, are no longer available at historical levels to the major distributors, which has the impact
         of reducing gross margins. Much of this change results from the manufacturers’ desire to limit the amount
         of inventory in the wholesale channel,

    •    lower selling margins within our U.S. Pharmaceutical distribution business which reflect competitive
         pricing pressure, and a higher proportion of revenues attributed to institutional customers,

    •    partially offsetting the above decreases, the benefit of increased sales of generic drugs with higher margins,

    •    a higher proportion of supplier cash discounts to revenues reflecting a change in customer mix, and

    •    a last-in, first-out (“LIFO”) inventory credit of $10.0 million, reflecting the lower number of volume-
         weighted U.S. pharmaceutical price increases in the second quarter of 2005 and our expectation of a LIFO
         credit for the full fiscal year.

    During the first half of 2005, gross profit for our Pharmaceutical Solutions segment was also impacted by a
reduction in cost of sales due to a receipt of $41.2 million of cash proceeds representing our share of a settlement of
an antitrust class action lawsuit brought against a drug manufacturer.

     Our Pharmaceutical Solutions segment uses the LIFO method of accounting for the majority of its inventories,
which results in cost of sales that more closely reflects replacement cost than do other accounting methods, thereby
mitigating the effects of inflation and deflation on gross profit. The practice in the Pharmaceutical Solutions
distribution business is to pass on to customers published price changes from suppliers. Manufacturers generally
provide us with price protection, which prevents inventory losses. Price declines on many generic pharmaceutical
products in this segment over the last few years have moderated the effects of inflation in other product categories,
which resulted in minimal overall price changes in those years.

    Operating Expenses and Other Income:

                                                   Quarter Ended                            Six Months Ended
                                                   September 30,                              September 30,
(Dollars in millions)                    2004             2003     Change         2004              2003       Change
Operating Expenses
  Pharmaceutical Solutions           $    286.9      $    294.0      (2)%     $     562.3       $     553.1      2%
  Medical-Surgical Solutions              145.1           126.6      15             276.2             248.0     11
  Provider Technologies                   124.8           118.5       5             244.6             238.2      3
  Corporate                                49.4            45.5       9             114.3              80.2     43
     Total                           $    606.2      $    584.6       4       $   1,197.4       $   1,119.5      7

Operating Expenses as a Percentage
 of Revenue
 Pharmaceutical Solutions                  1.52%           1.86%    (34) bp           1.52%           1.77%    (25) bp
 Medical-Surgical Solutions               20.34           17.68     266              19.44           17.39     205
 Provider Technologies                    41.05           38.05     300              40.52           40.92     (40)
    Total                                  3.04            3.48     (44)              3.06            3.36     (30)

Other Income, Net
  Pharmaceutical Solutions           $      5.8      $      6.8     (15)%     $      11.3       $      12.7    (11)%
  Medical-Surgical Solutions                0.7             0.6      17               1.7               1.8     (6)
  Provider Technologies                     2.7             4.2     (36)              3.9               6.3    (38)
  Corporate                                 5.8             3.5      66              13.0               6.2    110
    Total                            $     15.0      $     15.1      (1)      $      29.9       $      27.0     11

     Operating expenses increased 4% to $606.2 million in the second quarter of 2005 and 7% to $1,197.4 million in
the first half of 2005. As a percentage of revenues, operating expenses decreased 44 and 30 basis points to 3.04%

                                                            18
McKESSON CORPORATION
                                          FINANCIAL REVIEW (Continued)
                                                  (Unaudited)

and 3.06% for the second quarter and first half of 2005. Increases in operating expense dollars were primarily due
to additional costs to support our sales volume growth, including expenses from the recently acquired MMC
business, incremental shareholder litigation costs and $7.4 million of other litigation reserves. In addition, operating
expenses for the first half of 2005 included approximately $12 million of settlement charges pertaining to a non-
qualified pension plan. In 2004, operating expenses included a $30.0 million bad debt provision, $9.8 million in
severance charges and a credit of $19.7 million pertaining to the reversal of our customer settlement reserves due to
favorable settlements and negotiations with affected customers. Operating expenses for the six months ended
September 30, 2003 also benefited from an $8.5 million gain on the sale of a surplus property. As a percentage of
revenues, operating expenses decreased primarily due to the leveraging of our fixed cost infrastructure and
productivity improvements in back-office and field operations within our Pharmaceutical Solutions segment. Other
income approximated that of the prior year.

    Segment Operating Profit and Corporate Expenses:

                                                    Quarter Ended                                  Six Months Ended
                                                    September 30,                                    September 30,
(Dollars in millions)                    2004              2003        Change            2004              2003       Change
Segment Operating Profit (1)
  Pharmaceutical Solutions          $      150.7      $     221.7        (32) %     $     441.2        $     486.7       (9) %
  Medical-Surgical Solutions                17.5             25.3        (31)              46.1               51.1      (10)
  Provider Technologies                     19.2             37.2        (48)              33.5               41.9      (20)
     Total                                 187.4            284.2        (34)             520.8              579.7      (10)
Corporate Expenses                         (43.6)           (42.0)         4             (101.3)             (74.0)      37
Interest Expense                           (30.2)           (30.0)         1              (59.8)             (59.8)       -
Income Before Income Taxes          $      113.6      $     212.2        (46)       $     359.7        $     445.9      (19)

Segment Operating Profit Margin
  Pharmaceutical Solutions                  0.80%            1.40 %      (60) bp           1.19%              1.55%     (36) bp
  Medical-Surgical Solutions                2.45             3.53       (108)              3.24               3.58      (34)
  Provider Technologies                     6.32            11.95       (563)              5.55               7.20     (165)

(1) Segment operating profit includes gross profit, net of operating expenses and other income for our three business segments.

     Operating profit as a percentage of revenues decreased in our Pharmaceutical Solutions segment primarily
reflecting a decline in gross margins, offset in part by favorable leveraging of the segment’s fixed cost infrastructure
and productivity improvements in back-office and field operations. In addition, results for 2004 include a $30.0
million bad debt provision for a customer which filed for bankruptcy.

     Medical-Surgical Solutions segment’s operating profit as a percentage of revenues decreased primarily
reflecting an increase in gross profit margins offset by a higher proportion of operating expenses. Operating
expenses increased in both dollars as well as a percentage of revenues primarily due to the acquisition of MMC, $7.4
million of litigation reserves, as well as a higher proportion of costs incurred to serve the segment’s alternate site
customers, which have a higher cost-to-serve ratio than the segment’s other customers. During the third quarter of
2005, the segment anticipates completing an evaluation of its distribution center network as a result of its MMC
acquisition. Costs incurred in connection with the distribution network restructuring plan will either be expensed or
treated as part of the acquisition cost depending on the nature of such amounts.

    Provider Technologies segment’s operating profit as a percentage of revenues decreased primarily reflecting a
decrease in gross profit margin. In addition, operating profit for 2004 benefited from a reversal of $19.7 million of
customer settlement reserves due to favorable settlements and continued negotiations with affected customers. This
benefit was partially offset by severance charges of $9.8 million primarily in the segment’s international business.

     Corporate expenses, including other income, increased primarily reflecting $5.2 million for the quarter and
$12.1 million for the first half of legal costs due to accelerating activity in our pending securities litigation, and for
the six months ended September 30, 2004, approximately $12 million of settlement charges pertaining to a non-
qualified pension plan. During the first half of 2005, we made several lump sum cash payments totaling
approximately $42 million from an unfunded U.S. pension plan. In accordance with accounting standards,
additional charges for settlements associated with lump sum payments of pension obligations were expensed in the
period in which the payments were made. Accordingly, expenses for the first half of 2005 include charges
                                                              19
McKESSON CORPORATION
                                        FINANCIAL REVIEW (Continued)
                                                (Unaudited)

associated with these payments. In addition, expenses for the first half of 2004 benefited from an $8.5 million gain
pertaining to the sale of a surplus property.

    Interest Expense: Interest expense in 2005 approximated that of the prior comparable periods as the benefit of
lower average borrowings were almost fully offset by increases in our effective interest rate.

     Income Taxes: For the quarters ended September 30, 2004 and 2003, the Company’s effective income tax rates
were 24.2% and 26.2%. Income tax expense for the second quarter of 2005 reflects a $6.4 million income tax
benefit which was primarily due to a reduction of a portion of a valuation allowance related to state income tax net
operating loss carryforwards. We believe that the income tax benefit from a portion of these state net operating loss
carryforwards will now be realized. In addition, the Company’s effective income tax rate benefited from a higher
proportion of income being attributable to foreign countries that have lower income tax rates. Income tax expense
for the second quarter of 2004 includes an income tax benefit of $15.3 million relating to favorable tax settlements
with the U.S. Internal Revenue Service. These settlements pertain to amended tax returns for the years ended
December 31, 1997 and 1998 filed by our subsidiary, McKesson Information Solutions LLC, formerly known as
HBO & Company. The benefit of these tax assets was not previously recognized by the Company.

     For the first half of 2005 and 2004, the Company’s effective income tax rates were 30.6% and 30.0%. Income
tax expense for the first half of 2005 also reflects a business that we sold for net cash proceeds of $12.3 million. The
disposition resulted in a pre-tax loss of $1.1 million and an after-tax loss of $4.6 million. The after-tax loss on the
disposition was the result of a lower tax adjusted cost basis for the business. Partially offsetting the tax impact of
this disposition, a net income tax benefit of $2.2 million relating to favorable tax settlements and adjustments was
recorded.

    Weighted Average Diluted Shares Outstanding: Diluted earnings per share were calculated based on an average
number of diluted shares outstanding of 300.0 million and 300.3 million for the second quarters of 2005 and 2004
and 300.1 million and 299.2 million for the six months ended September 30, 2004 and 2003.


Financial Condition, Liquidity, and Capital Resources

     Operating activities provided cash of $382.0 million during the first half of 2005, compared to utilizing $298.3
million during the comparable prior year period. Improvement in cash flows from operations reflects improved
collections in receivables, including the prompt payment terms of our new customer, the Department of Veterans
Affairs, improved inventory management, and extended payment terms received from certain manufacturers.

     Investing activities utilized cash of $155.6 million and $65.8 million during the first half of 2005 and 2004. The
increased usage in 2005 primarily reflects a payment of approximately $37 million for the acquisition of MMC as
well as greater issuances of notes receivable. During the first half of 2005, we converted a $40.0 million customer
credit facility guarantee to a note receivable due from this customer. Increases in cash usage were partially offset by
a decrease in expenditures for capitalized software and the proceeds from the sale of a business.

     Financing activities provided cash of $61.8 million and $103.7 million in the first half of 2005 and 2004.
Financing activities for 2005 include an incremental $31.2 million from common stock issuances primarily resulting
from an increase in employees’ exercises of stock options. 2004 financing activities included the use of $75.3
million for stock repurchases and $135.0 million of proceeds from short-term borrowings.


                                                          20
McKESSON CORPORATION
                                           FINANCIAL REVIEW (Continued)
                                                   (Unaudited)

Selected Measures of Liquidity and Capital Resources
                                                                                         September 30,         March 31,
                                                                                             2004               2004
(Dollars in millions)
Cash, cash equivalents and marketable securities                                       $      1,005.4        $     717.8
Working capital                                                                               3,904.7            3,587.9
Debt net of cash, cash equivalents and marketable securities                                    460.9              766.8
Debt to capital ratio (1)                                                                        21.0%              22.3%
Net debt to net capital employed (2)                                                              7.7               12.9
Return on stockholders’ equity (3)                                                               11.3               13.4

(1) Ratio is computed as total debt divided by total debt and stockholders’ equity.
(2) Ratio is computed as total debt, net of cash, cash equivalents and marketable securities (“net debt”), divided by net debt and
    stockholders’ equity (“net capital employed”).
(3) Ratio is computed as the sum of net income for the last four quarters, divided by the average of stockholders’ equity for the
    last five quarters.

    Working capital primarily includes receivables and inventories, net of drafts and accounts payable and deferred
revenue. Our Pharmaceutical Solutions segment requires a substantial investment in working capital that is
susceptible to large variations during the year as a result of inventory purchase patterns and seasonal demands.
Inventory purchase activity is a function of sales activity, new customer build-up requirements and the desired level
of investment inventory. Consolidated working capital has increased primarily as a result of our higher sales
volume, as well as an increase in cash and cash equivalents.

     We reduced our ratio of net debt to net capital employed as growth in our operating income was in excess of the
growth in working capital and other investments needed to fund increases in revenue, which is reflected in increases
in cash and cash equivalents and stockholders’ equity.


Credit Resources

     We fund our working capital requirements primarily with cash, short-term borrowings and our receivables sale
facility. In September 2004, we entered into a $1.3 billion five-year, senior unsecured revolving credit facility.
Borrowings under the new credit facility bear interest at a fixed base rate, or a floating rate based on the British
Banker’s Association LIBOR rate or a Eurodollar rate. Effective as of the closing date of the new credit facility
agreement, we terminated the commitments under our existing $550 million, three-year revolving credit facility that
would have expired in September 2005, as well as our $650 million, 364-day credit facility that would have expired
on September 28, 2004.

    We also have a $1.4 billion revolving receivables sale facility, which was renewed in June 2004, the terms of
which are substantially similar to those previously in place with the exception that the facility was increased by
$300.0 million. This facility expires in June 2005. At September 30, 2004 and at March 31, 2004, no amounts were
outstanding or utilized under any of the Company’s credit facilities.

     Our various borrowing facilities and long-term debt are subject to certain covenants. Our principal debt
covenant is our debt to capital ratio, which cannot exceed 56.5%. If we exceed this ratio, repayment of any debt
outstanding under the revolving credit facility and $335.0 million of term debt could be accelerated. At September
30, 2004, this ratio was 21.0% and we were in compliance with our other covenants. A reduction in our credit
ratings or the lack of compliance with our covenants could negatively impact our ability to finance operations
through our credit facilities, or issue additional debt at the interest rates currently available.

    Funds necessary for future debt maturities and our other cash requirements are expected to be met by existing
cash balances, cash flows from operations, existing credit sources and other capital market transactions.


                                                               21
McKESSON CORPORATION

                                       FINANCIAL REVIEW (Concluded)
                                               (Unaudited)

New Accounting Pronouncements

    There are a number of new accounting pronouncements that may impact our financial results. These new
accounting pronouncements are described in Financial Note 1, “Significant Accounting Policies,” to the
accompanying condensed consolidated financial statements.


FACTORS AFFECTING FORWARD-LOOKING STATEMENTS

     In addition to historical information, management’s discussion and analysis includes certain forward-looking
statements within the meaning of section 27A of the Securities Act of 1933, as amended and section 21E of the
Securities Exchange Act of 1934, as amended. Some of the forward-looking statements can be identified by use of
forward-looking words such as “believes,” “expects,” “anticipates,” “may,” “will,” “should,” “seeks,”
“approximates,” “intends,” “plans,” or “estimates,” or the negative of these words, or other comparable terminology.
The discussion of financial trends, strategy, plans or intentions may also include forward-looking statements.
Forward-looking statements involve risks and uncertainties that could cause actual results to differ materially from
those projected. Although it is not possible to predict or identify all such risks and uncertainties, they may include,
but are not limited to, the following factors. The readers should not consider this list to be a complete statement of
all potential risks and uncertainties.

•   the resolution or outcome of pending shareholder litigation regarding the 1999 restatement of our historical
    financial statements;
•   the changing U.S. healthcare environment, including the impact of current and potential future mandated
    benefits, changes in private and governmental reimbursement or in the delivery systems for healthcare products
    and services and governmental efforts to regulate the pharmaceutical supply chain;
•   consolidation of competitors, suppliers and customers and the development of large, sophisticated purchasing
    groups;
•   the ability to successfully market both new and existing products domestically and internationally;
•   changes in manufacturers’ pricing, selling, inventory, distribution or supply policies or practices;
•   substantial defaults in payment by large customers;
•   material reduction in purchases or the loss of a large customer or supplier relationship;
•   challenges in integrating or implementing our software or software-related system products, or the slowing or
    deferral of demand for these products;
•   the malfunction or failure of our segments’ information systems;
•   our ability to successfully identify, consummate and integrate strategic acquisitions;
•   changes in generally accepted accounting principles;
•   tax legislation initiatives;
•   foreign currency fluctuations; and
•   general economic and market conditions.

     These and other risks and uncertainties are described herein or in our Forms 10-K, 10-Q, 8-K and other public
documents filed with the Securities and Exchange Commission. Readers are cautioned not to place undue reliance
on these forward-looking statements, which speak only as of the date hereof. We undertake no obligation to
publicly release the result of any revisions to these forward-looking statements to reflect events or circumstances
after this date or to reflect the occurrence of unanticipated events.


                                                          22
McKESSON CORPORATION

Item 3. Quantitative and Qualitative Disclosures about Market Risk

    We believe there has been no material change in our exposure to risks associated with fluctuations in interest
and foreign currency exchange rates discussed in our 2004 Annual Report on Form 10-K.


Item 4. Controls and Procedures

     Our Chief Executive Officer and our Chief Financial Officer, after evaluating the effectiveness of the
Company’s “disclosure controls and procedures” (as defined in the Exchange Act Rules 13a-15(e)) as of the end of
the period covered by this quarterly report, have concluded that our disclosure controls and procedures are effective
based on their evaluation of these controls and procedures required by paragraph (b) of Exchange Act Rules 13a-15
or 15d-15.

    There were no changes in our internal control over financial reporting identified in connection with the
evaluation required by paragraph (d) of Exchange Act Rules 13a-15 or 15d-15 that occurred during our last fiscal
quarter that have materially affected, or are reasonably likely to materially affect, our internal controls over financial
reporting.


                                        PART II. OTHER INFORMATION


Item 1. Legal Proceedings

    See Financial Note 11, “Other Commitments and Contingent Liabilities,” of our unaudited condensed
consolidated financial statements contained in Part I of this Quarterly Report on Form 10-Q.


Item 2. Unregistered Sales of Equity Securities and Use of Proceeds

    The Company made no share repurchases during the quarter and the six months ended September 30, 2004.
The dollar value of shares that may yet be purchased under our currently authorized share repurchase program is
approximately $209 million.


Item 4. Submission of Matters to a Vote of Security Holders

    The Company’s Annual Meeting of Shareholders was held on July 28, 2004. The following matters were voted
upon at the meeting and the stockholder votes on each such matter are briefly described below.

    The Board of Directors’ nominees for directors as listed in the proxy statement were each elected to serve for a
    three-year term. The vote was as follows:

                                                                  Votes For                    Votes Withheld
                     John H. Hammergren                           257,368,725                      8,258,191
                     M. Christine Jacobs                          231,698,249                    33,928,667
                     Robert W. Matschullat                        259,656,704                      5,970,212

    The term of the following directors continued after the meeting:

                     Wayne A. Budd                              Alton F. Irby III
                     Marie L. Knowles                           David M. Lawrence, M.D.
                     James V. Napier                            Jane E. Shaw
                     Richard F. Syron


                                                           23
Mekesson Quarterly Reports 2005 2nd

More Related Content

What's hot

johnson controls FY2005 1st Quarter Form 10-QA
johnson controls  FY2005 1st Quarter Form 10-QA  johnson controls  FY2005 1st Quarter Form 10-QA
johnson controls FY2005 1st Quarter Form 10-QA finance8
 
Mekesson Quarterly Reports 2002 3rd
Mekesson Quarterly Reports 2002 3rdMekesson Quarterly Reports 2002 3rd
Mekesson Quarterly Reports 2002 3rdfinance2
 
valero energy Quarterly and Other SEC Reports 2004 2nd
valero energy  Quarterly and Other SEC Reports  2004 2ndvalero energy  Quarterly and Other SEC Reports  2004 2nd
valero energy Quarterly and Other SEC Reports 2004 2ndfinance2
 
danaher 04-1Q-Q
danaher 04-1Q-Qdanaher 04-1Q-Q
danaher 04-1Q-Qfinance24
 
tesoro 10-Q First Quarter 2007
tesoro 	10-Q First Quarter 2007tesoro 	10-Q First Quarter 2007
tesoro 10-Q First Quarter 2007finance12
 
Q1 2009 Earning Report of Waste Management, Inc.
Q1 2009 Earning Report of Waste Management, Inc. Q1 2009 Earning Report of Waste Management, Inc.
Q1 2009 Earning Report of Waste Management, Inc. earningreport earningreport
 
tenet healthcare Q32004
tenet healthcare Q32004tenet healthcare Q32004
tenet healthcare Q32004finance42
 
tenet healthcare CY0610QMARFinal
tenet healthcare CY0610QMARFinaltenet healthcare CY0610QMARFinal
tenet healthcare CY0610QMARFinalfinance42
 
valero energy Quarterly and Other SEC Reports 2004 3rd
valero energy  Quarterly and Other SEC Reports 2004 3rdvalero energy  Quarterly and Other SEC Reports 2004 3rd
valero energy Quarterly and Other SEC Reports 2004 3rdfinance2
 
FY2004 1st Quarter Form 10-Q
 FY2004 1st Quarter Form 10-Q   FY2004 1st Quarter Form 10-Q
FY2004 1st Quarter Form 10-Q finance8
 
johnson controls FY2005 3rd Quarter Form 10-QA
johnson controls  FY2005 3rd Quarter Form 10-QA  johnson controls  FY2005 3rd Quarter Form 10-QA
johnson controls FY2005 3rd Quarter Form 10-QA finance8
 
tenet healthcare Form10QQtrEndedSeptember2003
tenet healthcare Form10QQtrEndedSeptember2003tenet healthcare Form10QQtrEndedSeptember2003
tenet healthcare Form10QQtrEndedSeptember2003finance42
 
tesoro 10-Q Third Quarter 2006
tesoro 10-Q Third Quarter 2006tesoro 10-Q Third Quarter 2006
tesoro 10-Q Third Quarter 2006finance12
 
PCARMar2003_10-Q
PCARMar2003_10-QPCARMar2003_10-Q
PCARMar2003_10-Qfinance17
 
valero energy Quarterly and Other SEC Reports 2005 1st
valero energy  Quarterly and Other SEC Reports 2005 1st valero energy  Quarterly and Other SEC Reports 2005 1st
valero energy Quarterly and Other SEC Reports 2005 1st finance2
 
PCARSept2003_10-Q
PCARSept2003_10-QPCARSept2003_10-Q
PCARSept2003_10-Qfinance17
 
valero energy Quarterly and Other SEC Reports 2006 1st
valero energy  Quarterly and Other SEC Reports 2006 1stvalero energy  Quarterly and Other SEC Reports 2006 1st
valero energy Quarterly and Other SEC Reports 2006 1stfinance2
 
tenet healthcare CY07SEP10QFINAL
tenet healthcare CY07SEP10QFINALtenet healthcare CY07SEP10QFINAL
tenet healthcare CY07SEP10QFINALfinance42
 
AES 1q200210q
AES 1q200210qAES 1q200210q
AES 1q200210qfinance19
 
tenet healthcare Form10Q2ndQtrNewCal2003
tenet healthcare Form10Q2ndQtrNewCal2003tenet healthcare Form10Q2ndQtrNewCal2003
tenet healthcare Form10Q2ndQtrNewCal2003finance42
 

What's hot (20)

johnson controls FY2005 1st Quarter Form 10-QA
johnson controls  FY2005 1st Quarter Form 10-QA  johnson controls  FY2005 1st Quarter Form 10-QA
johnson controls FY2005 1st Quarter Form 10-QA
 
Mekesson Quarterly Reports 2002 3rd
Mekesson Quarterly Reports 2002 3rdMekesson Quarterly Reports 2002 3rd
Mekesson Quarterly Reports 2002 3rd
 
valero energy Quarterly and Other SEC Reports 2004 2nd
valero energy  Quarterly and Other SEC Reports  2004 2ndvalero energy  Quarterly and Other SEC Reports  2004 2nd
valero energy Quarterly and Other SEC Reports 2004 2nd
 
danaher 04-1Q-Q
danaher 04-1Q-Qdanaher 04-1Q-Q
danaher 04-1Q-Q
 
tesoro 10-Q First Quarter 2007
tesoro 	10-Q First Quarter 2007tesoro 	10-Q First Quarter 2007
tesoro 10-Q First Quarter 2007
 
Q1 2009 Earning Report of Waste Management, Inc.
Q1 2009 Earning Report of Waste Management, Inc. Q1 2009 Earning Report of Waste Management, Inc.
Q1 2009 Earning Report of Waste Management, Inc.
 
tenet healthcare Q32004
tenet healthcare Q32004tenet healthcare Q32004
tenet healthcare Q32004
 
tenet healthcare CY0610QMARFinal
tenet healthcare CY0610QMARFinaltenet healthcare CY0610QMARFinal
tenet healthcare CY0610QMARFinal
 
valero energy Quarterly and Other SEC Reports 2004 3rd
valero energy  Quarterly and Other SEC Reports 2004 3rdvalero energy  Quarterly and Other SEC Reports 2004 3rd
valero energy Quarterly and Other SEC Reports 2004 3rd
 
FY2004 1st Quarter Form 10-Q
 FY2004 1st Quarter Form 10-Q   FY2004 1st Quarter Form 10-Q
FY2004 1st Quarter Form 10-Q
 
johnson controls FY2005 3rd Quarter Form 10-QA
johnson controls  FY2005 3rd Quarter Form 10-QA  johnson controls  FY2005 3rd Quarter Form 10-QA
johnson controls FY2005 3rd Quarter Form 10-QA
 
tenet healthcare Form10QQtrEndedSeptember2003
tenet healthcare Form10QQtrEndedSeptember2003tenet healthcare Form10QQtrEndedSeptember2003
tenet healthcare Form10QQtrEndedSeptember2003
 
tesoro 10-Q Third Quarter 2006
tesoro 10-Q Third Quarter 2006tesoro 10-Q Third Quarter 2006
tesoro 10-Q Third Quarter 2006
 
PCARMar2003_10-Q
PCARMar2003_10-QPCARMar2003_10-Q
PCARMar2003_10-Q
 
valero energy Quarterly and Other SEC Reports 2005 1st
valero energy  Quarterly and Other SEC Reports 2005 1st valero energy  Quarterly and Other SEC Reports 2005 1st
valero energy Quarterly and Other SEC Reports 2005 1st
 
PCARSept2003_10-Q
PCARSept2003_10-QPCARSept2003_10-Q
PCARSept2003_10-Q
 
valero energy Quarterly and Other SEC Reports 2006 1st
valero energy  Quarterly and Other SEC Reports 2006 1stvalero energy  Quarterly and Other SEC Reports 2006 1st
valero energy Quarterly and Other SEC Reports 2006 1st
 
tenet healthcare CY07SEP10QFINAL
tenet healthcare CY07SEP10QFINALtenet healthcare CY07SEP10QFINAL
tenet healthcare CY07SEP10QFINAL
 
AES 1q200210q
AES 1q200210qAES 1q200210q
AES 1q200210q
 
tenet healthcare Form10Q2ndQtrNewCal2003
tenet healthcare Form10Q2ndQtrNewCal2003tenet healthcare Form10Q2ndQtrNewCal2003
tenet healthcare Form10Q2ndQtrNewCal2003
 

Viewers also liked

mckesson Letter to Stockholders 2007
mckesson Letter to Stockholders 2007mckesson Letter to Stockholders 2007
mckesson Letter to Stockholders 2007finance2
 
Proxy Statement for July 2005 Annual Meeting
Proxy Statement for July 2005 Annual Meeting Proxy Statement for July 2005 Annual Meeting
Proxy Statement for July 2005 Annual Meeting finance2
 
morgan stanley Annual Reports 2000
morgan stanley  Annual Reports 2000morgan stanley  Annual Reports 2000
morgan stanley Annual Reports 2000finance2
 
JPMorgan Chase Fourth Quarter and Full-Year 2008 Financial Results Conference...
JPMorgan Chase Fourth Quarter and Full-Year 2008 Financial Results Conference...JPMorgan Chase Fourth Quarter and Full-Year 2008 Financial Results Conference...
JPMorgan Chase Fourth Quarter and Full-Year 2008 Financial Results Conference...finance2
 
Credit Suisse First Boston Annual Health Care Conference Presentation
	 Credit Suisse First Boston Annual Health Care Conference Presentation	 Credit Suisse First Boston Annual Health Care Conference Presentation
Credit Suisse First Boston Annual Health Care Conference Presentationfinance2
 
goldman sachs Amended and Restated By-laws
goldman sachs Amended and Restated By-laws  goldman sachs Amended and Restated By-laws
goldman sachs Amended and Restated By-laws finance2
 
cardinal health Q2 2008 Earnings Presentation
cardinal health Q2 2008 Earnings Presentationcardinal health Q2 2008 Earnings Presentation
cardinal health Q2 2008 Earnings Presentationfinance2
 
cardinal health Q3 2007 Earnings Presentation
cardinal health Q3 2007 Earnings Presentationcardinal health Q3 2007 Earnings Presentation
cardinal health Q3 2007 Earnings Presentationfinance2
 
morgan stanley Earnings Archive2007 3rd
morgan stanley Earnings Archive2007 3rd morgan stanley Earnings Archive2007 3rd
morgan stanley Earnings Archive2007 3rd finance2
 
morgan stanley Proxy Statements
morgan stanley Proxy Statementsmorgan stanley Proxy Statements
morgan stanley Proxy Statementsfinance2
 
JPMorgan Chase Letter to shareholders
JPMorgan Chase  Letter to shareholdersJPMorgan Chase  Letter to shareholders
JPMorgan Chase Letter to shareholdersfinance2
 
Lehman Brothers 2003 Global Heathcare Conference
	 Lehman Brothers 2003 Global Heathcare Conference	 Lehman Brothers 2003 Global Heathcare Conference
Lehman Brothers 2003 Global Heathcare Conferencefinance2
 
goldman sachs # Restated Certificate of Incorporation
goldman sachs #  Restated Certificate of Incorporation    goldman sachs #  Restated Certificate of Incorporation
goldman sachs # Restated Certificate of Incorporation finance2
 
valero energy Quarterly and Other SEC Reports 2005 3rd
valero energy  Quarterly and Other SEC Reports  2005 3rdvalero energy  Quarterly and Other SEC Reports  2005 3rd
valero energy Quarterly and Other SEC Reports 2005 3rdfinance2
 
home depot Annual Report 1982
home depot Annual Report 1982home depot Annual Report 1982
home depot Annual Report 1982finance2
 
AIG Second Quarter 2008 Economic Capital - August 2008 Update
AIG Second Quarter 2008 Economic Capital - August 2008 UpdateAIG Second Quarter 2008 Economic Capital - August 2008 Update
AIG Second Quarter 2008 Economic Capital - August 2008 Updatefinance2
 
morgan stanley MS Market Products Inc.
morgan stanley MS Market Products Inc.morgan stanley MS Market Products Inc.
morgan stanley MS Market Products Inc.finance2
 
home depot Annual Report 1990
home depot Annual Report 1990home depot Annual Report 1990
home depot Annual Report 1990finance2
 

Viewers also liked (20)

mckesson Letter to Stockholders 2007
mckesson Letter to Stockholders 2007mckesson Letter to Stockholders 2007
mckesson Letter to Stockholders 2007
 
Proxy Statement for July 2005 Annual Meeting
Proxy Statement for July 2005 Annual Meeting Proxy Statement for July 2005 Annual Meeting
Proxy Statement for July 2005 Annual Meeting
 
morgan stanley Annual Reports 2000
morgan stanley  Annual Reports 2000morgan stanley  Annual Reports 2000
morgan stanley Annual Reports 2000
 
JPMorgan Chase Fourth Quarter and Full-Year 2008 Financial Results Conference...
JPMorgan Chase Fourth Quarter and Full-Year 2008 Financial Results Conference...JPMorgan Chase Fourth Quarter and Full-Year 2008 Financial Results Conference...
JPMorgan Chase Fourth Quarter and Full-Year 2008 Financial Results Conference...
 
Credit Suisse First Boston Annual Health Care Conference Presentation
	 Credit Suisse First Boston Annual Health Care Conference Presentation	 Credit Suisse First Boston Annual Health Care Conference Presentation
Credit Suisse First Boston Annual Health Care Conference Presentation
 
goldman sachs Amended and Restated By-laws
goldman sachs Amended and Restated By-laws  goldman sachs Amended and Restated By-laws
goldman sachs Amended and Restated By-laws
 
Evaluation
EvaluationEvaluation
Evaluation
 
cardinal health Q2 2008 Earnings Presentation
cardinal health Q2 2008 Earnings Presentationcardinal health Q2 2008 Earnings Presentation
cardinal health Q2 2008 Earnings Presentation
 
cardinal health Q3 2007 Earnings Presentation
cardinal health Q3 2007 Earnings Presentationcardinal health Q3 2007 Earnings Presentation
cardinal health Q3 2007 Earnings Presentation
 
morgan stanley Earnings Archive2007 3rd
morgan stanley Earnings Archive2007 3rd morgan stanley Earnings Archive2007 3rd
morgan stanley Earnings Archive2007 3rd
 
morgan stanley Proxy Statements
morgan stanley Proxy Statementsmorgan stanley Proxy Statements
morgan stanley Proxy Statements
 
JPMorgan Chase Letter to shareholders
JPMorgan Chase  Letter to shareholdersJPMorgan Chase  Letter to shareholders
JPMorgan Chase Letter to shareholders
 
Lehman Brothers 2003 Global Heathcare Conference
	 Lehman Brothers 2003 Global Heathcare Conference	 Lehman Brothers 2003 Global Heathcare Conference
Lehman Brothers 2003 Global Heathcare Conference
 
goldman sachs # Restated Certificate of Incorporation
goldman sachs #  Restated Certificate of Incorporation    goldman sachs #  Restated Certificate of Incorporation
goldman sachs # Restated Certificate of Incorporation
 
valero energy Quarterly and Other SEC Reports 2005 3rd
valero energy  Quarterly and Other SEC Reports  2005 3rdvalero energy  Quarterly and Other SEC Reports  2005 3rd
valero energy Quarterly and Other SEC Reports 2005 3rd
 
Schedule
ScheduleSchedule
Schedule
 
home depot Annual Report 1982
home depot Annual Report 1982home depot Annual Report 1982
home depot Annual Report 1982
 
AIG Second Quarter 2008 Economic Capital - August 2008 Update
AIG Second Quarter 2008 Economic Capital - August 2008 UpdateAIG Second Quarter 2008 Economic Capital - August 2008 Update
AIG Second Quarter 2008 Economic Capital - August 2008 Update
 
morgan stanley MS Market Products Inc.
morgan stanley MS Market Products Inc.morgan stanley MS Market Products Inc.
morgan stanley MS Market Products Inc.
 
home depot Annual Report 1990
home depot Annual Report 1990home depot Annual Report 1990
home depot Annual Report 1990
 

Similar to Mekesson Quarterly Reports 2005 2nd

tenet healthcare 1Q0410Q
tenet healthcare 1Q0410Qtenet healthcare 1Q0410Q
tenet healthcare 1Q0410Qfinance42
 
PCAR Sept 2004_10-Q
PCAR Sept 2004_10-QPCAR Sept 2004_10-Q
PCAR Sept 2004_10-Qfinance17
 
PCAR Mar 2004_10-Q
PCAR Mar 2004_10-QPCAR Mar 2004_10-Q
PCAR Mar 2004_10-Qfinance17
 
xcel energy 10qxcel1q04
xcel energy 10qxcel1q04xcel energy 10qxcel1q04
xcel energy 10qxcel1q04finance26
 
10q xcel1q04
10q xcel1q0410q xcel1q04
10q xcel1q04finance26
 
calpine 3Q0410Q
calpine  3Q0410Qcalpine  3Q0410Q
calpine 3Q0410Qfinance29
 
calpine 3Q0410Q
calpine  3Q0410Qcalpine  3Q0410Q
calpine 3Q0410Qfinance29
 
johnson controls FY2006 2nd Quarter Form 10-Q
johnson controls  FY2006 2nd Quarter Form 10-Q  johnson controls  FY2006 2nd Quarter Form 10-Q
johnson controls FY2006 2nd Quarter Form 10-Q finance8
 
unisys 2003_3Q_10Q
unisys 2003_3Q_10Qunisys 2003_3Q_10Q
unisys 2003_3Q_10Qfinance36
 
PCAR June 2004_10-Q
PCAR June 2004_10-QPCAR June 2004_10-Q
PCAR June 2004_10-Qfinance17
 
tollbrothers 10-Q_jan_2003
 tollbrothers   10-Q_jan_2003 tollbrothers   10-Q_jan_2003
tollbrothers 10-Q_jan_2003finance50
 
tollbrothers 10-Q_jan_2003
 tollbrothers   10-Q_jan_2003 tollbrothers   10-Q_jan_2003
tollbrothers 10-Q_jan_2003finance50
 
tollbrothers 10-Q_jul_2003
 tollbrothers   10-Q_jul_2003 tollbrothers   10-Q_jul_2003
tollbrothers 10-Q_jul_2003finance50
 
tollbrothers 10-Q_jul_2003
 tollbrothers   10-Q_jul_2003 tollbrothers   10-Q_jul_2003
tollbrothers 10-Q_jul_2003finance50
 
Mekesson Quarterly Reports 2002 2nd
Mekesson Quarterly Reports 2002  2ndMekesson Quarterly Reports 2002  2nd
Mekesson Quarterly Reports 2002 2ndfinance2
 
thermo fisher Q107_10Q
thermo fisher Q107_10Qthermo fisher Q107_10Q
thermo fisher Q107_10Qfinance40
 
thermo fisher Q107_10Q
thermo fisher Q107_10Qthermo fisher Q107_10Q
thermo fisher Q107_10Qfinance40
 
valero energy Quarterly and Other SEC Reports 2005 2nd
valero energy  Quarterly and Other SEC Reports 2005 2nd valero energy  Quarterly and Other SEC Reports 2005 2nd
valero energy Quarterly and Other SEC Reports 2005 2nd finance2
 
danaher 05-3q-10q
danaher 05-3q-10qdanaher 05-3q-10q
danaher 05-3q-10qfinance24
 
XCEL_10Q_Q3_2007
XCEL_10Q_Q3_2007XCEL_10Q_Q3_2007
XCEL_10Q_Q3_2007finance26
 

Similar to Mekesson Quarterly Reports 2005 2nd (20)

tenet healthcare 1Q0410Q
tenet healthcare 1Q0410Qtenet healthcare 1Q0410Q
tenet healthcare 1Q0410Q
 
PCAR Sept 2004_10-Q
PCAR Sept 2004_10-QPCAR Sept 2004_10-Q
PCAR Sept 2004_10-Q
 
PCAR Mar 2004_10-Q
PCAR Mar 2004_10-QPCAR Mar 2004_10-Q
PCAR Mar 2004_10-Q
 
xcel energy 10qxcel1q04
xcel energy 10qxcel1q04xcel energy 10qxcel1q04
xcel energy 10qxcel1q04
 
10q xcel1q04
10q xcel1q0410q xcel1q04
10q xcel1q04
 
calpine 3Q0410Q
calpine  3Q0410Qcalpine  3Q0410Q
calpine 3Q0410Q
 
calpine 3Q0410Q
calpine  3Q0410Qcalpine  3Q0410Q
calpine 3Q0410Q
 
johnson controls FY2006 2nd Quarter Form 10-Q
johnson controls  FY2006 2nd Quarter Form 10-Q  johnson controls  FY2006 2nd Quarter Form 10-Q
johnson controls FY2006 2nd Quarter Form 10-Q
 
unisys 2003_3Q_10Q
unisys 2003_3Q_10Qunisys 2003_3Q_10Q
unisys 2003_3Q_10Q
 
PCAR June 2004_10-Q
PCAR June 2004_10-QPCAR June 2004_10-Q
PCAR June 2004_10-Q
 
tollbrothers 10-Q_jan_2003
 tollbrothers   10-Q_jan_2003 tollbrothers   10-Q_jan_2003
tollbrothers 10-Q_jan_2003
 
tollbrothers 10-Q_jan_2003
 tollbrothers   10-Q_jan_2003 tollbrothers   10-Q_jan_2003
tollbrothers 10-Q_jan_2003
 
tollbrothers 10-Q_jul_2003
 tollbrothers   10-Q_jul_2003 tollbrothers   10-Q_jul_2003
tollbrothers 10-Q_jul_2003
 
tollbrothers 10-Q_jul_2003
 tollbrothers   10-Q_jul_2003 tollbrothers   10-Q_jul_2003
tollbrothers 10-Q_jul_2003
 
Mekesson Quarterly Reports 2002 2nd
Mekesson Quarterly Reports 2002  2ndMekesson Quarterly Reports 2002  2nd
Mekesson Quarterly Reports 2002 2nd
 
thermo fisher Q107_10Q
thermo fisher Q107_10Qthermo fisher Q107_10Q
thermo fisher Q107_10Q
 
thermo fisher Q107_10Q
thermo fisher Q107_10Qthermo fisher Q107_10Q
thermo fisher Q107_10Q
 
valero energy Quarterly and Other SEC Reports 2005 2nd
valero energy  Quarterly and Other SEC Reports 2005 2nd valero energy  Quarterly and Other SEC Reports 2005 2nd
valero energy Quarterly and Other SEC Reports 2005 2nd
 
danaher 05-3q-10q
danaher 05-3q-10qdanaher 05-3q-10q
danaher 05-3q-10q
 
XCEL_10Q_Q3_2007
XCEL_10Q_Q3_2007XCEL_10Q_Q3_2007
XCEL_10Q_Q3_2007
 

More from finance2

The Home Depot Celebrates Hispanic Culture Through Color and Paint With Color...
The Home Depot Celebrates Hispanic Culture Through Color and Paint With Color...The Home Depot Celebrates Hispanic Culture Through Color and Paint With Color...
The Home Depot Celebrates Hispanic Culture Through Color and Paint With Color...finance2
 
The Home Depot and AARP Launch Nationwide Workshops
The Home Depot and AARP Launch Nationwide WorkshopsThe Home Depot and AARP Launch Nationwide Workshops
The Home Depot and AARP Launch Nationwide Workshopsfinance2
 
Nearly Half of Americans Fail to Check Home Safety Devices at Daylight-Saving...
Nearly Half of Americans Fail to Check Home Safety Devices at Daylight-Saving...Nearly Half of Americans Fail to Check Home Safety Devices at Daylight-Saving...
Nearly Half of Americans Fail to Check Home Safety Devices at Daylight-Saving...finance2
 
View Summary The Home Depot Celebrates the Olympic Spirit With Special Kids...
View Summary  	The Home Depot Celebrates the Olympic Spirit With Special Kids...View Summary  	The Home Depot Celebrates the Olympic Spirit With Special Kids...
View Summary The Home Depot Celebrates the Olympic Spirit With Special Kids...finance2
 
The Home Depot Announces First Quarter Results
The Home Depot Announces First Quarter ResultsThe Home Depot Announces First Quarter Results
The Home Depot Announces First Quarter Resultsfinance2
 
home depot Craig Menear Presentation
home depot Craig Menear Presentationhome depot Craig Menear Presentation
home depot Craig Menear Presentationfinance2
 
home depot 2008 Annual Meeting of Stockholders
home depot 2008 Annual Meeting of Stockholdershome depot 2008 Annual Meeting of Stockholders
home depot 2008 Annual Meeting of Stockholdersfinance2
 
home depot Transcript
home depot 	Transcript home depot 	Transcript
home depot Transcript finance2
 
home depot PDF Carol Tomé Presentation
home depot  PDF  	Carol Tomé Presentation home depot  PDF  	Carol Tomé Presentation
home depot PDF Carol Tomé Presentation finance2
 
home depot Paul Raines Presentation
home depot Paul Raines Presentation home depot Paul Raines Presentation
home depot Paul Raines Presentation finance2
 
home depot http://ir.homedepot.com/common/download/download.cfm?companyid=HD&...
home depot http://ir.homedepot.com/common/download/download.cfm?companyid=HD&...home depot http://ir.homedepot.com/common/download/download.cfm?companyid=HD&...
home depot http://ir.homedepot.com/common/download/download.cfm?companyid=HD&...finance2
 
home depot PDF Frank Blake Presentation
home depot  PDF  	Frank Blake Presentation home depot  PDF  	Frank Blake Presentation
home depot PDF Frank Blake Presentation finance2
 
home depotForward Looking & Non-GAAP Disclosures
home depotForward Looking & Non-GAAP Disclosures home depotForward Looking & Non-GAAP Disclosures
home depotForward Looking & Non-GAAP Disclosures finance2
 
home depot Bank of America 38th Annual Investment Conference
home depot Bank of America 38th Annual Investment Conferencehome depot Bank of America 38th Annual Investment Conference
home depot Bank of America 38th Annual Investment Conferencefinance2
 
2008 Home Depot Inc. Earnings Conference
2008 Home Depot Inc. Earnings Conference  2008 Home Depot Inc. Earnings Conference
2008 Home Depot Inc. Earnings Conference finance2
 
home depot Quarterly Earnings 2008 3rd
home depot  Quarterly Earnings 2008 3rdhome depot  Quarterly Earnings 2008 3rd
home depot Quarterly Earnings 2008 3rdfinance2
 
home depot Annual Report 1983
home depot Annual Report 1983home depot Annual Report 1983
home depot Annual Report 1983finance2
 
home depot Annual Report 1984
home depot Annual Report 1984home depot Annual Report 1984
home depot Annual Report 1984finance2
 
home depot Annual Report 1985
home depot Annual Report 1985home depot Annual Report 1985
home depot Annual Report 1985finance2
 
home depot Annual Report 1986
home depot Annual Report 1986home depot Annual Report 1986
home depot Annual Report 1986finance2
 

More from finance2 (20)

The Home Depot Celebrates Hispanic Culture Through Color and Paint With Color...
The Home Depot Celebrates Hispanic Culture Through Color and Paint With Color...The Home Depot Celebrates Hispanic Culture Through Color and Paint With Color...
The Home Depot Celebrates Hispanic Culture Through Color and Paint With Color...
 
The Home Depot and AARP Launch Nationwide Workshops
The Home Depot and AARP Launch Nationwide WorkshopsThe Home Depot and AARP Launch Nationwide Workshops
The Home Depot and AARP Launch Nationwide Workshops
 
Nearly Half of Americans Fail to Check Home Safety Devices at Daylight-Saving...
Nearly Half of Americans Fail to Check Home Safety Devices at Daylight-Saving...Nearly Half of Americans Fail to Check Home Safety Devices at Daylight-Saving...
Nearly Half of Americans Fail to Check Home Safety Devices at Daylight-Saving...
 
View Summary The Home Depot Celebrates the Olympic Spirit With Special Kids...
View Summary  	The Home Depot Celebrates the Olympic Spirit With Special Kids...View Summary  	The Home Depot Celebrates the Olympic Spirit With Special Kids...
View Summary The Home Depot Celebrates the Olympic Spirit With Special Kids...
 
The Home Depot Announces First Quarter Results
The Home Depot Announces First Quarter ResultsThe Home Depot Announces First Quarter Results
The Home Depot Announces First Quarter Results
 
home depot Craig Menear Presentation
home depot Craig Menear Presentationhome depot Craig Menear Presentation
home depot Craig Menear Presentation
 
home depot 2008 Annual Meeting of Stockholders
home depot 2008 Annual Meeting of Stockholdershome depot 2008 Annual Meeting of Stockholders
home depot 2008 Annual Meeting of Stockholders
 
home depot Transcript
home depot 	Transcript home depot 	Transcript
home depot Transcript
 
home depot PDF Carol Tomé Presentation
home depot  PDF  	Carol Tomé Presentation home depot  PDF  	Carol Tomé Presentation
home depot PDF Carol Tomé Presentation
 
home depot Paul Raines Presentation
home depot Paul Raines Presentation home depot Paul Raines Presentation
home depot Paul Raines Presentation
 
home depot http://ir.homedepot.com/common/download/download.cfm?companyid=HD&...
home depot http://ir.homedepot.com/common/download/download.cfm?companyid=HD&...home depot http://ir.homedepot.com/common/download/download.cfm?companyid=HD&...
home depot http://ir.homedepot.com/common/download/download.cfm?companyid=HD&...
 
home depot PDF Frank Blake Presentation
home depot  PDF  	Frank Blake Presentation home depot  PDF  	Frank Blake Presentation
home depot PDF Frank Blake Presentation
 
home depotForward Looking & Non-GAAP Disclosures
home depotForward Looking & Non-GAAP Disclosures home depotForward Looking & Non-GAAP Disclosures
home depotForward Looking & Non-GAAP Disclosures
 
home depot Bank of America 38th Annual Investment Conference
home depot Bank of America 38th Annual Investment Conferencehome depot Bank of America 38th Annual Investment Conference
home depot Bank of America 38th Annual Investment Conference
 
2008 Home Depot Inc. Earnings Conference
2008 Home Depot Inc. Earnings Conference  2008 Home Depot Inc. Earnings Conference
2008 Home Depot Inc. Earnings Conference
 
home depot Quarterly Earnings 2008 3rd
home depot  Quarterly Earnings 2008 3rdhome depot  Quarterly Earnings 2008 3rd
home depot Quarterly Earnings 2008 3rd
 
home depot Annual Report 1983
home depot Annual Report 1983home depot Annual Report 1983
home depot Annual Report 1983
 
home depot Annual Report 1984
home depot Annual Report 1984home depot Annual Report 1984
home depot Annual Report 1984
 
home depot Annual Report 1985
home depot Annual Report 1985home depot Annual Report 1985
home depot Annual Report 1985
 
home depot Annual Report 1986
home depot Annual Report 1986home depot Annual Report 1986
home depot Annual Report 1986
 

Recently uploaded

The Economic History of the U.S. Lecture 18.pdf
The Economic History of the U.S. Lecture 18.pdfThe Economic History of the U.S. Lecture 18.pdf
The Economic History of the U.S. Lecture 18.pdfGale Pooley
 
How Automation is Driving Efficiency Through the Last Mile of Reporting
How Automation is Driving Efficiency Through the Last Mile of ReportingHow Automation is Driving Efficiency Through the Last Mile of Reporting
How Automation is Driving Efficiency Through the Last Mile of ReportingAggregage
 
Bladex Earnings Call Presentation 1Q2024
Bladex Earnings Call Presentation 1Q2024Bladex Earnings Call Presentation 1Q2024
Bladex Earnings Call Presentation 1Q2024Bladex
 
20240417-Calibre-April-2024-Investor-Presentation.pdf
20240417-Calibre-April-2024-Investor-Presentation.pdf20240417-Calibre-April-2024-Investor-Presentation.pdf
20240417-Calibre-April-2024-Investor-Presentation.pdfAdnet Communications
 
Malad Call Girl in Services 9892124323 | ₹,4500 With Room Free Delivery
Malad Call Girl in Services  9892124323 | ₹,4500 With Room Free DeliveryMalad Call Girl in Services  9892124323 | ₹,4500 With Room Free Delivery
Malad Call Girl in Services 9892124323 | ₹,4500 With Room Free DeliveryPooja Nehwal
 
Call US 📞 9892124323 ✅ Kurla Call Girls In Kurla ( Mumbai ) secure service
Call US 📞 9892124323 ✅ Kurla Call Girls In Kurla ( Mumbai ) secure serviceCall US 📞 9892124323 ✅ Kurla Call Girls In Kurla ( Mumbai ) secure service
Call US 📞 9892124323 ✅ Kurla Call Girls In Kurla ( Mumbai ) secure servicePooja Nehwal
 
The Economic History of the U.S. Lecture 17.pdf
The Economic History of the U.S. Lecture 17.pdfThe Economic History of the U.S. Lecture 17.pdf
The Economic History of the U.S. Lecture 17.pdfGale Pooley
 
00_Main ppt_MeetupDORA&CyberSecurity.pptx
00_Main ppt_MeetupDORA&CyberSecurity.pptx00_Main ppt_MeetupDORA&CyberSecurity.pptx
00_Main ppt_MeetupDORA&CyberSecurity.pptxFinTech Belgium
 
VIP Kolkata Call Girl Serampore 👉 8250192130 Available With Room
VIP Kolkata Call Girl Serampore 👉 8250192130  Available With RoomVIP Kolkata Call Girl Serampore 👉 8250192130  Available With Room
VIP Kolkata Call Girl Serampore 👉 8250192130 Available With Roomdivyansh0kumar0
 
20240429 Calibre April 2024 Investor Presentation.pdf
20240429 Calibre April 2024 Investor Presentation.pdf20240429 Calibre April 2024 Investor Presentation.pdf
20240429 Calibre April 2024 Investor Presentation.pdfAdnet Communications
 
05_Annelore Lenoir_Docbyte_MeetupDora&Cybersecurity.pptx
05_Annelore Lenoir_Docbyte_MeetupDora&Cybersecurity.pptx05_Annelore Lenoir_Docbyte_MeetupDora&Cybersecurity.pptx
05_Annelore Lenoir_Docbyte_MeetupDora&Cybersecurity.pptxFinTech Belgium
 
Solution Manual for Financial Accounting, 11th Edition by Robert Libby, Patri...
Solution Manual for Financial Accounting, 11th Edition by Robert Libby, Patri...Solution Manual for Financial Accounting, 11th Edition by Robert Libby, Patri...
Solution Manual for Financial Accounting, 11th Edition by Robert Libby, Patri...ssifa0344
 
Russian Call Girls In Gtb Nagar (Delhi) 9711199012 💋✔💕😘 Naughty Call Girls Se...
Russian Call Girls In Gtb Nagar (Delhi) 9711199012 💋✔💕😘 Naughty Call Girls Se...Russian Call Girls In Gtb Nagar (Delhi) 9711199012 💋✔💕😘 Naughty Call Girls Se...
Russian Call Girls In Gtb Nagar (Delhi) 9711199012 💋✔💕😘 Naughty Call Girls Se...shivangimorya083
 
letter-from-the-chair-to-the-fca-relating-to-british-steel-pensions-scheme-15...
letter-from-the-chair-to-the-fca-relating-to-british-steel-pensions-scheme-15...letter-from-the-chair-to-the-fca-relating-to-british-steel-pensions-scheme-15...
letter-from-the-chair-to-the-fca-relating-to-british-steel-pensions-scheme-15...Henry Tapper
 
(DIYA) Bhumkar Chowk Call Girls Just Call 7001035870 [ Cash on Delivery ] Pun...
(DIYA) Bhumkar Chowk Call Girls Just Call 7001035870 [ Cash on Delivery ] Pun...(DIYA) Bhumkar Chowk Call Girls Just Call 7001035870 [ Cash on Delivery ] Pun...
(DIYA) Bhumkar Chowk Call Girls Just Call 7001035870 [ Cash on Delivery ] Pun...ranjana rawat
 
Quarter 4- Module 3 Principles of Marketing
Quarter 4- Module 3 Principles of MarketingQuarter 4- Module 3 Principles of Marketing
Quarter 4- Module 3 Principles of MarketingMaristelaRamos12
 
fca-bsps-decision-letter-redacted (1).pdf
fca-bsps-decision-letter-redacted (1).pdffca-bsps-decision-letter-redacted (1).pdf
fca-bsps-decision-letter-redacted (1).pdfHenry Tapper
 
High Class Call Girls Nagpur Grishma Call 7001035870 Meet With Nagpur Escorts
High Class Call Girls Nagpur Grishma Call 7001035870 Meet With Nagpur EscortsHigh Class Call Girls Nagpur Grishma Call 7001035870 Meet With Nagpur Escorts
High Class Call Girls Nagpur Grishma Call 7001035870 Meet With Nagpur Escortsranjana rawat
 
High Class Call Girls Nashik Maya 7001305949 Independent Escort Service Nashik
High Class Call Girls Nashik Maya 7001305949 Independent Escort Service NashikHigh Class Call Girls Nashik Maya 7001305949 Independent Escort Service Nashik
High Class Call Girls Nashik Maya 7001305949 Independent Escort Service NashikCall Girls in Nagpur High Profile
 
Instant Issue Debit Cards - School Designs
Instant Issue Debit Cards - School DesignsInstant Issue Debit Cards - School Designs
Instant Issue Debit Cards - School Designsegoetzinger
 

Recently uploaded (20)

The Economic History of the U.S. Lecture 18.pdf
The Economic History of the U.S. Lecture 18.pdfThe Economic History of the U.S. Lecture 18.pdf
The Economic History of the U.S. Lecture 18.pdf
 
How Automation is Driving Efficiency Through the Last Mile of Reporting
How Automation is Driving Efficiency Through the Last Mile of ReportingHow Automation is Driving Efficiency Through the Last Mile of Reporting
How Automation is Driving Efficiency Through the Last Mile of Reporting
 
Bladex Earnings Call Presentation 1Q2024
Bladex Earnings Call Presentation 1Q2024Bladex Earnings Call Presentation 1Q2024
Bladex Earnings Call Presentation 1Q2024
 
20240417-Calibre-April-2024-Investor-Presentation.pdf
20240417-Calibre-April-2024-Investor-Presentation.pdf20240417-Calibre-April-2024-Investor-Presentation.pdf
20240417-Calibre-April-2024-Investor-Presentation.pdf
 
Malad Call Girl in Services 9892124323 | ₹,4500 With Room Free Delivery
Malad Call Girl in Services  9892124323 | ₹,4500 With Room Free DeliveryMalad Call Girl in Services  9892124323 | ₹,4500 With Room Free Delivery
Malad Call Girl in Services 9892124323 | ₹,4500 With Room Free Delivery
 
Call US 📞 9892124323 ✅ Kurla Call Girls In Kurla ( Mumbai ) secure service
Call US 📞 9892124323 ✅ Kurla Call Girls In Kurla ( Mumbai ) secure serviceCall US 📞 9892124323 ✅ Kurla Call Girls In Kurla ( Mumbai ) secure service
Call US 📞 9892124323 ✅ Kurla Call Girls In Kurla ( Mumbai ) secure service
 
The Economic History of the U.S. Lecture 17.pdf
The Economic History of the U.S. Lecture 17.pdfThe Economic History of the U.S. Lecture 17.pdf
The Economic History of the U.S. Lecture 17.pdf
 
00_Main ppt_MeetupDORA&CyberSecurity.pptx
00_Main ppt_MeetupDORA&CyberSecurity.pptx00_Main ppt_MeetupDORA&CyberSecurity.pptx
00_Main ppt_MeetupDORA&CyberSecurity.pptx
 
VIP Kolkata Call Girl Serampore 👉 8250192130 Available With Room
VIP Kolkata Call Girl Serampore 👉 8250192130  Available With RoomVIP Kolkata Call Girl Serampore 👉 8250192130  Available With Room
VIP Kolkata Call Girl Serampore 👉 8250192130 Available With Room
 
20240429 Calibre April 2024 Investor Presentation.pdf
20240429 Calibre April 2024 Investor Presentation.pdf20240429 Calibre April 2024 Investor Presentation.pdf
20240429 Calibre April 2024 Investor Presentation.pdf
 
05_Annelore Lenoir_Docbyte_MeetupDora&Cybersecurity.pptx
05_Annelore Lenoir_Docbyte_MeetupDora&Cybersecurity.pptx05_Annelore Lenoir_Docbyte_MeetupDora&Cybersecurity.pptx
05_Annelore Lenoir_Docbyte_MeetupDora&Cybersecurity.pptx
 
Solution Manual for Financial Accounting, 11th Edition by Robert Libby, Patri...
Solution Manual for Financial Accounting, 11th Edition by Robert Libby, Patri...Solution Manual for Financial Accounting, 11th Edition by Robert Libby, Patri...
Solution Manual for Financial Accounting, 11th Edition by Robert Libby, Patri...
 
Russian Call Girls In Gtb Nagar (Delhi) 9711199012 💋✔💕😘 Naughty Call Girls Se...
Russian Call Girls In Gtb Nagar (Delhi) 9711199012 💋✔💕😘 Naughty Call Girls Se...Russian Call Girls In Gtb Nagar (Delhi) 9711199012 💋✔💕😘 Naughty Call Girls Se...
Russian Call Girls In Gtb Nagar (Delhi) 9711199012 💋✔💕😘 Naughty Call Girls Se...
 
letter-from-the-chair-to-the-fca-relating-to-british-steel-pensions-scheme-15...
letter-from-the-chair-to-the-fca-relating-to-british-steel-pensions-scheme-15...letter-from-the-chair-to-the-fca-relating-to-british-steel-pensions-scheme-15...
letter-from-the-chair-to-the-fca-relating-to-british-steel-pensions-scheme-15...
 
(DIYA) Bhumkar Chowk Call Girls Just Call 7001035870 [ Cash on Delivery ] Pun...
(DIYA) Bhumkar Chowk Call Girls Just Call 7001035870 [ Cash on Delivery ] Pun...(DIYA) Bhumkar Chowk Call Girls Just Call 7001035870 [ Cash on Delivery ] Pun...
(DIYA) Bhumkar Chowk Call Girls Just Call 7001035870 [ Cash on Delivery ] Pun...
 
Quarter 4- Module 3 Principles of Marketing
Quarter 4- Module 3 Principles of MarketingQuarter 4- Module 3 Principles of Marketing
Quarter 4- Module 3 Principles of Marketing
 
fca-bsps-decision-letter-redacted (1).pdf
fca-bsps-decision-letter-redacted (1).pdffca-bsps-decision-letter-redacted (1).pdf
fca-bsps-decision-letter-redacted (1).pdf
 
High Class Call Girls Nagpur Grishma Call 7001035870 Meet With Nagpur Escorts
High Class Call Girls Nagpur Grishma Call 7001035870 Meet With Nagpur EscortsHigh Class Call Girls Nagpur Grishma Call 7001035870 Meet With Nagpur Escorts
High Class Call Girls Nagpur Grishma Call 7001035870 Meet With Nagpur Escorts
 
High Class Call Girls Nashik Maya 7001305949 Independent Escort Service Nashik
High Class Call Girls Nashik Maya 7001305949 Independent Escort Service NashikHigh Class Call Girls Nashik Maya 7001305949 Independent Escort Service Nashik
High Class Call Girls Nashik Maya 7001305949 Independent Escort Service Nashik
 
Instant Issue Debit Cards - School Designs
Instant Issue Debit Cards - School DesignsInstant Issue Debit Cards - School Designs
Instant Issue Debit Cards - School Designs
 

Mekesson Quarterly Reports 2005 2nd

  • 1. SECURITIES AND EXCHANGE COMMISSION Washington, D.C. 20549 FORM 10-Q (Mark One) ⌧ QUARTERLY REPORT PURSUANT TO SECTION 13 OR 15(d) OF THE SECURITIES EXCHANGE ACT OF 1934 For quarter ended September 30, 2004 TRANSITION REPORT PURSUANT TO SECTION 13 OR 15(d) OF THE SECURITIES EXCHANGE ACT OF 1934 For the transition period from to Commission file number 1-13252 McKESSON CORPORATION (Exact name of Registrant as specified in its charter) Delaware 94-3207296 (State or other jurisdiction of incorporation or organization) (IRS Employer Identification No.) One Post Street, San Francisco, California 94104 (Address of principal executive offices) (Zip Code) (415) 983-8300 (Registrant’s telephone number, including area code) Indicate by check mark whether the Registrant (1) has filed all reports required to be filed by Section 13 or 15(d) of the Securities Exchange Act of 1934 during the preceding 12 months (or for such shorter period that the Registrant was required to file such reports), and (2) has been subject to such filing requirements for the past 90 days. Yes ⌧ No Indicate by check mark whether the registrant is an accelerated filer. Yes ⌧ No Indicate the number of shares outstanding of each of the issuer’s classes of common stock, as of the latest practicable date. Class Outstanding at September 30, 2004 Common stock, $0.01 par value 293,915,728 shares 1
  • 2. McKESSON CORPORATION TABLE OF CONTENTS Item Page PART I. FINANCIAL INFORMATION 1. Financial Statements Condensed Consolidated Balance Sheets September 30, 2004 and March 31, 2004............................................................................. 3 Condensed Consolidated Statements of Operations Quarter and six months ended September 30, 2004 and 2003 ............................................. 4 Condensed Consolidated Statements of Cash Flows Six months ended September 30, 2004 and 2003................................................................. 5 Financial Notes............................................................................................................................ 6-15 2. Management’s Discussion and Analysis of Results of Operations and Financial Condition Financial Review.................................................................................................................. 16 3. Quantitative and Qualitative Disclosures about Market Risk...................................................... 23 4. Controls and Procedures.............................................................................................................. 23 PART II. OTHER INFORMATION 1. Legal Proceedings ....................................................................................................................... 23 2. Unregistered Sales of Equity Securities and Use of Proceeds..................................................... 23 4. Submission of Matters to a Vote of Security Holders ................................................................. 23 6. Exhibits ....................................................................................................................................... 24 Signatures.................................................................................................................................... 24 2
  • 3. McKESSON CORPORATION PART I. FINANCIAL INFORMATION CONDENSED CONSOLIDATED BALANCE SHEETS (In millions, except per share amounts) (Unaudited) September 30, March 31, 2004 2004 ASSETS Current Assets Cash and cash equivalents $ 996.2 $ 708.0 Marketable securities 9.2 9.8 Receivables, net 5,561.8 5,418.8 Inventories 7,935.1 6,735.1 Prepaid expenses and other 134.1 132.5 Total 14,636.4 13,004.2 Property, Plant and Equipment, net 599.3 599.9 Capitalized Software Held for Sale 129.4 129.4 Notes Receivable 178.4 172.2 Goodwill and Other Intangibles 1,512.2 1,490.2 Other Assets 910.0 844.3 Total Assets $ 17,965.7 $ 16,240.2 LIABILITIES AND STOCKHOLDERS’ EQUITY Current Liabilities Drafts and accounts payable $ 8,743.1 $ 7,364.0 Deferred revenue 429.0 503.2 Current portion of long-term debt 261.2 274.8 Other 1,298.4 1,274.3 Total 10,731.7 9,416.3 Postretirement Obligations and Other Noncurrent Liabilities 496.8 448.8 Long-Term Debt 1,205.1 1,209.8 Other Commitments and Contingent Liabilities (Note 11) Stockholders’ Equity: Preferred stock, $0.01 par value, 100.0 shares authorized, no shares issued or outstanding - - Common stock, $0.01 par value Shares authorized: 800.0; shares issued: September 30, 2004 – 300.7 and March 31, 2004 – 297.1 3.0 3.0 Additional paid-in capital 2,162.3 2,047.1 Other capital (39.1) (43.2) Retained earnings 3,635.3 3,420.6 Accumulated other comprehensive income (loss) 5.3 (15.6) ESOP notes and guarantees (39.0) (52.5) Treasury shares, at cost, September 30, 2004 and March 31, 2004 – 6.8 (195.7) (194.1) Total Stockholders’ Equity 5,532.1 5,165.3 Total Liabilities and Stockholders’ Equity $ 17,965.7 $ 16,240.2 See Financial Notes 3
  • 4. McKESSON CORPORATION CONDENSED CONSOLIDATED STATEMENTS OF OPERATIONS (In millions, except per share amounts) (Unaudited) Quarter Ended Six Months Ended September 30, September 30, 2004 2003 2004 2003 Revenues $ 19,934.3 $ 16,810.1 $ 39,120.9 $ 33,334.3 Cost of Sales 19,199.3 15,998.4 37,533.9 31,736.1 Gross Profit 735.0 811.7 1,587.0 1,598.2 Operating Expenses 606.2 584.6 1,197.4 1,119.5 Operating Income 128.8 227.1 389.6 478.7 Interest Expense (30.2) (30.0) (59.8) (59.8) Other Income, Net 15.0 15.1 29.9 27.0 Income Before Income Taxes 113.6 212.2 359.7 445.9 Income Taxes (27.5) (55.7) (110.0) (133.8) Net Income $ 86.1 $ 156.5 $ 249.7 $ 312.1 Earnings Per Common Share Diluted $ 0.29 $ 0.53 $ 0.84 $ 1.05 Basic $ 0.29 $ 0.54 $ 0.85 $ 1.08 0.12 Dividends Declared Per Common Share $ 0.06 $ 0.06 $ 0.12 $ Weighted Average Shares Diluted 300.0 300.3 300.1 299.2 Basic 292.8 289.9 292.1 289.9 See Financial Notes 4
  • 5. McKESSON CORPORATION CONDENSED CONSOLIDATED STATEMENTS OF CASH FLOWS (In millions) (Unaudited) Six Months Ended September 30, 2004 2003 Operating Activities Net income $ 249.7 $ 312.1 Adjustments to reconcile to net cash provided (used) by operating activities: Depreciation 55.5 49.5 Amortization 68.0 58.4 Provision for bad debts 12.8 39.8 Deferred taxes on income 122.5 126.0 Other non-cash items (2.4) (21.2) Total 506.1 564.6 Effects of changes in: Receivables (158.4) (376.9) Inventories (1,171.9) (900.0) Drafts and accounts payable 1,343.0 523.6 Deferred revenue (75.3) (48.4) Taxes (53.4) (38.2) Other (8.1) (23.0) Total (124.1) (862.9) Net cash provided (used) by operating activities 382.0 (298.3) Investing Activities Property acquisitions (54.2) (46.5) Capitalized software expenditures (67.4) (95.4) Acquisitions of businesses, less cash and cash equivalents acquired (47.6) (7.3) Notes receivable, net (36.5) 25.6 Proceeds from sale of notes receivable 38.5 35.2 Proceeds from sale of business 12.3 - Other (0.7) 22.6 Net cash used by investing activities (155.6) (65.8) Financing Activities Proceeds from issuance of debt - 135.0 Repayment of debt (14.3) (6.8) Capital stock transactions Issuances 88.8 57.6 Share repurchases - (75.3) ESOP notes and guarantees 13.5 5.8 Dividends paid (35.0) (34.8) Other 8.8 22.2 Net cash provided by financing activities 61.8 103.7 Net increase (decrease) in cash and cash equivalents 288.2 (260.4) Cash and cash equivalents at beginning of period 708.0 522.0 Cash and cash equivalents at end of period $ 996.2 $ 261.6 See Financial Notes 5
  • 6. McKESSON CORPORATION FINANCIAL NOTES (Unaudited) 1. Significant Accounting Policies Basis of Presentation. The condensed consolidated financial statements of McKesson Corporation (“McKesson,” the “Company,” or “we” and other similar pronouns) include the financial statements of all majority- owned or controlled companies. Significant intercompany transactions and balances have been eliminated. In our opinion, these unaudited condensed consolidated financial statements include all adjustments necessary for a fair presentation of the Company’s financial position as of September 30, 2004, and the results of operations for the quarters and six months ended September 30, 2004 and 2003 and cash flows for the six months ended September 30, 2004 and 2003. The results of operations for the quarters and six months ended September 30, 2004 and 2003 are not necessarily indicative of the results that may be expected for the entire year. These interim financial statements should be read in conjunction with the annual audited financial statements, accounting policies and financial notes included in our 2004 consolidated financial statements previously filed with the Securities and Exchange Commission (“SEC”). As described in our Annual Report on Form 10-K for the year ended March 31, 2004, we reorganized our businesses on April 1, 2004. This reorganization resulted in changes to our reporting segments. On April 29 and 30, 2004, we provided financial information about this reorganization, as it relates to prior periods, in a Form 8-K. Certain prior period amounts have been reclassified to conform to the current period presentation. The Company’s fiscal year begins on April 1 and ends on March 31. Unless otherwise noted, all references to a particular year shall mean the Company’s fiscal year. New Accounting Pronouncements. In January 2003, the Financial Accounting Standards Board (“FASB”) issued Interpretation (“FIN”) No. 46, “Consolidation of Variable Interest Entities” and in December 2003, a revised interpretation was issued (FIN No. 46(R)). In general, a variable interest entity (“VIE”) is a corporation, partnership, trust, or any other legal structure used for business purposes that either does not have equity investors with voting rights or has equity investors that do not provide sufficient financial resources for the entity to support its activities. FIN No. 46 requires a VIE to be consolidated by a company if that company is designated as the primary beneficiary. The interpretation applies to VIEs created after January 31, 2003, and for all financial statements issued after December 15, 2003 for VIEs in which an enterprise held a variable interest that it acquired before February 1, 2003. We implemented FIN Nos. 46 and 46(R) on a retroactive basis as required in 2004. As a result of the implementation, the Company no longer consolidates its investment in the McKesson Financing Trust (the “Trust”) as the Company was not designated as the Trust’s primary beneficiary. In accordance with this accounting standard, the Company now recognizes the debentures issued to the Trust as long-term debt in its consolidated financial statements in lieu of the preferred securities that the Trust issued to third parties. Additionally, the consolidated financial statements include interest expense on the debentures and no longer report dividends on the preferred securities, net of tax. These changes increased the Company’s net debt to net capital employed ratio slightly but did not have a material impact on our consolidated financial statements, including diluted earnings per share. In April 2003, the FASB issued Statement of Financial Accounting Standards (“SFAS”) No. 149, “Amendment of Statement 133 on Derivative Instruments and Hedging Activities.” SFAS No. 149 amends SFAS No. 133 for decisions made as part of the FASB’s Derivatives Implementation Group process, other FASB projects dealing with financial instruments, and in connection with implementation issues raised in relation to the application of the definition of a derivative. This statement is generally effective for contracts entered into or modified after June 30, 2003 and for hedging relationships designated after June 30, 2003. The adoption of this standard did not have a material impact on our consolidated financial statements. In May 2003, the FASB issued SFAS No. 150, “Accounting for Certain Financial Instruments with Characteristics of both Liabilities and Equity.” SFAS No. 150 clarifies the definition of a liability as currently defined in FASB Concepts Statement No. 6, “Elements of Financial Statements,” as well as other planned revisions. This statement requires a financial instrument that embodies an obligation of an issuer to be classified as a liability. In addition, the statement establishes standards for the initial and subsequent measurement of these financial instruments and disclosure requirements. SFAS No. 150 is effective for financial instruments entered into or 6
  • 7. McKESSON CORPORATION FINANCIAL NOTES (Continued) (Unaudited) modified after May 31, 2003 and for all other matters, at the beginning of our second quarter 2004. The adoption of this standard did not have a material impact on our consolidated financial statements. In December 2003, the Staff of the SEC issued Staff Accounting Bulletin (“SAB”) No. 104, “Revenue Recognition,” which supersedes SAB No. 101, “Revenue Recognition in Financial Statements.” SAB No. 104’s primary purpose is to rescind the accounting guidance contained in SAB No. 101 related to multiple-element revenue arrangements that was superseded as a result of the issuance of Emerging Issues Task Force (“EITF”) Issue No. 00-21. Additionally, SAB No. 104 rescinds the SEC’s related Revenue Recognition in Financial Statements Frequently Asked Questions and Answers issued with SAB No. 101 that had previously been codified by the SEC. While the wording of SAB No. 104 reflects the issuance of EITF Issue No. 00-21, the revenue recognition principles of SAB No. 101 remain largely unchanged by the issuance of SAB No. 104, which was effective upon issuance. The adoption of SAB No. 104 did not have a material effect on our consolidated financial position or results of operations. In January 2004, the FASB issued Financial Staff Position (“FSP”) 106-1, “Accounting and Disclosure Requirements Related to the Medicare Prescription Drug, Improvement and Modernization Act of 2003”. The Medicare Prescription Drug, Improvement and Modernization Act of 2003 (the “Act”) allows employers that sponsor a postretirement plan providing a qualifying or eligible prescription drug benefit to receive a federal subsidy. As permitted by FSP No. 106-1, we elected to defer recognizing the effects of the Act until authoritative guidance on accounting for the new subsidy was issued. In May 2004, the FASB issued FSP No. 106-2 which provides accounting guidance for this new subsidy. Management has concluded that the prescription drug benefits provided to our Medicare-eligible retirees are actuarially equivalent based on the current interpretation of the guidance included in the Act and accordingly, the Company adopted the provisions of FSP No. 106-2 in the second quarter of 2005. The expected subsidy had the effect of reducing the Company’s accumulated postretirement benefit obligation by approximately $19 million. This reduction is recognized as an actuarial gain and will be amortized over three years. The expected subsidy will result in a reduction in interest cost of approximately $1 million in 2005. As required by the FSP, the Company recognized a total $3.7 million reduction in postretirement benefit expense in the second quarter of 2005, including amounts attributable to the first quarter of 2005. Employee Stock-Based Compensation. We account for our employee stock-based compensation plans using the intrinsic value method under Accounting Principles Board (“APB”) Opinion No. 25, “Accounting for Stock Issued to Employees.” We apply the disclosure provisions of SFAS No. 123, “Accounting for Stock-Based Compensation,” as amended by SFAS No. 148, “Accounting for Stock-Based Compensation – Transition and Disclosure.” Had compensation cost for our employee stock-based compensation been recognized based on the fair value method, consistent with the provisions of SFAS No. 123, net income and earnings per share would have been as follows: Quarter Ended Six Months Ended September 30, September 30, (In millions, except per share amounts) 2004 2003 2004 2003 Net income, as reported $ 86.1 $ 156.5 $ 249.7 $ 312.1 Compensation expense, net of tax: APB Opinion No. 25 expense included in net income 1.6 2.0 3.0 2.8 SFAS No. 123 expense (15.5) (23.8) (23.1) (50.5) Pro forma net income $ 72.2 $ 134.7 $ 229.6 $ 264.4 Earnings per share: Diluted – as reported $ 0.29 $ 0.53 $ 0.84 $ 1.05 Diluted – pro forma 0.25 0.45 0.78 0.89 Basic – as reported 0.29 0.54 0.85 1.08 Basic – pro forma 0.25 0.46 0.79 0.91 SFAS No. 123 compensation expense, as indicated in the above table, decreased in the second quarter and the first half of 2005 compared to the same periods a year ago. The decrease is primarily attributable to accelerated vesting of substantially all unvested stock options outstanding during the fourth quarter of 2004. SFAS No. 123 7
  • 8. McKESSON CORPORATION FINANCIAL NOTES (Continued) (Unaudited) compensation expense is typically amortized over the related vesting period; as a result, these fully vested stock options did not have an impact on the expense during the quarter and the six months ended September 30, 2004. Partially offsetting this decrease, during the first quarter of 2005, we granted 6.0 million stock options that vest on or before March 31, 2005 and have a seven year term. Historically, options granted by the Company generally vest over four years and have a term of ten years. 2. Acquisitions On April 1, 2004, we acquired all of the issued and outstanding shares of Moore Medical Corp. (“MMC”), of New Britain, Connecticut, for an aggregate cash purchase price of approximately $37 million. MMC is an Internet- enabled, multi-channel marketer and distributor of medical-surgical and pharmaceutical products to non-hospital provider settings. Approximately $22 million of the purchase price has been assigned to goodwill, none of which is deductible for tax purposes. The results of MMC’s operations have been included in the condensed consolidated financial statements within our Medical-Surgical Solutions segment since the acquisition date. We also completed several smaller acquisitions within our Medical-Surgical Solutions and Provider Technologies segments. Purchase prices have been allocated based on estimated fair values at the date of acquisition and may be subject to change. Pro forma results of operations have not been presented for any of the above acquisitions as the effects were not material to the condensed consolidated financial statements on either an individual or aggregate basis. 3. Restructuring Activities Net charges from restructuring activities for the quarter and the six months ended September 30, 2004 were $0.5 million and $1.1 million. These charges primarily related to a number of smaller initiatives as well as adjustments for prior years’ restructuring plans due to a change in estimated costs to complete these activities. The following table summarizes restructuring activities for the six months ended September 30, 2004: Pharmaceutical Medical-Surgical Provider Solutions Solutions Technologies Corporate Exit- Exit- Exit- (In millions) Severance Related Severance Related Severance Related Severance Total $ 0.4 $ 5.2 $ 1.7 $ 1.9 $ 0.2 $ 1.9 $ 10.5 $ 21.8 Balance, March 31, 2004 Current year expenses - 0.2 0.7 - - - - 0.9 Adjustments to prior years’ - 0.4 (0.2) - - - - 0.2 expenses Net expense for the period - 0.6 0.5 - - - - 1.1 Liabilities related to the MMC acquisition - - 4.0 - - - - 4.0 Cash expenditures (0.3) (2.2) (2.1) (0.4) - (0.3) (9.6) (14.9) $ 0.1 $ 3.6 $ 4.1 $ 1.5 $ 0.2 $ 1.6 $ 0.9 $ 12.0 Balance, September 30, 2004 Accrued restructuring liabilities are included in other liabilities in the accompanying condensed consolidated balance sheets. In connection with the April 2004 acquisition of MMC, we recorded $4.0 million of liabilities for employee severance costs. In addition to the above restructuring activities, we are still managing a 2001/2000 restructuring plan associated with customer settlements for the discontinuance of overlapping and nonstrategic products and other product development projects within our Provider Technologies segment. Customer settlement allowances, which are included as a reduction of accounts receivable in the accompanying condensed consolidated balance sheets, were reduced by $0.5 million in non-cash settlements during the first half of 2005 to $5.7 million at September 30, 2004 from $6.2 million at March 31, 2004. Total cash and non-cash settlements of $45.3 million and $95.5 million have 8
  • 9. McKESSON CORPORATION FINANCIAL NOTES (Continued) (Unaudited) been incurred since the inception of this restructuring plan. Non-cash settlements represent write-offs of customer receivables. There have been no significant offsetting changes in estimates that increased the provision for customer settlements. During the second quarter of 2004, $19.7 million of the allowance was reversed into operating expenses due to favorable settlements and continued negotiations with affected customers. At March 31, 2004, we substantially completed our negotiations with the affected customers. As a result, we do not anticipate additional significant increases to the allowance for customer settlements. However, as settlement negotiations with the remaining customers are finalized, additional adjustments to the reserve may be necessary. 4. Pension and Other Postretirement Benefit Plans The following table provides the components of the net periodic expense for the Company’s defined benefit pension and postretirement plans: Quarter Ended September 30, Six Months Ended September 30, Pension Postretirement Pension Postretirement (In millions) 2004 2003 2004 2003 2004 2003 2004 2003 Service cost – benefits earned $ 1.4 $ 1.6 $ 0.5 $ 0.5 $ 2.8 $ 3.2 $ 1.0 $ 1.0 during the period Interest cost on projected benefit obligation 6.4 6.8 2.4 2.9 12.8 13.6 5.3 5.8 Expected return on assets (7.4) (6.4) - - (14.8) (12.8) - - Amortization of unrecognized loss 2.2 3.0 3.9 5.8 4.4 6.0 11.0 11.6 and prior service costs Immediate recognition of pension - - - - 0.7 - - - cost Settlements and other - - - - 16.6 - - - Net periodic expense $ 2.6 $ 5.0 $ 6.8 $ 9.2 $ 22.5 $ 10.0 $ 17.3 $ 18.4 We adopted the provisions of FSP No. 106-2 in the second quarter of 2005. The expected subsidy had the effect of reducing the Company’s accumulated postretirement benefit obligation by approximately $19 million. This reduction is recognized as an actuarial gain and will be amortized over three years. The expected subsidy will result in a reduction in interest cost of approximately $1 million in 2005. As required by the FSP, the Company recognized a total $3.7 million reduction in postretirement benefit expense in the second quarter of 2005, including amounts attributable to the first quarter of 2005. During the quarter ended June 30, 2004, we made several lump sum payments totaling approximately $42 million from an unfunded U.S. pension plan. In accordance with SFAS No. 88, “Employers’ Accounting for Settlements and Curtailments of Defined Benefit Pension Plans and for Termination Benefits”, approximately $12 million in settlement charges associated with these payments were expensed in the first quarter of 2005. Substantially all of this expense was recorded in the Corporate segment. 5. Income Taxes Income tax expense for the second quarter of 2005 reflects a $6.4 million income tax benefit which was primarily due to a reduction of a portion of a valuation allowance related to state income tax net operating loss carryforwards. We believe that the income tax benefit from a portion of these state net operating loss carryforwards will now be realized. During the first quarter of 2005, we sold a business for net cash proceeds of $12.3 million. The disposition resulted in a pre-tax loss of $1.1 million and an after-tax loss of $4.6 million. The after-tax loss on the disposition was the result of a lower tax adjusted cost basis for the business. Financial results for this business were included in our Pharmaceutical Solutions segment and were not material to our condensed consolidated financial statements. Partially offsetting the tax impact of this disposition, a net income tax benefit of $2.2 million relating to favorable tax settlements and adjustments was recorded. 9
  • 10. McKESSON CORPORATION FINANCIAL NOTES (Continued) (Unaudited) Income tax expense for the second quarter of 2004 includes an income tax benefit of $15.3 million relating to favorable tax settlements with the U.S. Internal Revenue Service. These settlements pertain to amended tax returns for the years ended December 31, 1997 and 1998 filed by our subsidiary, McKesson Information Solutions LLC, formerly known as HBO & Company. The benefit of these tax assets was not previously recognized by the Company. 6. Earnings Per Share Basic earnings per share is computed by dividing net income by the weighted average number of common shares outstanding during the reporting period. Diluted earnings per share is computed similarly except that it reflects the potential dilution that could occur if dilutive securities or other obligations to issue common stock were exercised or converted into common stock. The computations for basic and diluted earnings per share are as follows: Quarter Ended Six Months Ended September 30, September 30, (In millions, except per share amounts) 2004 2003 2004 2003 Net income $ 86.1 $ 156.5 $ 249.7 $ 312.1 Interest expense on convertible junior subordinated debentures, net of tax benefit 1.6 1.6 3.1 3.1 Net income – diluted $ 87.7 $ 158.1 $ 252.8 $ 315.2 Weighted average common shares outstanding: Basic 292.8 289.9 292.1 289.9 Effect of dilutive securities: Options to purchase common stock 1.6 4.5 2.4 3.3 Convertible junior subordinated debentures 5.4 5.4 5.4 5.4 Restricted stock 0.2 0.5 0.2 0.6 Diluted 300.0 300.3 300.1 299.2 Earnings per common share: Basic $ 0.29 $ 0.54 $ 0.85 $ 1.08 Diluted $ 0.29 $ 0.53 $ 0.84 $ 1.05 Approximately 40 million and 38 million stock options were excluded from the computations of diluted net earnings per share for the quarters ended September 30, 2004 and 2003 as their exercise price was higher than the Company’s average stock price. For the six months ended September 30, 2004 and 2003, the number of stock options excluded was approximately 40 million and 32 million. 7. Goodwill and Other Intangible Assets Changes in the carrying amount of goodwill for the six months ended September 30, 2004 are as follows: Pharmaceutical Medical-Surgical Provider Solutions Solutions Technologies Total (In millions) $ 297.7 $ 725.2 $ 382.9 $ 1,405.8 Balance, March 31, 2004 Goodwill acquired 1.2 22.2 3.5 26.9 Sale of business (10.3) - - (10.3) Translation adjustments 0.1 - 3.9 4.0 $ 288.7 $ 747.4 $ 390.3 $ 1,426.4 Balance, September 30, 2004 10
  • 11. McKESSON CORPORATION FINANCIAL NOTES (Continued) (Unaudited) Information regarding other intangibles is as follows: September 30, March 31, 2004 2004 (In millions) Customer lists $ 100.9 $ 92.9 Technology 63.3 61.2 Trademarks and other 26.5 23.8 Total other intangibles, gross 190.7 177.9 Accumulated amortization (104.9) (93.5) Total other intangibles, net $ 85.8 $ 84.4 Amortization expense of other intangibles was $5.4 million and $11.6 million for the quarter and six months ended September 30, 2004 and $5.1 million and $9.7 million for the comparable prior year periods. The weighted average remaining amortization periods for customer lists, technology and trademarks and other intangible assets at September 30, 2004 were: 8 years, 4 years and 5 years. Estimated future annual amortization expense of these assets is as follows: $21.1 million, $16.0 million, $15.6 million, $12.0 million and $5.9 million for 2005 through 2009, and $9.0 million thereafter. At September 30, 2004, there were $17.8 million of other intangibles not subject to amortization. 8. Financing Activities In September 2004, we entered into a $1.3 billion five-year, senior unsecured revolving credit facility. Borrowings under the new credit facility bear interest at a fixed base rate, or a floating rate based on the British Banker’s Association LIBOR rate or a Eurodollar rate. Effective as of the closing date of the new credit facility agreement, we terminated the commitments under our existing $550 million, three-year revolving credit facility that would have expired in September 2005, as well as our $650 million, 364-day credit facility that would have expired on September 28, 2004. In June 2004, we renewed our committed revolving receivables sale facility under substantially similar terms to those previously in place, with the exception that the facility was increased by $300.0 million to $1.4 billion. The renewed facility expires in June 2005. At September 30, 2004 and March 31, 2004, no amounts were outstanding or utilized under any of the facilities. In addition, in 2005 and 2004, we sold customer lease receivables for cash proceeds of $38.5 million and $35.2 million. The sale of these receivables resulted in a pre-tax gain of $0.2 million and $2.5 million which is included in Other Income, Net in the condensed consolidated statement of operations. 9. Convertible Junior Subordinated Securities In February 1997, we issued 5% Convertible Junior Subordinated Debentures (the “Debentures”) in an aggregate principal amount of $206,186,000. The Debentures, which are included in long-term debt, mature on June 1, 2027, bear interest at an annual rate of 5%, payable quarterly, and are currently redeemable by us at 101.5% of the principal amount. The Debentures were purchased by the Trust, which is wholly owned by the Company, with proceeds from its issuance of four million shares of preferred securities to the public and 123,720 common securities to us. These preferred securities are convertible at the holder’s option into the Company’s common stock. The Debentures represent the sole assets of the Trust. Holders of the preferred securities are entitled to cumulative cash distributions at an annual rate of 5% of the liquidation amount of $50 per security. Each preferred security is convertible at the rate of 1.3418 shares of the Company’s common stock, subject to adjustment in certain circumstances. The preferred securities will be redeemed upon repayment of the Debentures and are callable by us on or after March 4, 2000, in whole or in part, initially at 103.5% of the liquidation preference per share, and thereafter at prices declining at 0.5% per annum to 100% of the liquidation preference on and after March 4, 2007 plus, in each case, accumulated, accrued and unpaid distributions, if any, to the redemption date. 11
  • 12. McKESSON CORPORATION FINANCIAL NOTES (Continued) (Unaudited) We have guaranteed, on a subordinated basis, distributions and other payments due on the preferred securities (the “Guarantee”). The Guarantee, when taken together with our obligations under the Debentures, and in the indenture pursuant to which the Debentures were issued, and our obligations under the Amended and Restated Declaration of Trust governing the Trust, provides a full and unconditional guarantee of amounts due on the preferred securities. 10. Financial Guarantees and Warranties Financial Guarantees We have agreements with certain of our customers’ financial institutions under which we have guaranteed the repurchase of inventory (primarily for our Canadian businesses), at a discount, in the event these customers are unable to meet certain obligations to those financial institutions. Among other limitations, these inventories must be in resalable condition. We have also guaranteed loans and the payment of leases for some customers; and we are a secured lender for substantially all of these guarantees. Customer guarantees range from one to ten years and were primarily provided to facilitate financing for certain strategic customers. At September 31, 2004, the maximum amounts of inventory repurchase guarantees and other customer guarantees were approximately $163 million and $14 million of which a nominal amount has been accrued. During the second quarter of 2004, one of our Pharmaceutical Solutions customers announced its bankruptcy. Accordingly, we reviewed all amounts owed to us from this customer as well as financial guarantees provided to third parties in favor of this customer, and as a result, we increased our provision for doubtful accounts by $30.0 million. During the first quarter of 2005, we converted a $40.0 million credit facility guarantee in favor of this customer, who had recently emerged from bankruptcy, to a note receivable due from this customer. The secured note bears interest and is repayable in various installments through 2007. At September 30, 2004, we had commitments of $10.2 million, primarily consisting of the purchase of services from our equity-held investments, for which no amounts had been accrued. In addition, our banks and insurance companies have issued $87.2 million of standby letters of credit and surety bonds on our behalf in order to meet the security requirements for statutory licenses and permits, court and fiduciary obligations, and our workers’ compensation and automotive liability programs. Our software license agreements generally include certain provisions for indemnifying customers against liabilities if our software products infringe a third party’s intellectual property rights. To date, we have not incurred any material costs as a result of such indemnification agreements and have not accrued any liabilities related to such obligations. In conjunction with certain transactions, primarily divestitures, we may provide routine indemnification agreements (such as retention of previously existing environmental, tax and employee liabilities) whose terms vary in duration and often are not explicitly defined. Where appropriate, obligations for such indemnifications are recorded as liabilities. Because the amounts of these indemnification obligations often are not explicitly stated, the overall maximum amount of these commitments cannot be reasonably estimated. Other than obligations recorded as liabilities at the time of divestiture, we have historically not made significant payments as a result of these indemnification provisions. Warranties In the normal course of business, we provide certain warranties and indemnification protection for our products and services. For example, we provide warranties that the pharmaceutical and medical-surgical products we distribute are in compliance with the Food, Drug and Cosmetic Act and other applicable laws and regulations. We have received the same warranties from our suppliers, who customarily are the manufacturers of the products. In addition, we have indemnity obligations to our customers for these products, which have also been provided to us from our suppliers, either through express agreement or by operation of law. 12
  • 13. McKESSON CORPORATION FINANCIAL NOTES (Continued) (Unaudited) We also provide warranties regarding the performance of software and automation products we sell. Our liability under these warranties is to bring the product into compliance with previously agreed upon specifications. For software products, this may result in additional project costs which are reflected in our estimates used for the percentage-of-completion method of accounting for software installation services within these contracts. In addition, most of our customers who purchase our software and automation products also purchase annual maintenance agreements. Revenue from these maintenance agreements is recognized on a straight-line basis over the contract period and the cost of servicing product warranties is charged to expense when claims become estimable. Accrued warranty costs were not material to the condensed consolidated balance sheets. 11. Other Commitments and Contingent Liabilities In our annual report on Form 10-K for the year ended March 31, 2004, and in our quarterly report on Form 10- Q for the quarter ended June 30, 2004, we reported on numerous legal proceedings. Since that quarterly report, the only significant developments were as follows: I. Other Litigation On October 18, 2004, in the previously reported action captioned Charlene Roby vs. McKesson HBOC, Inc. et al, (Action No. CV01-573), the trial court awarded plaintiff, in addition to the amounts previously reported, approximately $0.7 million in attorneys fees. We will seek reduction or reversal of this incremental award on appeal, as is our intent with respect to the entire judgment. As previously reported, if our appeal from the entire judgment in this matter is unsuccessful, the judgment could have an adverse impact on our consolidated financial statements. II. Contingency As discussed in our annual report on Form 10-K for the year ended March 31, 2004, in 2002, we entered into a $500 million, ten year contract with the National Health Services Information Authority (“NHS”), an organization of the British government charged with the responsibility of delivering healthcare in England and Wales. The contract engages the Company to develop, implement and operate a human resources and payroll system at more than 600 NHS locations. To date, there have been delays to this contract which have caused increased costs and a decrease in the amount of time in which we can earn revenues. These delays have adversely impacted the contract's projected profitability and no material revenue has yet been recognized on this contract. As of September 30, 2004, our consolidated balance sheet includes an investment of approximately $86 million in net assets, consisting of prepaid expenses, software and capital assets, net of cash received, related to this contract. While we believe it is likely that we can deliver and operate an acceptable system and recover our investment in this contract, we are currently negotiating with the NHS to amend certain key terms and conditions in the contract, and there is no certainty we will agree on an updated implementation plan. Our goal is to complete this negotiation by the end of fiscal 2005. However, the timing and the outcome of these negotiations is uncertain and failure to reach agreement on an updated implementation plan and amend certain key contract terms and conditions, and/or further delays in the implementation may result in losses that could be material. Even if we agree on amended contract terms and conditions and an updated implementation plan, it is possible that the terms of that agreement may result in the impairment of our net assets related to the contract as well as substantial penalties and charges, which could have a material adverse impact on our consolidated financial statements. 13
  • 14. McKESSON CORPORATION FINANCIAL NOTES (Continued) (Unaudited) 12. Stockholders’ Equity Comprehensive income is as follows: Quarter Ended Six Months Ended September 30, September 30, 2004 2003 2004 2003 (In millions) Net income $ 86.1 $ 156.5 $ 249.7 $ 312.1 Unrealized gain (loss) on marketable securities and investments, net of income taxes (0.1) 0.2 (0.1) 0.2 Additional minimum pension liability, net of income taxes (4.1) - (4.1) - Foreign currency translation adjustments 31.8 (11.2) 25.1 22.3 Comprehensive income $ 113.7 $ 145.5 $ 270.6 $ 334.6 During the second quarter of 2005, the Company’s Board of Directors (the “Board”) approved a plan to renew the common stock rights plan, which was scheduled to expire in the third quarter of 2005. Under the renewal of the plan, effective October 22, 2004, the Board declared a dividend distribution of one right (a “Right”) for each outstanding share of Company common stock. Each Right entitles the holder to purchase, upon the occurrence of certain triggering events, a unit consisting of one one-hundredth of a share of Series A Junior Participating Preferred Stock. Triggering events include, without limitation, the acquisition by another entity of 15% or more of the Company’s common stock without the prior approval of the Board. The Rights have certain anti-takeover effects that will cause substantial dilution to the ownership interest of a person or group that attempts to acquire the Company on terms not approved by the Board. The new Rights will expire in 2014, unless the date is extended or the Rights redeemed or exchanged earlier by the Board. 13. Segment Information In April 2004, we reconfigured our operating segments to better align product development and selling efforts with the evolving needs of the healthcare market. As a result, commencing in the first quarter of 2005, we are reporting the following three operating segments: Pharmaceutical Solutions, Medical-Surgical Solutions and Provider Technologies. Prior period amounts have been reclassified to conform to the 2005 segment presentation. We evaluate the performance of our operating segments based on operating profit before interest expense, income taxes and results from discontinued operations. Our Corporate segment includes expenses associated with Corporate functions and projects. Corporate expenses are allocated to the operating segments to the extent that these items can be directly attributable to the segment. The Pharmaceutical Solutions segment distributes ethical and proprietary drugs and health and beauty care products throughout North America. This segment also manufactures and sells automated pharmaceutical dispensing systems for retail pharmacies, medical management and pharmaceutical solutions for biotech and pharmaceutical manufacturers, patient and payor services, and consulting and outsourcing services to pharmacies. We have added the Clinical Auditing and Compliance business, which was previously included in our former Information Solutions segment, to this segment’s expanded payor services business. This business sells software to payors for auditing professional claims. The Medical-Surgical Solutions segment distributes medical-surgical supplies and equipment and provides logistics and related services within the United States. This segment now includes Zee Medical, which was formerly included in our Pharmaceutical Solutions segment. Zee Medical provides first aid and safety products and training services to corporate customers. The operating results of this segment for the quarter and the six months ended September 30, 2004 also reflect the impact of the acquisition of MMC. The Provider Technologies segment consists of the former Information Solutions segment plus the McKesson Inpatient Automation business, which was previously included in our Pharmaceutical Solutions segment, and the Corporate Solutions group, which was previously managed by our Corporate group. This segment continues to deliver enterprise-wide patient care, clinical, financial, supply chain, managed care and strategic management 14
  • 15. McKESSON CORPORATION FINANCIAL NOTES (Concluded) (Unaudited) software solutions as well as outsourcing and other services to healthcare organizations throughout North America, the United Kingdom and Europe. McKesson Inpatient Automation provides automation and robotics for the hospital market, and the Corporate Solutions group continues to be responsible for the sales coordination of complex provider engagements that include strategic product and service solutions from multiple business units. Expenses incurred by Corporate Solutions on behalf of other business segments are allocated to the applicable business segments. Financial information relating to our segments is as follows: Quarter Ended Six Months Ended September 30, September 30, (In millions) 2004 2003 2004 2003 Revenues Pharmaceutical Solutions $ 18,916.8 $ 15,782.6 $ 37,096.5 $ 31,326.0 Medical-Surgical Solutions 713.5 716.1 1,420.7 1,426.2 Provider Technologies 304.0 311.4 603.7 582.1 Total $ 19,934.3 $ 16,810.1 $ 39,120.9 $ 33,334.3 Operating profit Pharmaceutical Solutions (1) $ 150.7 $ 221.7 $ 441.2 $ 486.7 Medical-Surgical Solutions 17.5 25.3 46.1 51.1 Provider Technologies 19.2 37.2 33.5 41.9 Total 187.4 284.2 520.8 579.7 Corporate (2) (43.6) (42.0) (101.3) (74.0) Interest expense (30.2) (30.0) (59.8) (59.8) Income before income taxes $ 113.6 $ 212.2 $ 359.7 $ 445.9 September 30, March 31, (In millions) 2004 2004 Segment assets, at period end Pharmaceutical Solutions $ 13,440.6 $ 12,050.5 Medical-Surgical Solutions 1,638.5 1,539.2 Provider Technologies 1,371.5 1,402.7 Total 16,450.6 14,992.4 Corporate Cash, cash equivalents, and marketable securities 1,005.4 717.8 Other 509.7 530.0 Total $ 17,965.7 $ 16,240.2 (1) Operating profit for the first half of 2005 includes $41.2 million received as our share of a settlement of an antitrust class action lawsuit involving a drug manufacturer. This settlement was recorded as a credit in cost of sales within our Pharmaceutical Solutions segment in our condensed consolidated statements of operations. (2) Corporate expenses for the first half of 2005 include pension settlement charges as discussed in Financial Note 4. Corporate expenses for the first half of 2004 include an $8.5 million gain on the sale of a surplus property. 15
  • 16. McKESSON CORPORATION FINANCIAL REVIEW (Unaudited) Item 2. Management’s Discussion and Analysis of Results of Operations and Financial Condition Financial Overview Quarter Ended Six Months Ended September 30, September 30, (Dollars in millions, except per share data) 2004 2003 Change 2004 2003 Change Revenues $ 19,934.3 $ 16,810.1 19% $ 39,120.9 $ 33,334.3 17% Net Income 86.1 156.5 (45) 249.7 312.1 (20) Diluted Earnings Per Share $ 0.29 $ 0.53 (45) $ 0.84 $ 1.05 (20) Revenues for the quarter ended September 30, 2004 grew 19% to $19.9 billion, net income decreased 45% to $86.1 million and diluted earnings per share decreased 45% to $0.29 compared to the same period a year ago. For the six months ended September 30, 2004, revenue increased 17% to $39.1 billion, net income decreased 20% to $249.7 million and diluted earnings per share decreased 20% to $0.84 compared to the first half of 2004. Decreases in net income and diluted earnings per share primarily reflect lower operating profit in our Pharmaceutical Solutions segment due to a decline in volume-weighted price increases for U.S. pharmaceutical products. Results of Operations Revenues: Quarter Ended Six Months Ended September 30, September 30, (Dollars in millions) 2004 2003 Change 2004 2003 Change Pharmaceutical Solutions U.S. Healthcare direct distribution and services $ 11,637.9 $ 9,655.0 21% $ 22,649.2 $ 18,990.0 19% U.S. Healthcare sales to customers’ warehouses 6,021.1 5,057.6 19 11,937.3 10,222.0 17 Subtotal 17,659.0 14,712.6 20 34,586.5 29,212.0 18 Canada distribution and services 1,257.8 1,070.0 18 2,510.0 2,114.0 19 Total Pharmaceutical Solutions 18,916.8 15,782.6 20 37,096.5 31,326.0 18 Medical-Surgical Solutions 713.5 716.1 - 1,420.7 1,426.2 - Provider Technologies Software and software systems 50.0 67.5 (26) 100.6 113.1 (11) Services 228.5 216.6 5 450.7 420.9 7 Hardware 25.5 27.3 (7) 52.4 48.1 9 Total Provider Technologies 304.0 311.4 (2) 603.7 582.1 4 Total Revenues $ 19,934.3 $ 16,810.1 19 $ 39,120.9 $ 33,334.3 17 Revenues increased by 19% to $19.9 billion and 17% to $39.1 billion during the quarter and six months ended September 30, 2004 compared to the same periods a year ago. The increase reflects growth in our Pharmaceutical Solutions segment, which accounted for over 94% of consolidated revenues. Increases in U.S. Healthcare pharmaceutical direct distribution and services revenues primarily reflect market growth rates as well as new institutional customers in our pharmaceutical distribution business and growth from our existing customers. Market growth rates reflect growing drug utilization and price increases, offset in part by the increased use of lower priced generics. In May 2004, we began implementation on a new pharmaceutical distribution contract with the Department of Veterans Affairs, which significantly contributed to the segment’s total increase in revenues. Annual revenues on this contract are expected to exceed $3.5 billion. U.S. Healthcare sales to customers’ warehouses also increased primarily as a result of greater volume to, and expanded agreements with, existing customers. Sales to customers’ warehouses include the implementation of the AdvancePCS business acquired by our customer, Caremark, which began in the second quarter of 2005. 16
  • 17. McKESSON CORPORATION FINANCIAL REVIEW (Continued) (Unaudited) Canadian pharmaceutical distribution revenues increased reflecting market growth rates, favorable exchange rates and new business as certain manufacturers transition from direct distribution activities. On a constant currency basis, second quarter and first half 2005 revenues from our Canadian operations would have increased approximately 11% and 14% compared to the same periods a year ago. Medical-Surgical Solutions segment revenues were flat as growth in revenues in the alternate site sector was offset by a decline in revenues in the acute care sector. Increases in our alternate site sector include revenues derived from our recent acquisition of Moore Medical Corporation (“MMC”). On April 1, 2004, we acquired all of the issued and outstanding shares of MMC, of New Britain, Connecticut, for an aggregate cash purchase price of approximately $37 million. MMC is an Internet-enabled, multi-channel marketer and distributor of medical-surgical and pharmaceutical products to non-hospital provider settings. Declines in our acute care sector reflect the transition of the loss of the segment’s largest customer which began in the third quarter of the prior year. Provider Technologies segment revenues declined slightly during the quarter primarily reflecting a reduction in software and software systems revenues due to the complexity and time required for clinical system implementations, which slow the rate at which the related revenue is recognized. On a year-to-date basis, Provider Technologies segment revenues increased primarily reflecting greater demand for our clinical application offerings. Gross Profit: Quarter Ended Six Months Ended September 30, September 30, (Dollars in millions) 2004 2003 Change 2004 2003 Change Gross Profit Pharmaceutical Solutions $ 431.8 $ 508.9 (15)% $ 992.2 $ 1,027.1 (3)% Medical-Surgical Solutions 161.9 151.3 7 320.6 297.3 8 Provider Technologies 141.3 151.5 (7) 274.2 273.8 - Total $ 735.0 $ 811.7 (9) $ 1,587.0 $ 1,598.2 (1) Gross Profit Margin Pharmaceutical Solutions 2.28% 3.22% (94) bp 2.67% 3.28% (61) bp Medical-Surgical Solutions 22.69 21.13 156 22.57 20.85 172 Provider Technologies 46.48 48.65 (217) 45.42 47.04 (162) Total 3.69 4.83 (114) 4.06 4.79 (73) Gross profit for the second quarter and first half of 2005 decreased 9% and 1%. As a percentage of revenues, gross profit margin decreased 114 basis points to 3.69% for the second quarter of 2005 and 73 basis points to 4.06% for the first half of 2005 primarily reflecting a higher proportion of revenues attributable to our Pharmaceutical Solutions segment, which has lower margins relative to our other segments, as well as a decline in this segment’s gross margin. Gross profit margin increased in our Medical-Surgical Solutions segment primarily due to a higher proportion of revenues being derived from our alternate site sector, which has higher margins relative to the segment’s other sectors. Gross profit margin declined in our Provider Technologies segment primarily reflecting a lower proportion of software and software systems revenues, which have higher margins relative to the segment’s other revenues. During the second quarter and first half of 2005, gross margin for our Pharmaceutical Solutions segment was impacted by: • lower manufacturer price increases in the second quarter of 2005 for U.S. pharmaceutical products. While the magnitude of price increases that have been realized this year is comparable to the prior year, the number of volume-weighted U.S. pharmaceutical price increases in the second quarter of 2005 was at the lowest level since the second quarter of 2001. We have been actively working with manufacturers to restructure our distribution agreements to ensure that we are appropriately compensated for the services we provide and reduce our dependency on price inflation-based compensation. With many agreements already signed, we intend to substantially complete the process by the goal of the fiscal year end, March 31, 2005. While these new fee-for-service agreements are beginning to be used by certain manufacturers, our compensation from the largest manufacturers will 17
  • 18. McKESSON CORPORATION FINANCIAL REVIEW (Continued) (Unaudited) likely continue to be highly dependent on the level and timing of price increases through the end of fiscal 2005, • certain types of vendor product incentives and sources of supply, such as certain inventory purchases in the secondary market, are no longer available at historical levels to the major distributors, which has the impact of reducing gross margins. Much of this change results from the manufacturers’ desire to limit the amount of inventory in the wholesale channel, • lower selling margins within our U.S. Pharmaceutical distribution business which reflect competitive pricing pressure, and a higher proportion of revenues attributed to institutional customers, • partially offsetting the above decreases, the benefit of increased sales of generic drugs with higher margins, • a higher proportion of supplier cash discounts to revenues reflecting a change in customer mix, and • a last-in, first-out (“LIFO”) inventory credit of $10.0 million, reflecting the lower number of volume- weighted U.S. pharmaceutical price increases in the second quarter of 2005 and our expectation of a LIFO credit for the full fiscal year. During the first half of 2005, gross profit for our Pharmaceutical Solutions segment was also impacted by a reduction in cost of sales due to a receipt of $41.2 million of cash proceeds representing our share of a settlement of an antitrust class action lawsuit brought against a drug manufacturer. Our Pharmaceutical Solutions segment uses the LIFO method of accounting for the majority of its inventories, which results in cost of sales that more closely reflects replacement cost than do other accounting methods, thereby mitigating the effects of inflation and deflation on gross profit. The practice in the Pharmaceutical Solutions distribution business is to pass on to customers published price changes from suppliers. Manufacturers generally provide us with price protection, which prevents inventory losses. Price declines on many generic pharmaceutical products in this segment over the last few years have moderated the effects of inflation in other product categories, which resulted in minimal overall price changes in those years. Operating Expenses and Other Income: Quarter Ended Six Months Ended September 30, September 30, (Dollars in millions) 2004 2003 Change 2004 2003 Change Operating Expenses Pharmaceutical Solutions $ 286.9 $ 294.0 (2)% $ 562.3 $ 553.1 2% Medical-Surgical Solutions 145.1 126.6 15 276.2 248.0 11 Provider Technologies 124.8 118.5 5 244.6 238.2 3 Corporate 49.4 45.5 9 114.3 80.2 43 Total $ 606.2 $ 584.6 4 $ 1,197.4 $ 1,119.5 7 Operating Expenses as a Percentage of Revenue Pharmaceutical Solutions 1.52% 1.86% (34) bp 1.52% 1.77% (25) bp Medical-Surgical Solutions 20.34 17.68 266 19.44 17.39 205 Provider Technologies 41.05 38.05 300 40.52 40.92 (40) Total 3.04 3.48 (44) 3.06 3.36 (30) Other Income, Net Pharmaceutical Solutions $ 5.8 $ 6.8 (15)% $ 11.3 $ 12.7 (11)% Medical-Surgical Solutions 0.7 0.6 17 1.7 1.8 (6) Provider Technologies 2.7 4.2 (36) 3.9 6.3 (38) Corporate 5.8 3.5 66 13.0 6.2 110 Total $ 15.0 $ 15.1 (1) $ 29.9 $ 27.0 11 Operating expenses increased 4% to $606.2 million in the second quarter of 2005 and 7% to $1,197.4 million in the first half of 2005. As a percentage of revenues, operating expenses decreased 44 and 30 basis points to 3.04% 18
  • 19. McKESSON CORPORATION FINANCIAL REVIEW (Continued) (Unaudited) and 3.06% for the second quarter and first half of 2005. Increases in operating expense dollars were primarily due to additional costs to support our sales volume growth, including expenses from the recently acquired MMC business, incremental shareholder litigation costs and $7.4 million of other litigation reserves. In addition, operating expenses for the first half of 2005 included approximately $12 million of settlement charges pertaining to a non- qualified pension plan. In 2004, operating expenses included a $30.0 million bad debt provision, $9.8 million in severance charges and a credit of $19.7 million pertaining to the reversal of our customer settlement reserves due to favorable settlements and negotiations with affected customers. Operating expenses for the six months ended September 30, 2003 also benefited from an $8.5 million gain on the sale of a surplus property. As a percentage of revenues, operating expenses decreased primarily due to the leveraging of our fixed cost infrastructure and productivity improvements in back-office and field operations within our Pharmaceutical Solutions segment. Other income approximated that of the prior year. Segment Operating Profit and Corporate Expenses: Quarter Ended Six Months Ended September 30, September 30, (Dollars in millions) 2004 2003 Change 2004 2003 Change Segment Operating Profit (1) Pharmaceutical Solutions $ 150.7 $ 221.7 (32) % $ 441.2 $ 486.7 (9) % Medical-Surgical Solutions 17.5 25.3 (31) 46.1 51.1 (10) Provider Technologies 19.2 37.2 (48) 33.5 41.9 (20) Total 187.4 284.2 (34) 520.8 579.7 (10) Corporate Expenses (43.6) (42.0) 4 (101.3) (74.0) 37 Interest Expense (30.2) (30.0) 1 (59.8) (59.8) - Income Before Income Taxes $ 113.6 $ 212.2 (46) $ 359.7 $ 445.9 (19) Segment Operating Profit Margin Pharmaceutical Solutions 0.80% 1.40 % (60) bp 1.19% 1.55% (36) bp Medical-Surgical Solutions 2.45 3.53 (108) 3.24 3.58 (34) Provider Technologies 6.32 11.95 (563) 5.55 7.20 (165) (1) Segment operating profit includes gross profit, net of operating expenses and other income for our three business segments. Operating profit as a percentage of revenues decreased in our Pharmaceutical Solutions segment primarily reflecting a decline in gross margins, offset in part by favorable leveraging of the segment’s fixed cost infrastructure and productivity improvements in back-office and field operations. In addition, results for 2004 include a $30.0 million bad debt provision for a customer which filed for bankruptcy. Medical-Surgical Solutions segment’s operating profit as a percentage of revenues decreased primarily reflecting an increase in gross profit margins offset by a higher proportion of operating expenses. Operating expenses increased in both dollars as well as a percentage of revenues primarily due to the acquisition of MMC, $7.4 million of litigation reserves, as well as a higher proportion of costs incurred to serve the segment’s alternate site customers, which have a higher cost-to-serve ratio than the segment’s other customers. During the third quarter of 2005, the segment anticipates completing an evaluation of its distribution center network as a result of its MMC acquisition. Costs incurred in connection with the distribution network restructuring plan will either be expensed or treated as part of the acquisition cost depending on the nature of such amounts. Provider Technologies segment’s operating profit as a percentage of revenues decreased primarily reflecting a decrease in gross profit margin. In addition, operating profit for 2004 benefited from a reversal of $19.7 million of customer settlement reserves due to favorable settlements and continued negotiations with affected customers. This benefit was partially offset by severance charges of $9.8 million primarily in the segment’s international business. Corporate expenses, including other income, increased primarily reflecting $5.2 million for the quarter and $12.1 million for the first half of legal costs due to accelerating activity in our pending securities litigation, and for the six months ended September 30, 2004, approximately $12 million of settlement charges pertaining to a non- qualified pension plan. During the first half of 2005, we made several lump sum cash payments totaling approximately $42 million from an unfunded U.S. pension plan. In accordance with accounting standards, additional charges for settlements associated with lump sum payments of pension obligations were expensed in the period in which the payments were made. Accordingly, expenses for the first half of 2005 include charges 19
  • 20. McKESSON CORPORATION FINANCIAL REVIEW (Continued) (Unaudited) associated with these payments. In addition, expenses for the first half of 2004 benefited from an $8.5 million gain pertaining to the sale of a surplus property. Interest Expense: Interest expense in 2005 approximated that of the prior comparable periods as the benefit of lower average borrowings were almost fully offset by increases in our effective interest rate. Income Taxes: For the quarters ended September 30, 2004 and 2003, the Company’s effective income tax rates were 24.2% and 26.2%. Income tax expense for the second quarter of 2005 reflects a $6.4 million income tax benefit which was primarily due to a reduction of a portion of a valuation allowance related to state income tax net operating loss carryforwards. We believe that the income tax benefit from a portion of these state net operating loss carryforwards will now be realized. In addition, the Company’s effective income tax rate benefited from a higher proportion of income being attributable to foreign countries that have lower income tax rates. Income tax expense for the second quarter of 2004 includes an income tax benefit of $15.3 million relating to favorable tax settlements with the U.S. Internal Revenue Service. These settlements pertain to amended tax returns for the years ended December 31, 1997 and 1998 filed by our subsidiary, McKesson Information Solutions LLC, formerly known as HBO & Company. The benefit of these tax assets was not previously recognized by the Company. For the first half of 2005 and 2004, the Company’s effective income tax rates were 30.6% and 30.0%. Income tax expense for the first half of 2005 also reflects a business that we sold for net cash proceeds of $12.3 million. The disposition resulted in a pre-tax loss of $1.1 million and an after-tax loss of $4.6 million. The after-tax loss on the disposition was the result of a lower tax adjusted cost basis for the business. Partially offsetting the tax impact of this disposition, a net income tax benefit of $2.2 million relating to favorable tax settlements and adjustments was recorded. Weighted Average Diluted Shares Outstanding: Diluted earnings per share were calculated based on an average number of diluted shares outstanding of 300.0 million and 300.3 million for the second quarters of 2005 and 2004 and 300.1 million and 299.2 million for the six months ended September 30, 2004 and 2003. Financial Condition, Liquidity, and Capital Resources Operating activities provided cash of $382.0 million during the first half of 2005, compared to utilizing $298.3 million during the comparable prior year period. Improvement in cash flows from operations reflects improved collections in receivables, including the prompt payment terms of our new customer, the Department of Veterans Affairs, improved inventory management, and extended payment terms received from certain manufacturers. Investing activities utilized cash of $155.6 million and $65.8 million during the first half of 2005 and 2004. The increased usage in 2005 primarily reflects a payment of approximately $37 million for the acquisition of MMC as well as greater issuances of notes receivable. During the first half of 2005, we converted a $40.0 million customer credit facility guarantee to a note receivable due from this customer. Increases in cash usage were partially offset by a decrease in expenditures for capitalized software and the proceeds from the sale of a business. Financing activities provided cash of $61.8 million and $103.7 million in the first half of 2005 and 2004. Financing activities for 2005 include an incremental $31.2 million from common stock issuances primarily resulting from an increase in employees’ exercises of stock options. 2004 financing activities included the use of $75.3 million for stock repurchases and $135.0 million of proceeds from short-term borrowings. 20
  • 21. McKESSON CORPORATION FINANCIAL REVIEW (Continued) (Unaudited) Selected Measures of Liquidity and Capital Resources September 30, March 31, 2004 2004 (Dollars in millions) Cash, cash equivalents and marketable securities $ 1,005.4 $ 717.8 Working capital 3,904.7 3,587.9 Debt net of cash, cash equivalents and marketable securities 460.9 766.8 Debt to capital ratio (1) 21.0% 22.3% Net debt to net capital employed (2) 7.7 12.9 Return on stockholders’ equity (3) 11.3 13.4 (1) Ratio is computed as total debt divided by total debt and stockholders’ equity. (2) Ratio is computed as total debt, net of cash, cash equivalents and marketable securities (“net debt”), divided by net debt and stockholders’ equity (“net capital employed”). (3) Ratio is computed as the sum of net income for the last four quarters, divided by the average of stockholders’ equity for the last five quarters. Working capital primarily includes receivables and inventories, net of drafts and accounts payable and deferred revenue. Our Pharmaceutical Solutions segment requires a substantial investment in working capital that is susceptible to large variations during the year as a result of inventory purchase patterns and seasonal demands. Inventory purchase activity is a function of sales activity, new customer build-up requirements and the desired level of investment inventory. Consolidated working capital has increased primarily as a result of our higher sales volume, as well as an increase in cash and cash equivalents. We reduced our ratio of net debt to net capital employed as growth in our operating income was in excess of the growth in working capital and other investments needed to fund increases in revenue, which is reflected in increases in cash and cash equivalents and stockholders’ equity. Credit Resources We fund our working capital requirements primarily with cash, short-term borrowings and our receivables sale facility. In September 2004, we entered into a $1.3 billion five-year, senior unsecured revolving credit facility. Borrowings under the new credit facility bear interest at a fixed base rate, or a floating rate based on the British Banker’s Association LIBOR rate or a Eurodollar rate. Effective as of the closing date of the new credit facility agreement, we terminated the commitments under our existing $550 million, three-year revolving credit facility that would have expired in September 2005, as well as our $650 million, 364-day credit facility that would have expired on September 28, 2004. We also have a $1.4 billion revolving receivables sale facility, which was renewed in June 2004, the terms of which are substantially similar to those previously in place with the exception that the facility was increased by $300.0 million. This facility expires in June 2005. At September 30, 2004 and at March 31, 2004, no amounts were outstanding or utilized under any of the Company’s credit facilities. Our various borrowing facilities and long-term debt are subject to certain covenants. Our principal debt covenant is our debt to capital ratio, which cannot exceed 56.5%. If we exceed this ratio, repayment of any debt outstanding under the revolving credit facility and $335.0 million of term debt could be accelerated. At September 30, 2004, this ratio was 21.0% and we were in compliance with our other covenants. A reduction in our credit ratings or the lack of compliance with our covenants could negatively impact our ability to finance operations through our credit facilities, or issue additional debt at the interest rates currently available. Funds necessary for future debt maturities and our other cash requirements are expected to be met by existing cash balances, cash flows from operations, existing credit sources and other capital market transactions. 21
  • 22. McKESSON CORPORATION FINANCIAL REVIEW (Concluded) (Unaudited) New Accounting Pronouncements There are a number of new accounting pronouncements that may impact our financial results. These new accounting pronouncements are described in Financial Note 1, “Significant Accounting Policies,” to the accompanying condensed consolidated financial statements. FACTORS AFFECTING FORWARD-LOOKING STATEMENTS In addition to historical information, management’s discussion and analysis includes certain forward-looking statements within the meaning of section 27A of the Securities Act of 1933, as amended and section 21E of the Securities Exchange Act of 1934, as amended. Some of the forward-looking statements can be identified by use of forward-looking words such as “believes,” “expects,” “anticipates,” “may,” “will,” “should,” “seeks,” “approximates,” “intends,” “plans,” or “estimates,” or the negative of these words, or other comparable terminology. The discussion of financial trends, strategy, plans or intentions may also include forward-looking statements. Forward-looking statements involve risks and uncertainties that could cause actual results to differ materially from those projected. Although it is not possible to predict or identify all such risks and uncertainties, they may include, but are not limited to, the following factors. The readers should not consider this list to be a complete statement of all potential risks and uncertainties. • the resolution or outcome of pending shareholder litigation regarding the 1999 restatement of our historical financial statements; • the changing U.S. healthcare environment, including the impact of current and potential future mandated benefits, changes in private and governmental reimbursement or in the delivery systems for healthcare products and services and governmental efforts to regulate the pharmaceutical supply chain; • consolidation of competitors, suppliers and customers and the development of large, sophisticated purchasing groups; • the ability to successfully market both new and existing products domestically and internationally; • changes in manufacturers’ pricing, selling, inventory, distribution or supply policies or practices; • substantial defaults in payment by large customers; • material reduction in purchases or the loss of a large customer or supplier relationship; • challenges in integrating or implementing our software or software-related system products, or the slowing or deferral of demand for these products; • the malfunction or failure of our segments’ information systems; • our ability to successfully identify, consummate and integrate strategic acquisitions; • changes in generally accepted accounting principles; • tax legislation initiatives; • foreign currency fluctuations; and • general economic and market conditions. These and other risks and uncertainties are described herein or in our Forms 10-K, 10-Q, 8-K and other public documents filed with the Securities and Exchange Commission. Readers are cautioned not to place undue reliance on these forward-looking statements, which speak only as of the date hereof. We undertake no obligation to publicly release the result of any revisions to these forward-looking statements to reflect events or circumstances after this date or to reflect the occurrence of unanticipated events. 22
  • 23. McKESSON CORPORATION Item 3. Quantitative and Qualitative Disclosures about Market Risk We believe there has been no material change in our exposure to risks associated with fluctuations in interest and foreign currency exchange rates discussed in our 2004 Annual Report on Form 10-K. Item 4. Controls and Procedures Our Chief Executive Officer and our Chief Financial Officer, after evaluating the effectiveness of the Company’s “disclosure controls and procedures” (as defined in the Exchange Act Rules 13a-15(e)) as of the end of the period covered by this quarterly report, have concluded that our disclosure controls and procedures are effective based on their evaluation of these controls and procedures required by paragraph (b) of Exchange Act Rules 13a-15 or 15d-15. There were no changes in our internal control over financial reporting identified in connection with the evaluation required by paragraph (d) of Exchange Act Rules 13a-15 or 15d-15 that occurred during our last fiscal quarter that have materially affected, or are reasonably likely to materially affect, our internal controls over financial reporting. PART II. OTHER INFORMATION Item 1. Legal Proceedings See Financial Note 11, “Other Commitments and Contingent Liabilities,” of our unaudited condensed consolidated financial statements contained in Part I of this Quarterly Report on Form 10-Q. Item 2. Unregistered Sales of Equity Securities and Use of Proceeds The Company made no share repurchases during the quarter and the six months ended September 30, 2004. The dollar value of shares that may yet be purchased under our currently authorized share repurchase program is approximately $209 million. Item 4. Submission of Matters to a Vote of Security Holders The Company’s Annual Meeting of Shareholders was held on July 28, 2004. The following matters were voted upon at the meeting and the stockholder votes on each such matter are briefly described below. The Board of Directors’ nominees for directors as listed in the proxy statement were each elected to serve for a three-year term. The vote was as follows: Votes For Votes Withheld John H. Hammergren 257,368,725 8,258,191 M. Christine Jacobs 231,698,249 33,928,667 Robert W. Matschullat 259,656,704 5,970,212 The term of the following directors continued after the meeting: Wayne A. Budd Alton F. Irby III Marie L. Knowles David M. Lawrence, M.D. James V. Napier Jane E. Shaw Richard F. Syron 23