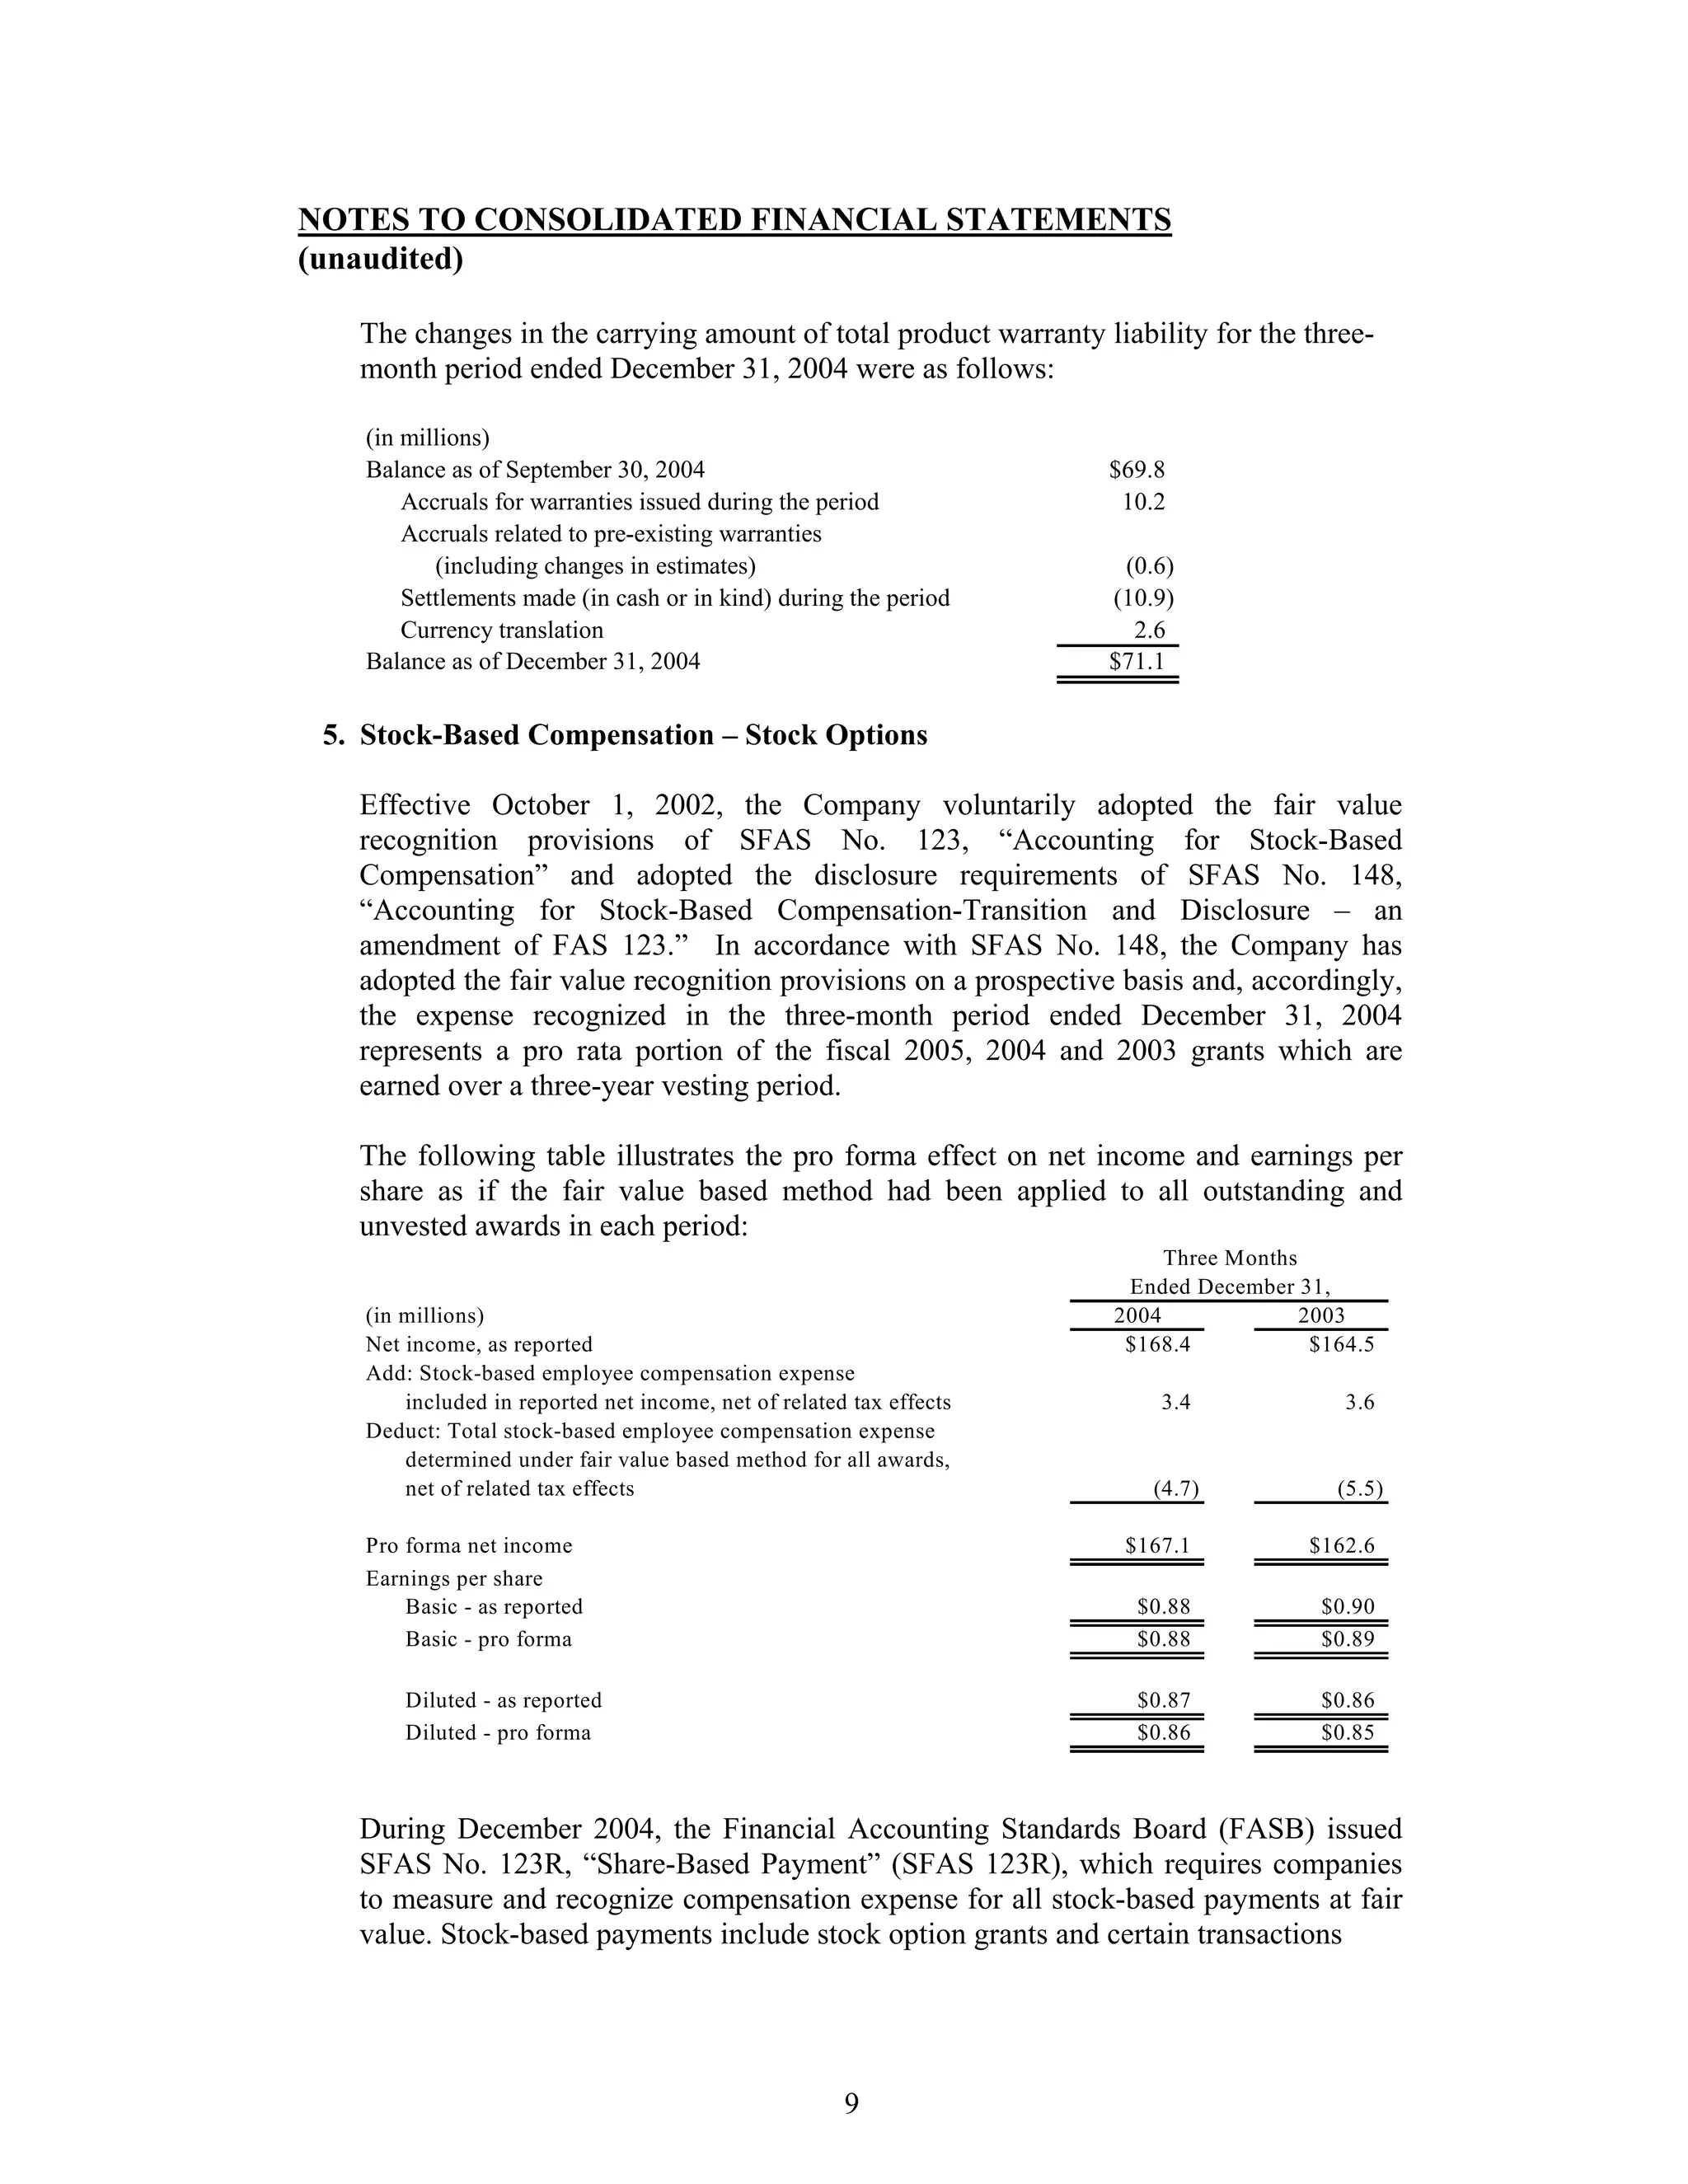
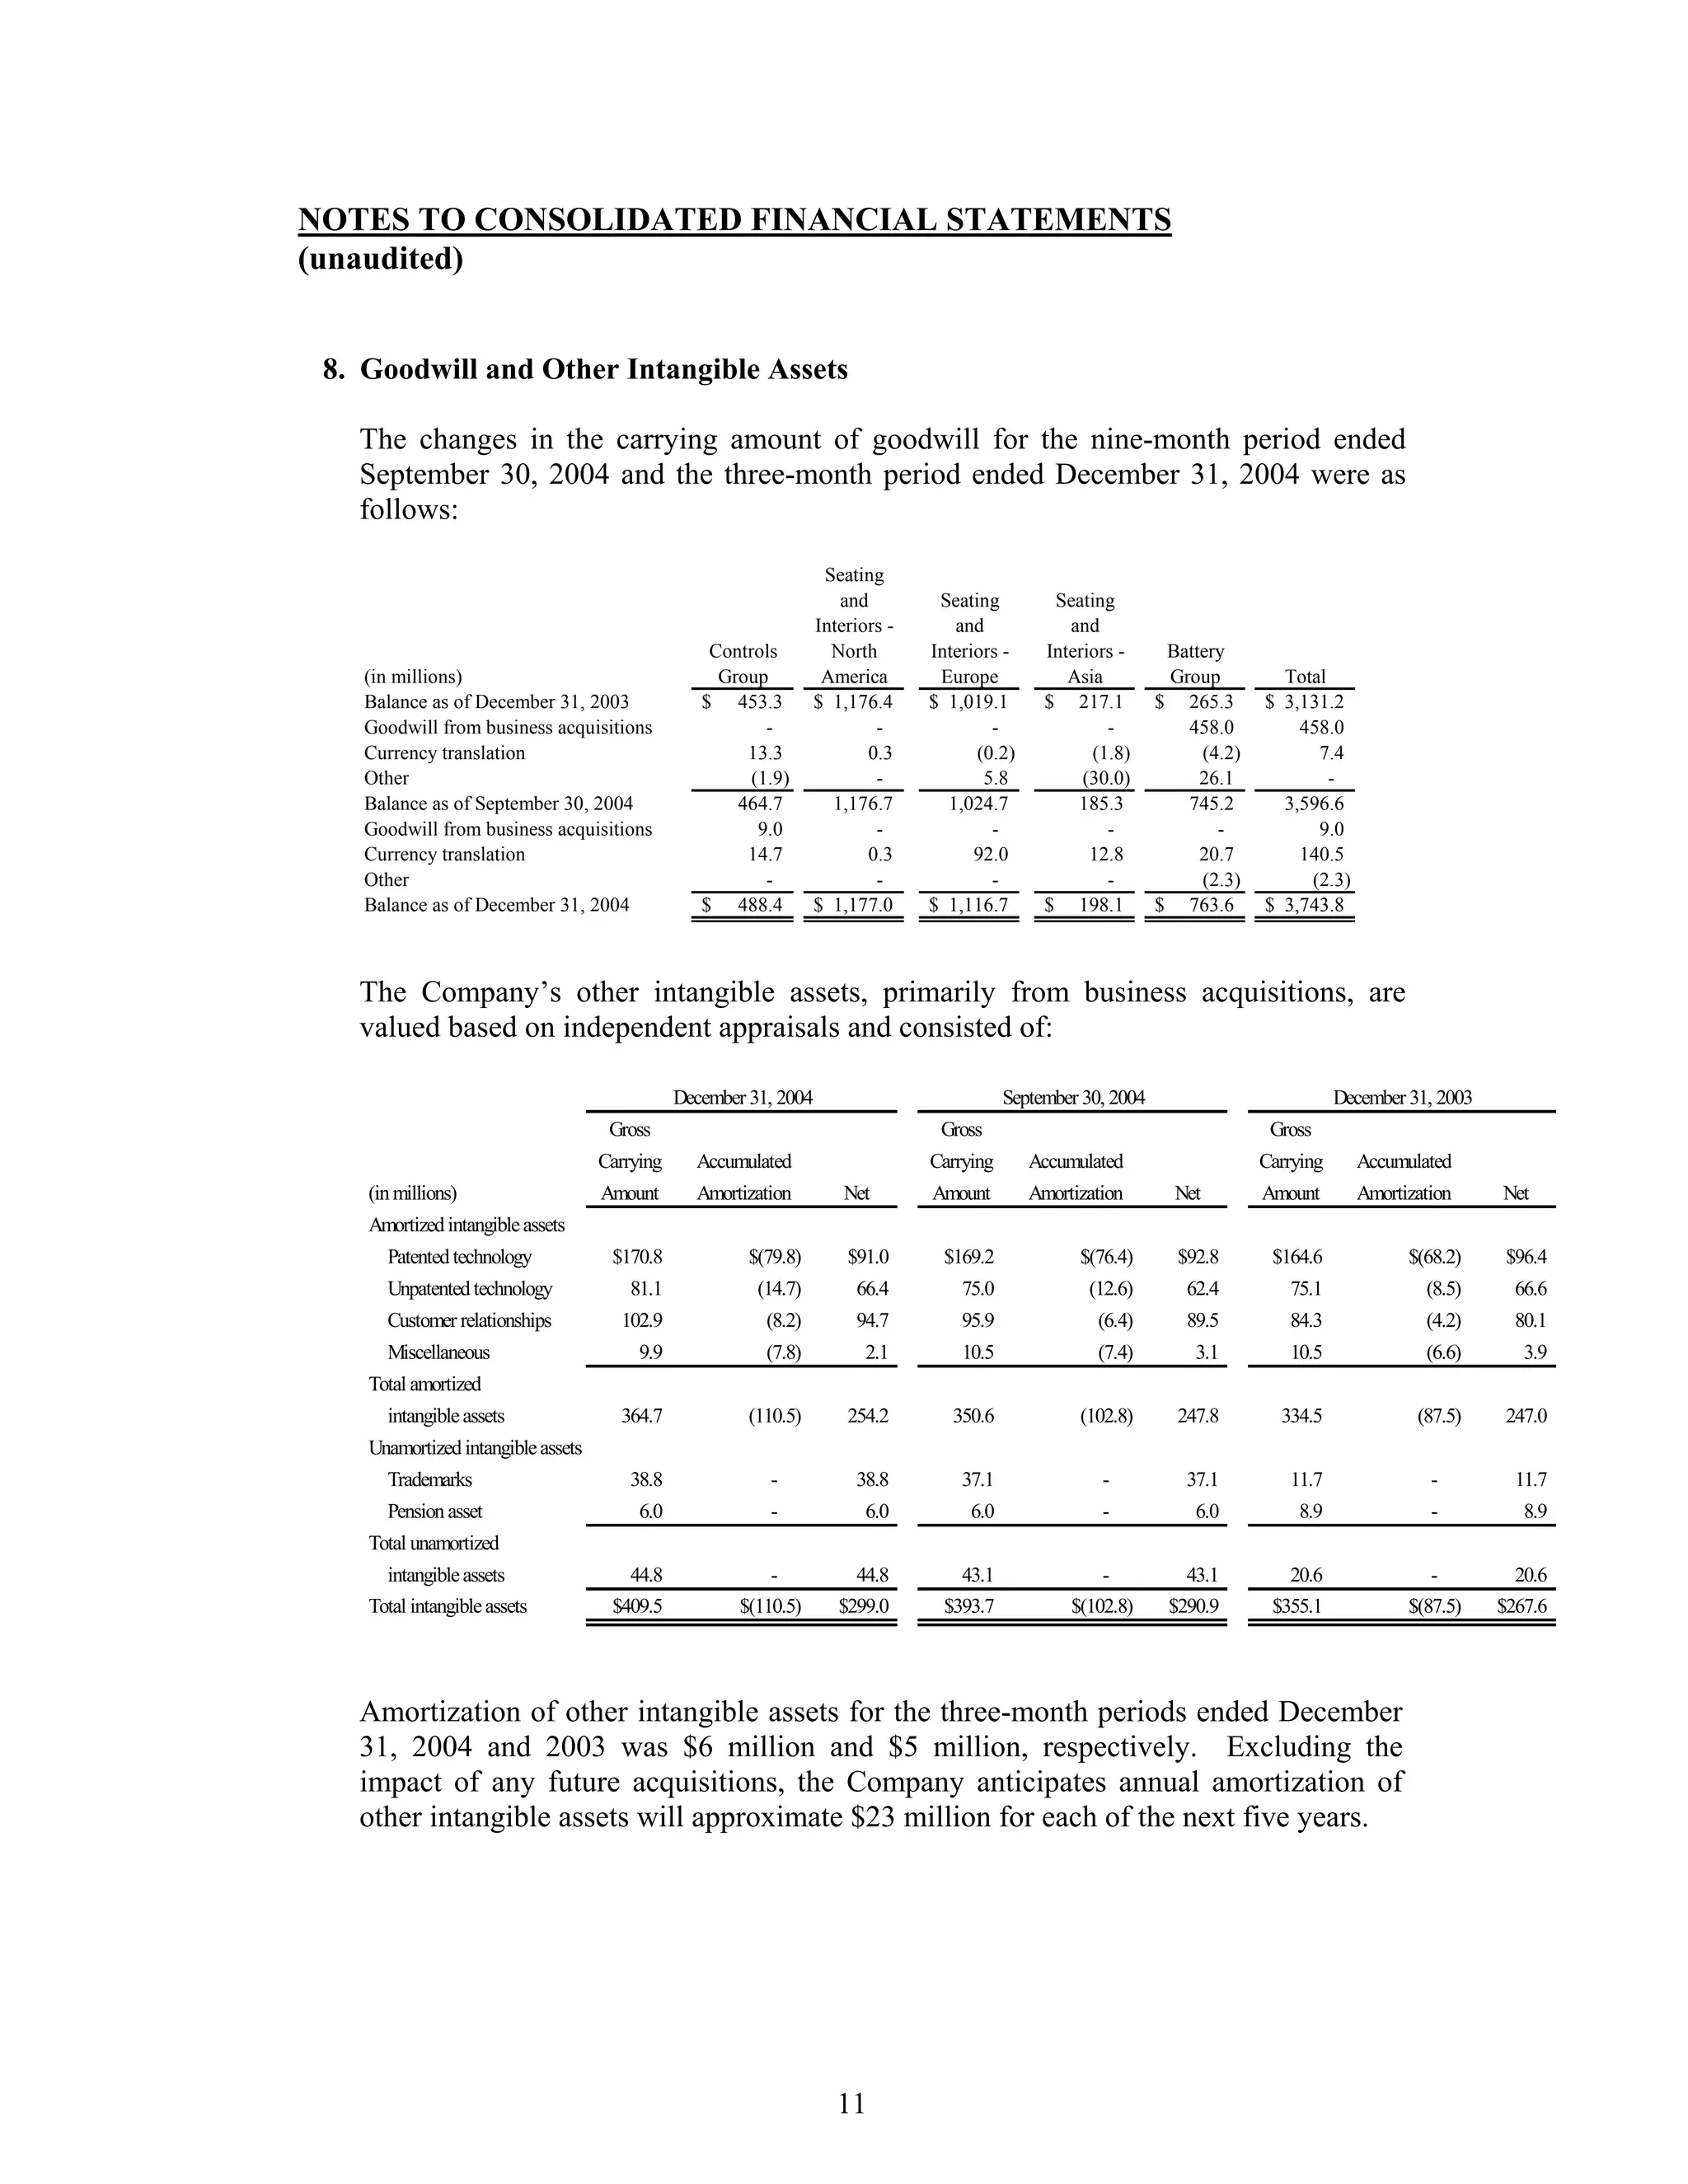
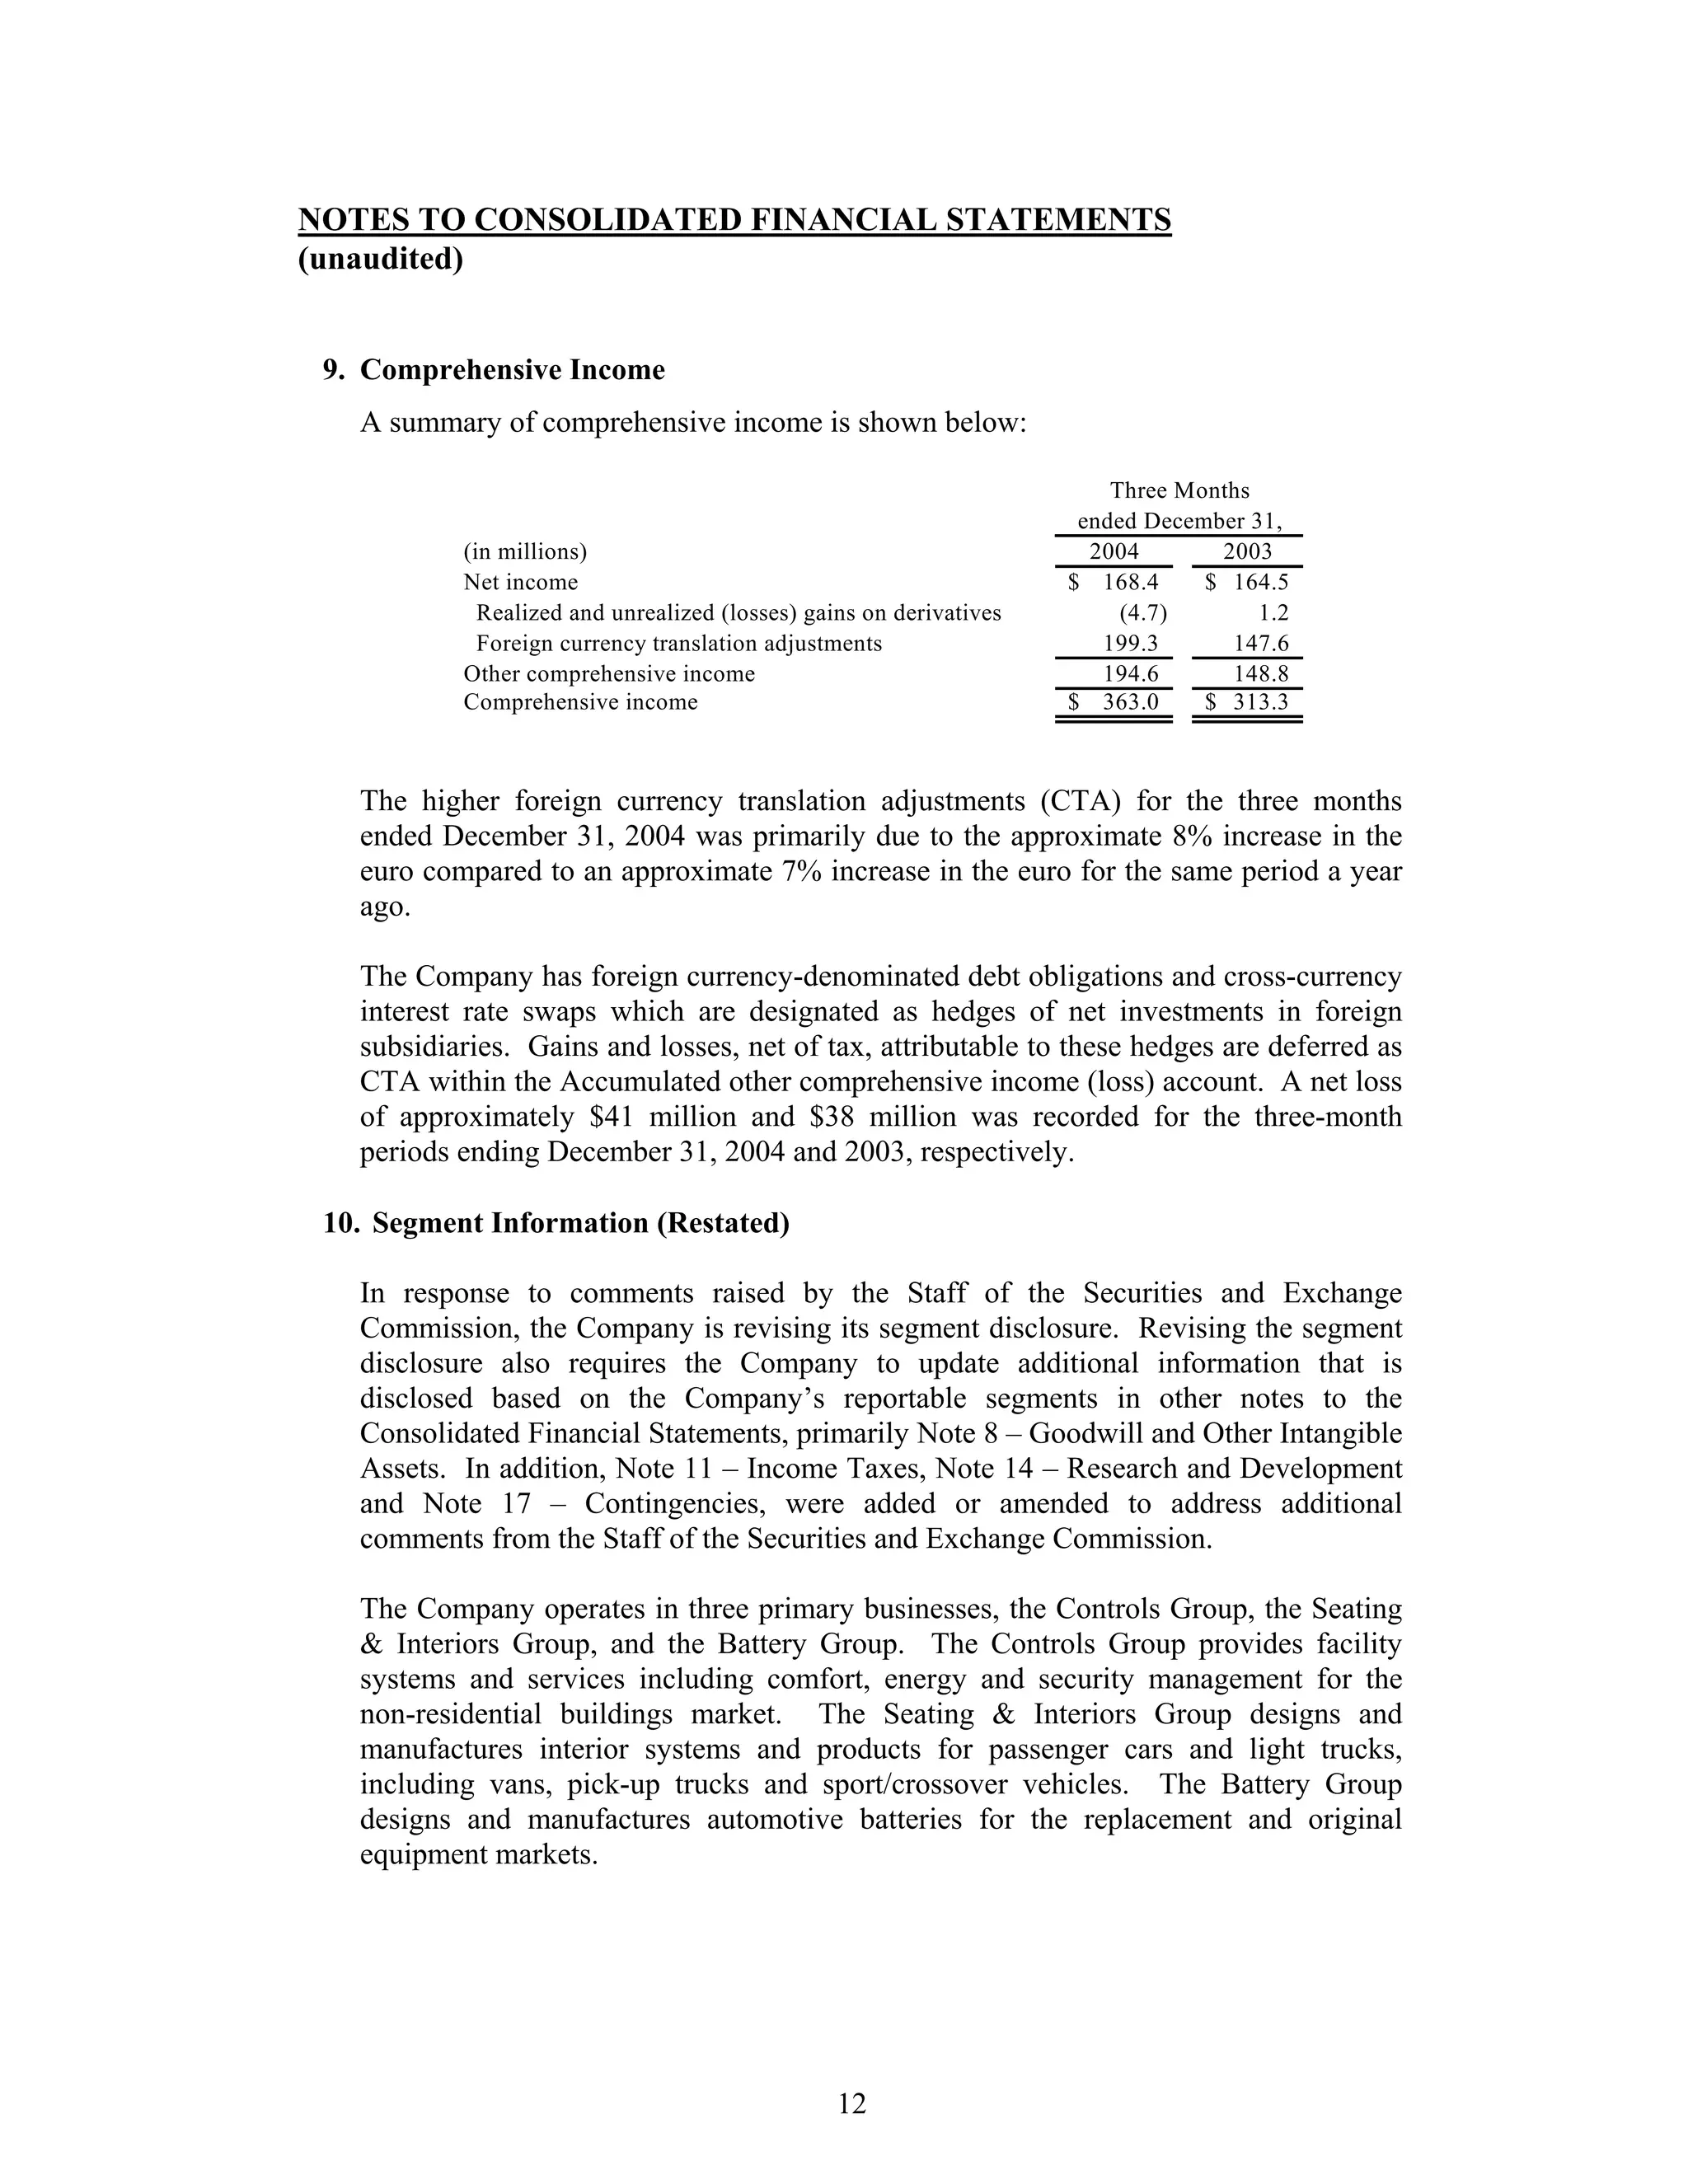
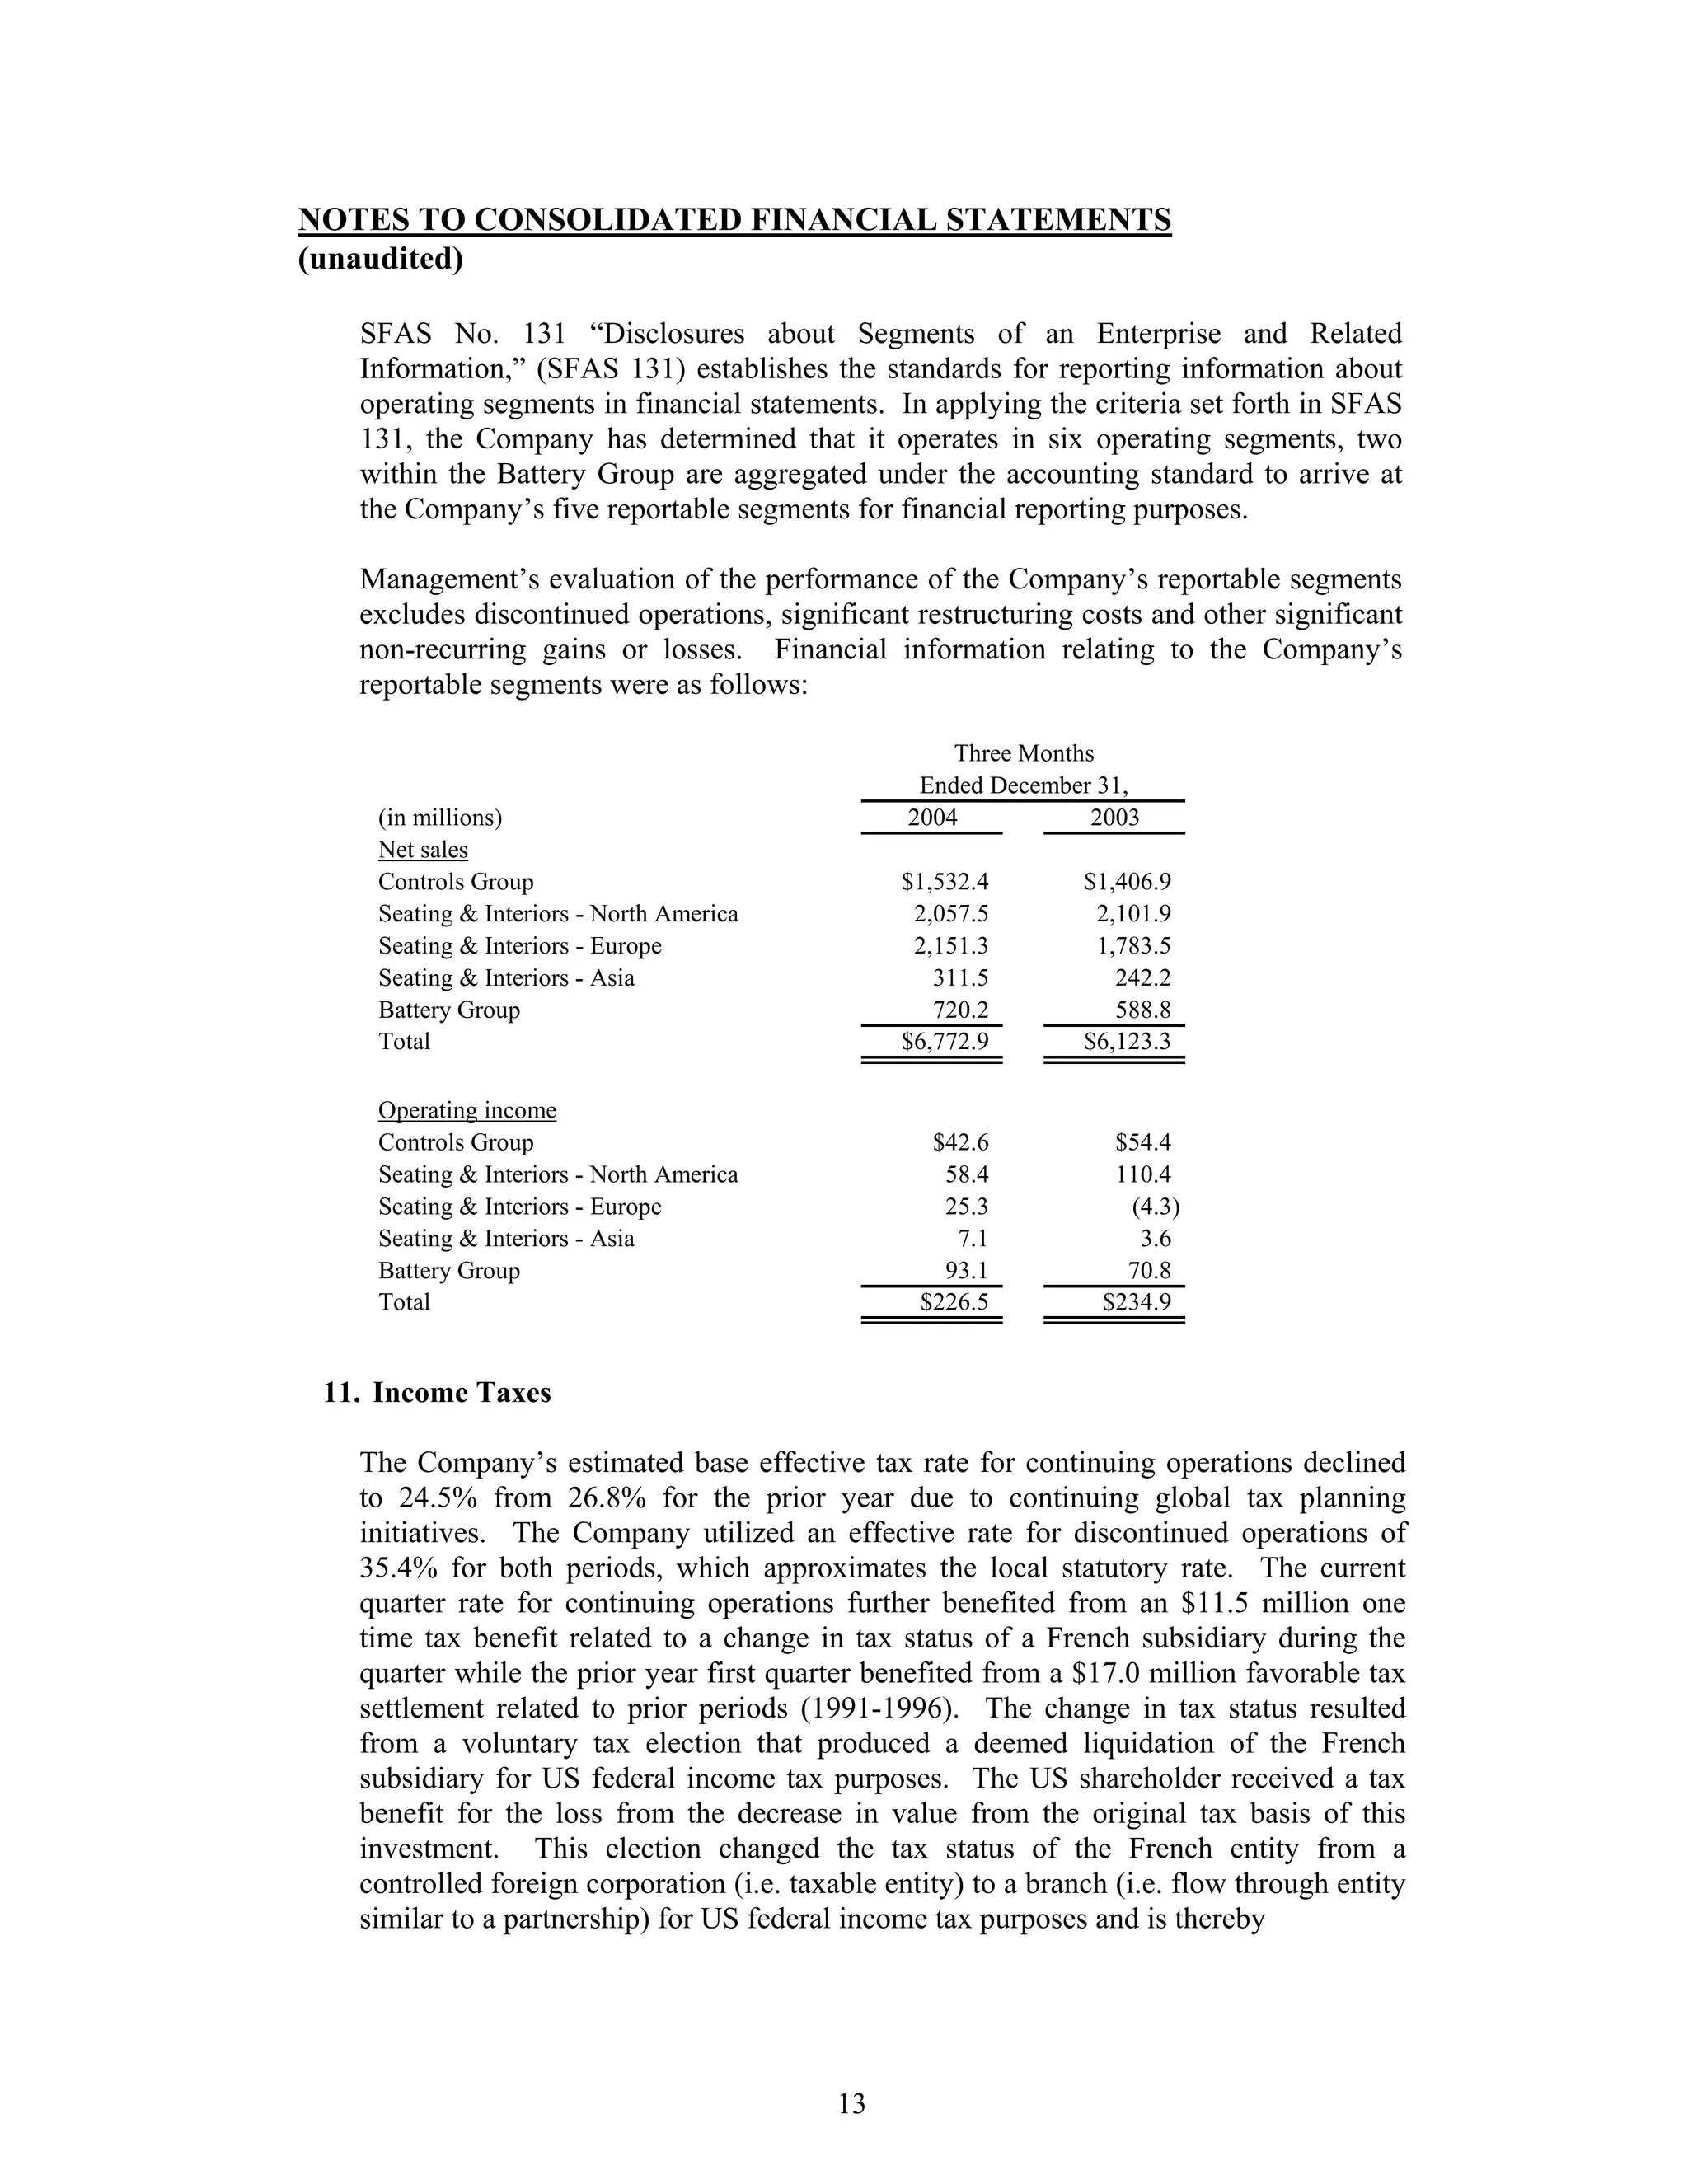
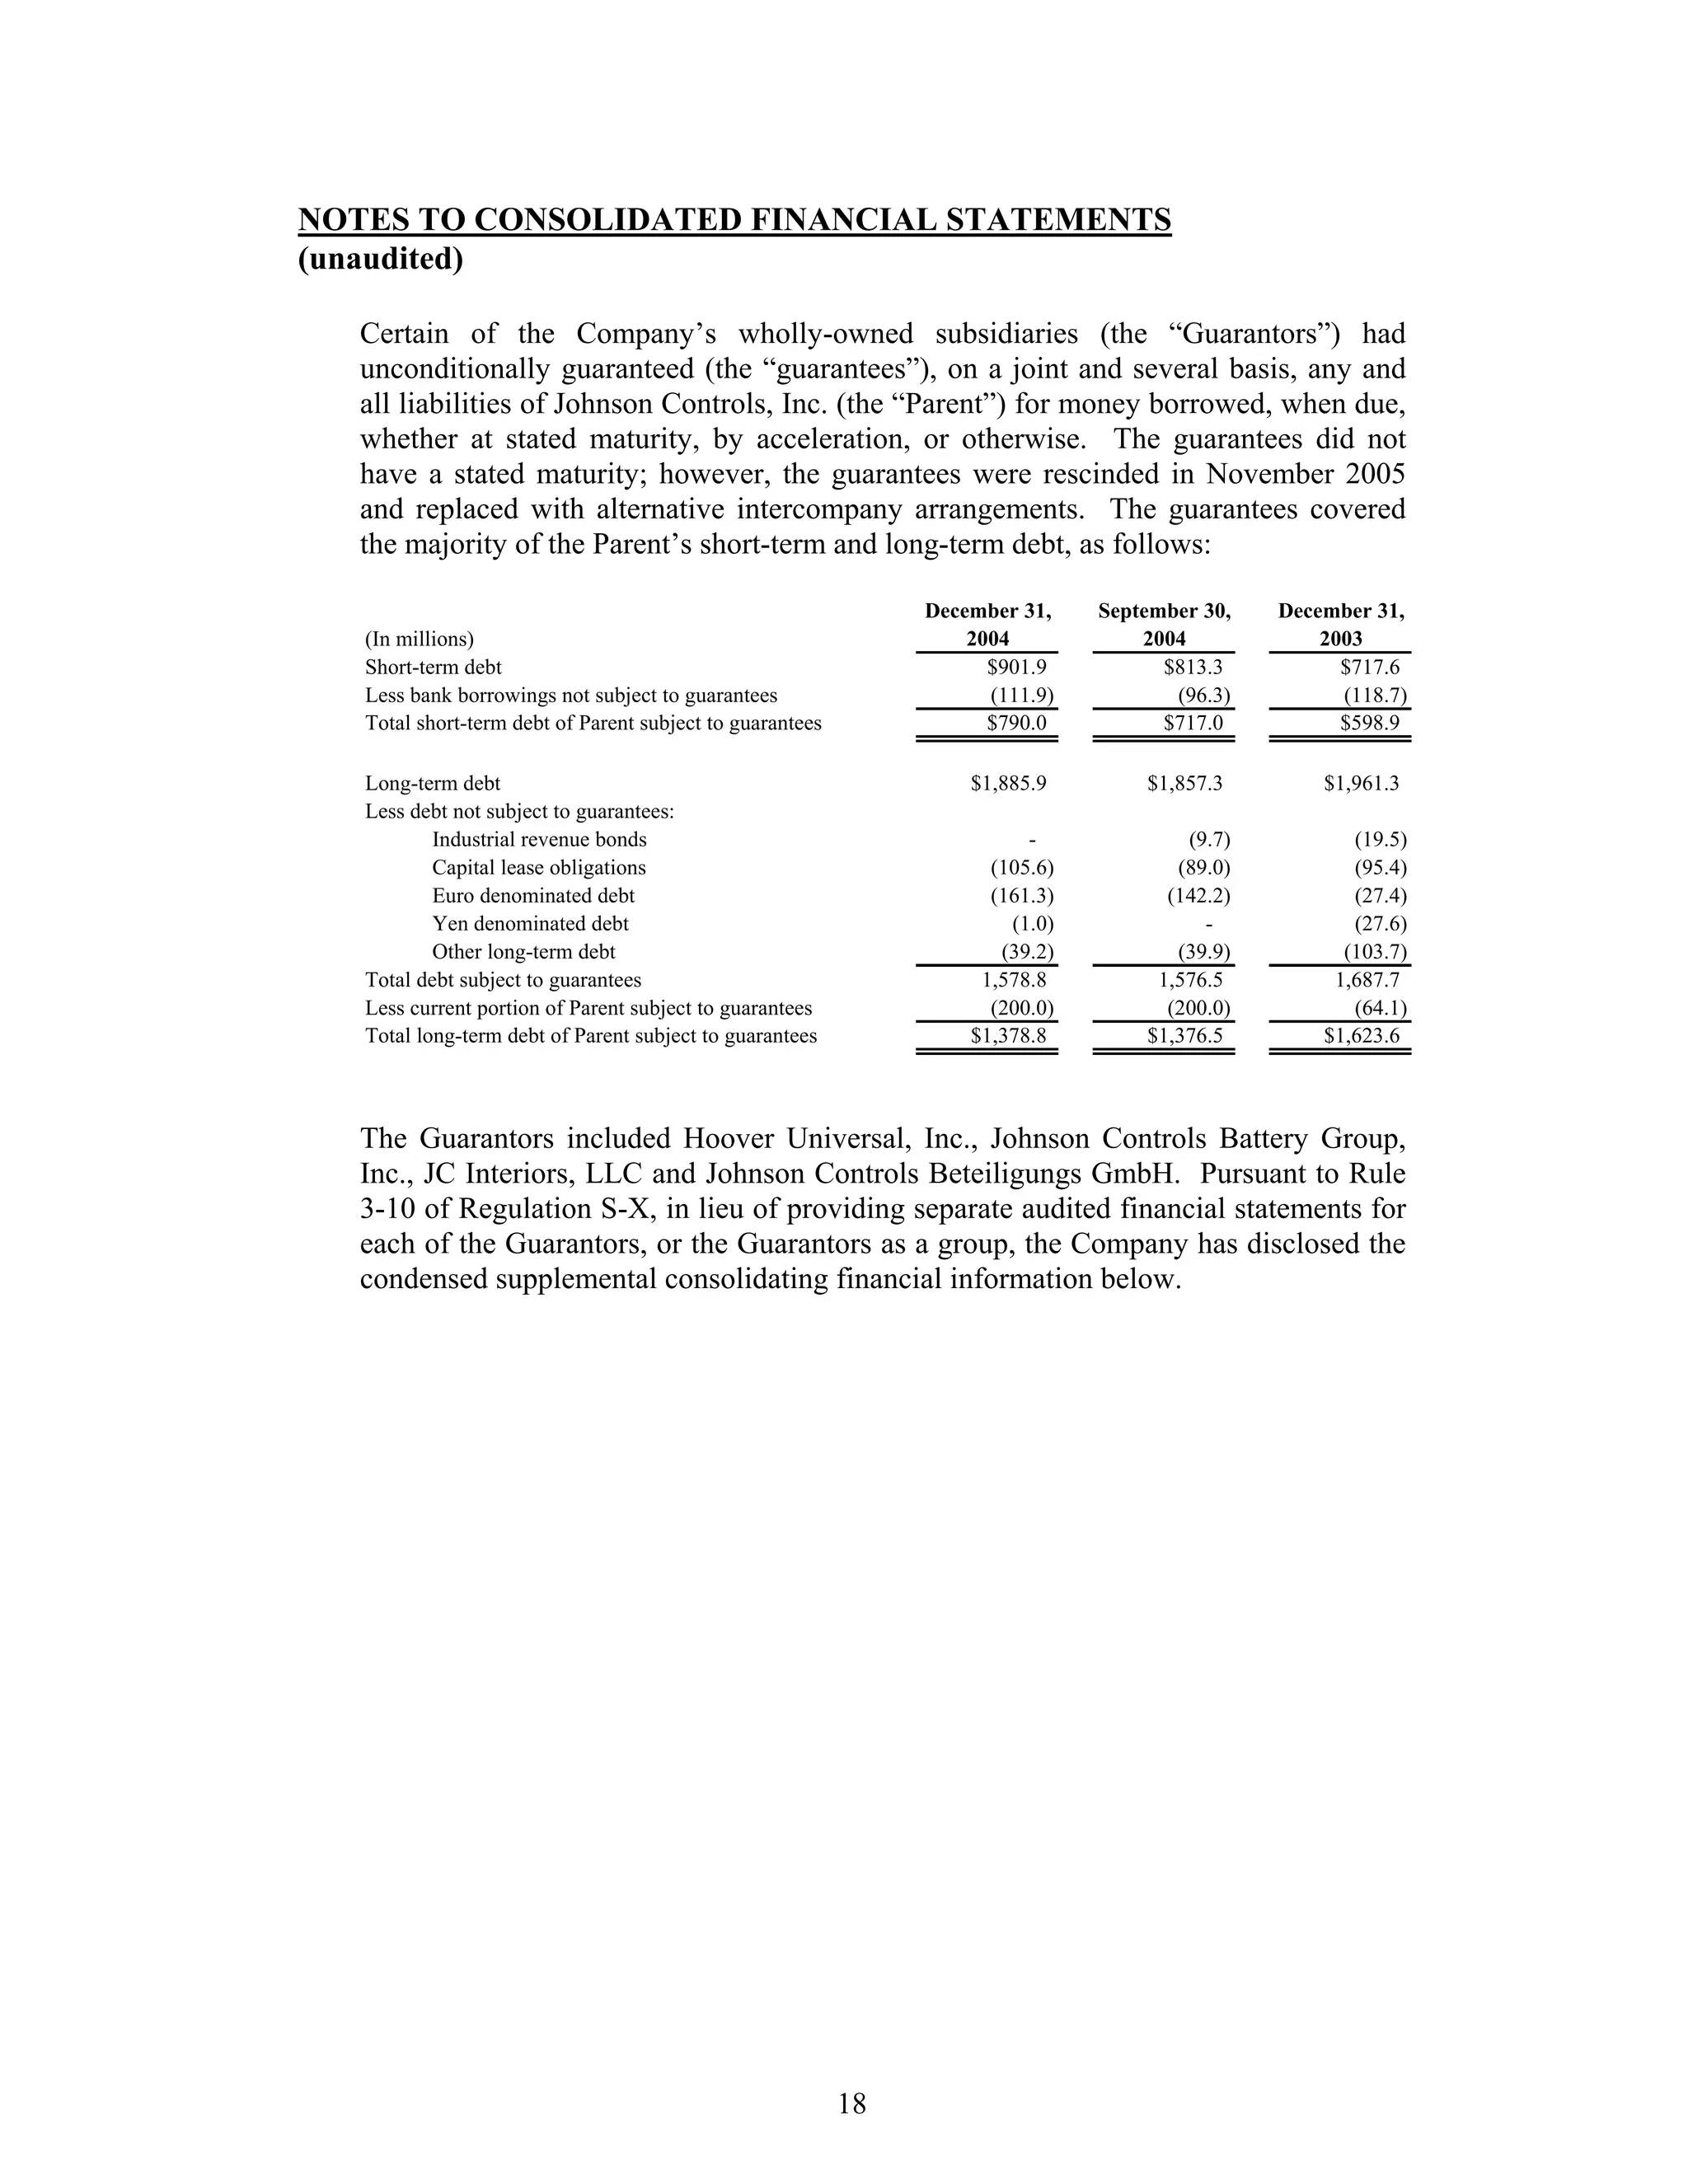
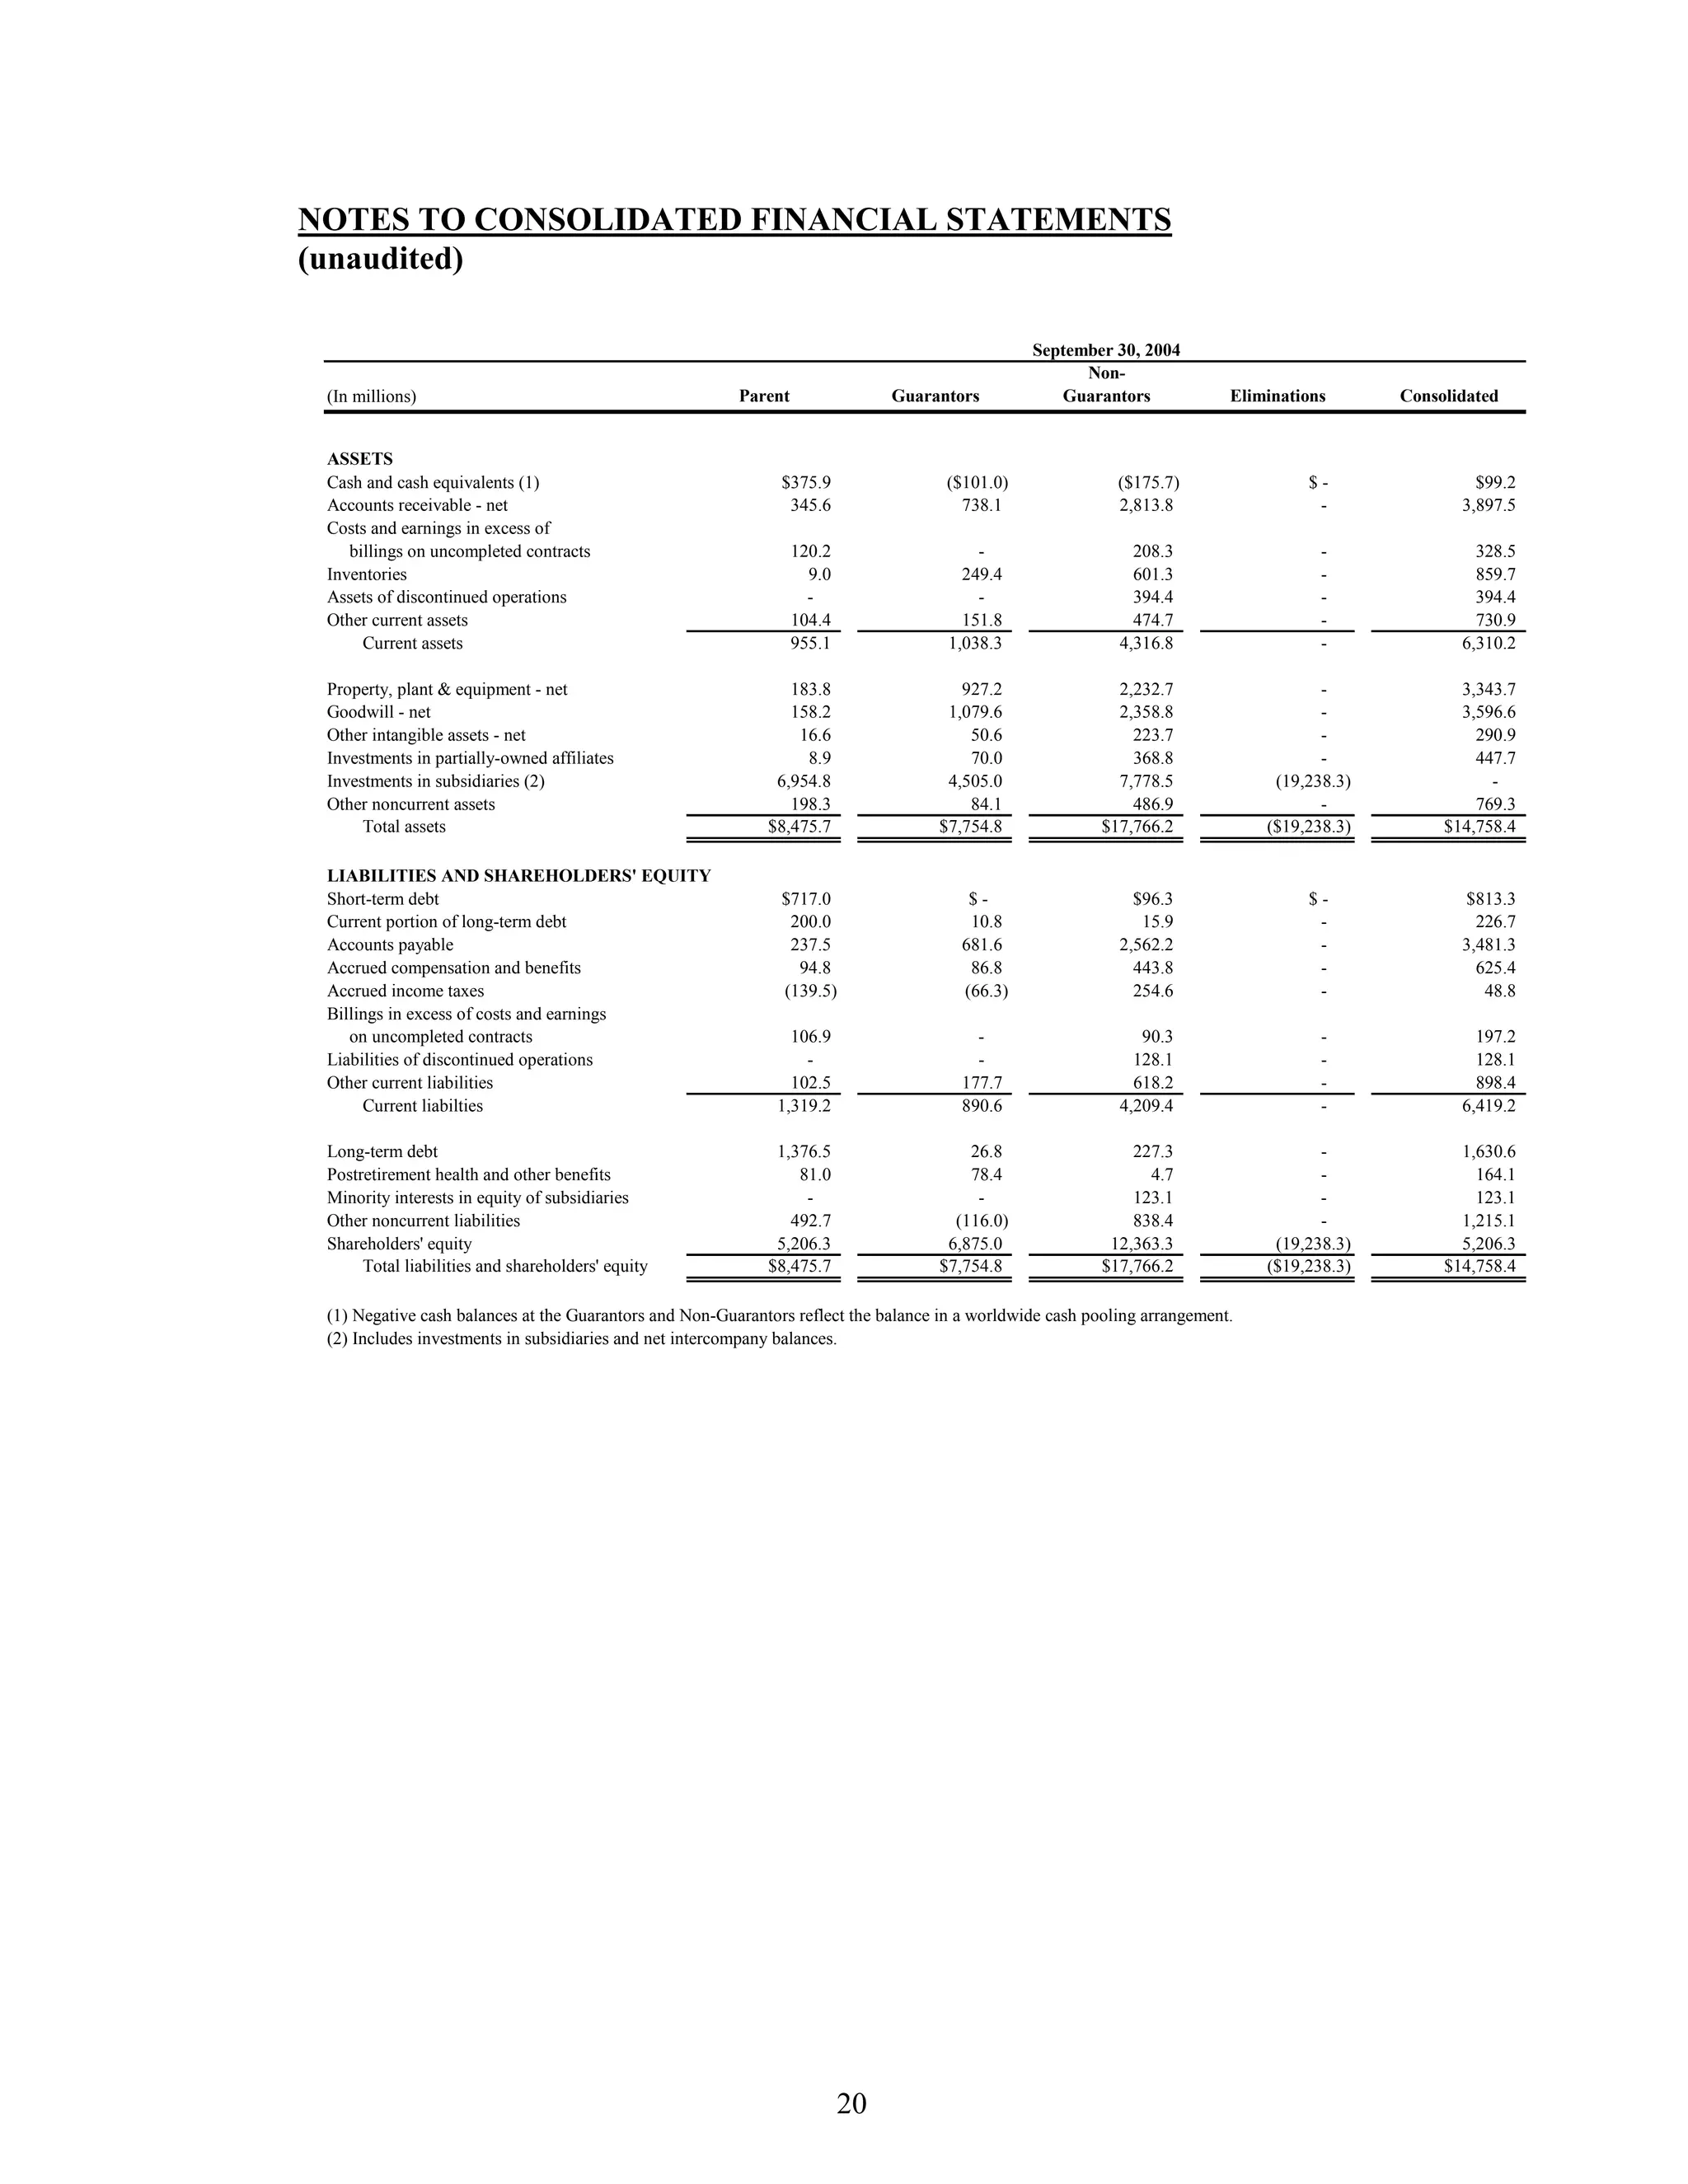
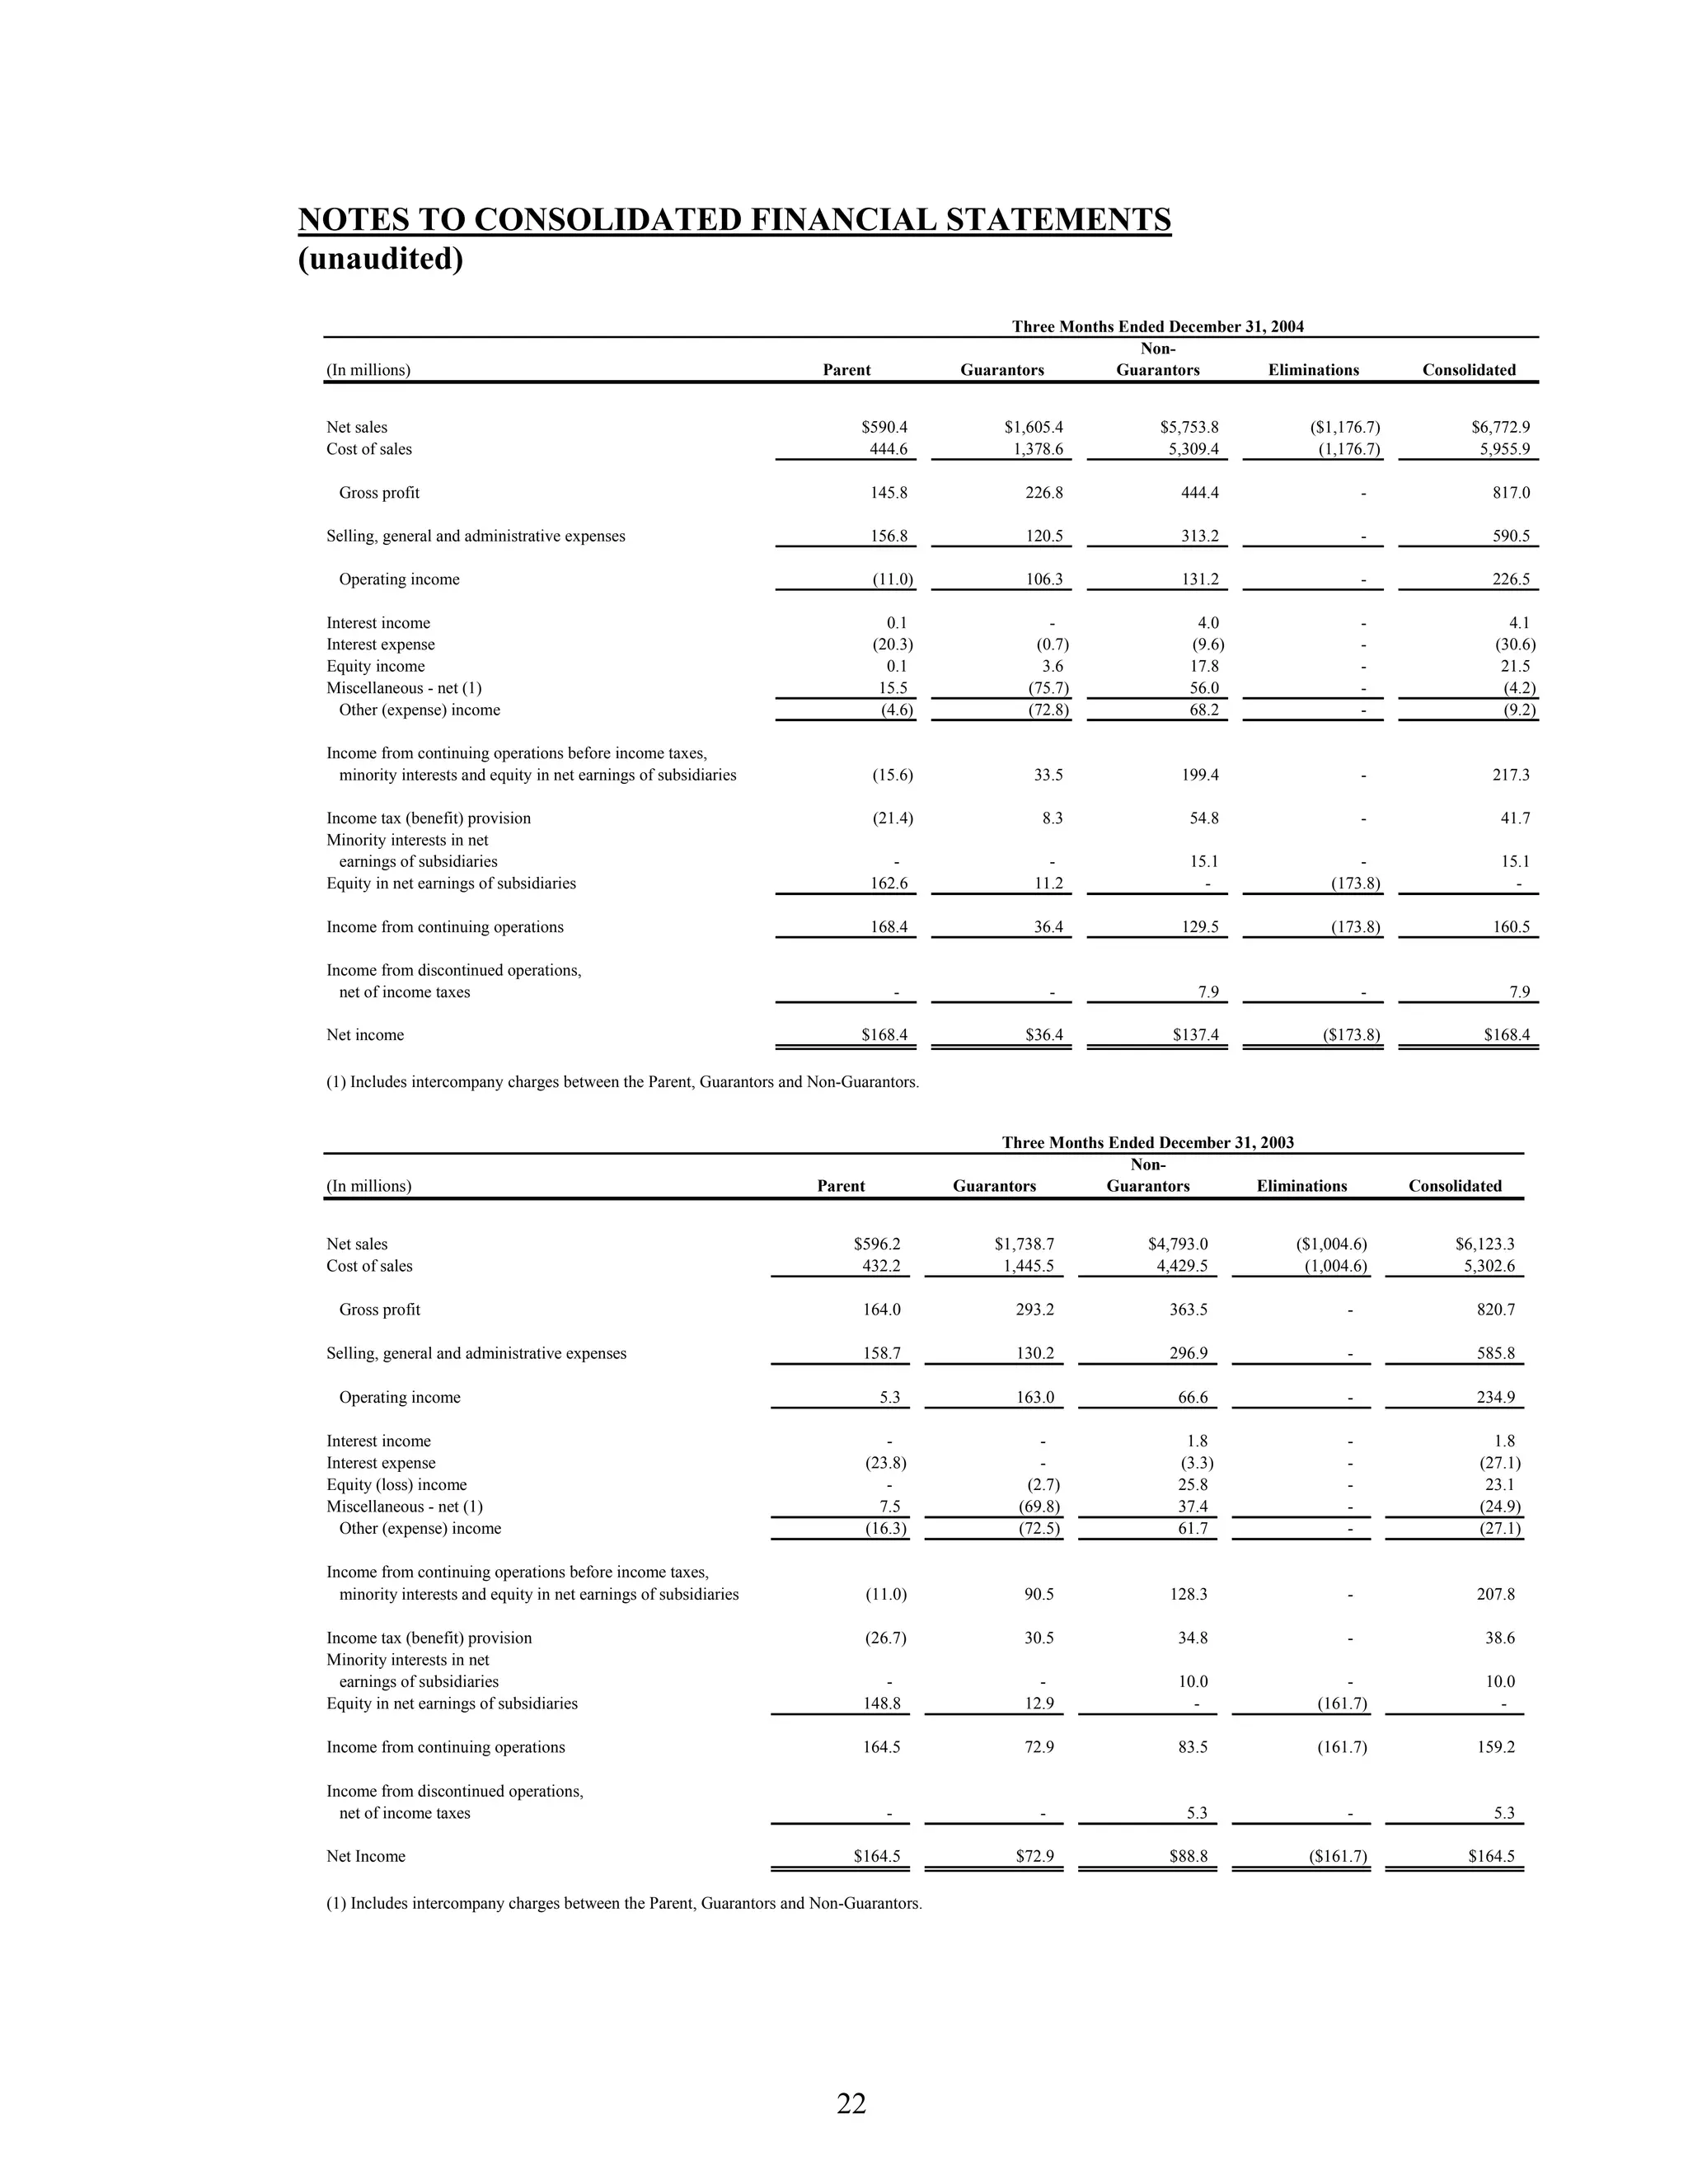
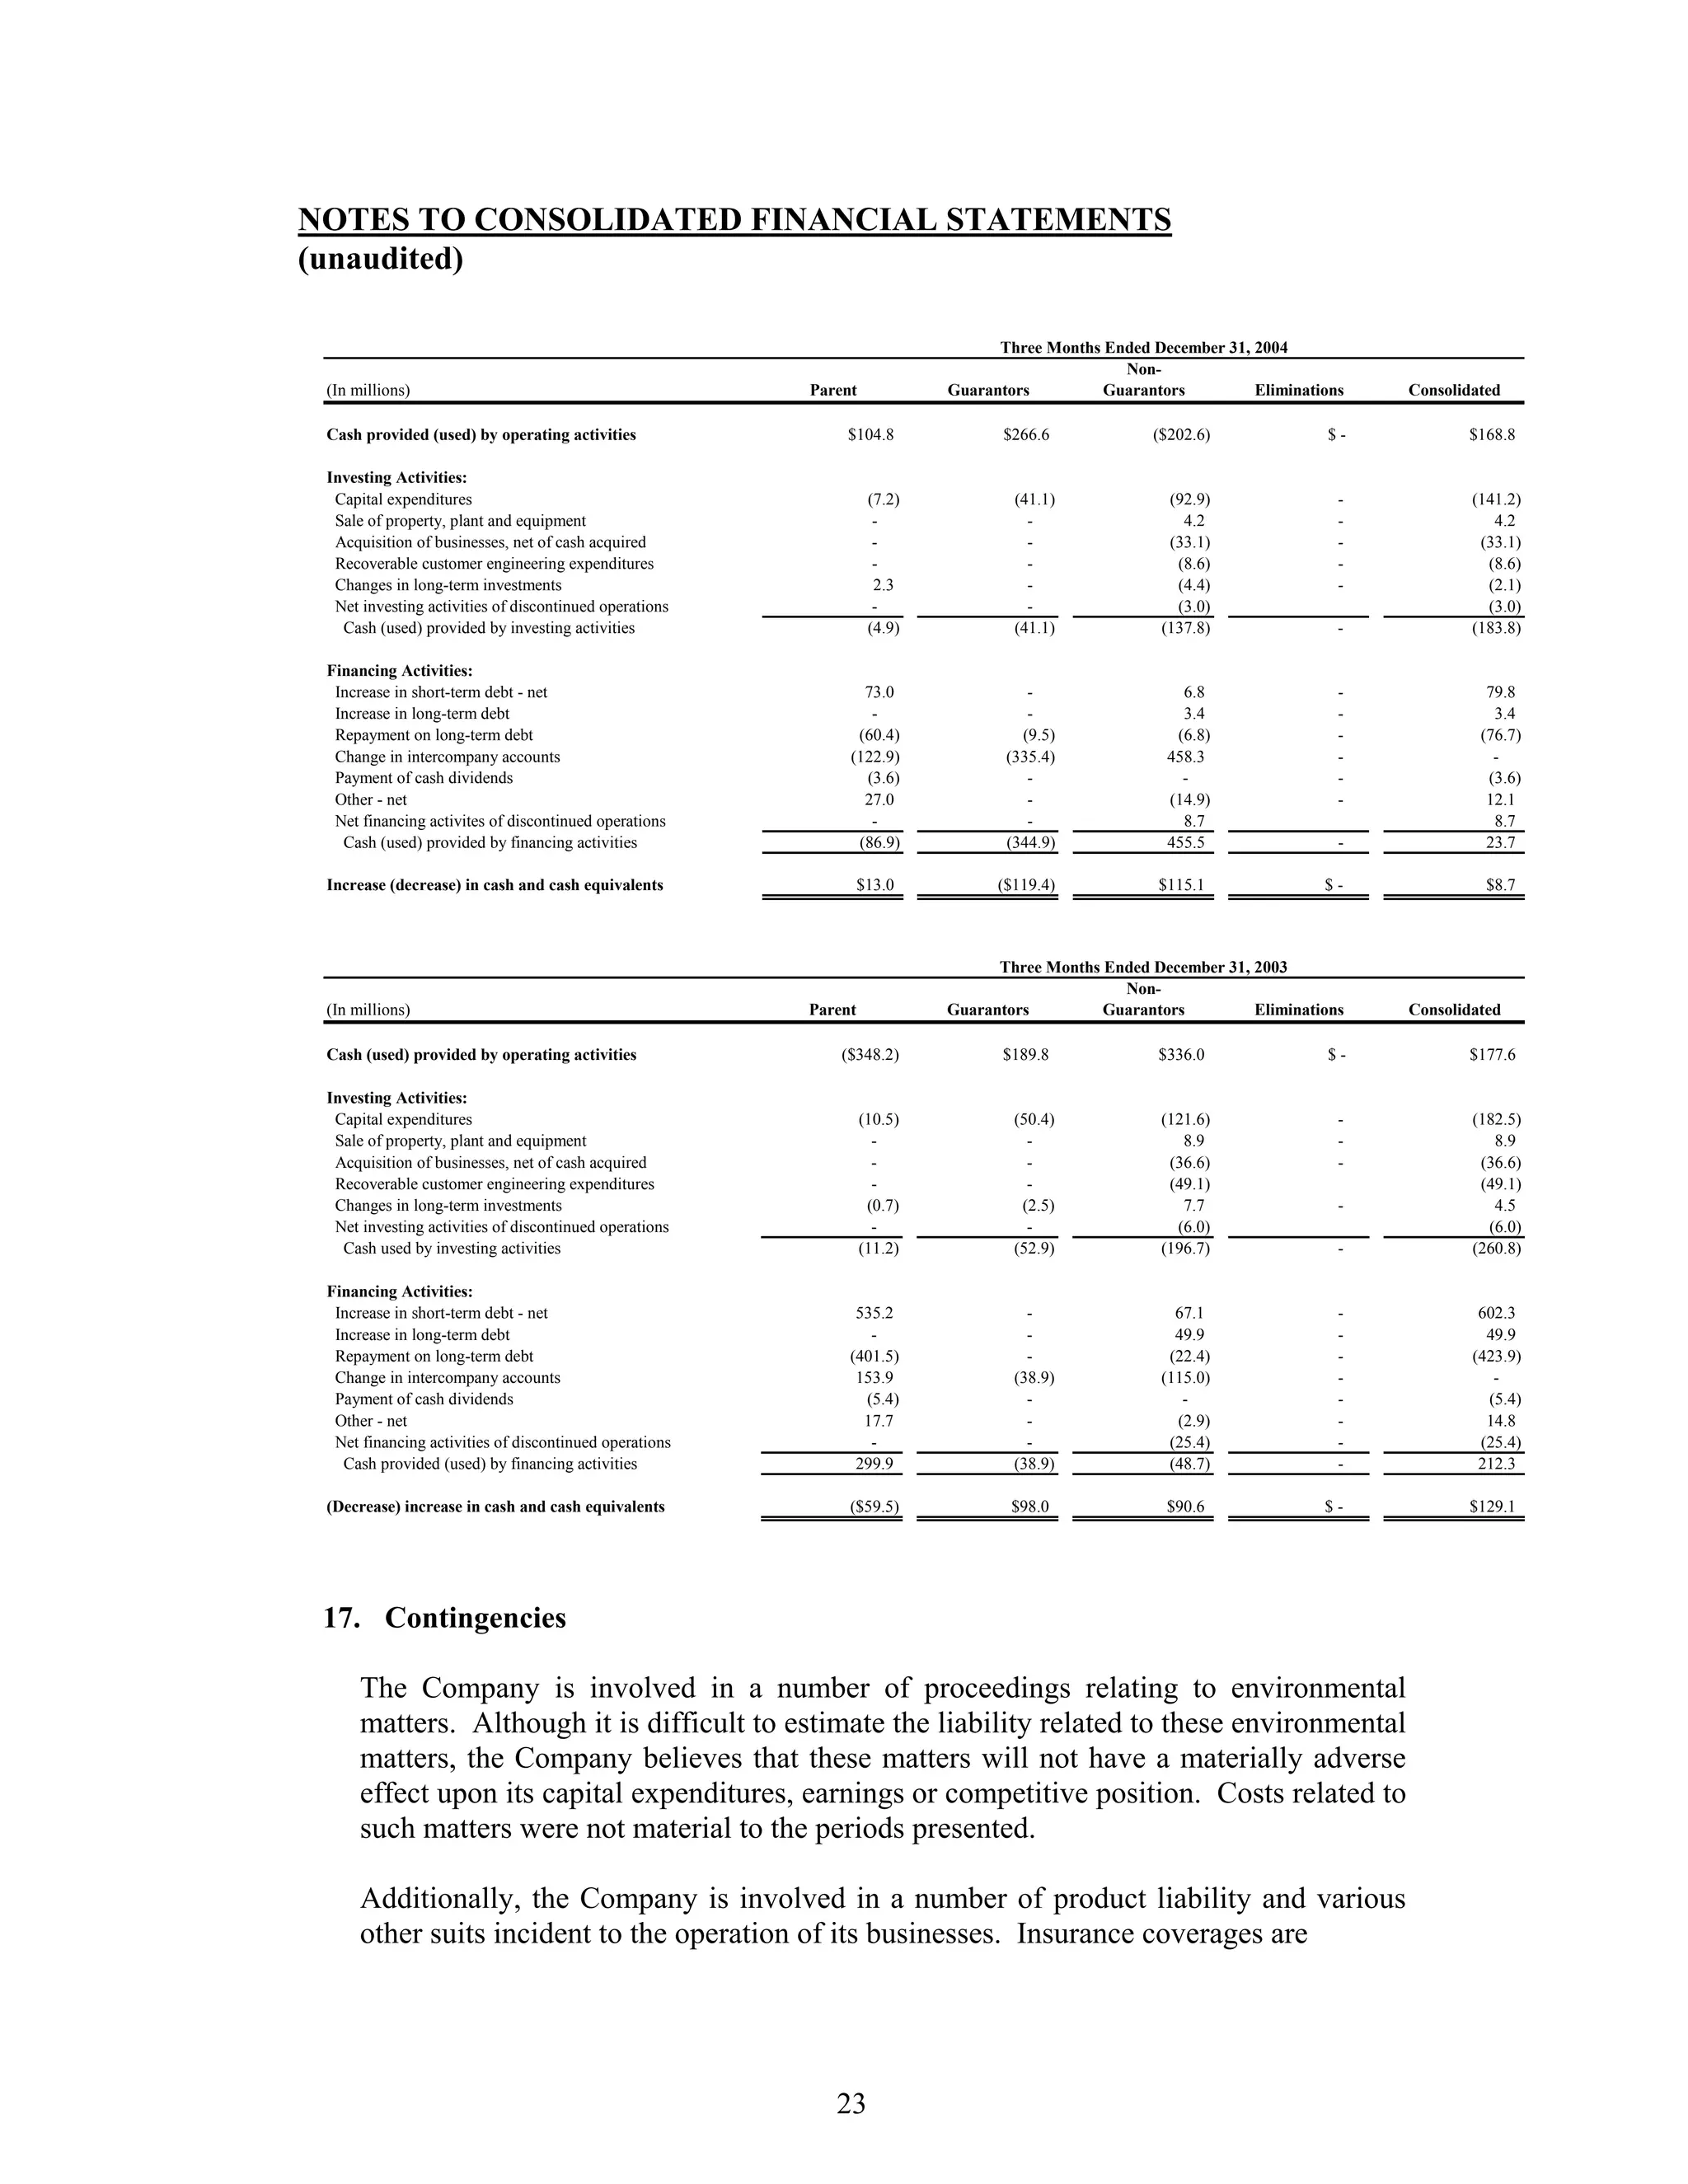
Download to read offline
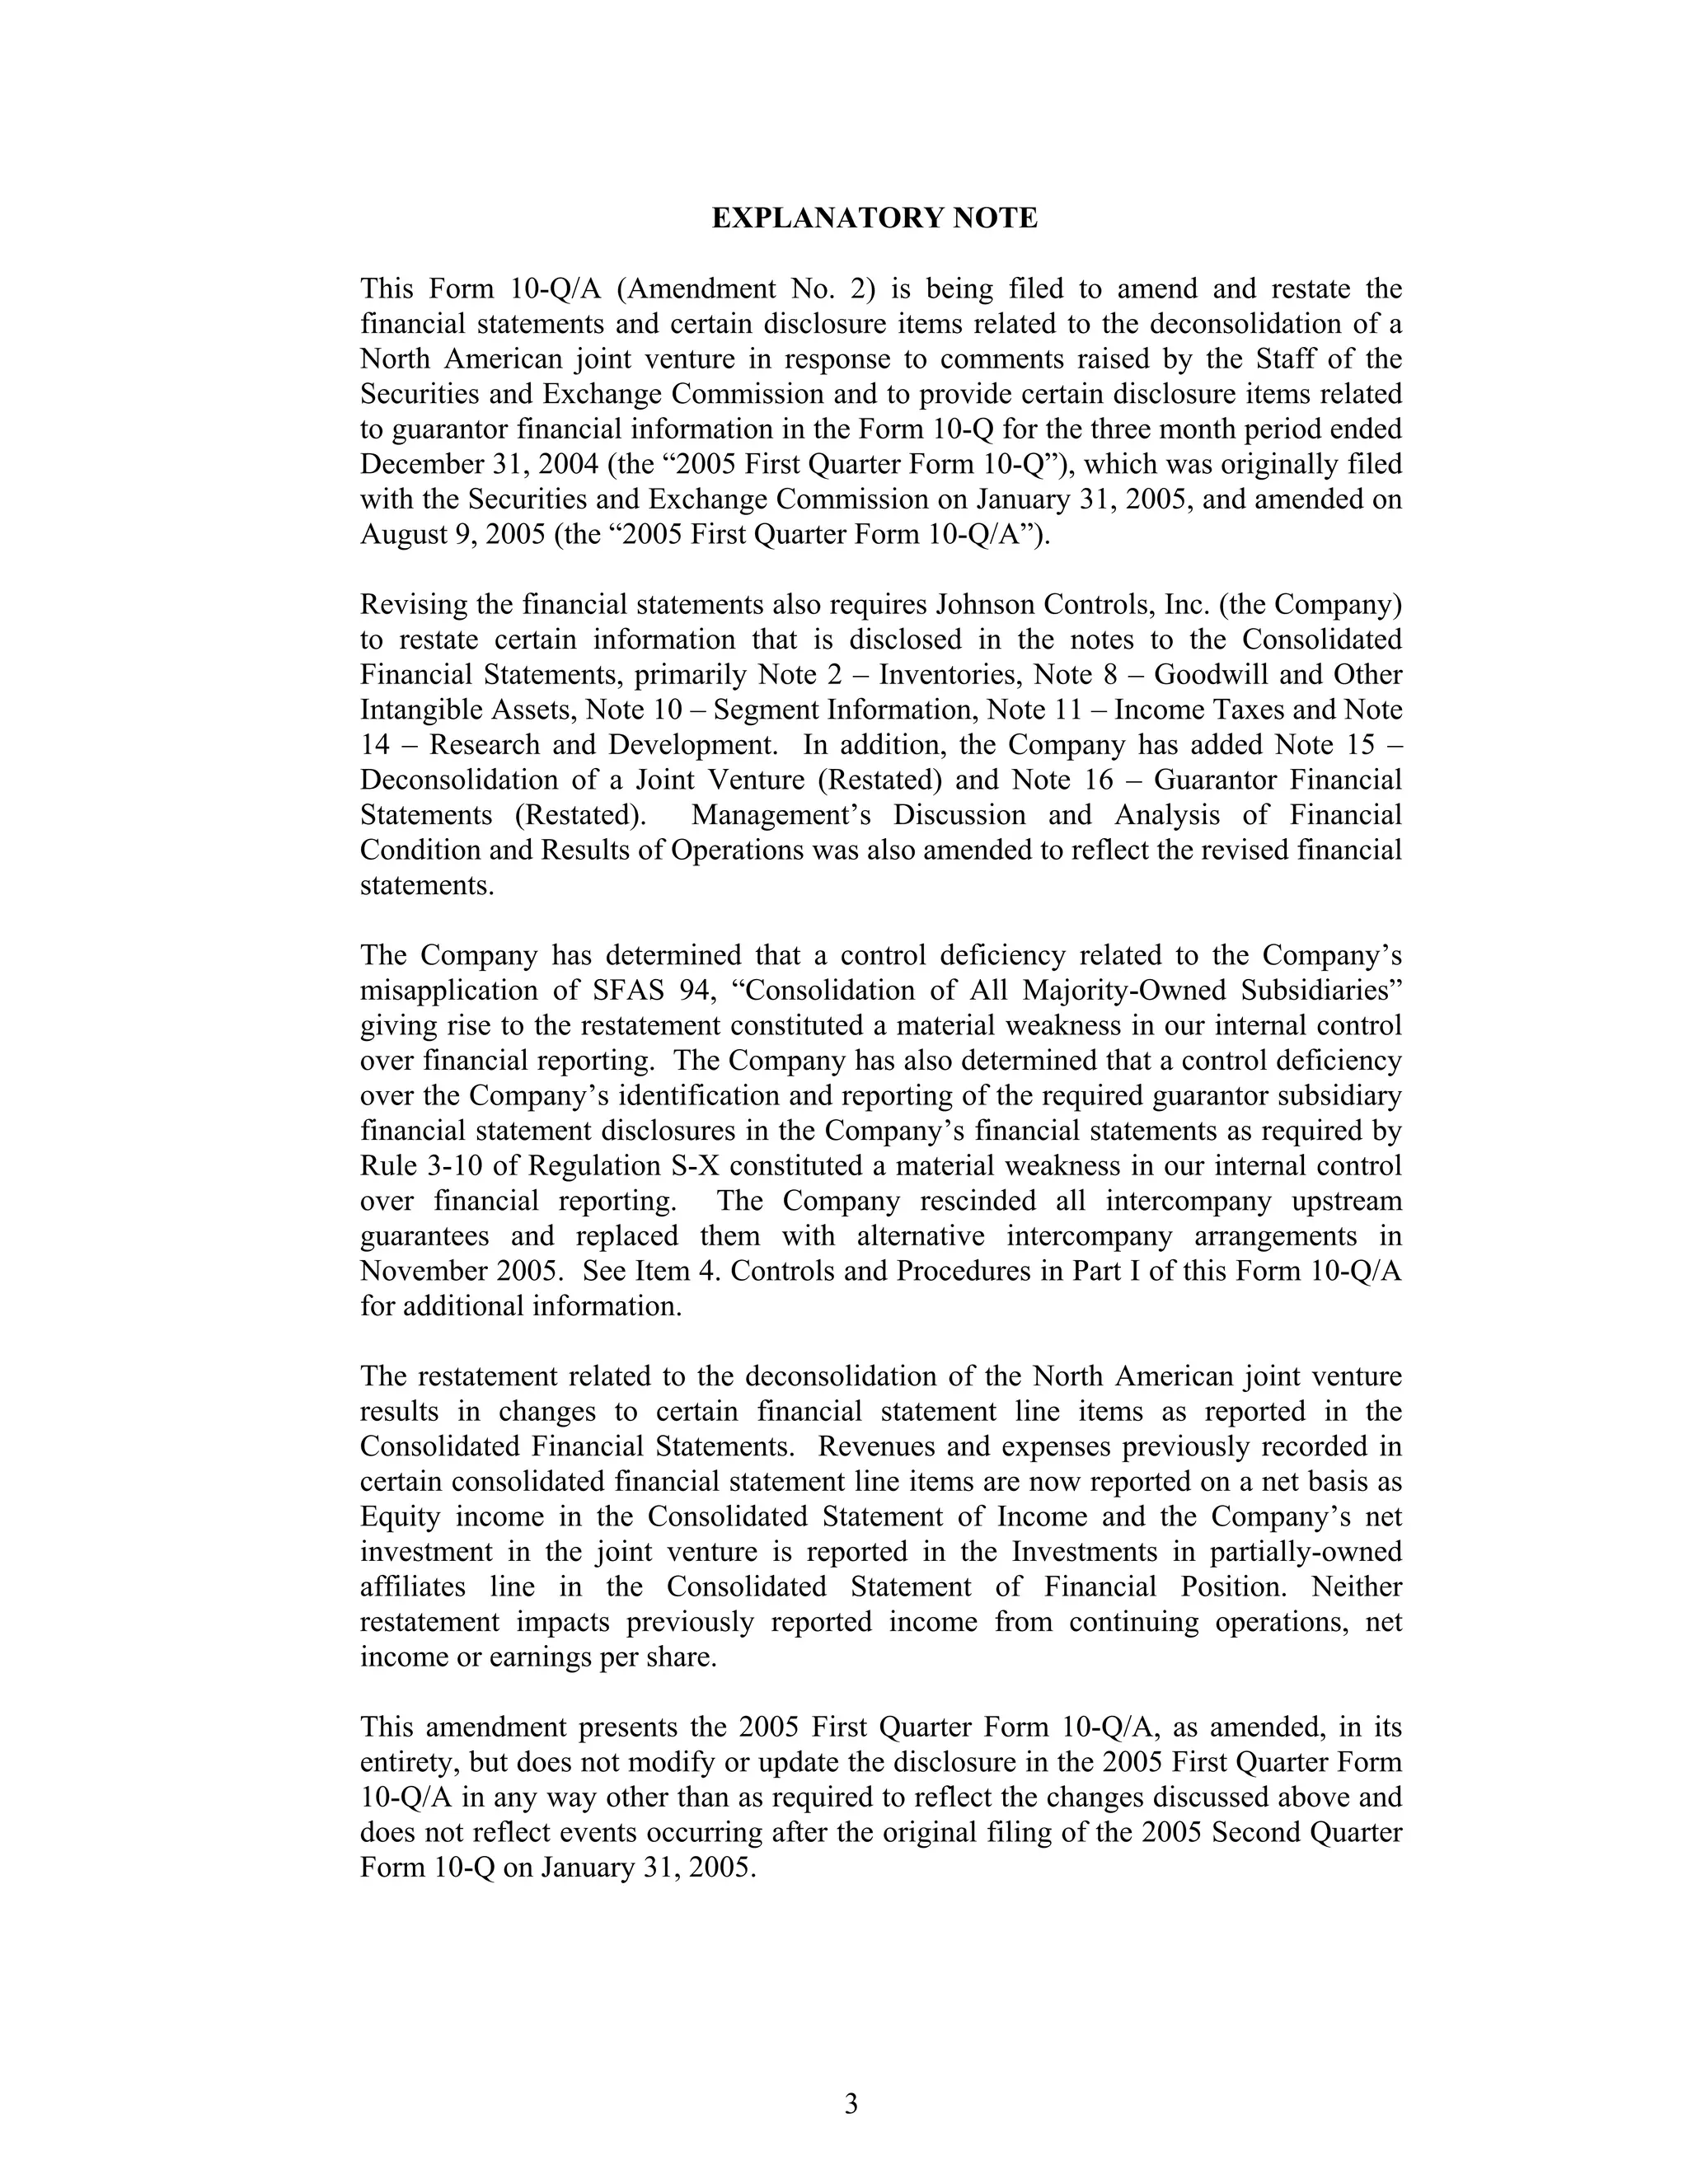
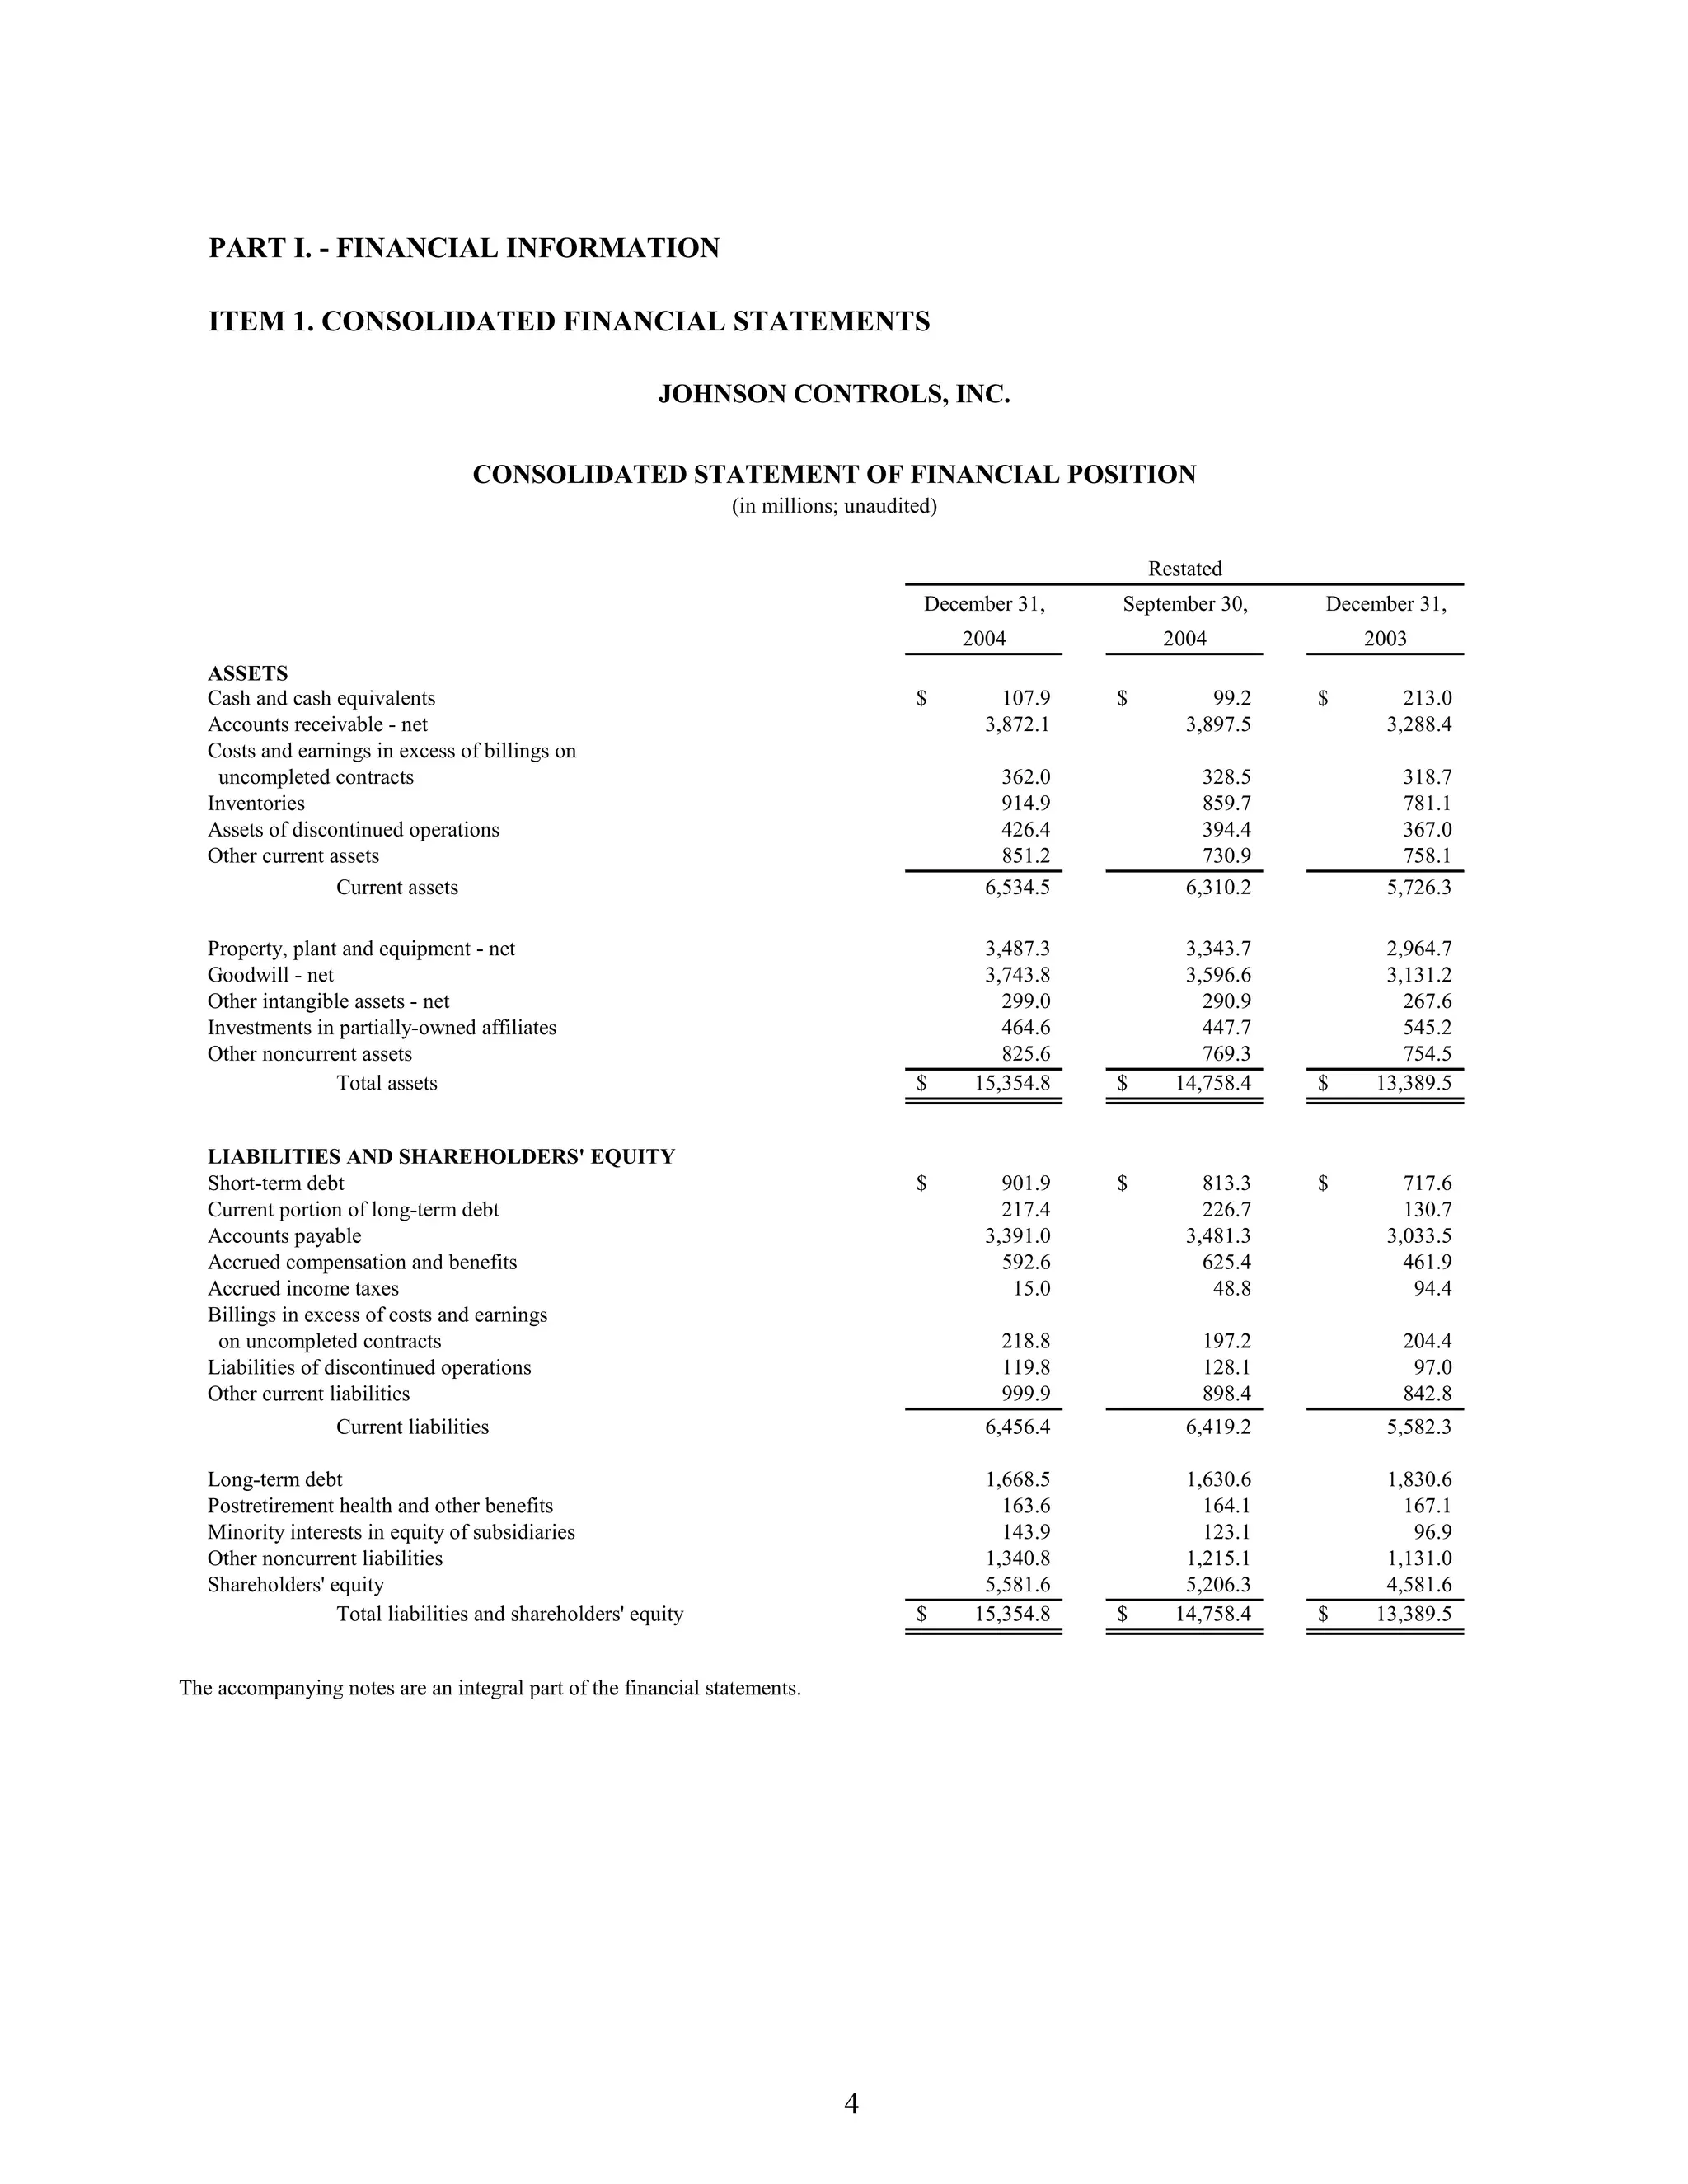
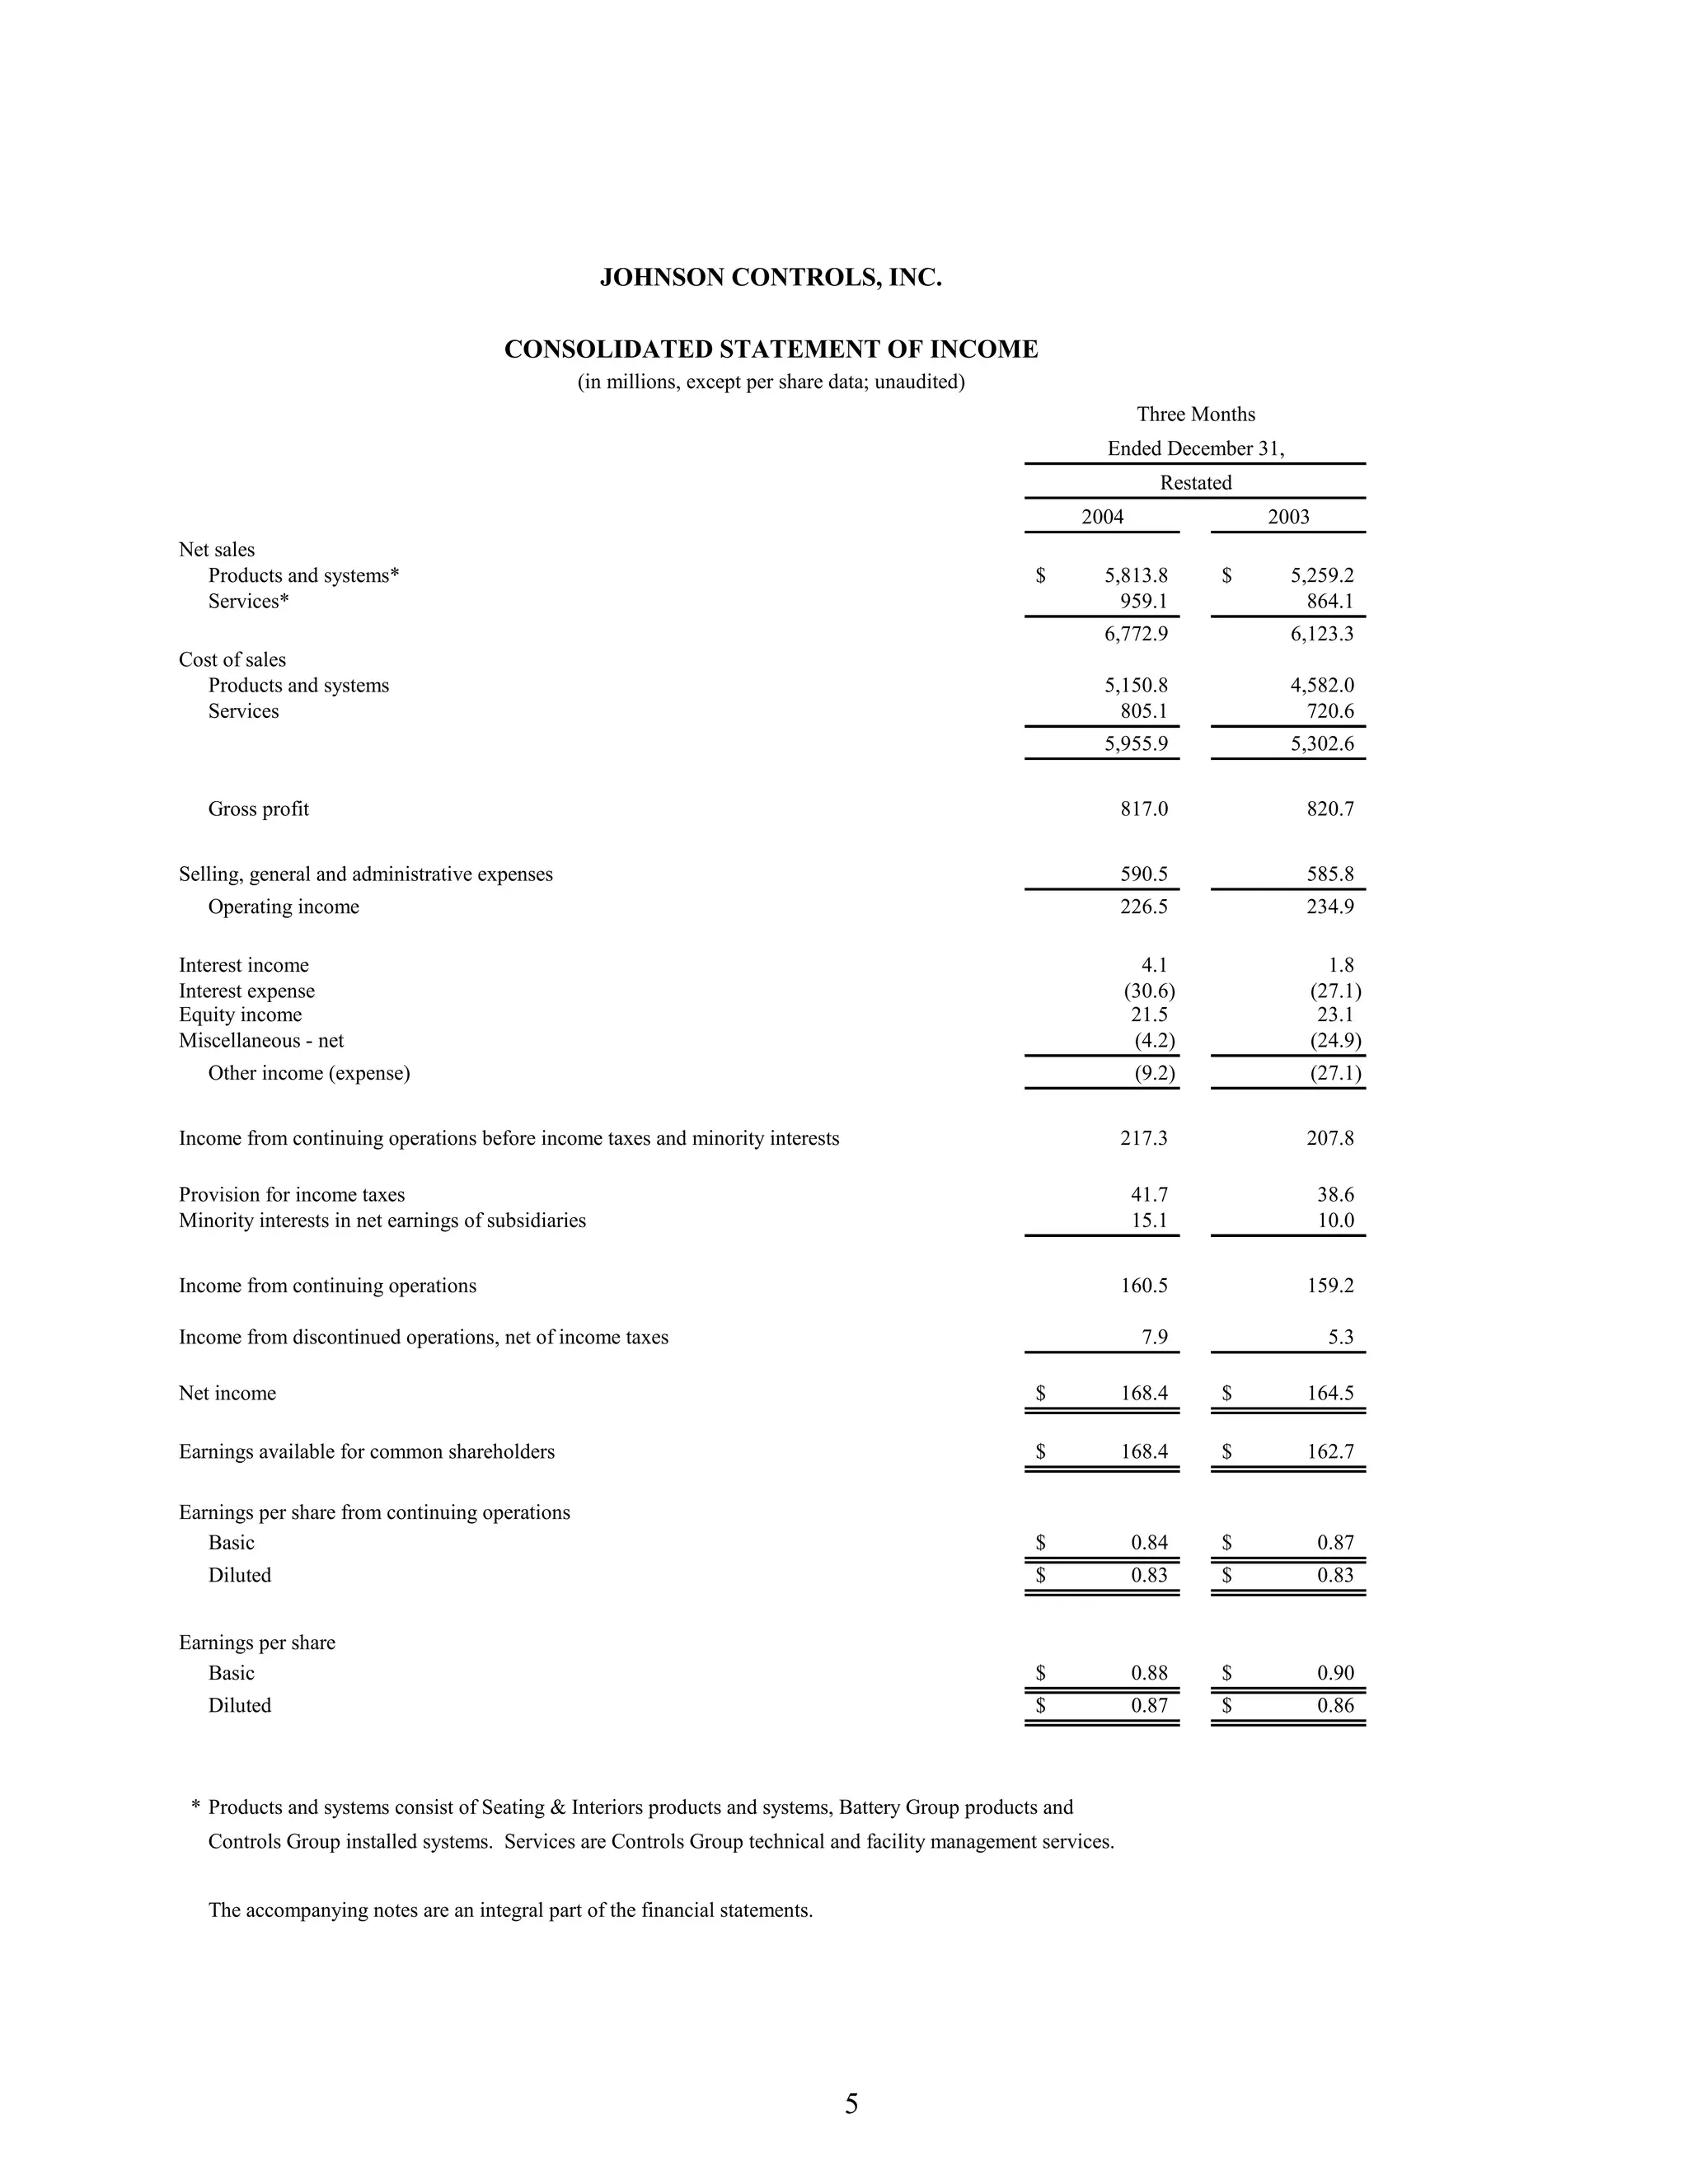
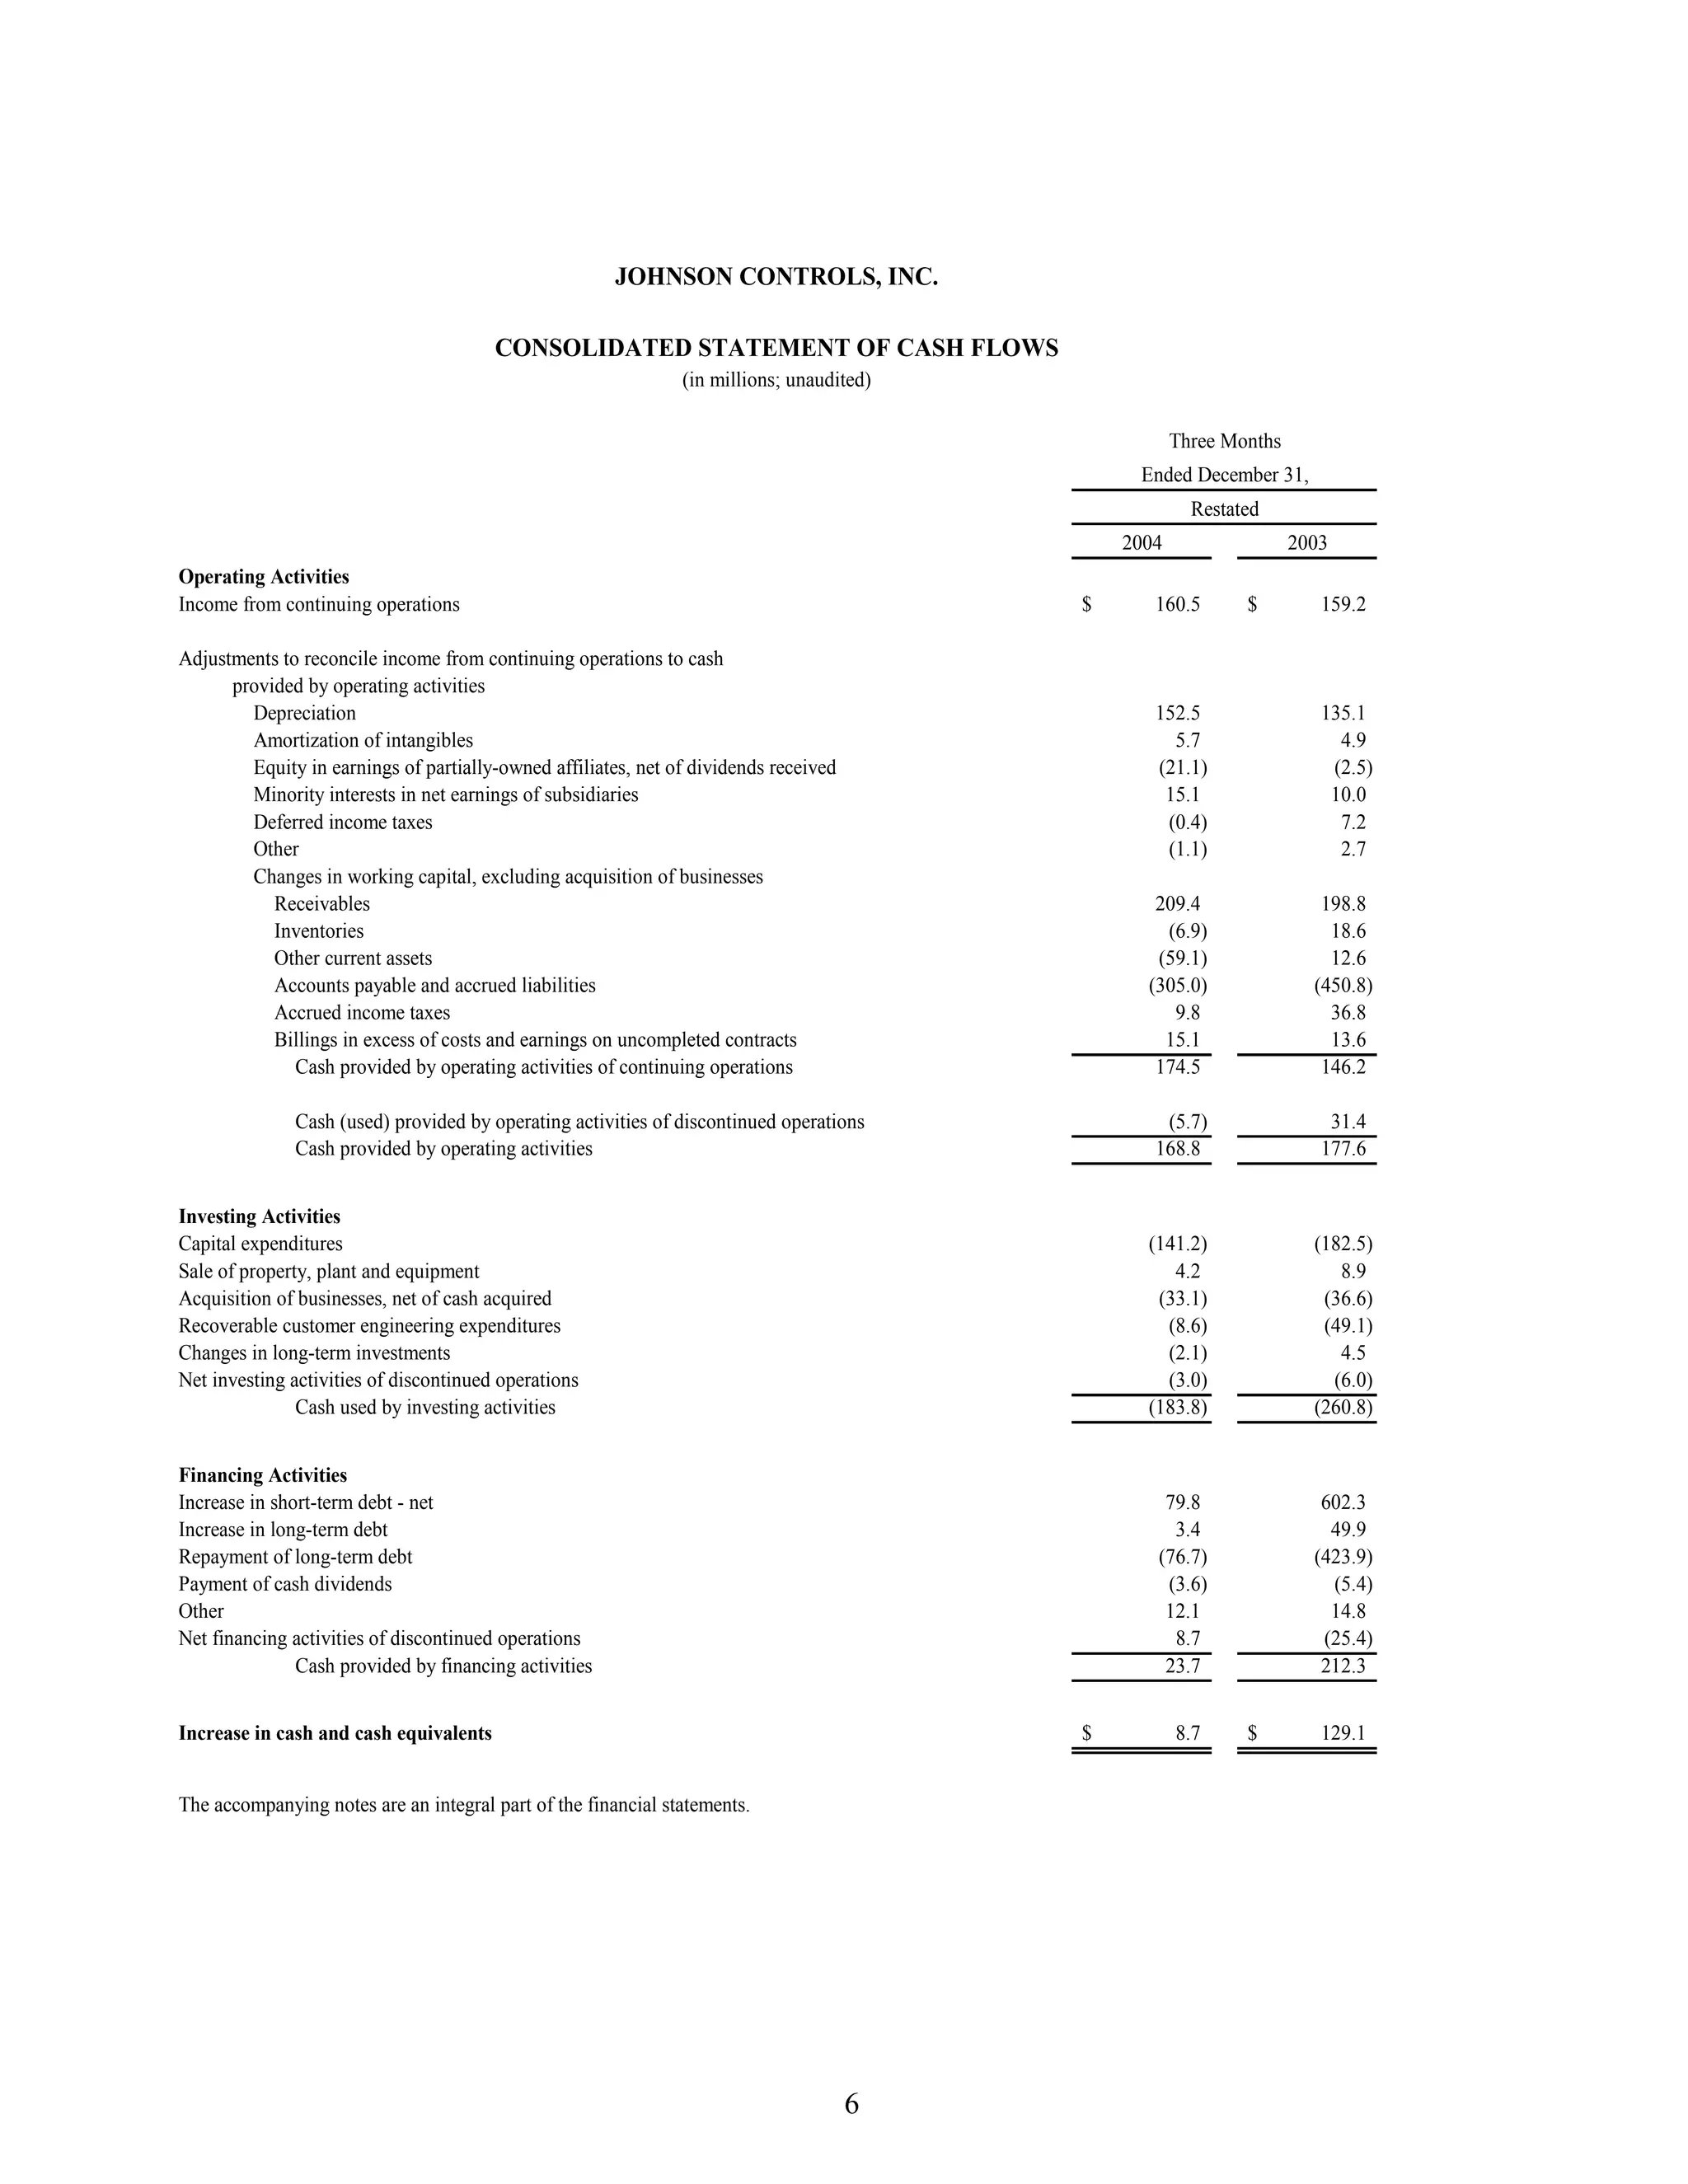
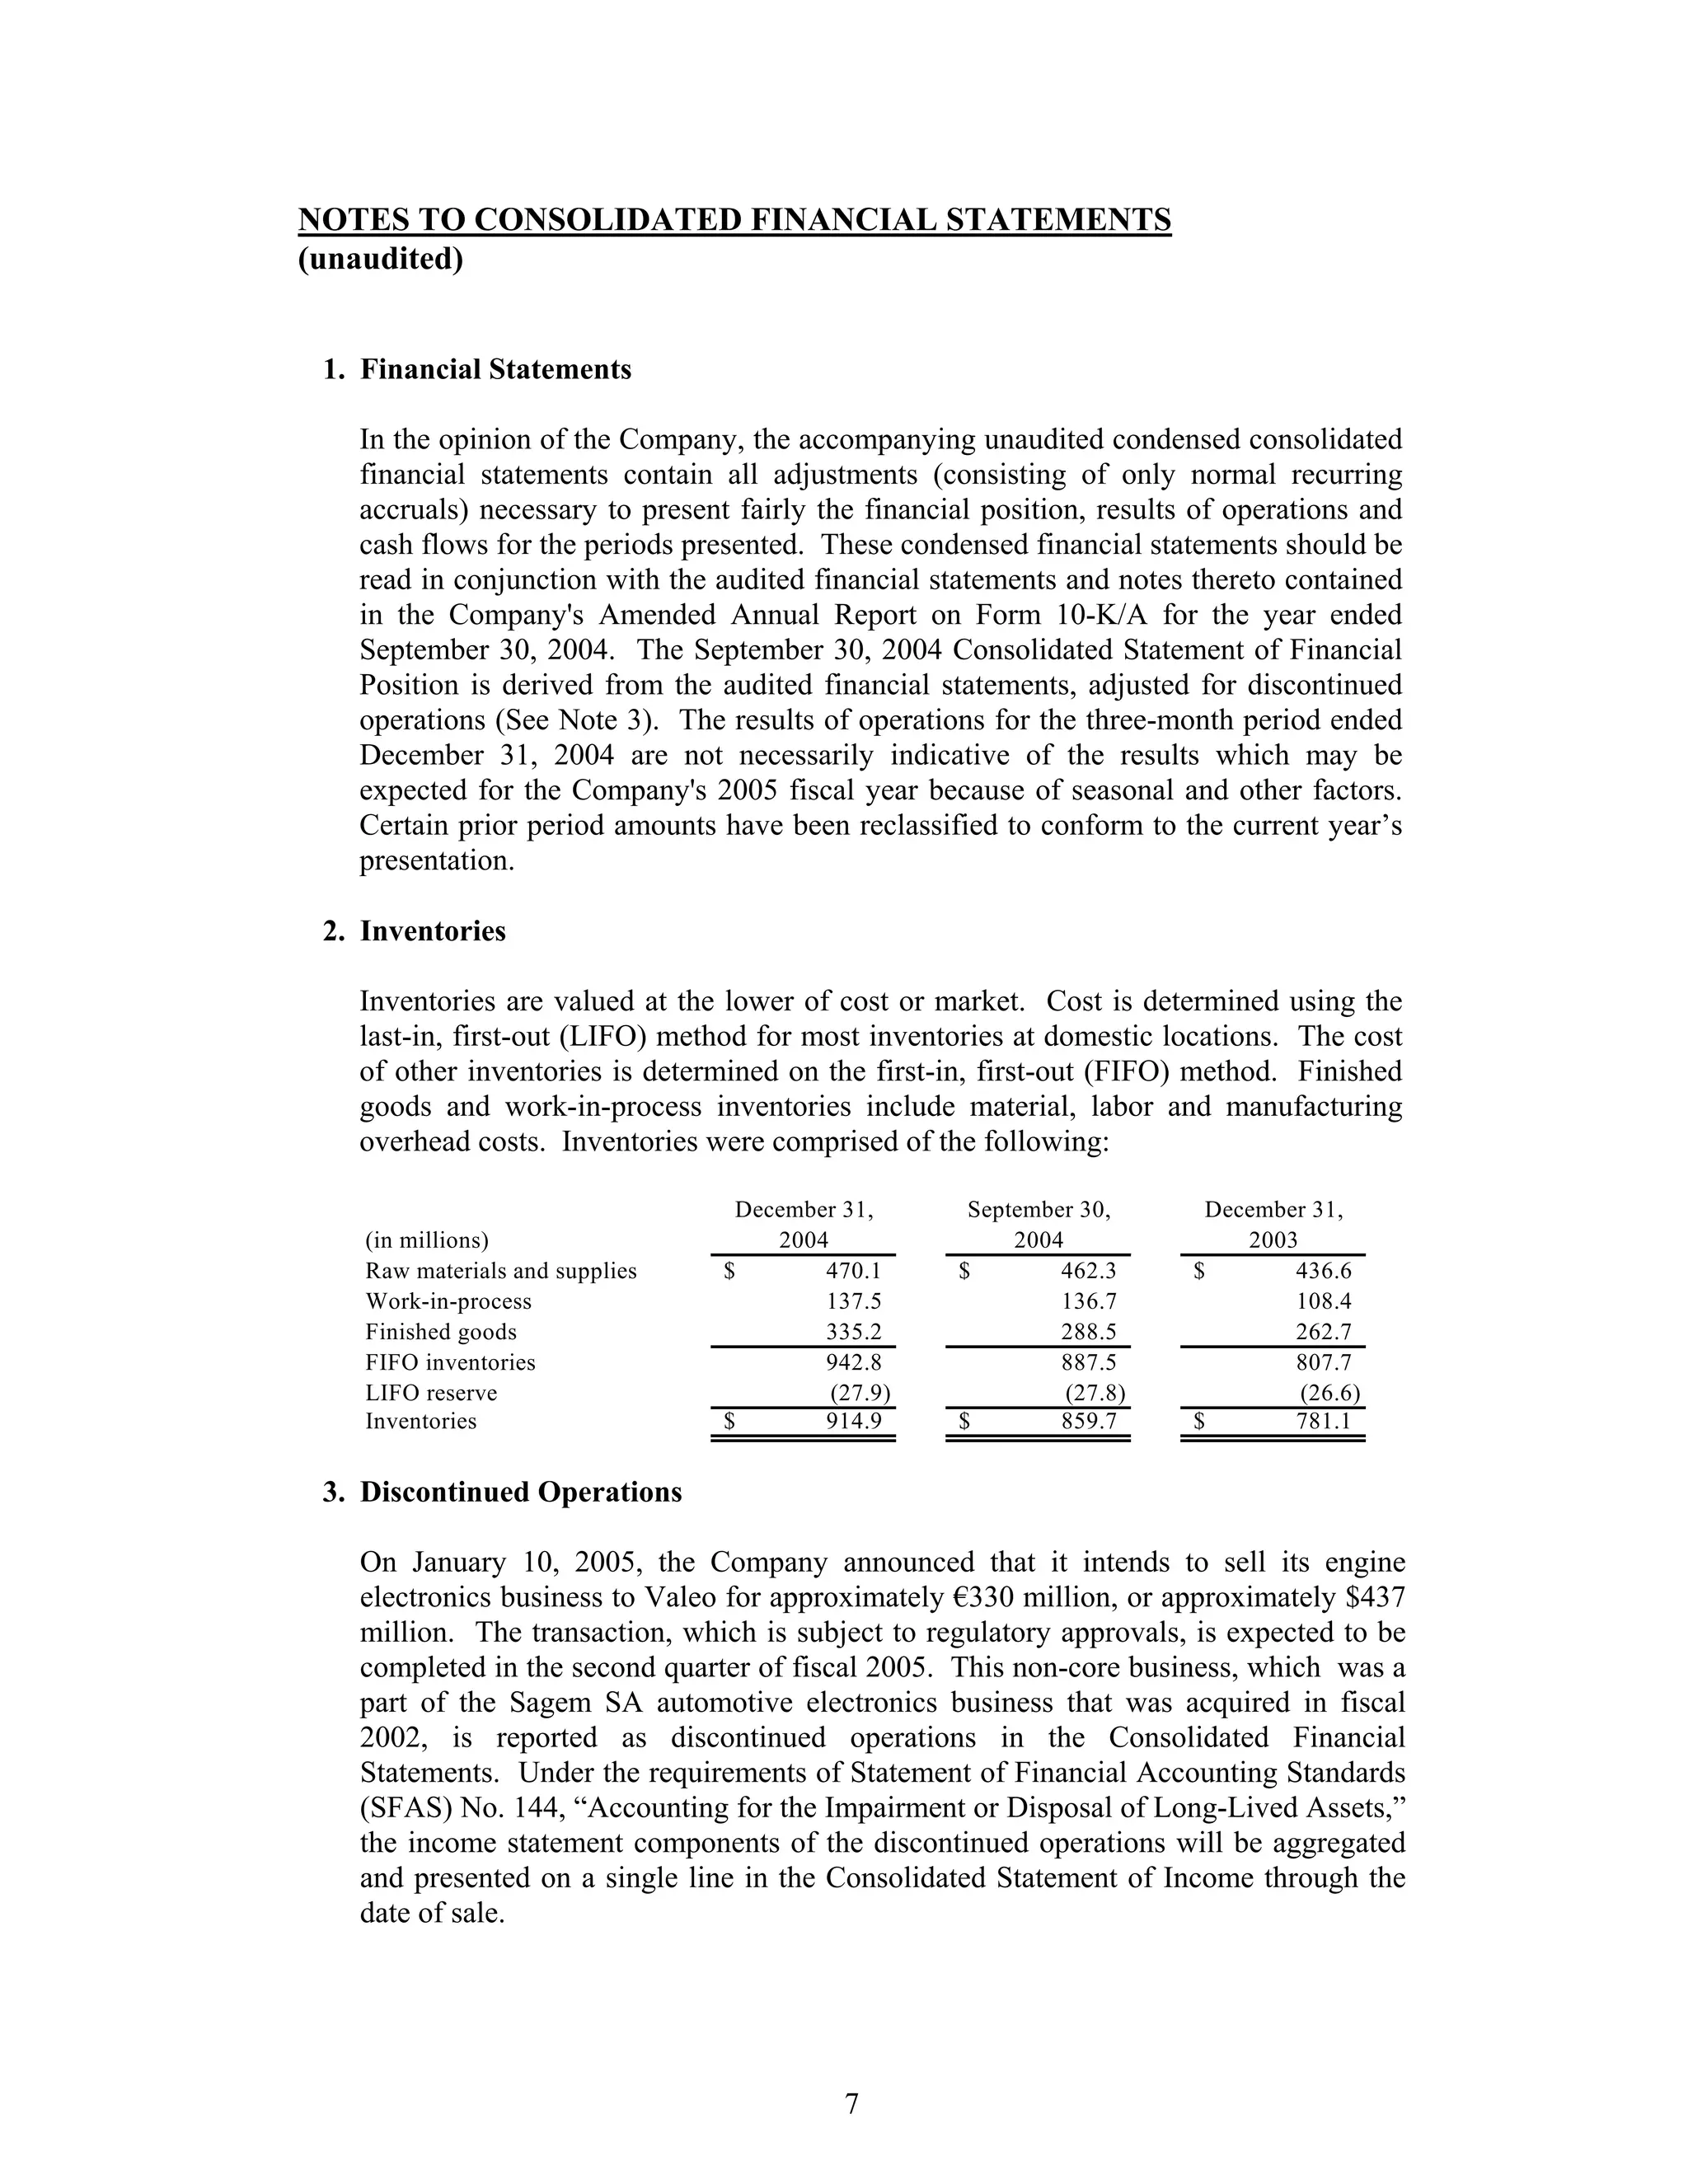
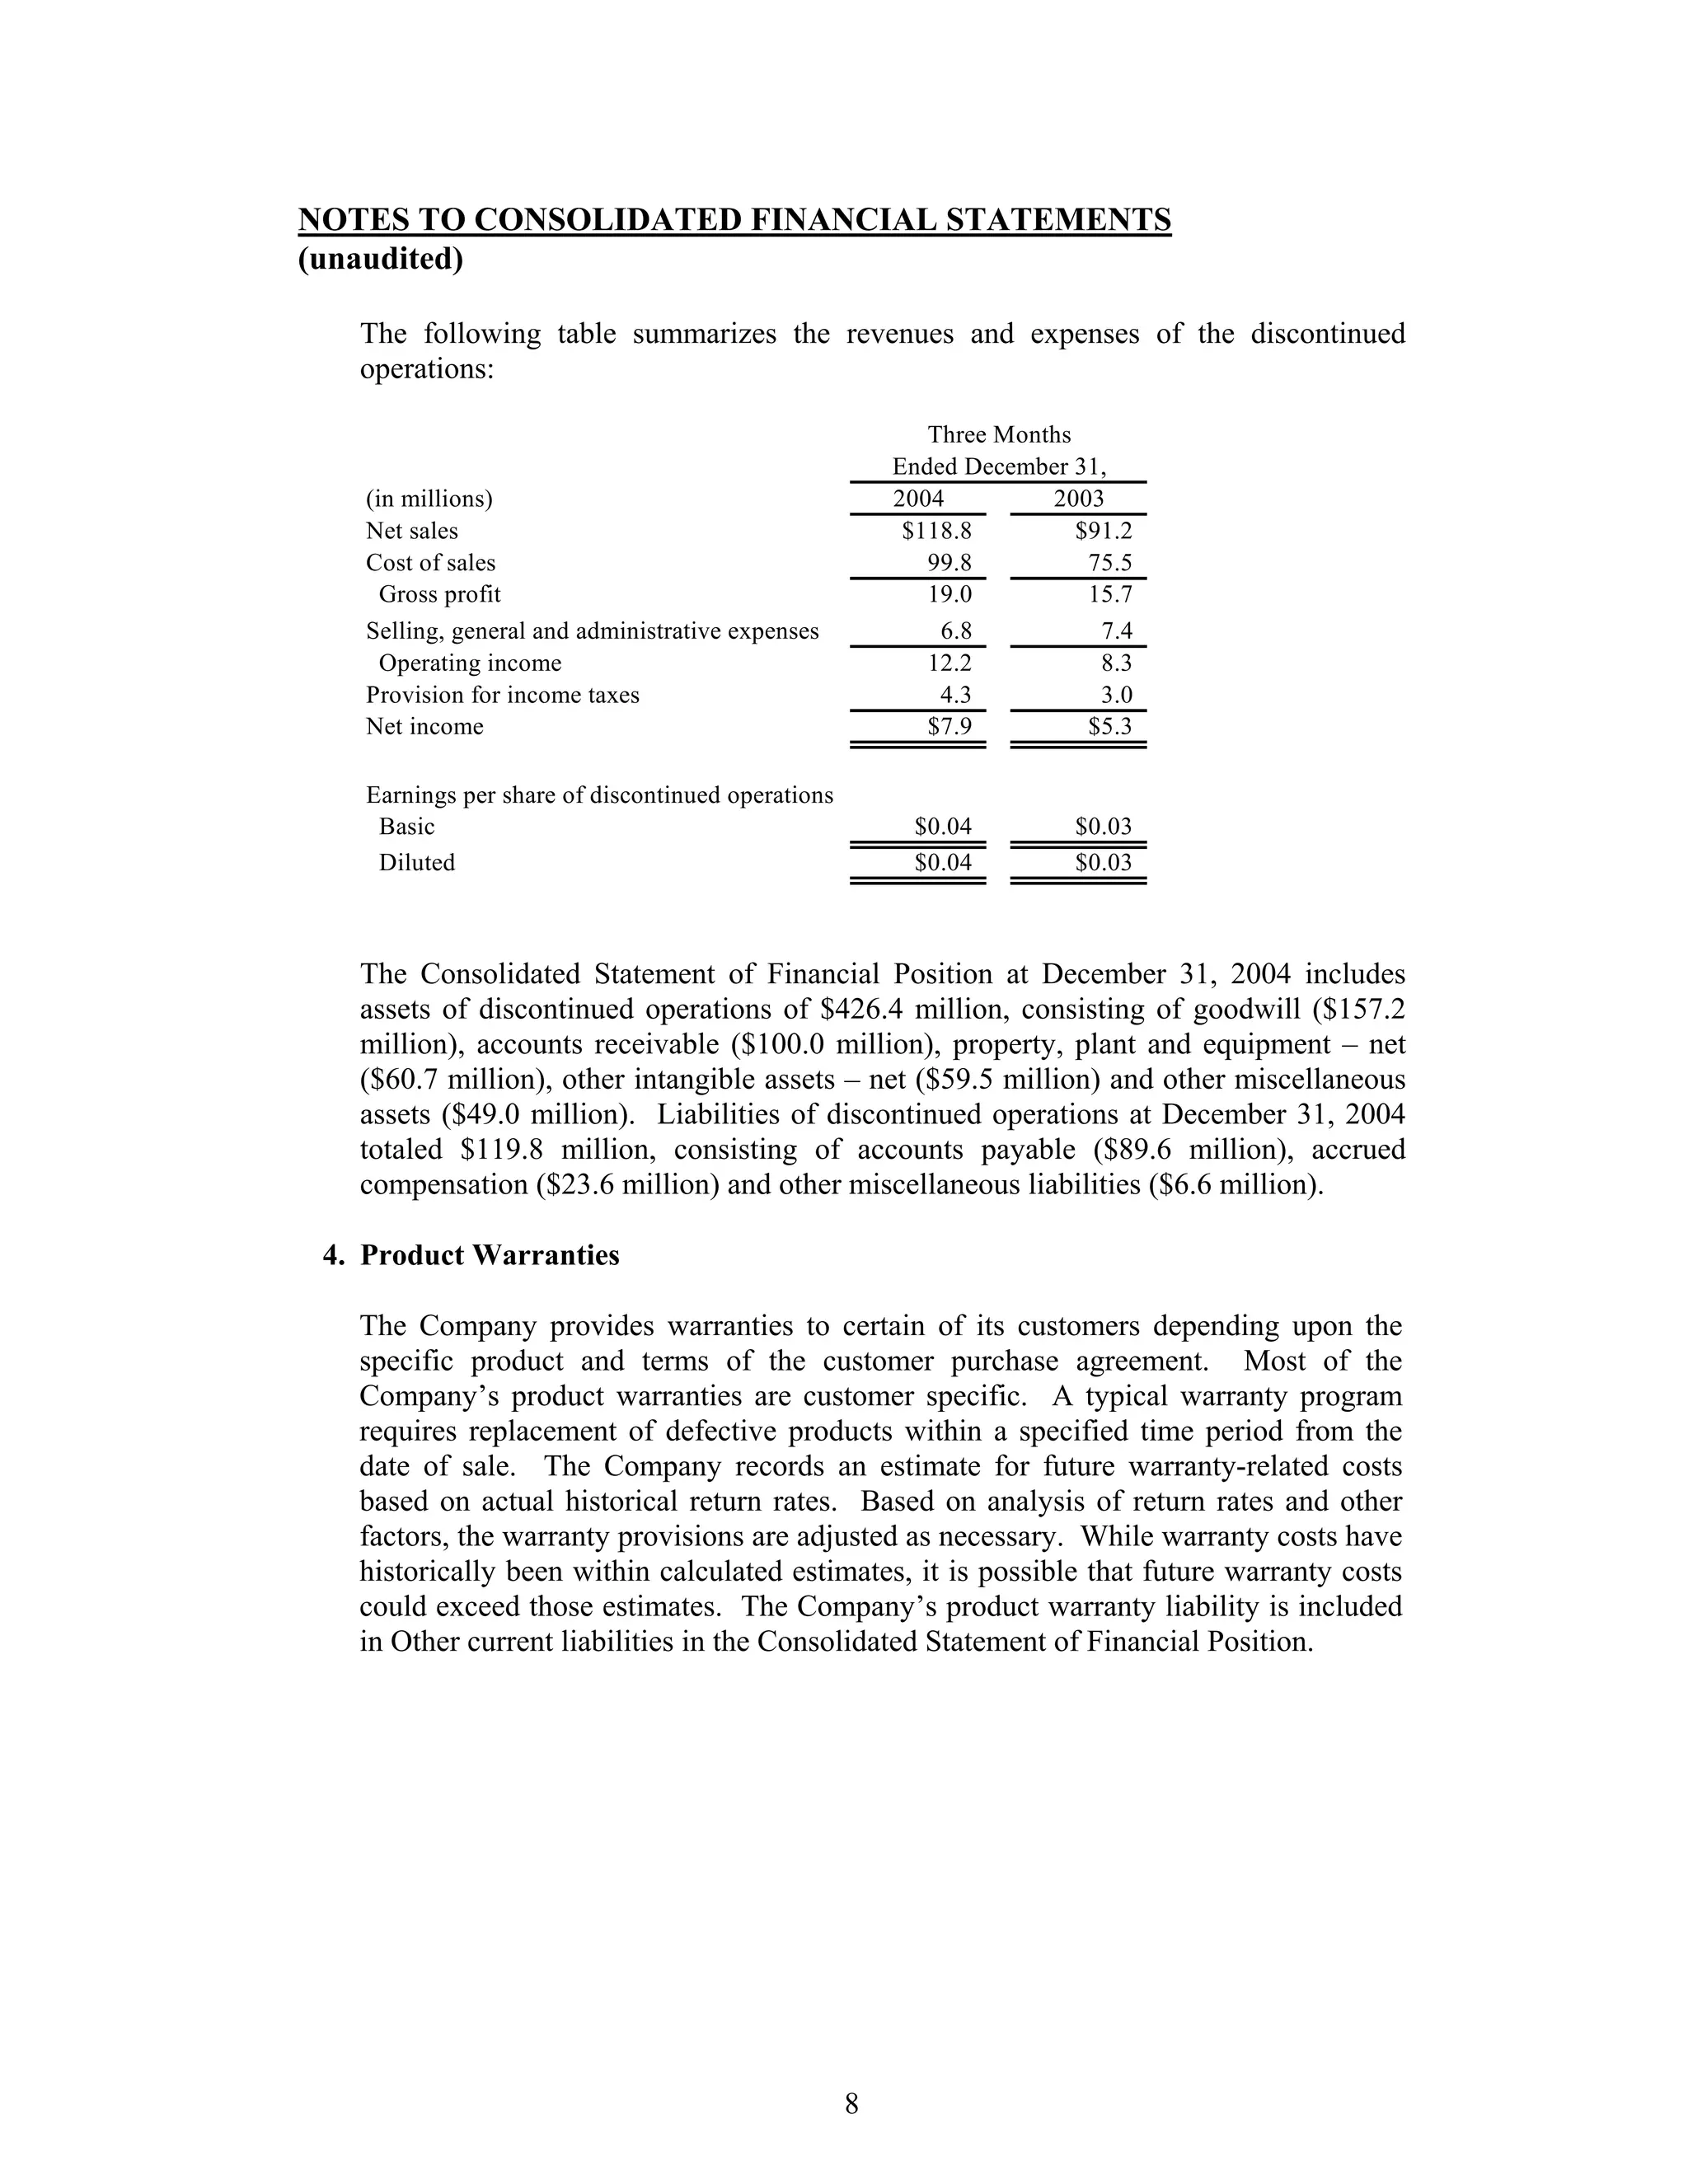


This document is an amended quarterly report (Form 10-Q/A) filed by Johnson Controls, Inc. for the period ending December 31, 2004, which restates financial statements due to the deconsolidation of a North American joint venture. The filing addresses comments from the Securities and Exchange Commission and includes revised financial data, along with updated notes regarding inventories, goodwill, segment information, income taxes, and research and development. The amendment does not significantly affect previously reported income figures but highlights weaknesses in internal controls related to financial reporting.


