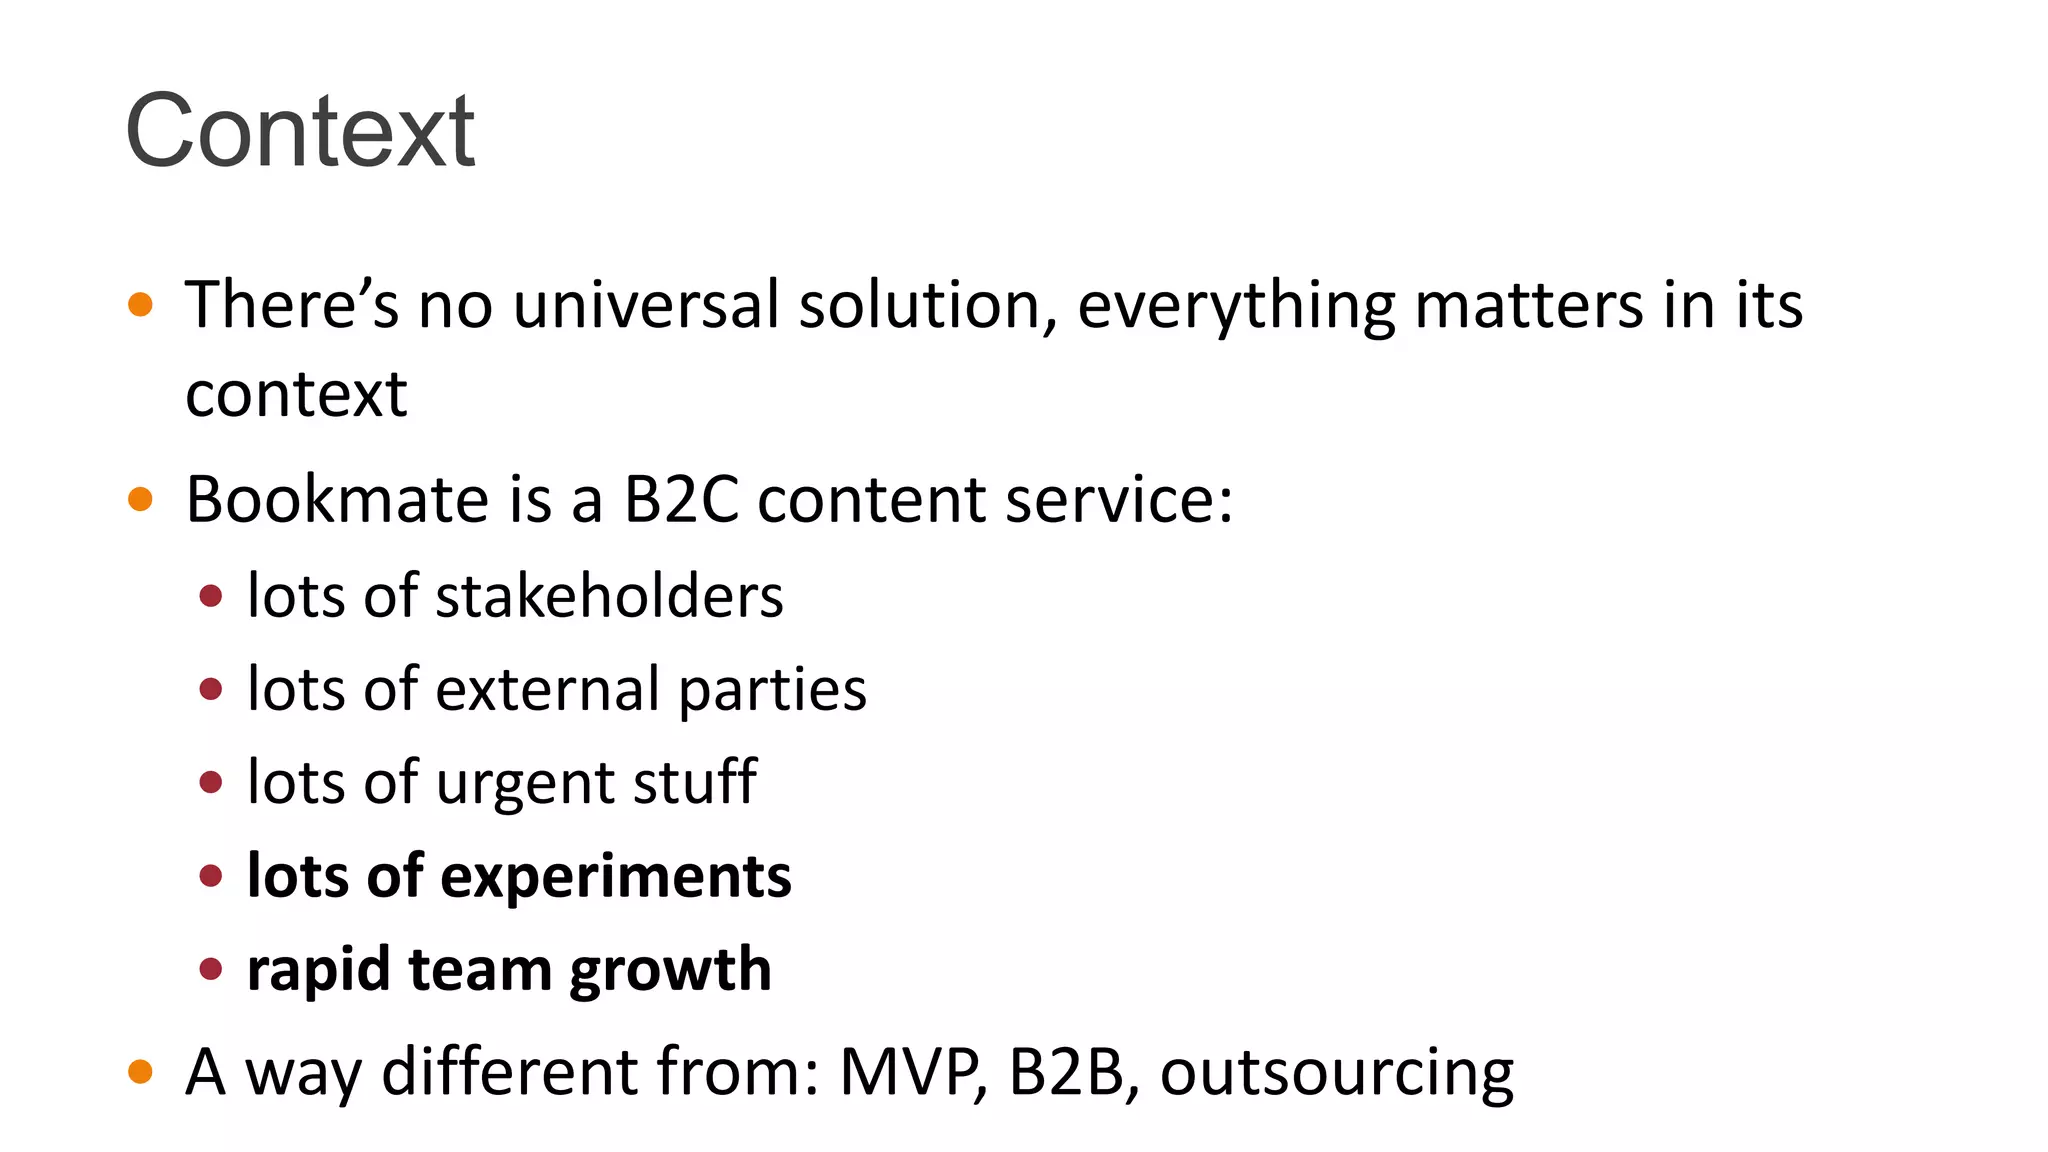
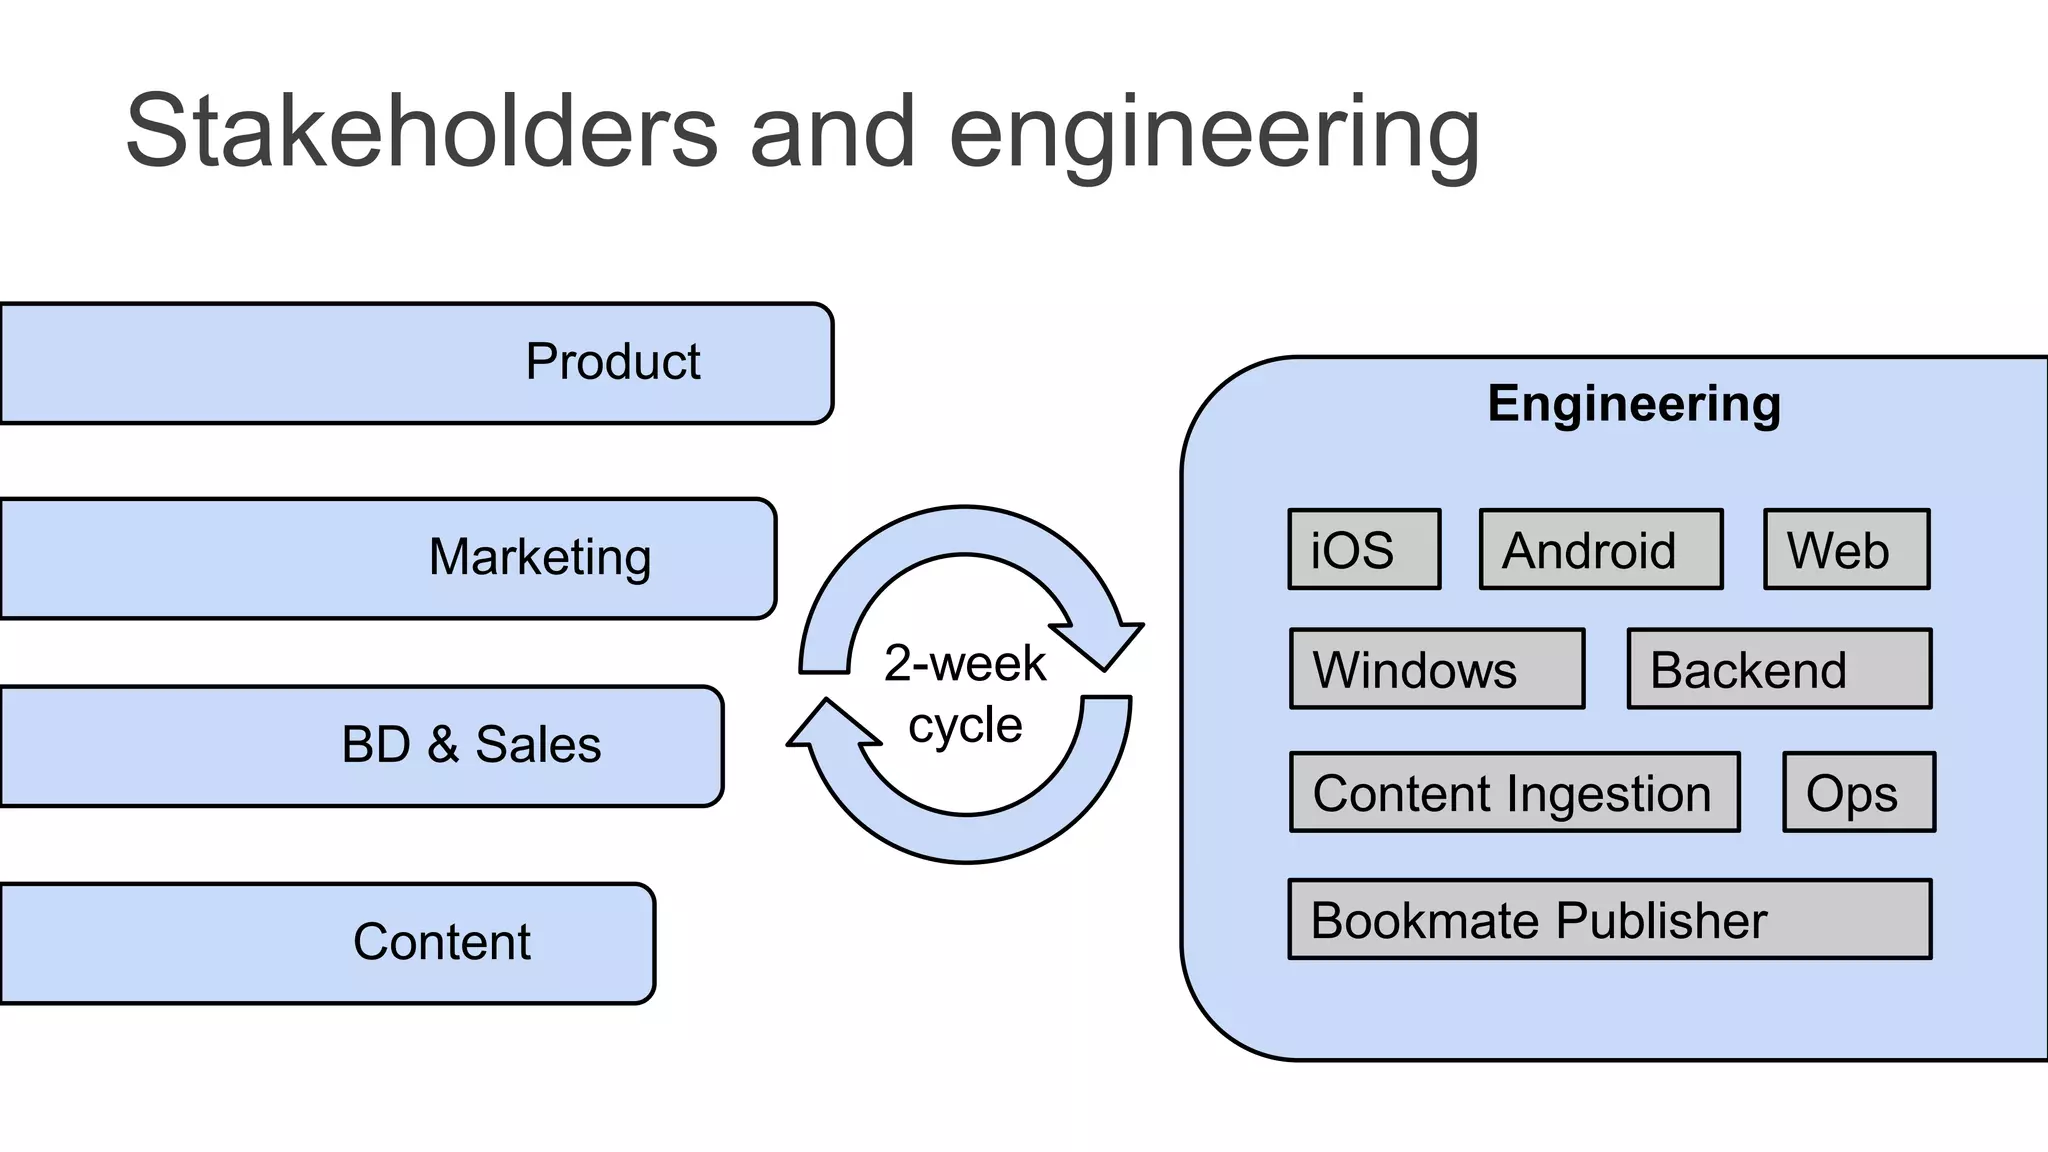
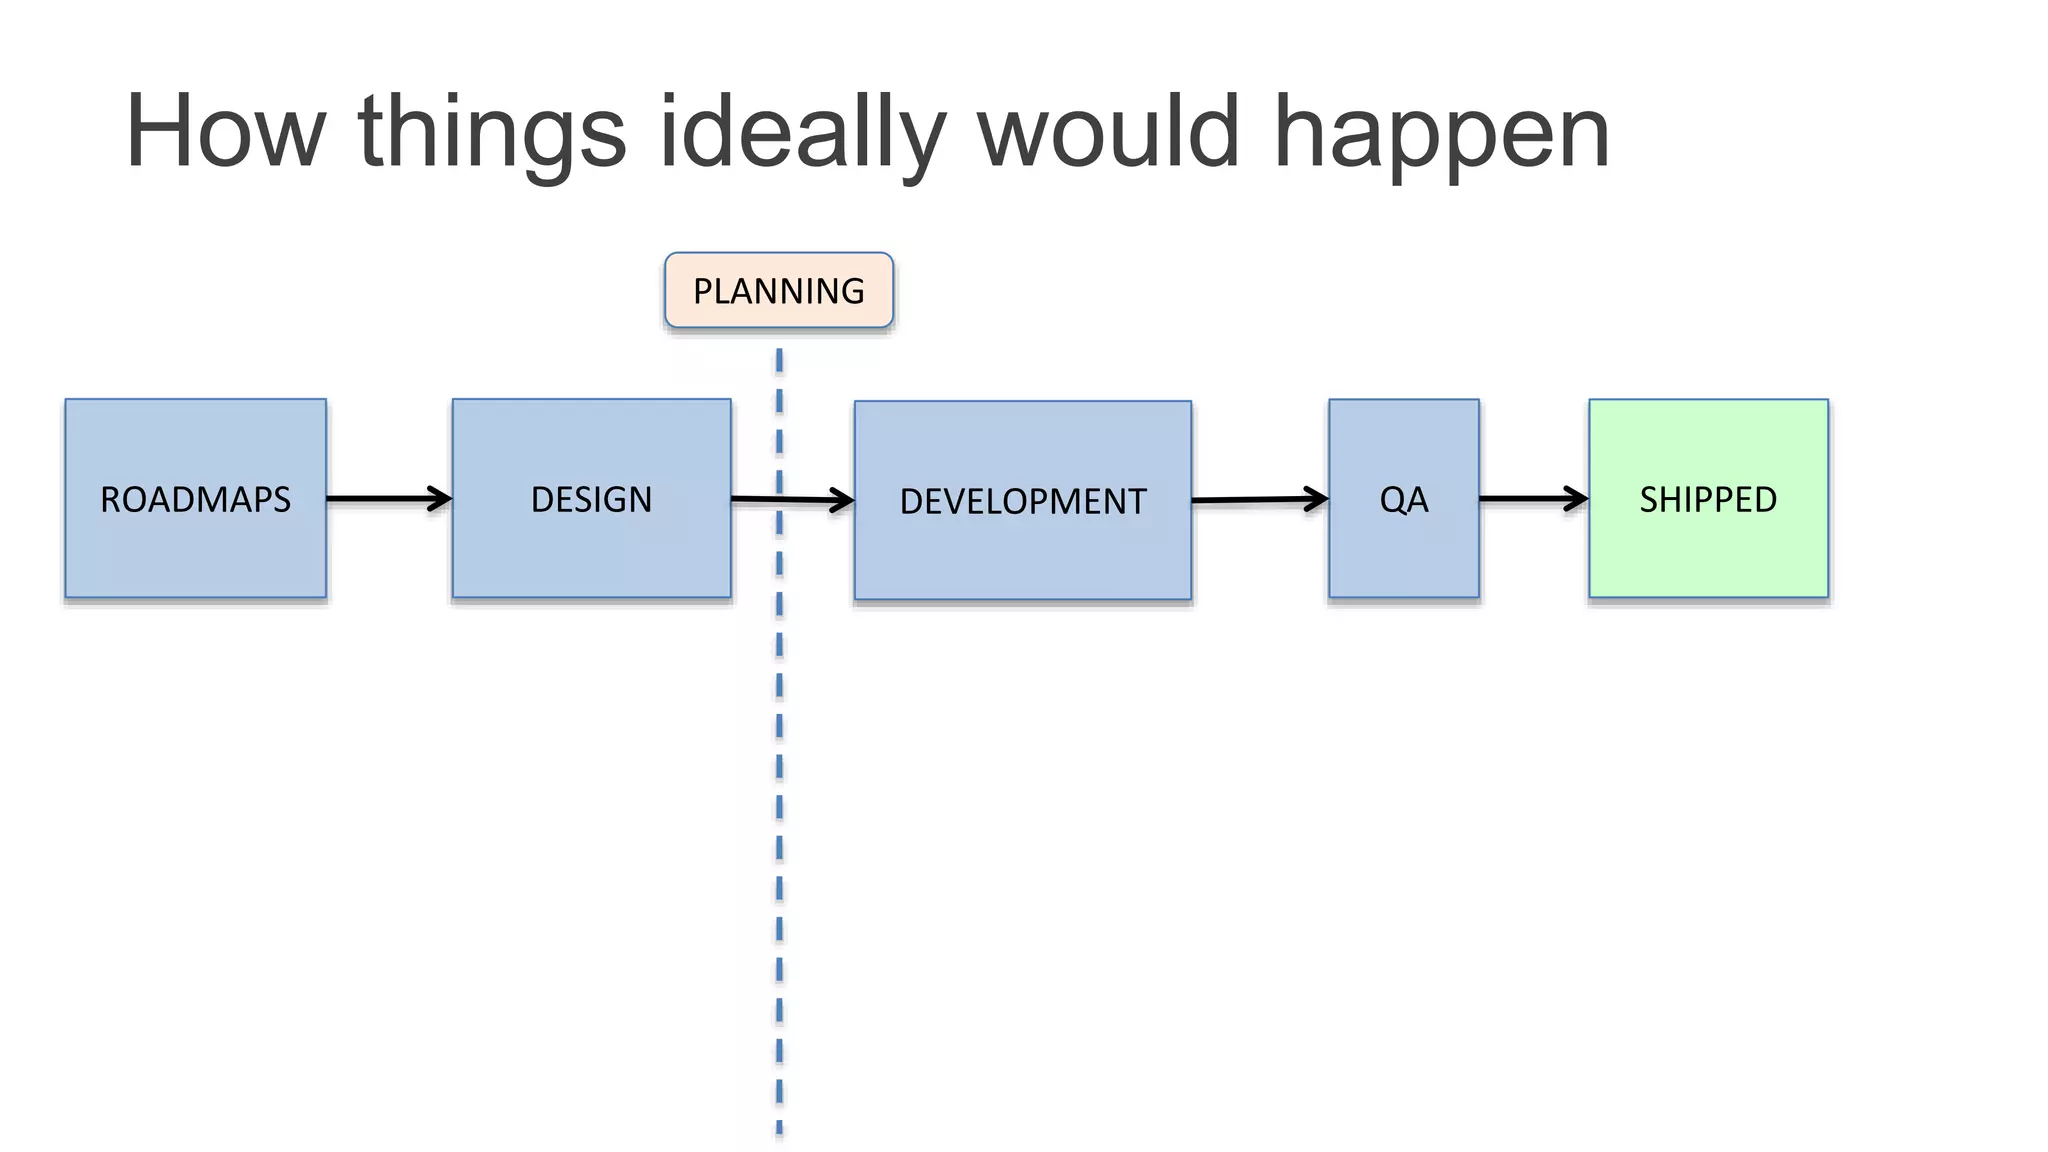
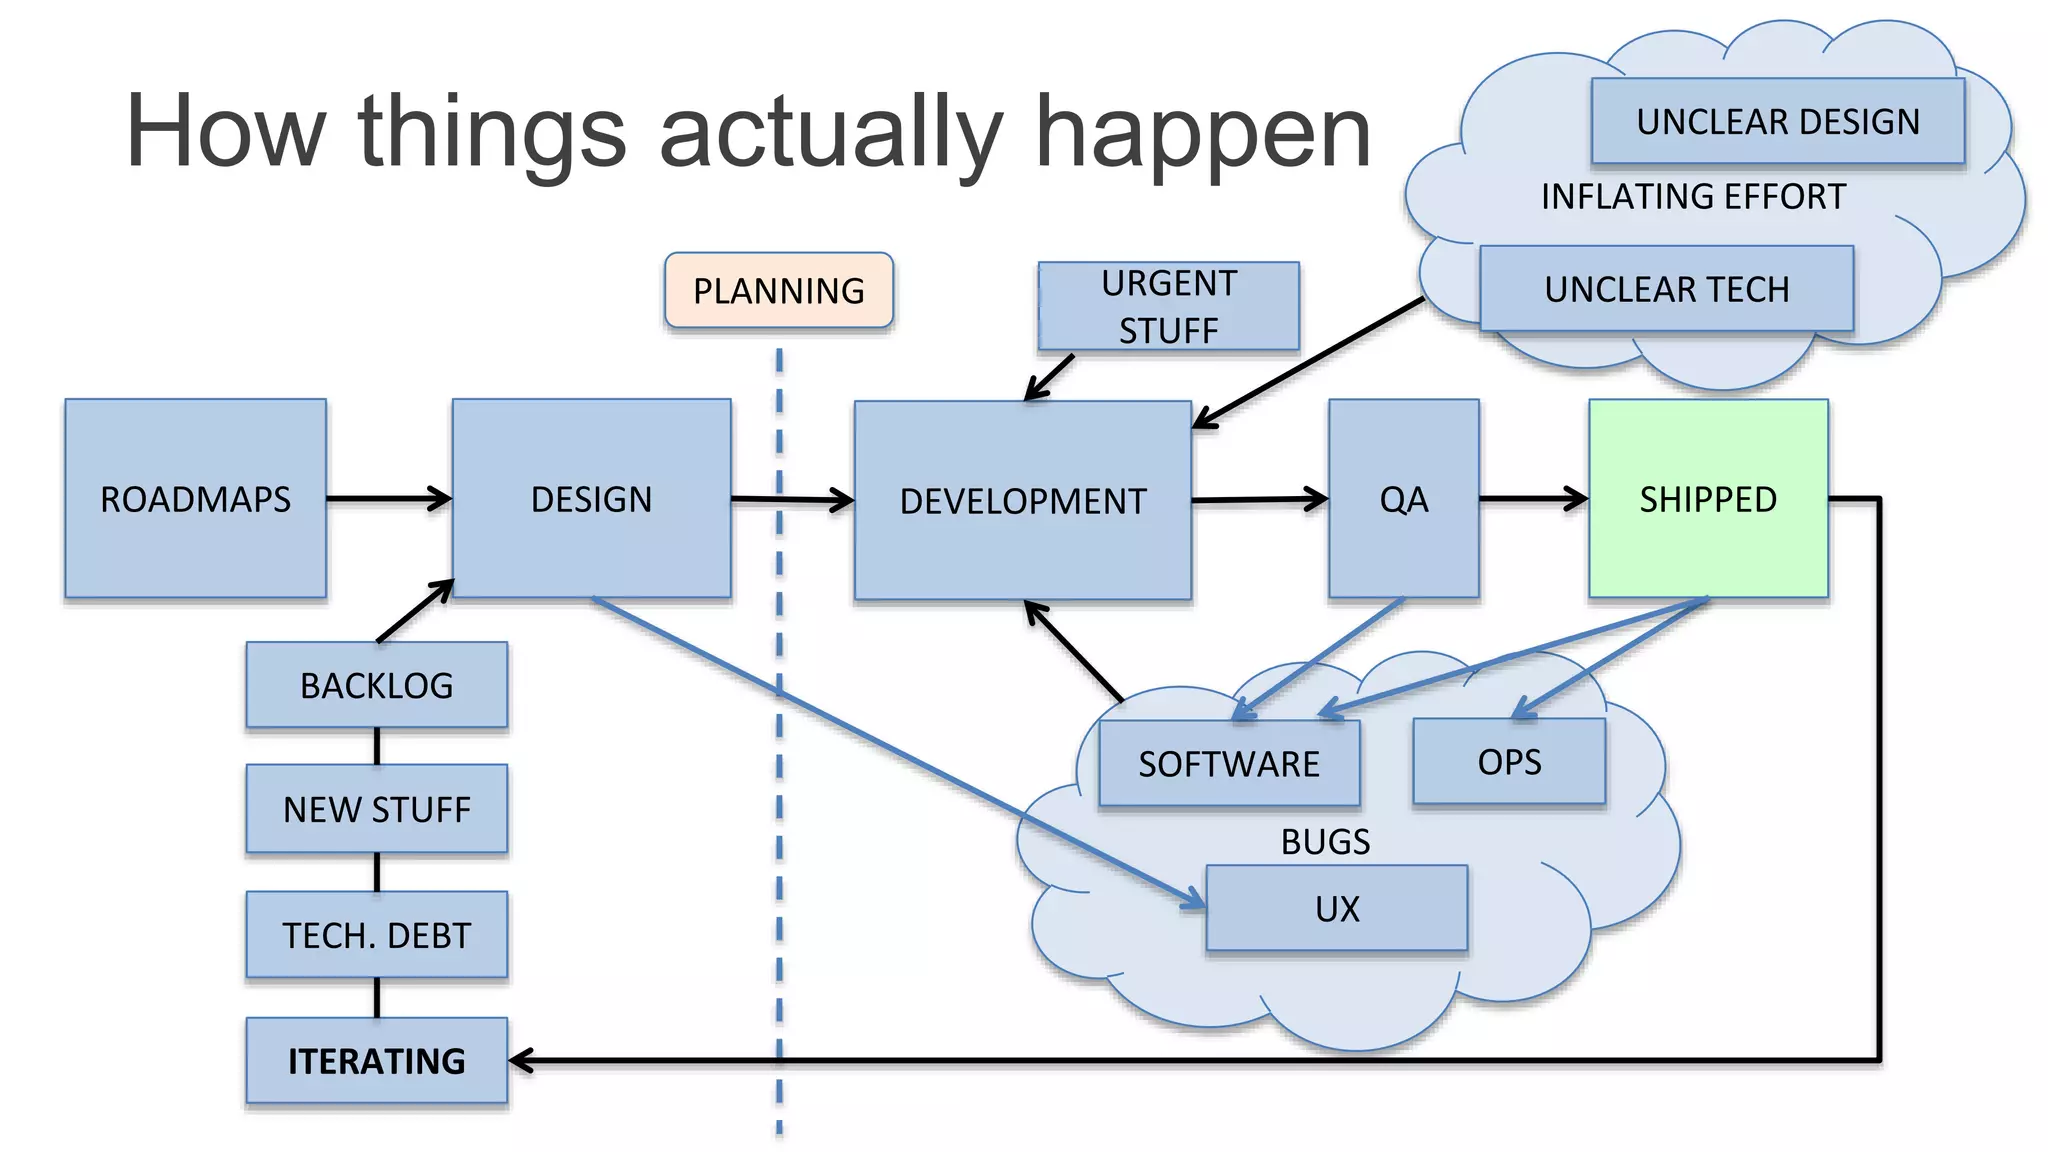
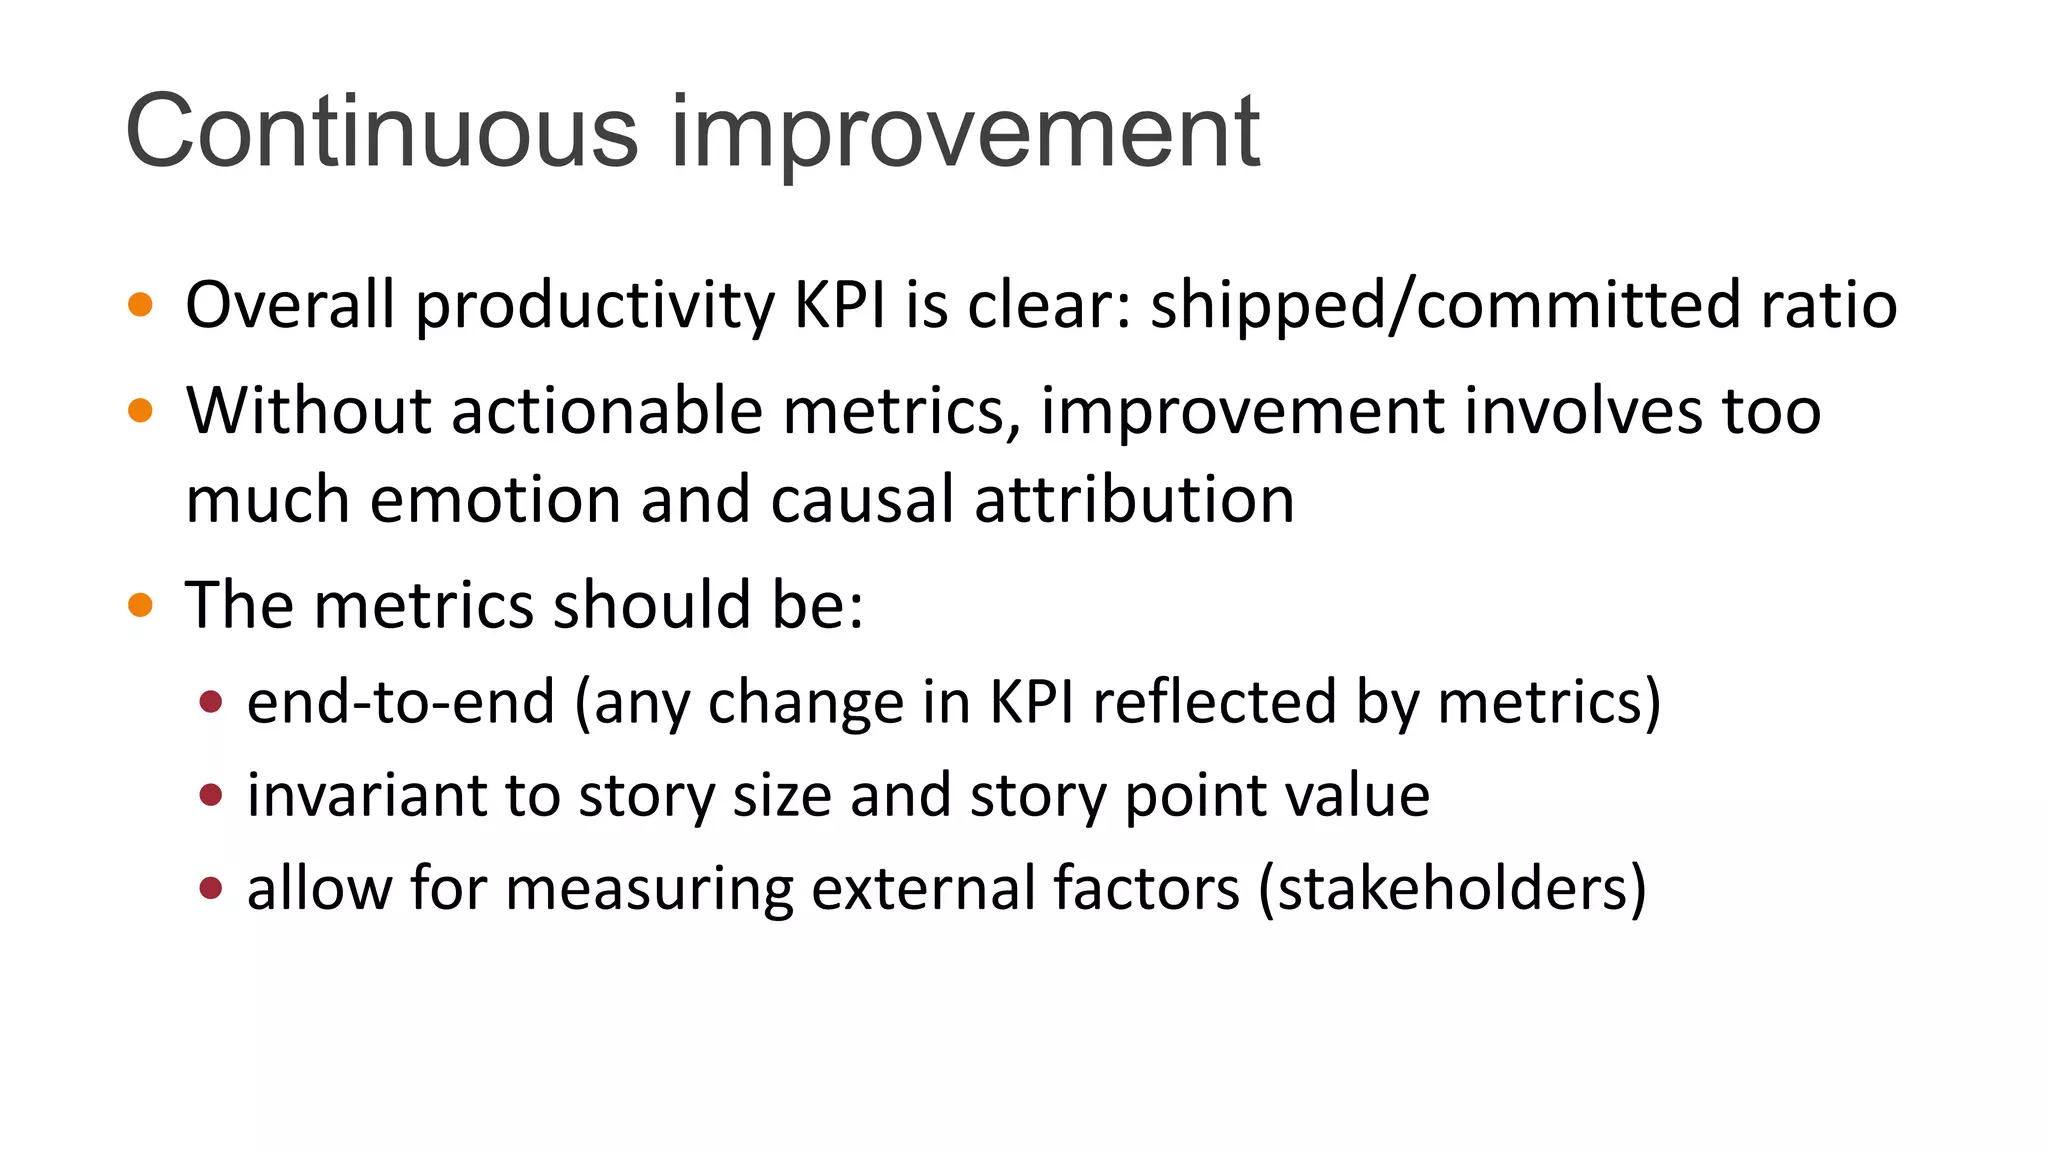
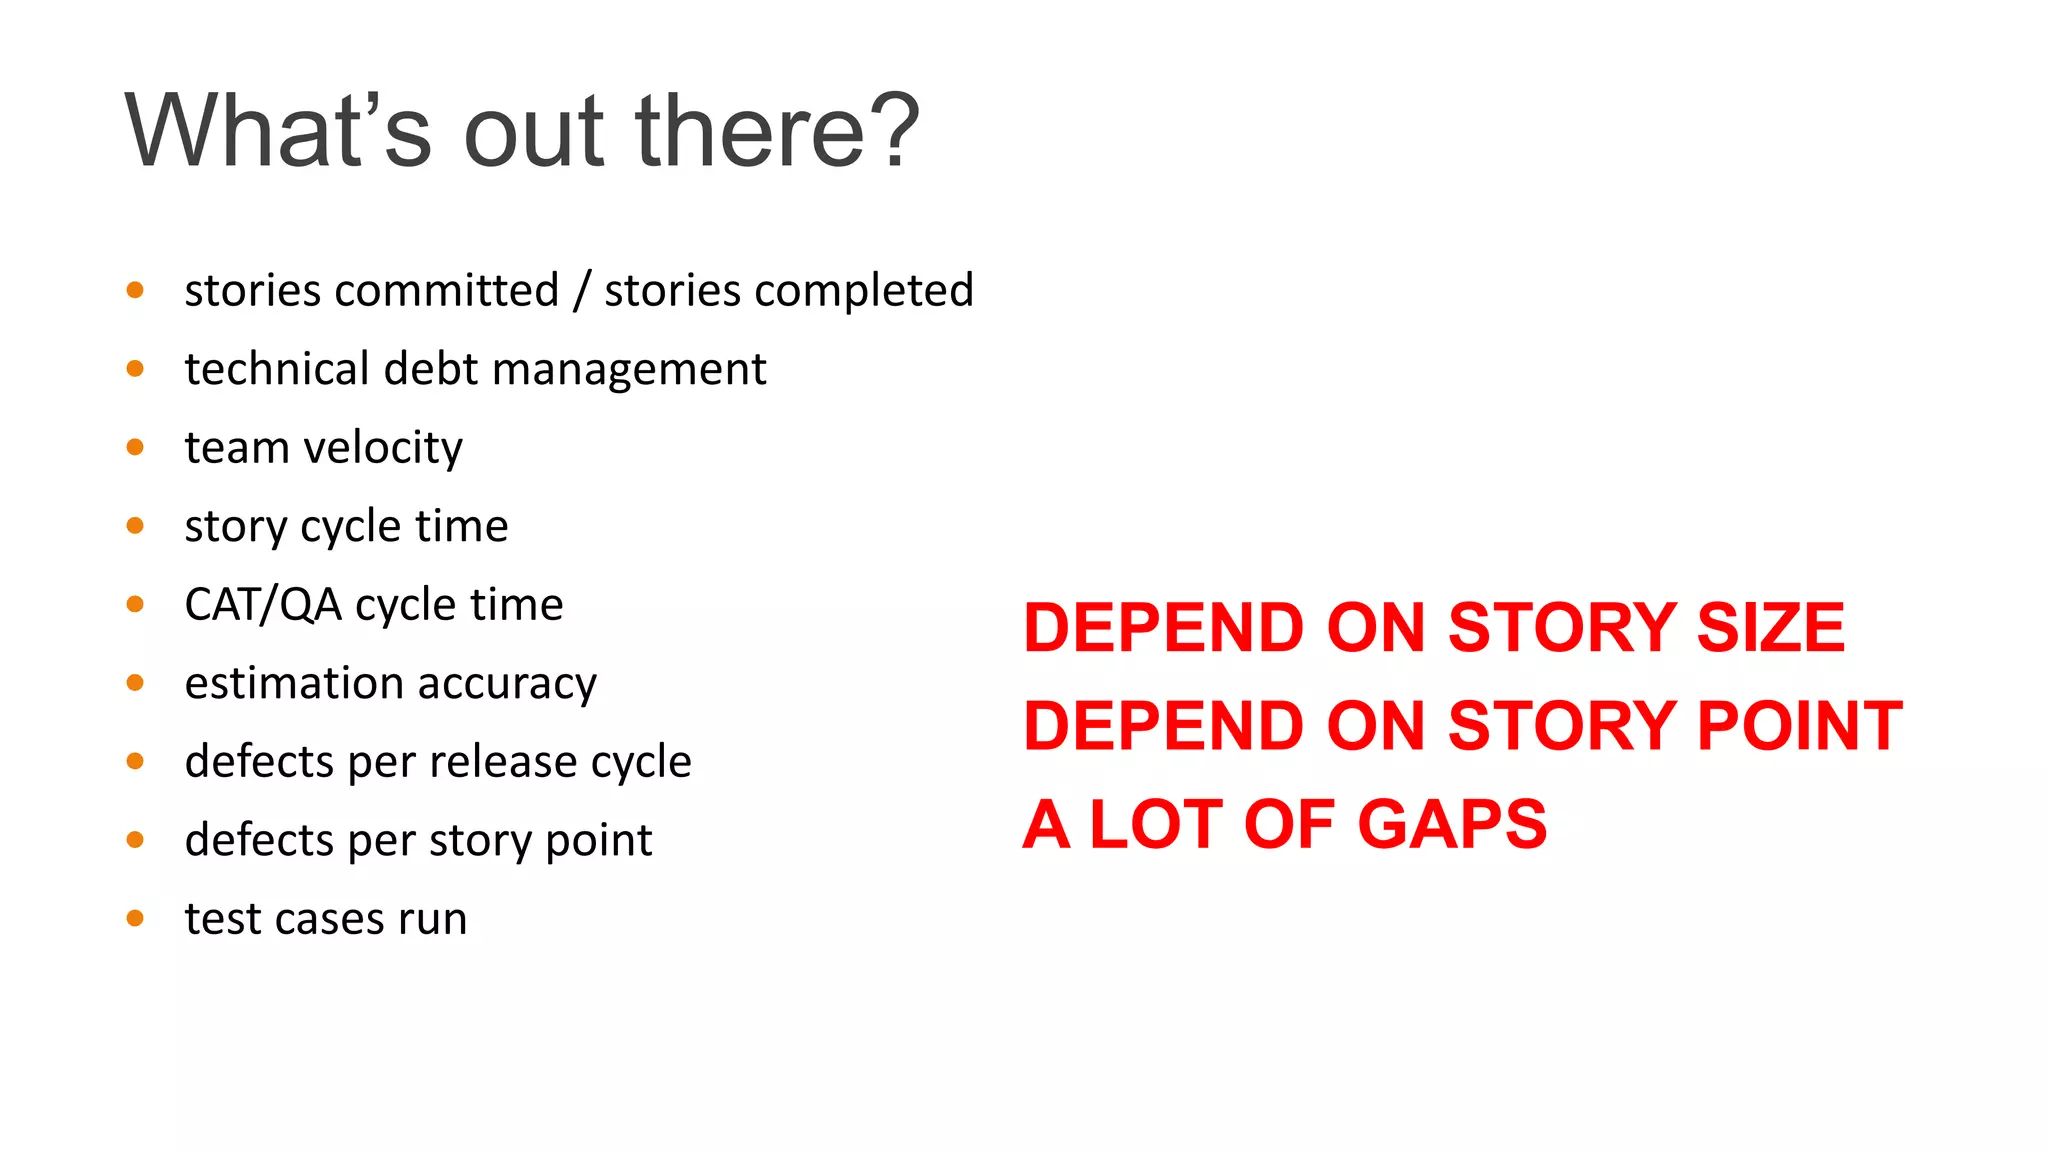
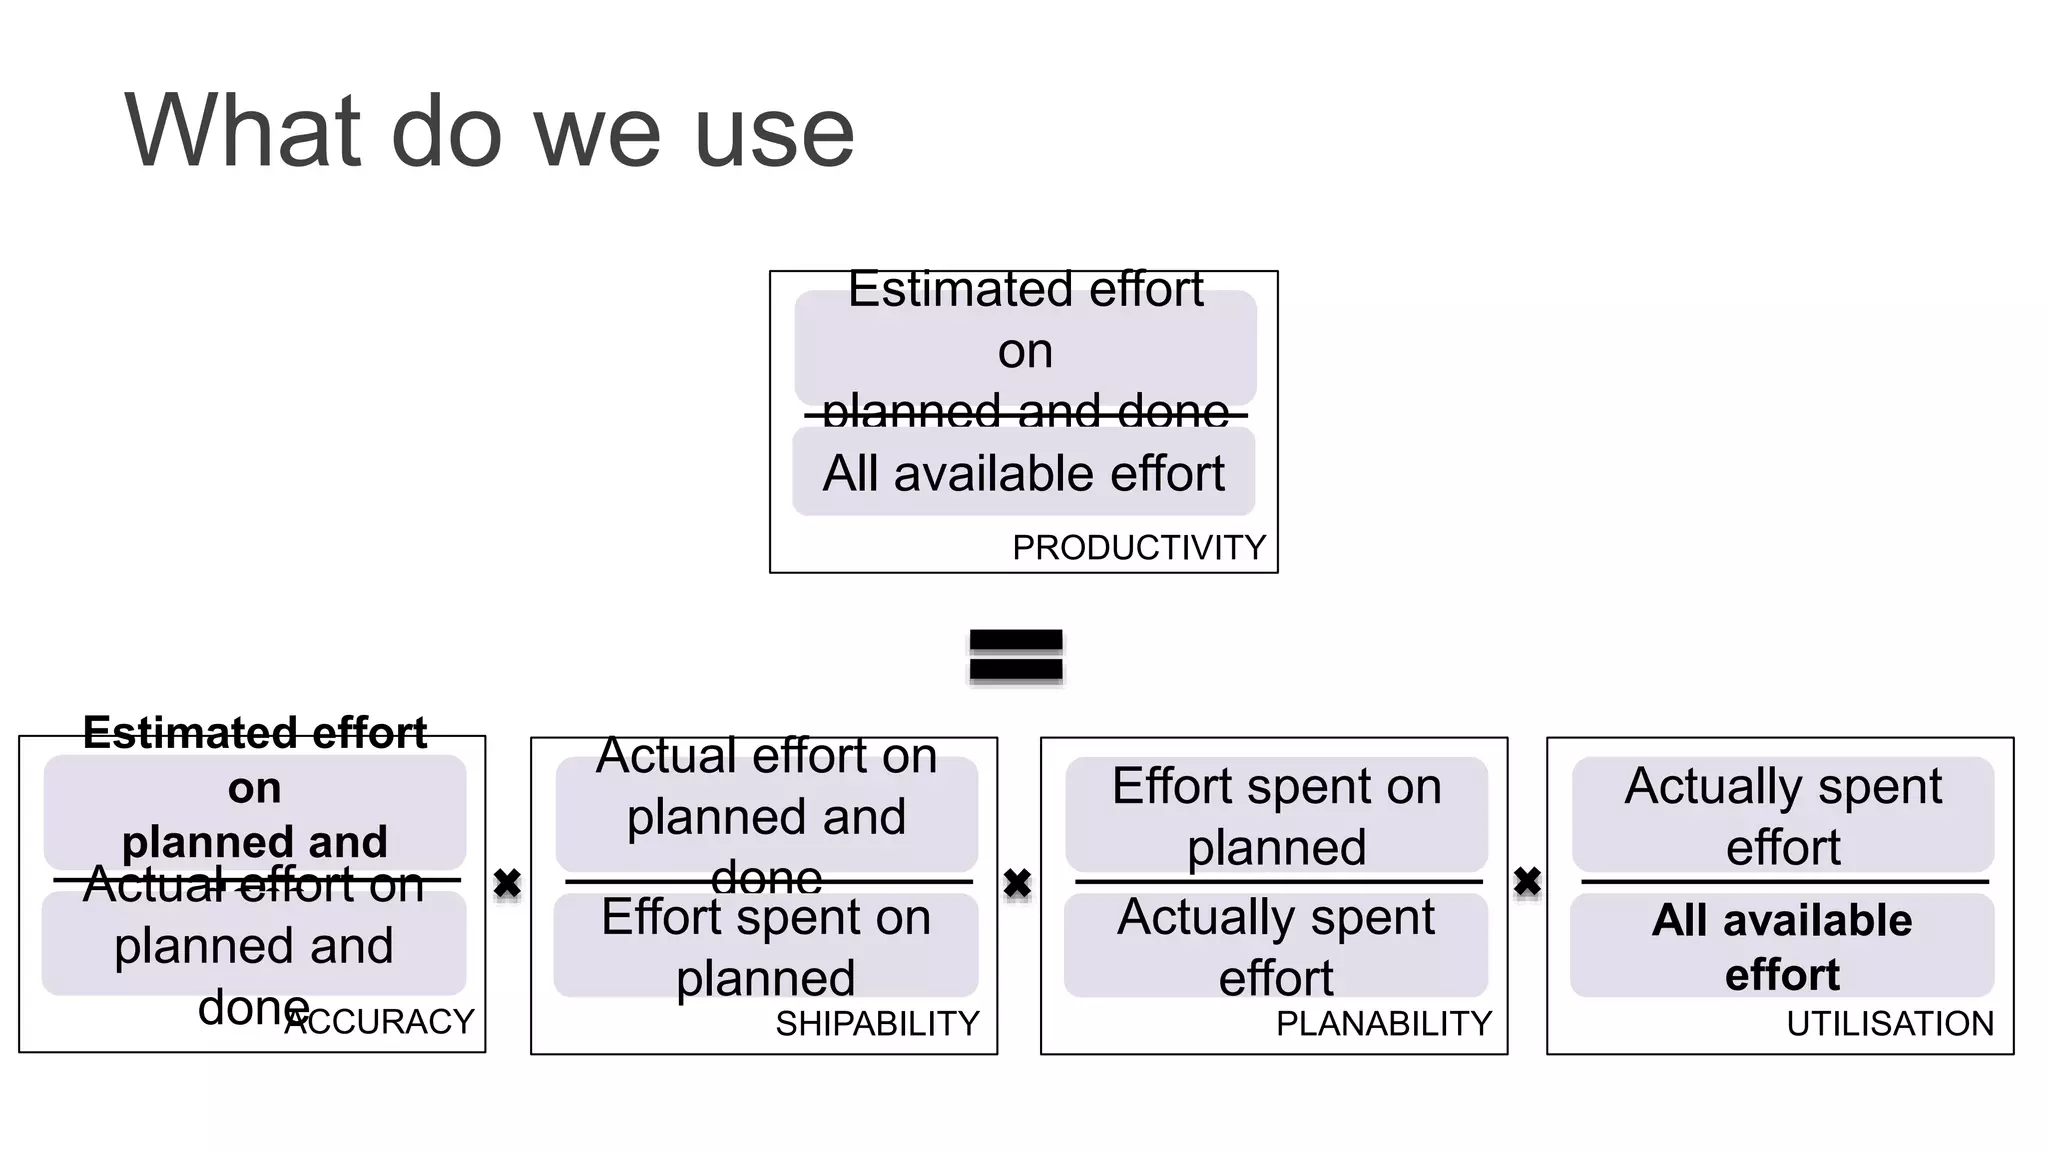
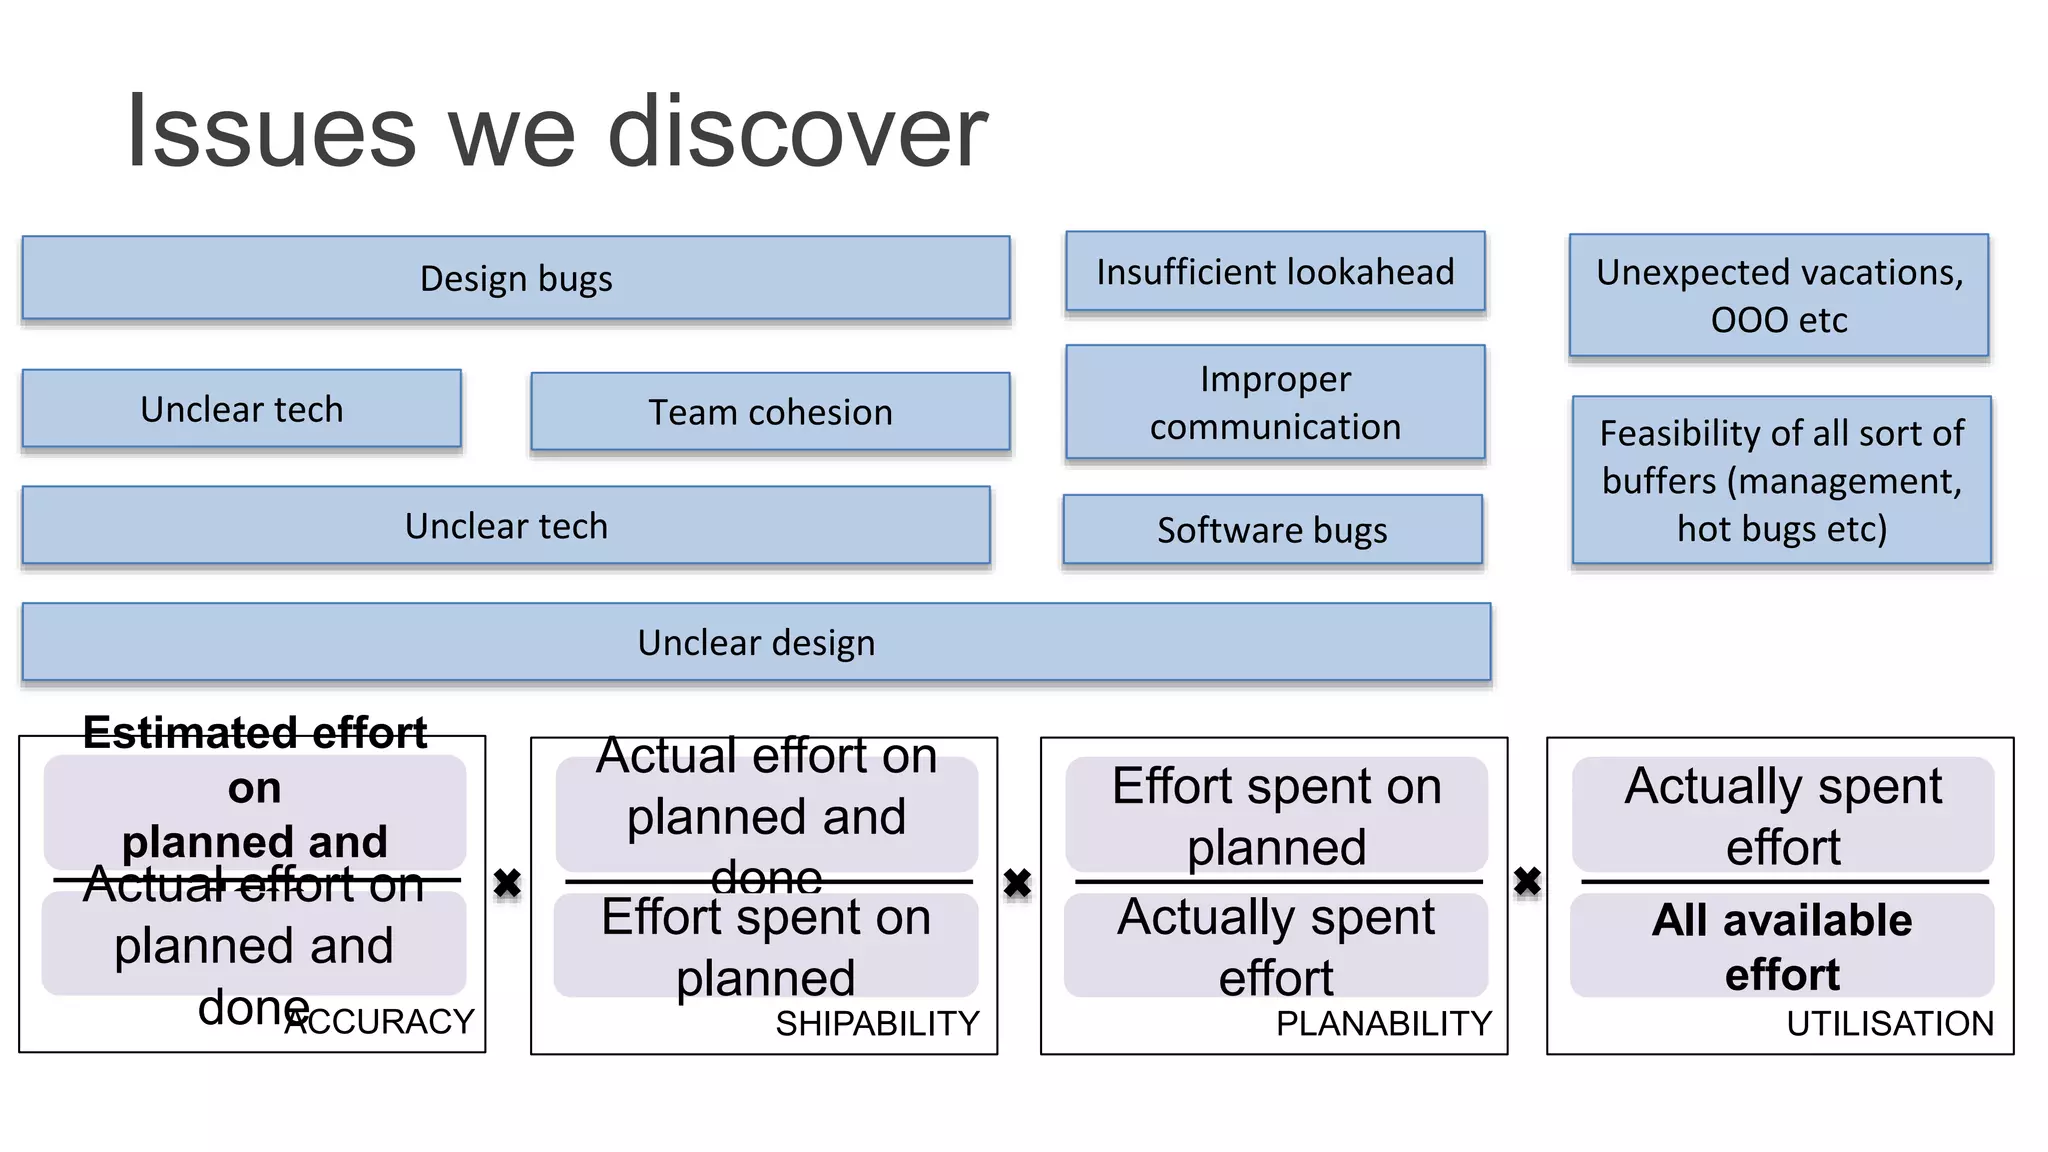
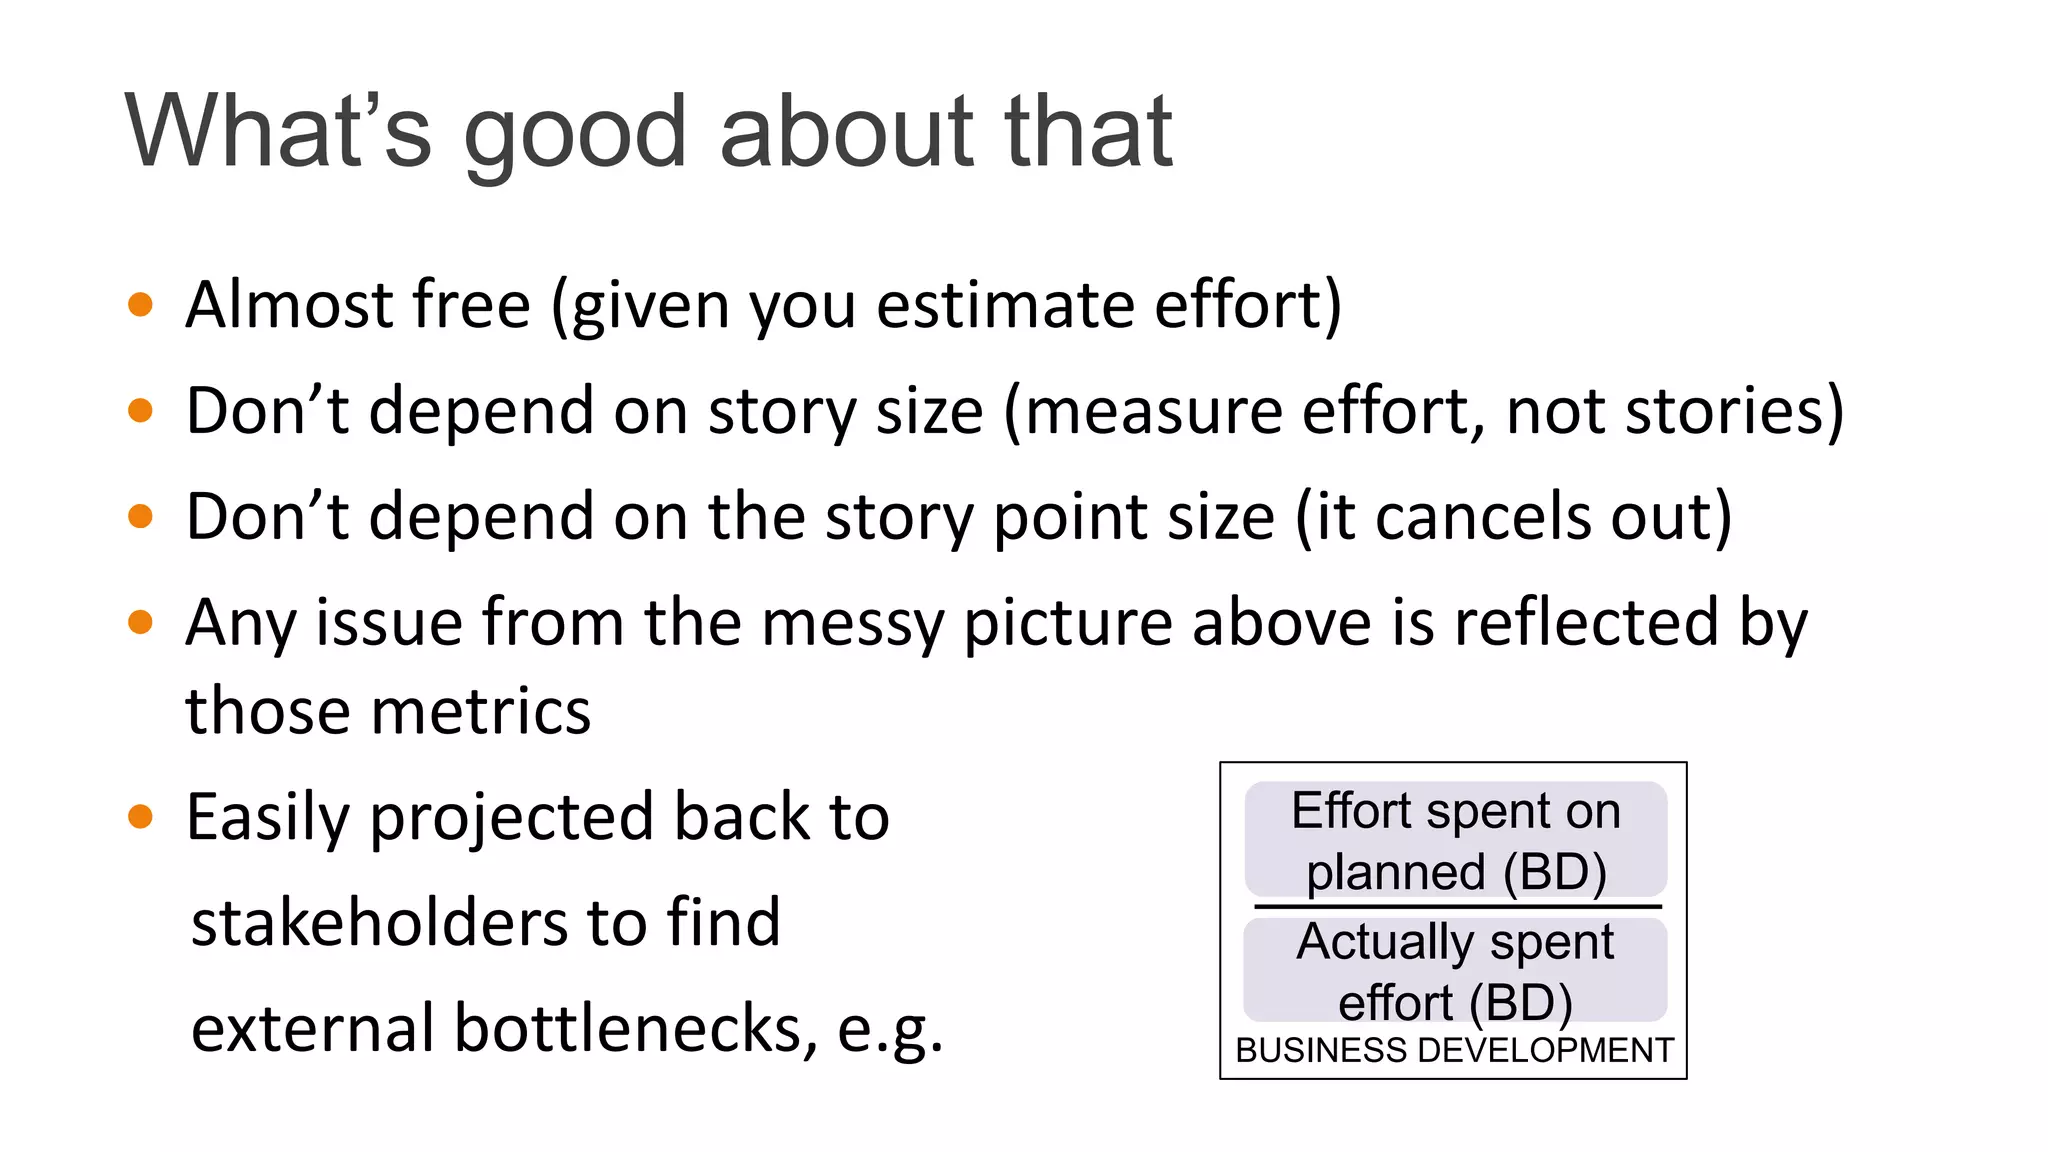
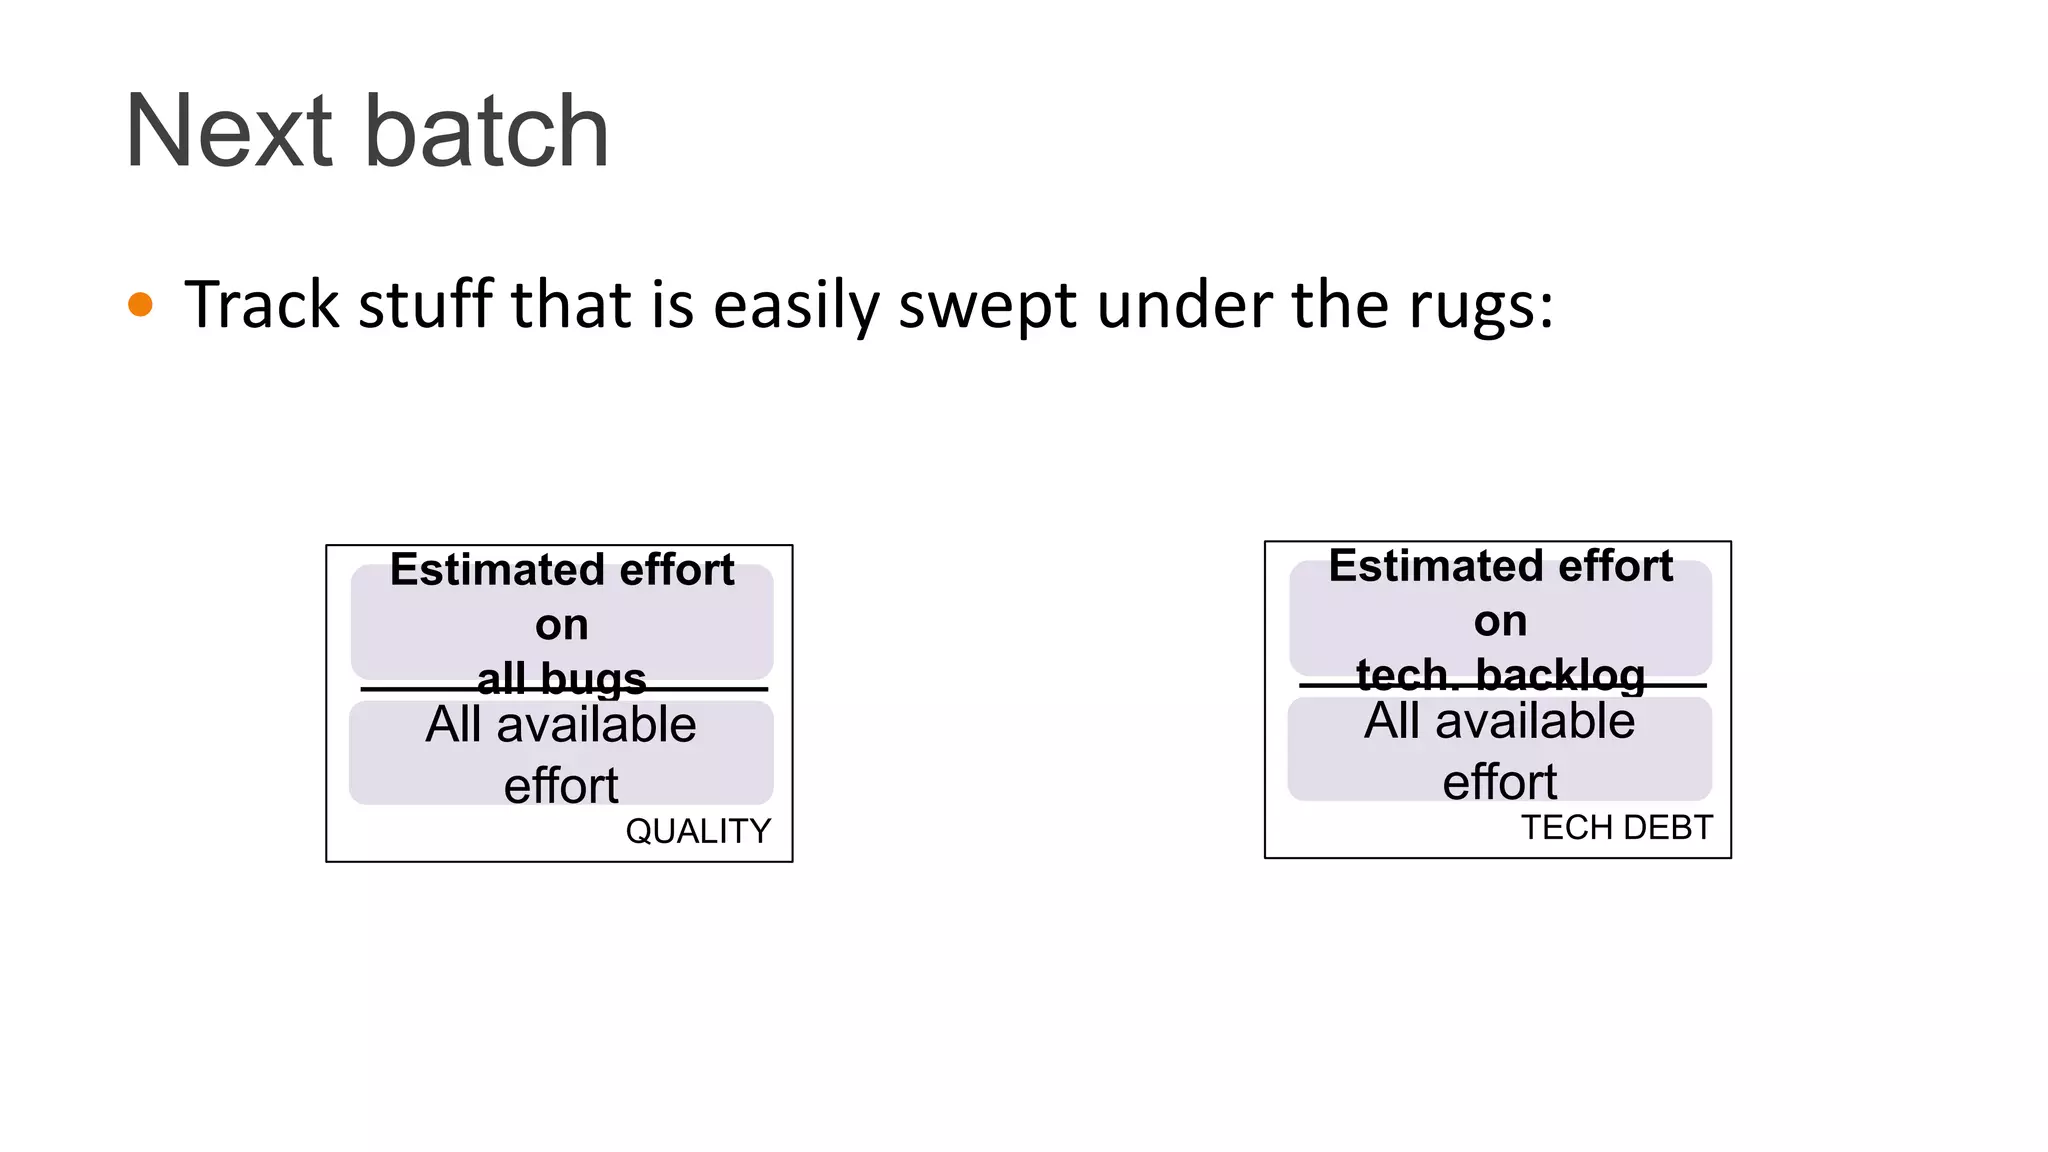
11th Central and Eastern European Software Engineering
Conference in Russia - CEE-SECR 2015
October 22 - 24, Moscow
Konstantin Savenkov
Measuring the agile process
improvement
Context
 There’s no universal solution, everything matters in its
context
 Bookmate is a B2C content service:
 lots of stakeholders
 lots of external parties
 lots of urgent stuff
 lots of experiments
 rapid team growth
 A way different from: MVP, B2B, outsourcing
The goals
Subscribers
New Recurring Reactivated
Traffic Conversion Retention Reactivation
Engi-
neer-
ing
Marketing Product Sales
Business
Development
Content &
Editorial
Stakeholders and engineering
Product
Marketing
BD & Sales
Content
Engineering
iOS Android Web
Backend
OpsContent Ingestion
Bookmate Publisher
Windows2-week
cycle
How things ideally would happen
ROADMAPS DESIGN DEVELOPMENT QA SHIPPED
PLANNING
How things actually happen INFLATING EFFORT
ROADMAPS DESIGN DEVELOPMENT QA SHIPPED
BACKLOG
NEW STUFF
TECH. DEBT
PLANNING
BUGS
UX
SOFTWARE OPS
URGENT
STUFF
UNCLEAR DESIGN
UNCLEAR TECH
ITERATING
Continuous improvement
 Overall productivity KPI is clear: shipped/committed ratio
 Without actionable metrics, improvement involves too
much emotion and causal attribution
 The metrics should be:
 end-to-end (any change in KPI reflected by metrics)
 invariant to story size and story point value
 allow for measuring external factors (stakeholders)
What’s out there?
 stories committed / stories completed
 technical debt management
 team velocity
 story cycle time
 CAT/QA cycle time
 estimation accuracy
 defects per release cycle
 defects per story point
 test cases run
DEPEND ON STORY SIZE
DEPEND ON STORY POINT
A LOT OF GAPS
What do we use
PRODUCTIVITY
Estimated effort
on
planned and done
All available effort
ACCURACY
Estimated effort
on
planned and
doneActual effort on
planned and
done SHIPABILITY
Actual effort on
planned and
done
Effort spent on
planned
PLANABILITY
Effort spent on
planned
Actually spent
effort
UTILISATION
Actually spent
effort
All available
effort
Issues we discover
ACCURACY
Estimated effort
on
planned and
doneActual effort on
planned and
done SHIPABILITY
Actual effort on
planned and
done
Effort spent on
planned
PLANABILITY
Effort spent on
planned
Actually spent
effort
UTILISATION
Actually spent
effort
All available
effort
Unexpected vacations,
OOO etc
Feasibility of all sort of
buffers (management,
hot bugs etc)
Insufficient lookahead
Improper
communication
Unclear design
Unclear tech Software bugs
Team cohesionUnclear tech
Design bugs
What’s good about that
 Almost free (given you estimate effort)
 Don’t depend on story size (measure effort, not stories)
 Don’t depend on the story point size (it cancels out)
 Any issue from the messy picture above is reflected by
those metrics
 Easily projected back to
stakeholders to find
external bottlenecks, e.g. BUSINESS DEVELOPMENT
Effort spent on
planned (BD)
Actually spent
effort (BD)
 Track stuff that is easily swept under the rugs:
Next batch
QUALITY
Estimated effort
on
all bugs
All available
effort
TECH DEBT
Estimated effort
on
tech. backlog
All available
effort
Be sane about that
 It doesn’t remove bottlenecks and issues
 It just shows them
 Sometimes it’s enough to solve the issue
 Most of the times it isn’t
Measuring the agile process improvement

Measuring the agile process improvement

  • 1.
    11th Central andEastern European Software Engineering Conference in Russia - CEE-SECR 2015 October 22 - 24, Moscow Konstantin Savenkov Measuring the agile process improvement
  • 3.
    Context  There’s nouniversal solution, everything matters in its context  Bookmate is a B2C content service:  lots of stakeholders  lots of external parties  lots of urgent stuff  lots of experiments  rapid team growth  A way different from: MVP, B2B, outsourcing
  • 4.
    The goals Subscribers New RecurringReactivated Traffic Conversion Retention Reactivation Engi- neer- ing Marketing Product Sales Business Development Content & Editorial
  • 5.
    Stakeholders and engineering Product Marketing BD& Sales Content Engineering iOS Android Web Backend OpsContent Ingestion Bookmate Publisher Windows2-week cycle
  • 6.
    How things ideallywould happen ROADMAPS DESIGN DEVELOPMENT QA SHIPPED PLANNING
  • 7.
    How things actuallyhappen INFLATING EFFORT ROADMAPS DESIGN DEVELOPMENT QA SHIPPED BACKLOG NEW STUFF TECH. DEBT PLANNING BUGS UX SOFTWARE OPS URGENT STUFF UNCLEAR DESIGN UNCLEAR TECH ITERATING
  • 8.
    Continuous improvement  Overallproductivity KPI is clear: shipped/committed ratio  Without actionable metrics, improvement involves too much emotion and causal attribution  The metrics should be:  end-to-end (any change in KPI reflected by metrics)  invariant to story size and story point value  allow for measuring external factors (stakeholders)
  • 9.
    What’s out there? stories committed / stories completed  technical debt management  team velocity  story cycle time  CAT/QA cycle time  estimation accuracy  defects per release cycle  defects per story point  test cases run DEPEND ON STORY SIZE DEPEND ON STORY POINT A LOT OF GAPS
  • 10.
    What do weuse PRODUCTIVITY Estimated effort on planned and done All available effort ACCURACY Estimated effort on planned and doneActual effort on planned and done SHIPABILITY Actual effort on planned and done Effort spent on planned PLANABILITY Effort spent on planned Actually spent effort UTILISATION Actually spent effort All available effort
  • 11.
    Issues we discover ACCURACY Estimatedeffort on planned and doneActual effort on planned and done SHIPABILITY Actual effort on planned and done Effort spent on planned PLANABILITY Effort spent on planned Actually spent effort UTILISATION Actually spent effort All available effort Unexpected vacations, OOO etc Feasibility of all sort of buffers (management, hot bugs etc) Insufficient lookahead Improper communication Unclear design Unclear tech Software bugs Team cohesionUnclear tech Design bugs
  • 12.
    What’s good aboutthat  Almost free (given you estimate effort)  Don’t depend on story size (measure effort, not stories)  Don’t depend on the story point size (it cancels out)  Any issue from the messy picture above is reflected by those metrics  Easily projected back to stakeholders to find external bottlenecks, e.g. BUSINESS DEVELOPMENT Effort spent on planned (BD) Actually spent effort (BD)
  • 13.
     Track stuffthat is easily swept under the rugs: Next batch QUALITY Estimated effort on all bugs All available effort TECH DEBT Estimated effort on tech. backlog All available effort
  • 14.
    Be sane aboutthat  It doesn’t remove bottlenecks and issues  It just shows them  Sometimes it’s enough to solve the issue  Most of the times it isn’t