Download to read offline

![References
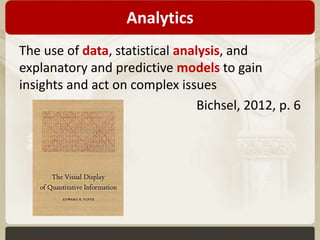
• Bichsel, J., 2012. Analytics in higher education:
Benefits, barriers, progress, and
recommendations. Louisville, CO: EDUCAUSE
Center for Applied Research. Available from:
http://net.educause.edu/ir/library/pdf/ERS12
07/ers1207.pdf [Accessed 21 February 2014].](https://image.slidesharecdn.com/analyticspres-141023090743-conversion-gate02/85/Measuring-Digital-Professional-Development-38-320.jpg)

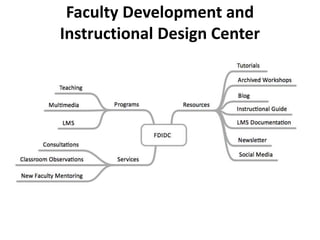
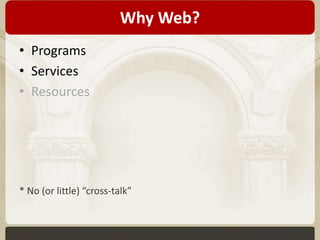
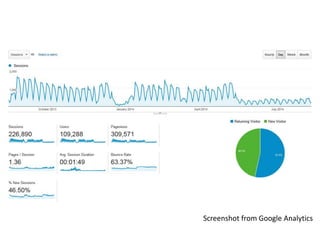
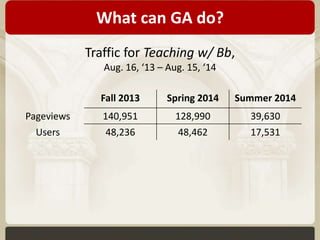
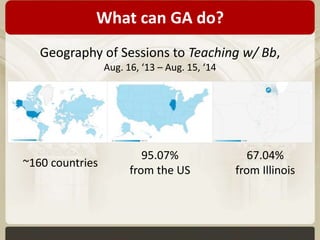
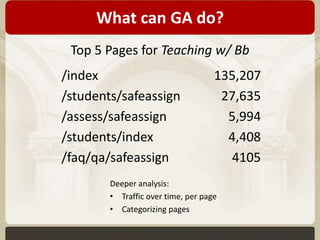
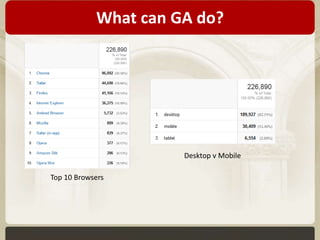
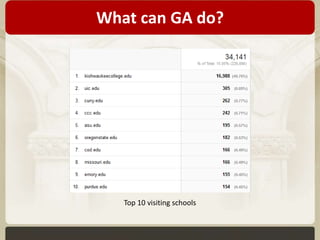
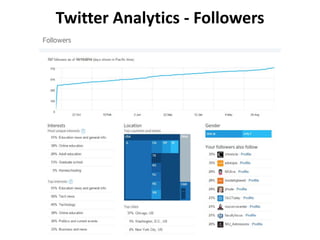
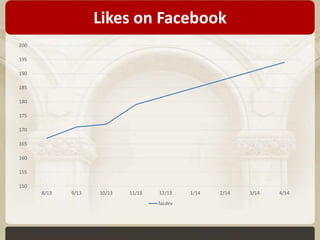
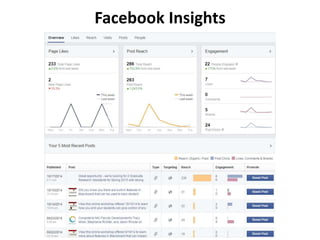
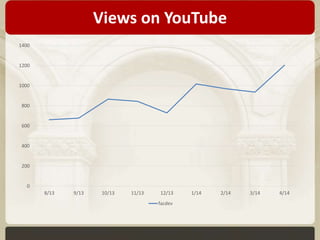
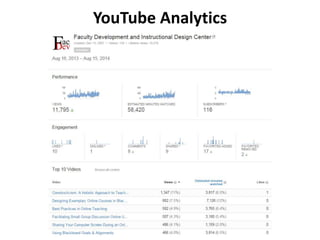
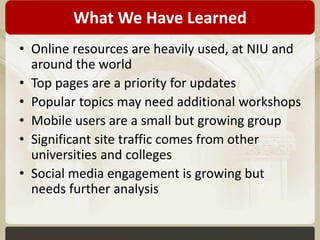
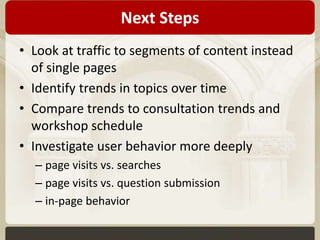
The document discusses the importance of measuring web and social media analytics for faculty development at Northern Illinois University, highlighting various metrics and tools such as Google Analytics. It presents usage data for online resources, social media engagement, and identifies trends that can inform future development efforts and workshops. Key conclusions include high traffic to online resources, the necessity for updates on popular topics, and a growing engagement on social media that requires further analysis.


