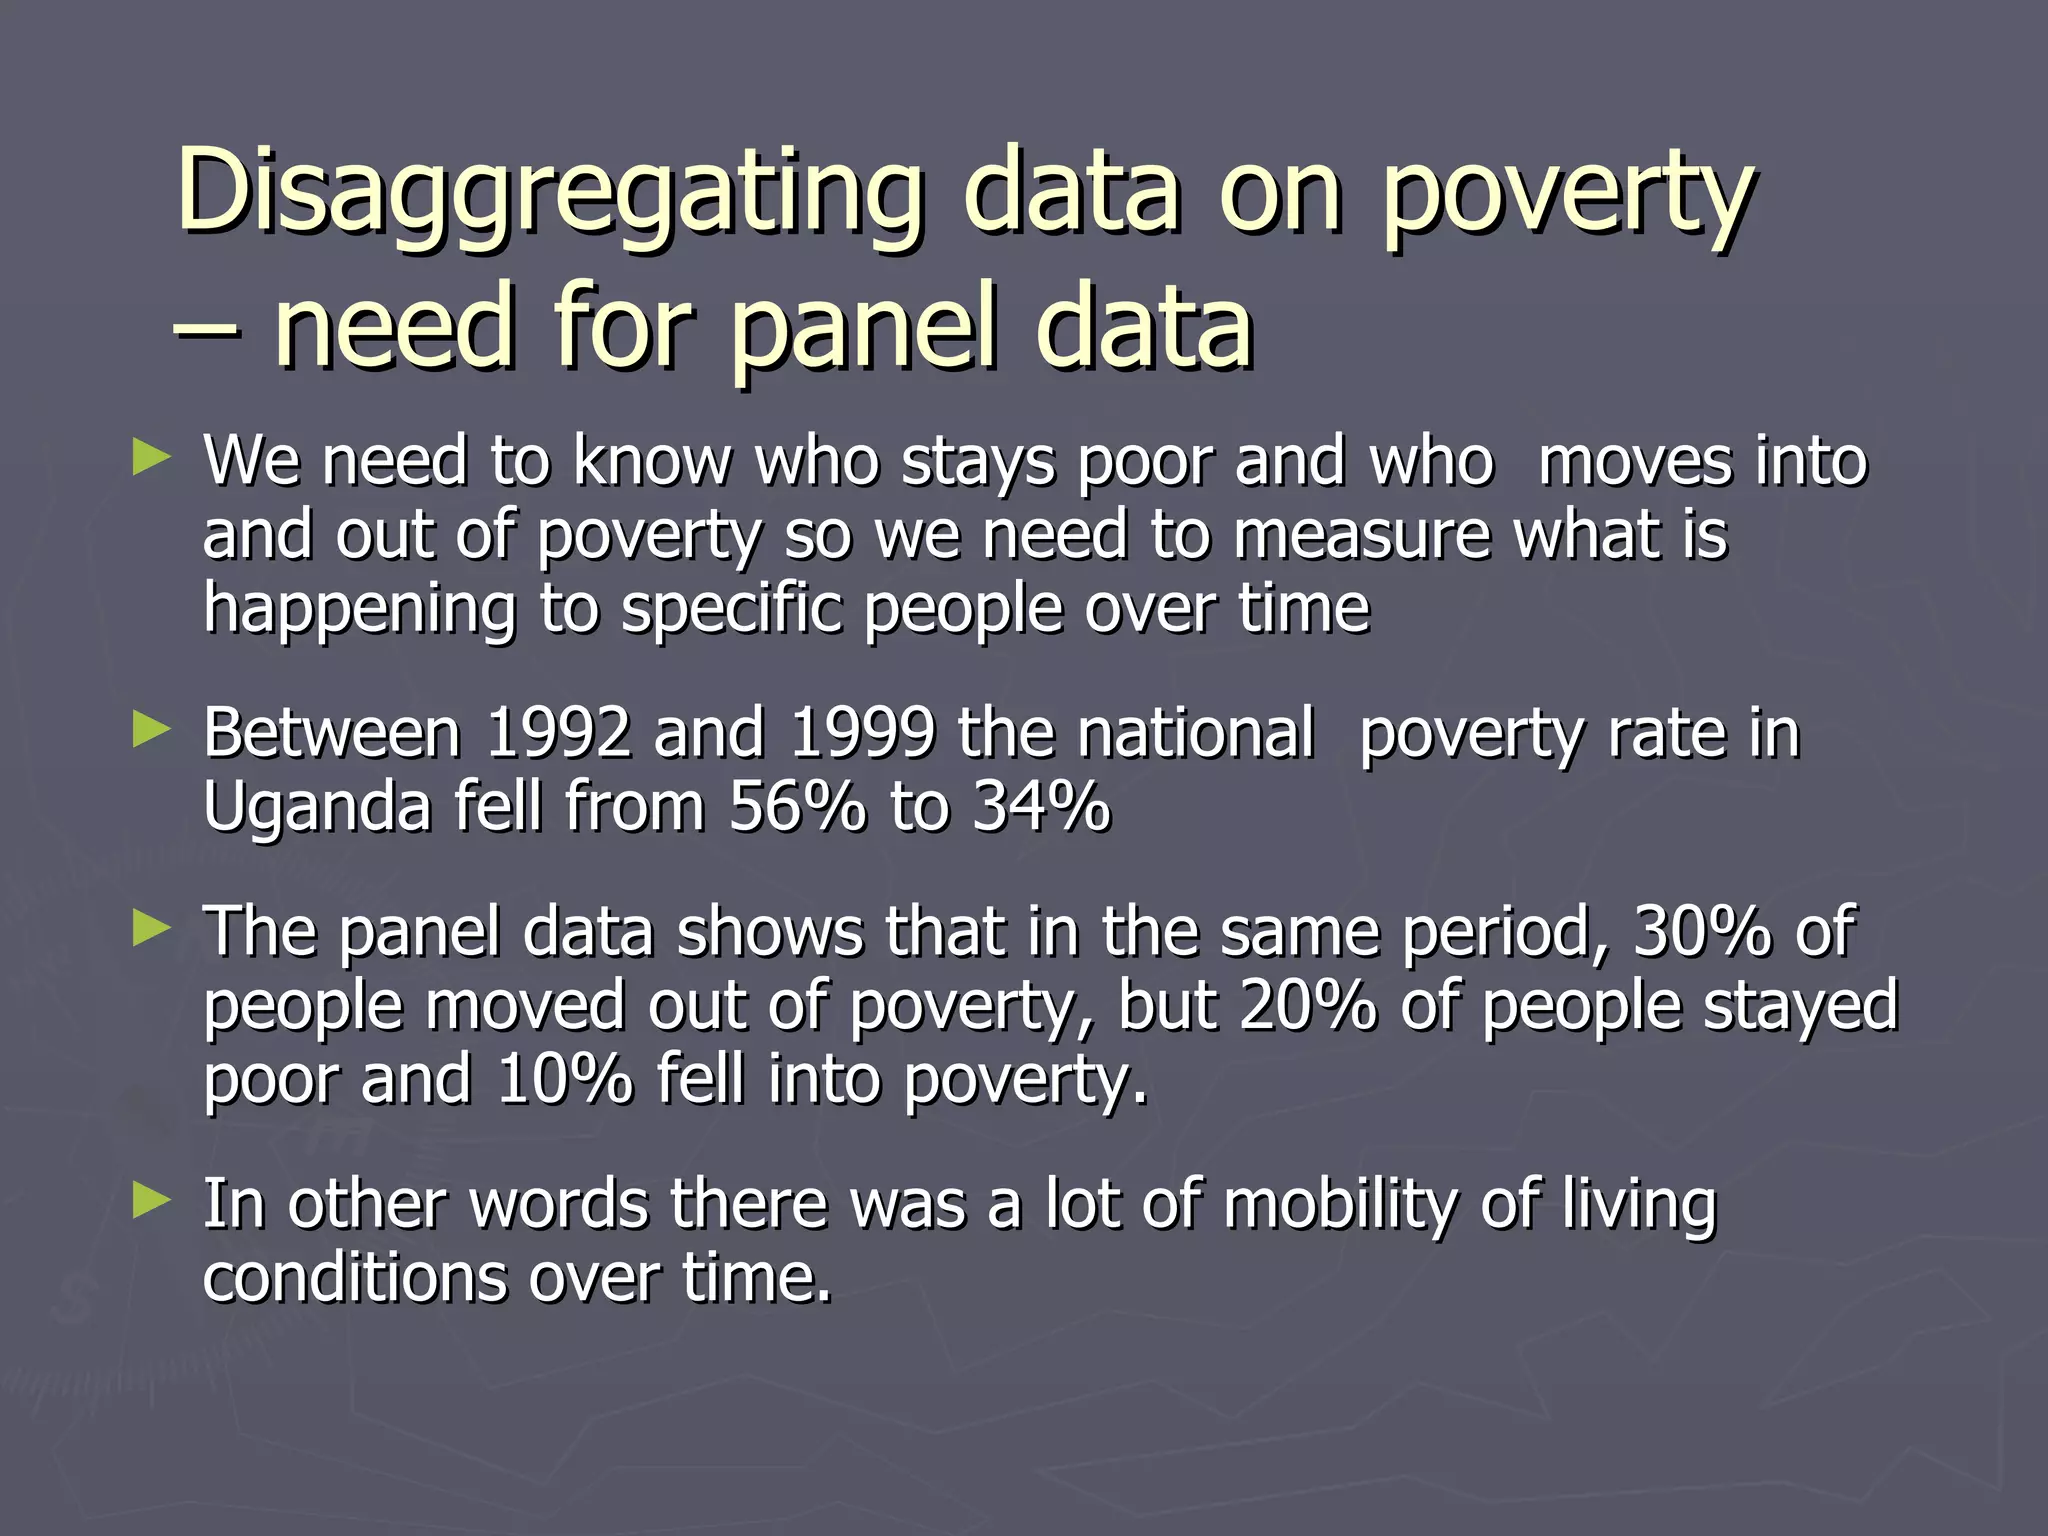
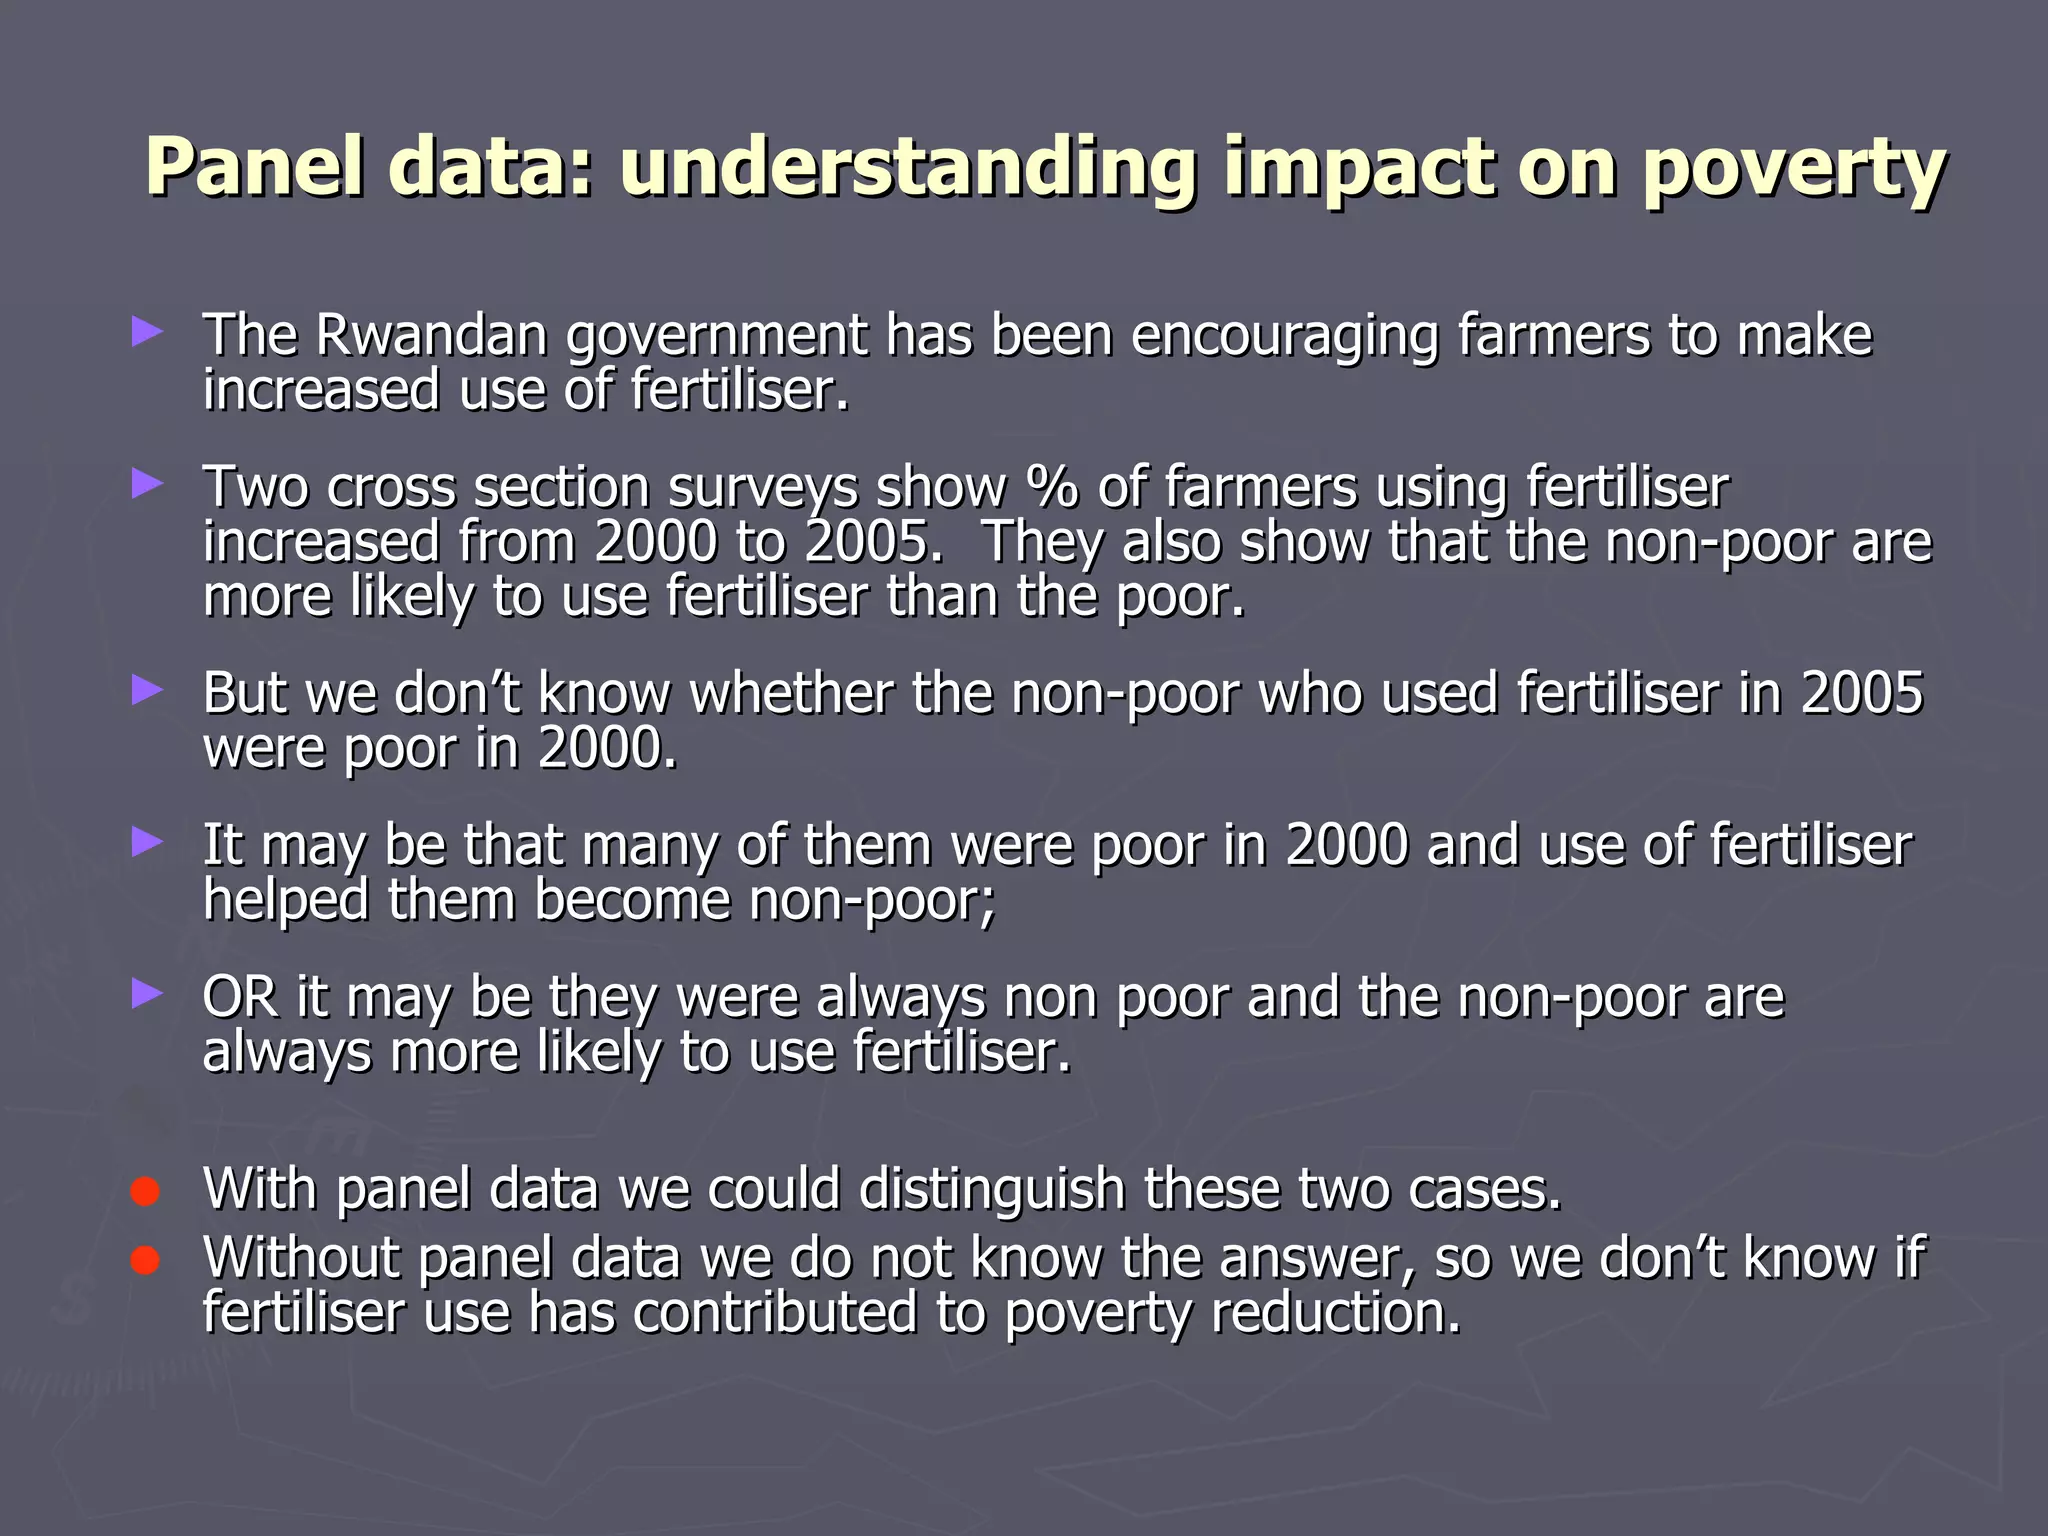
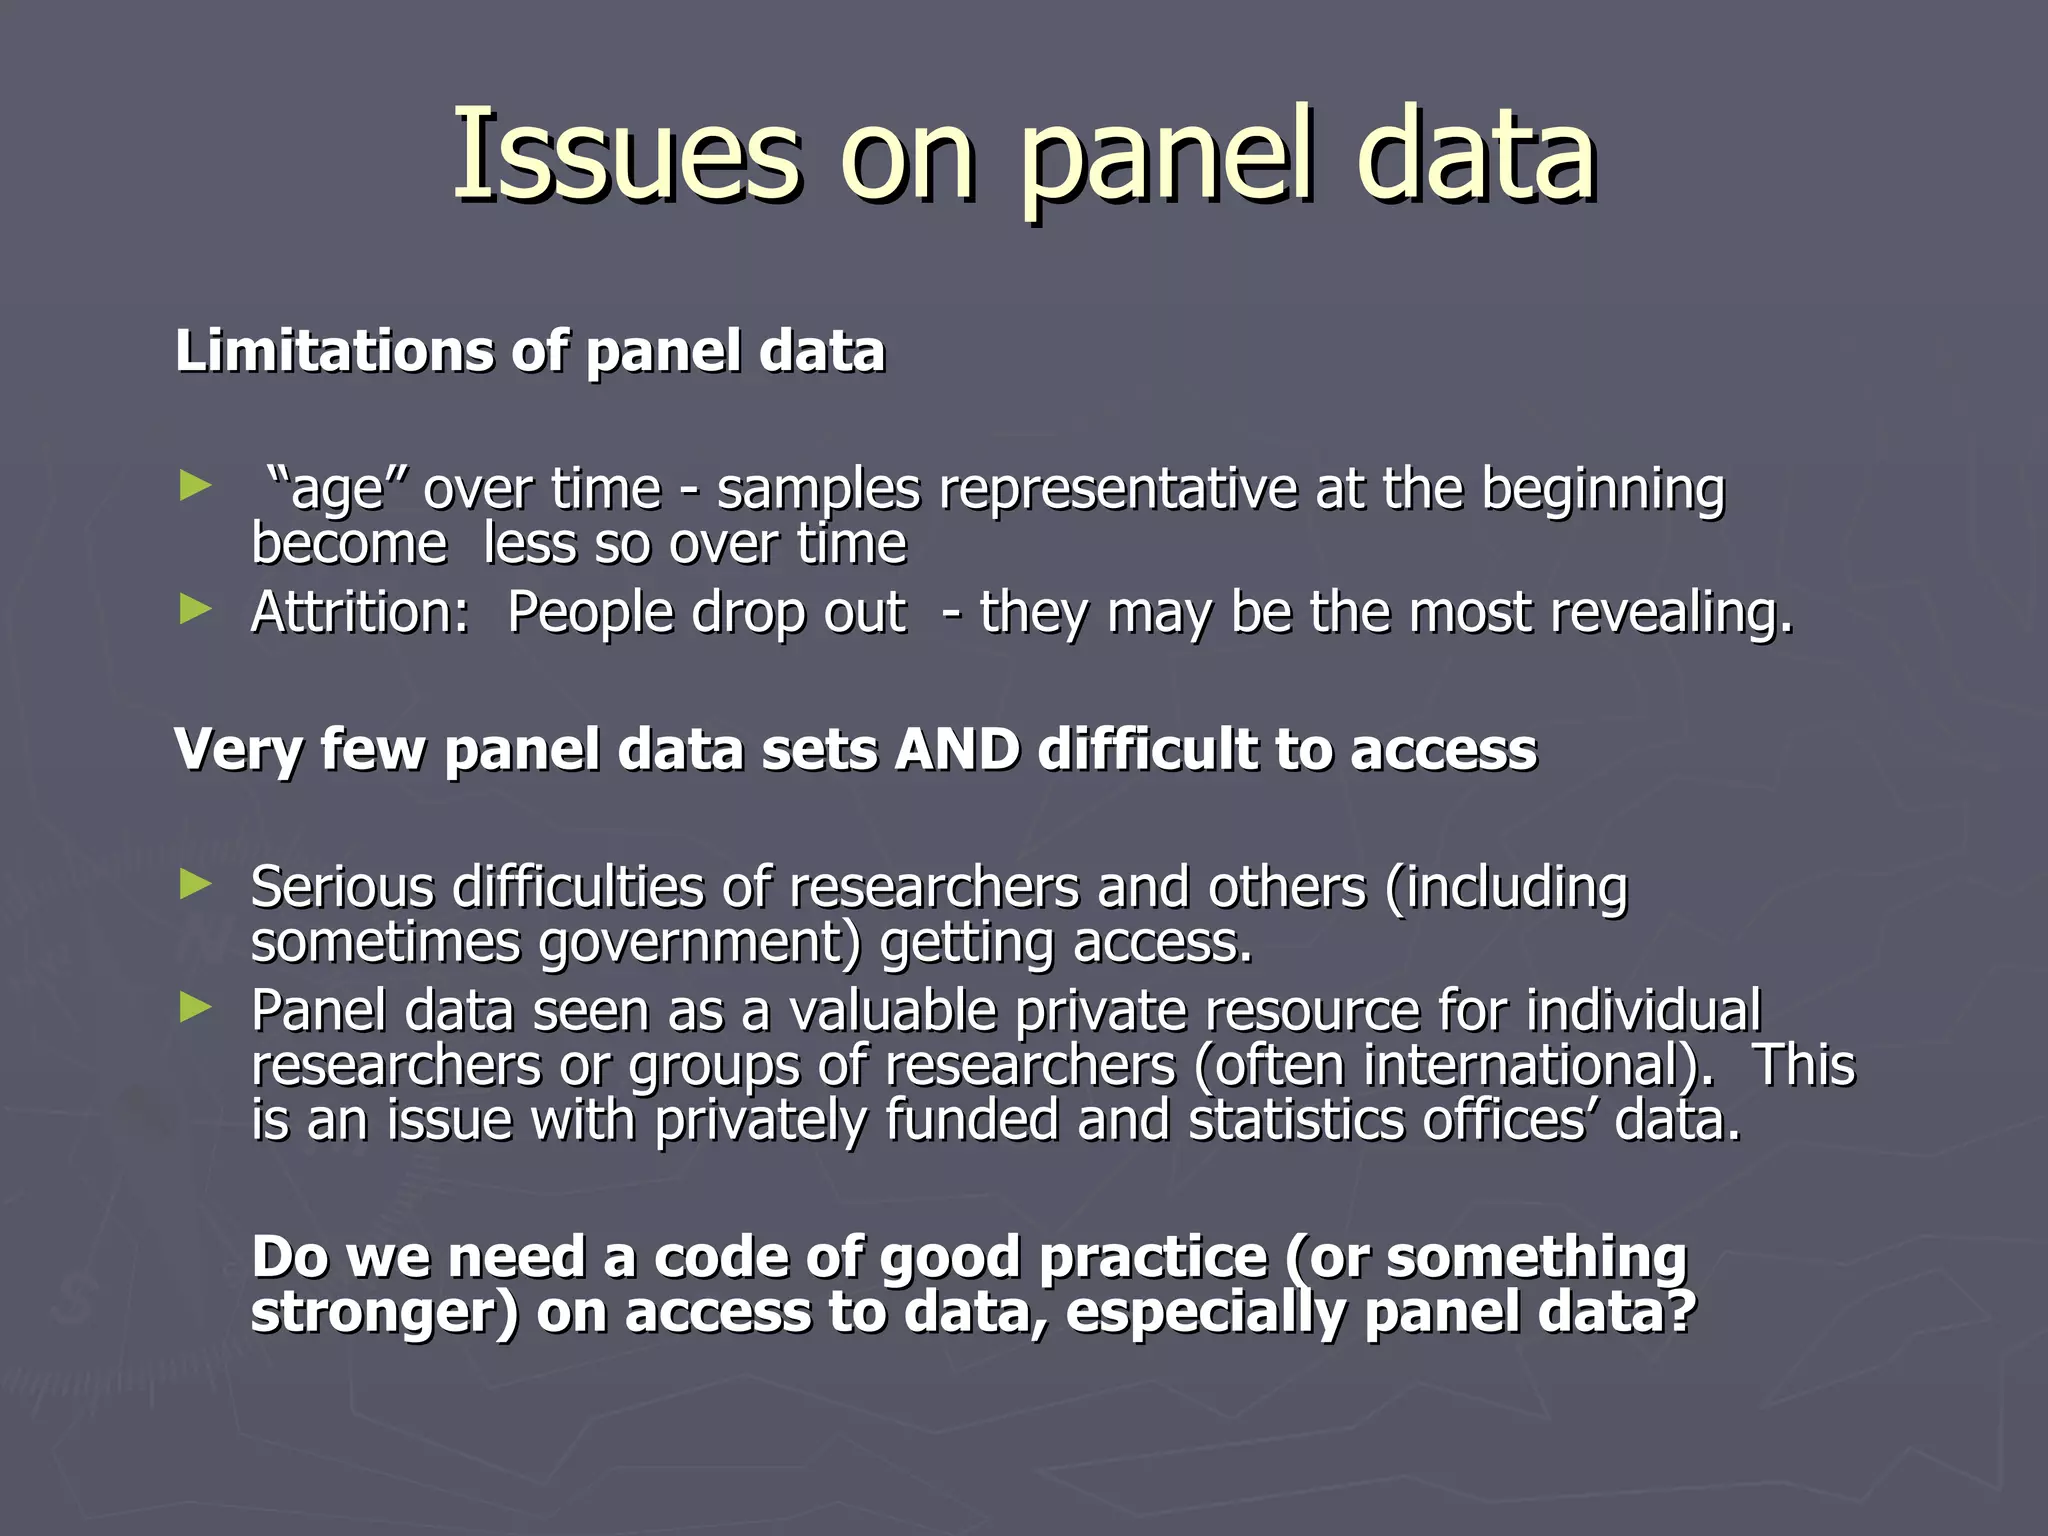
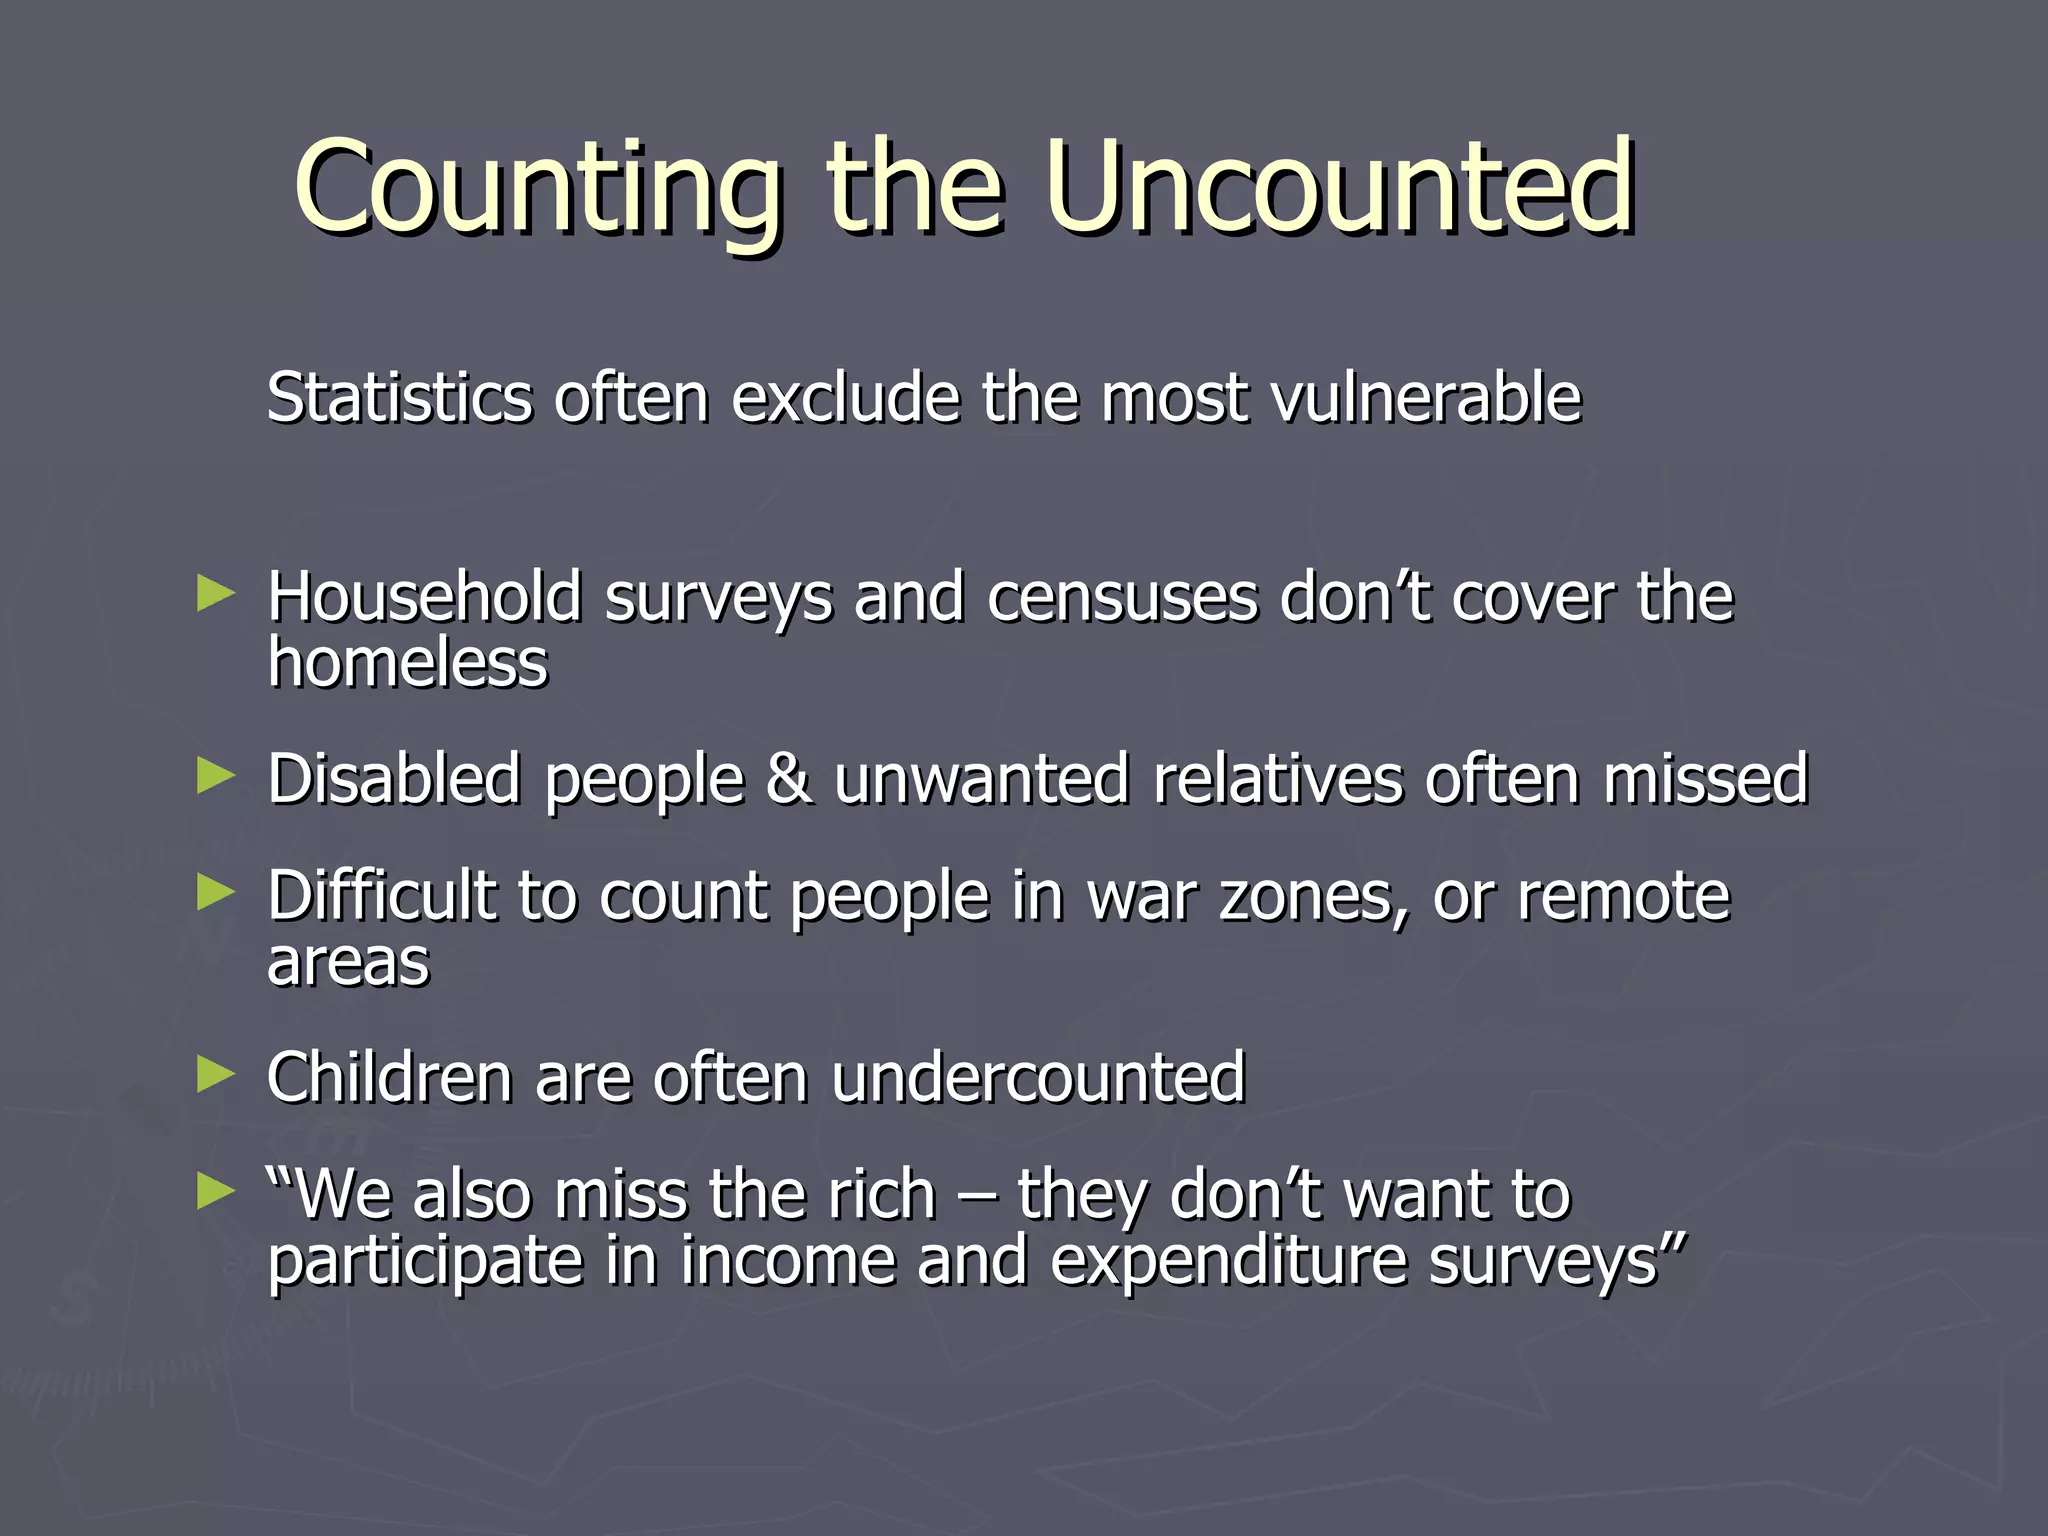
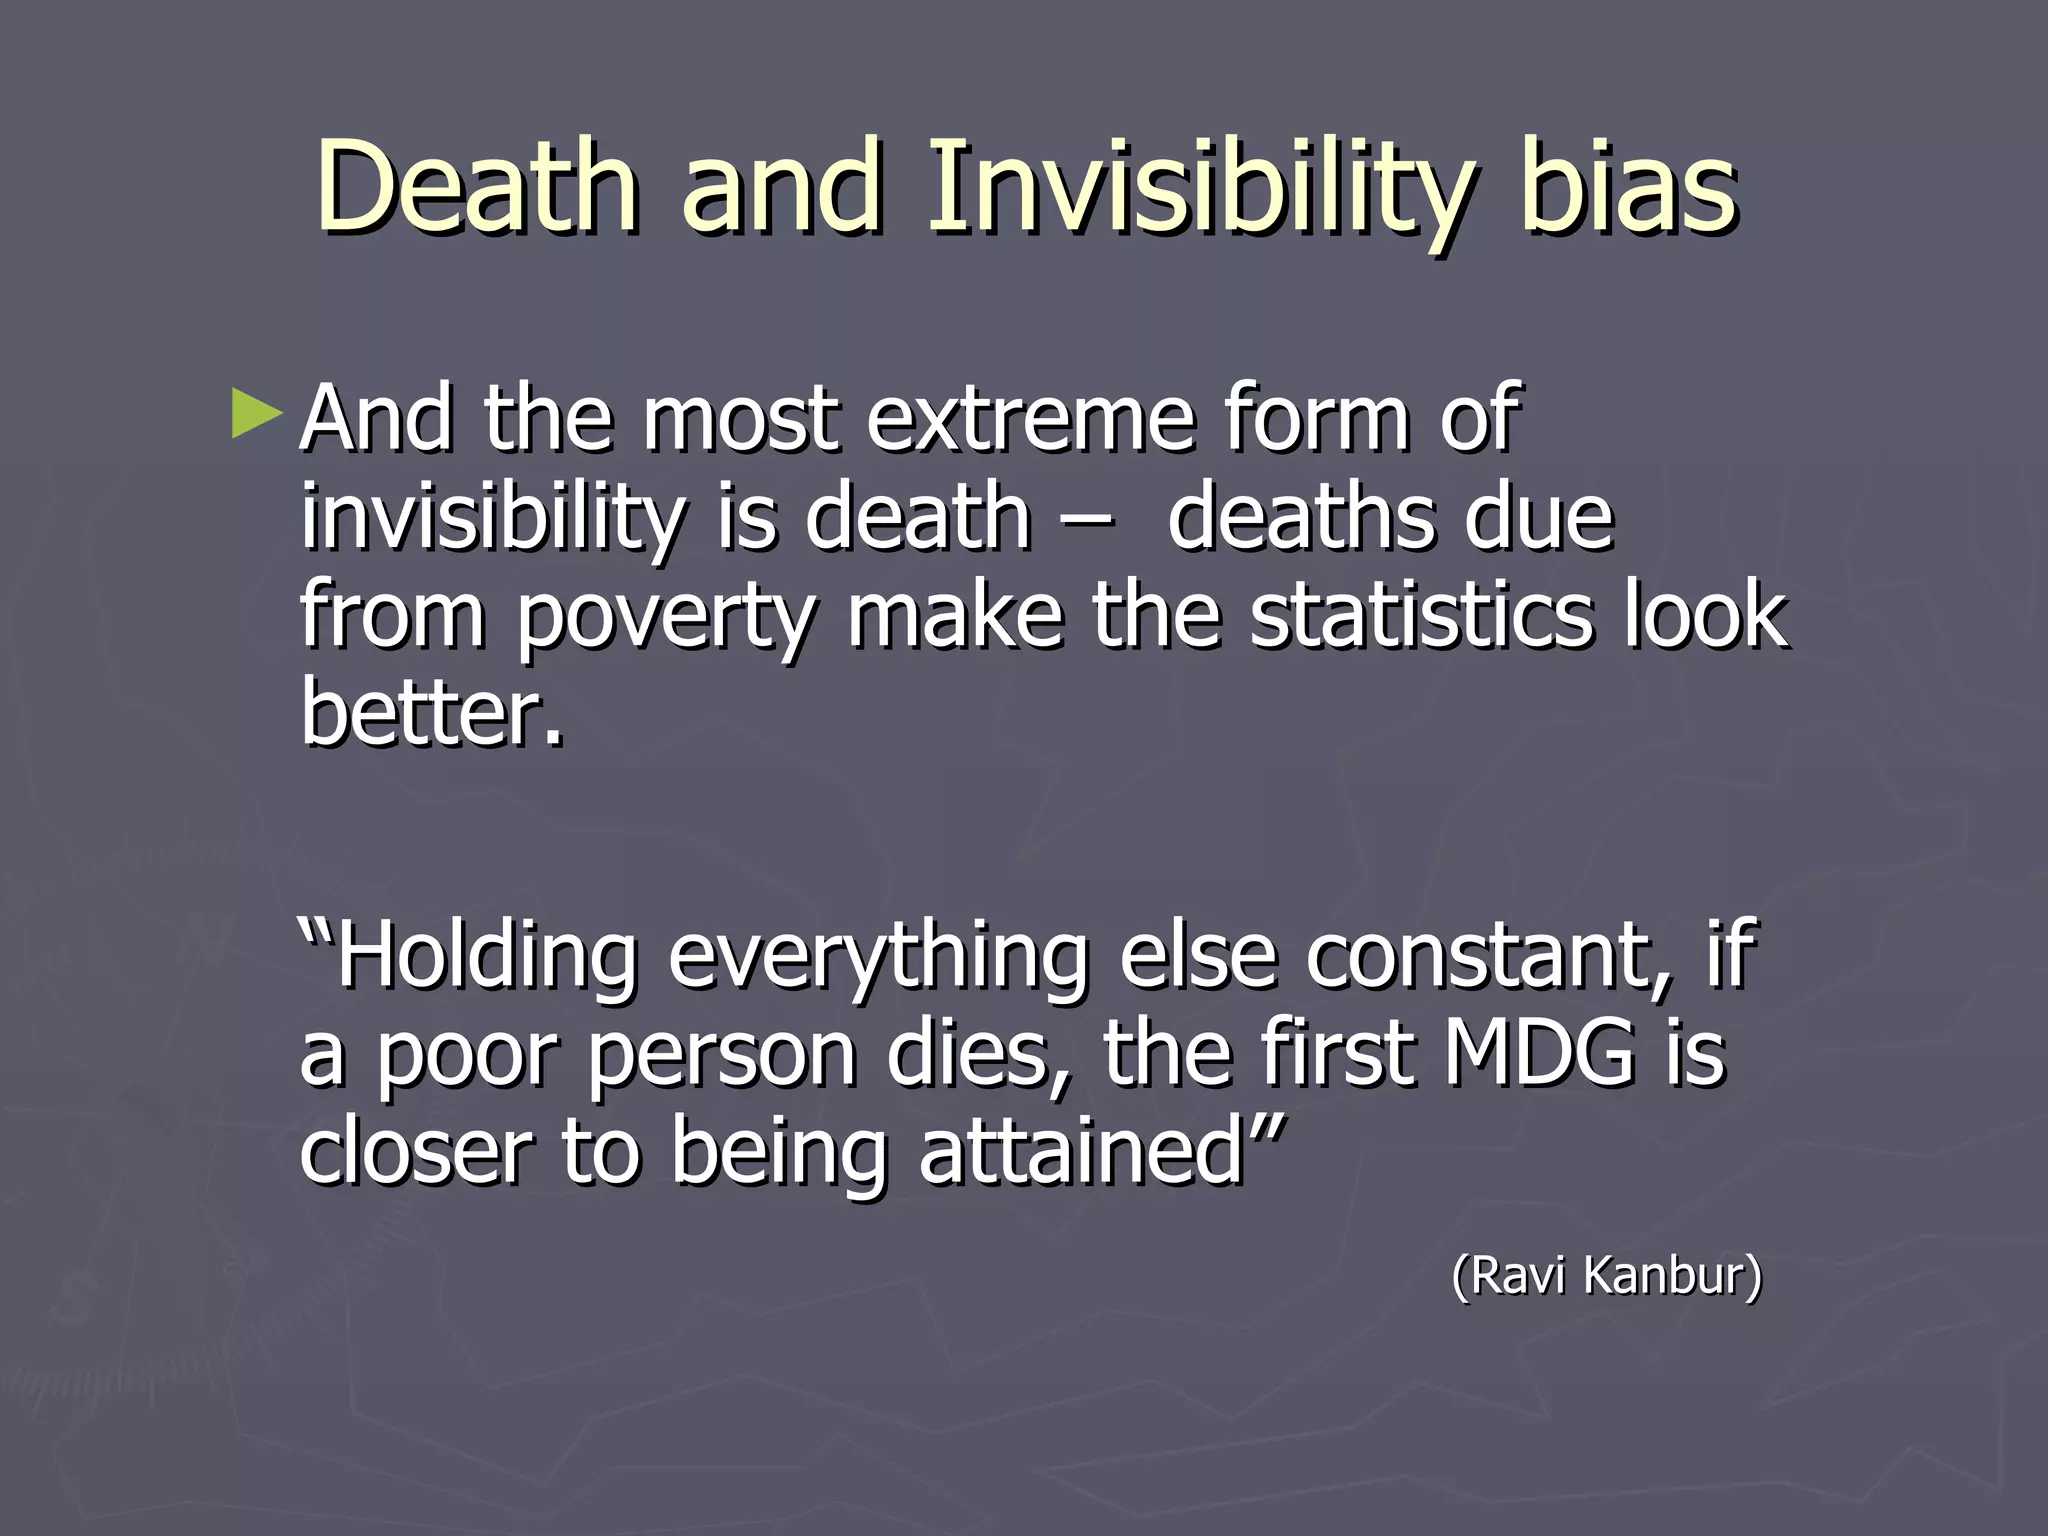
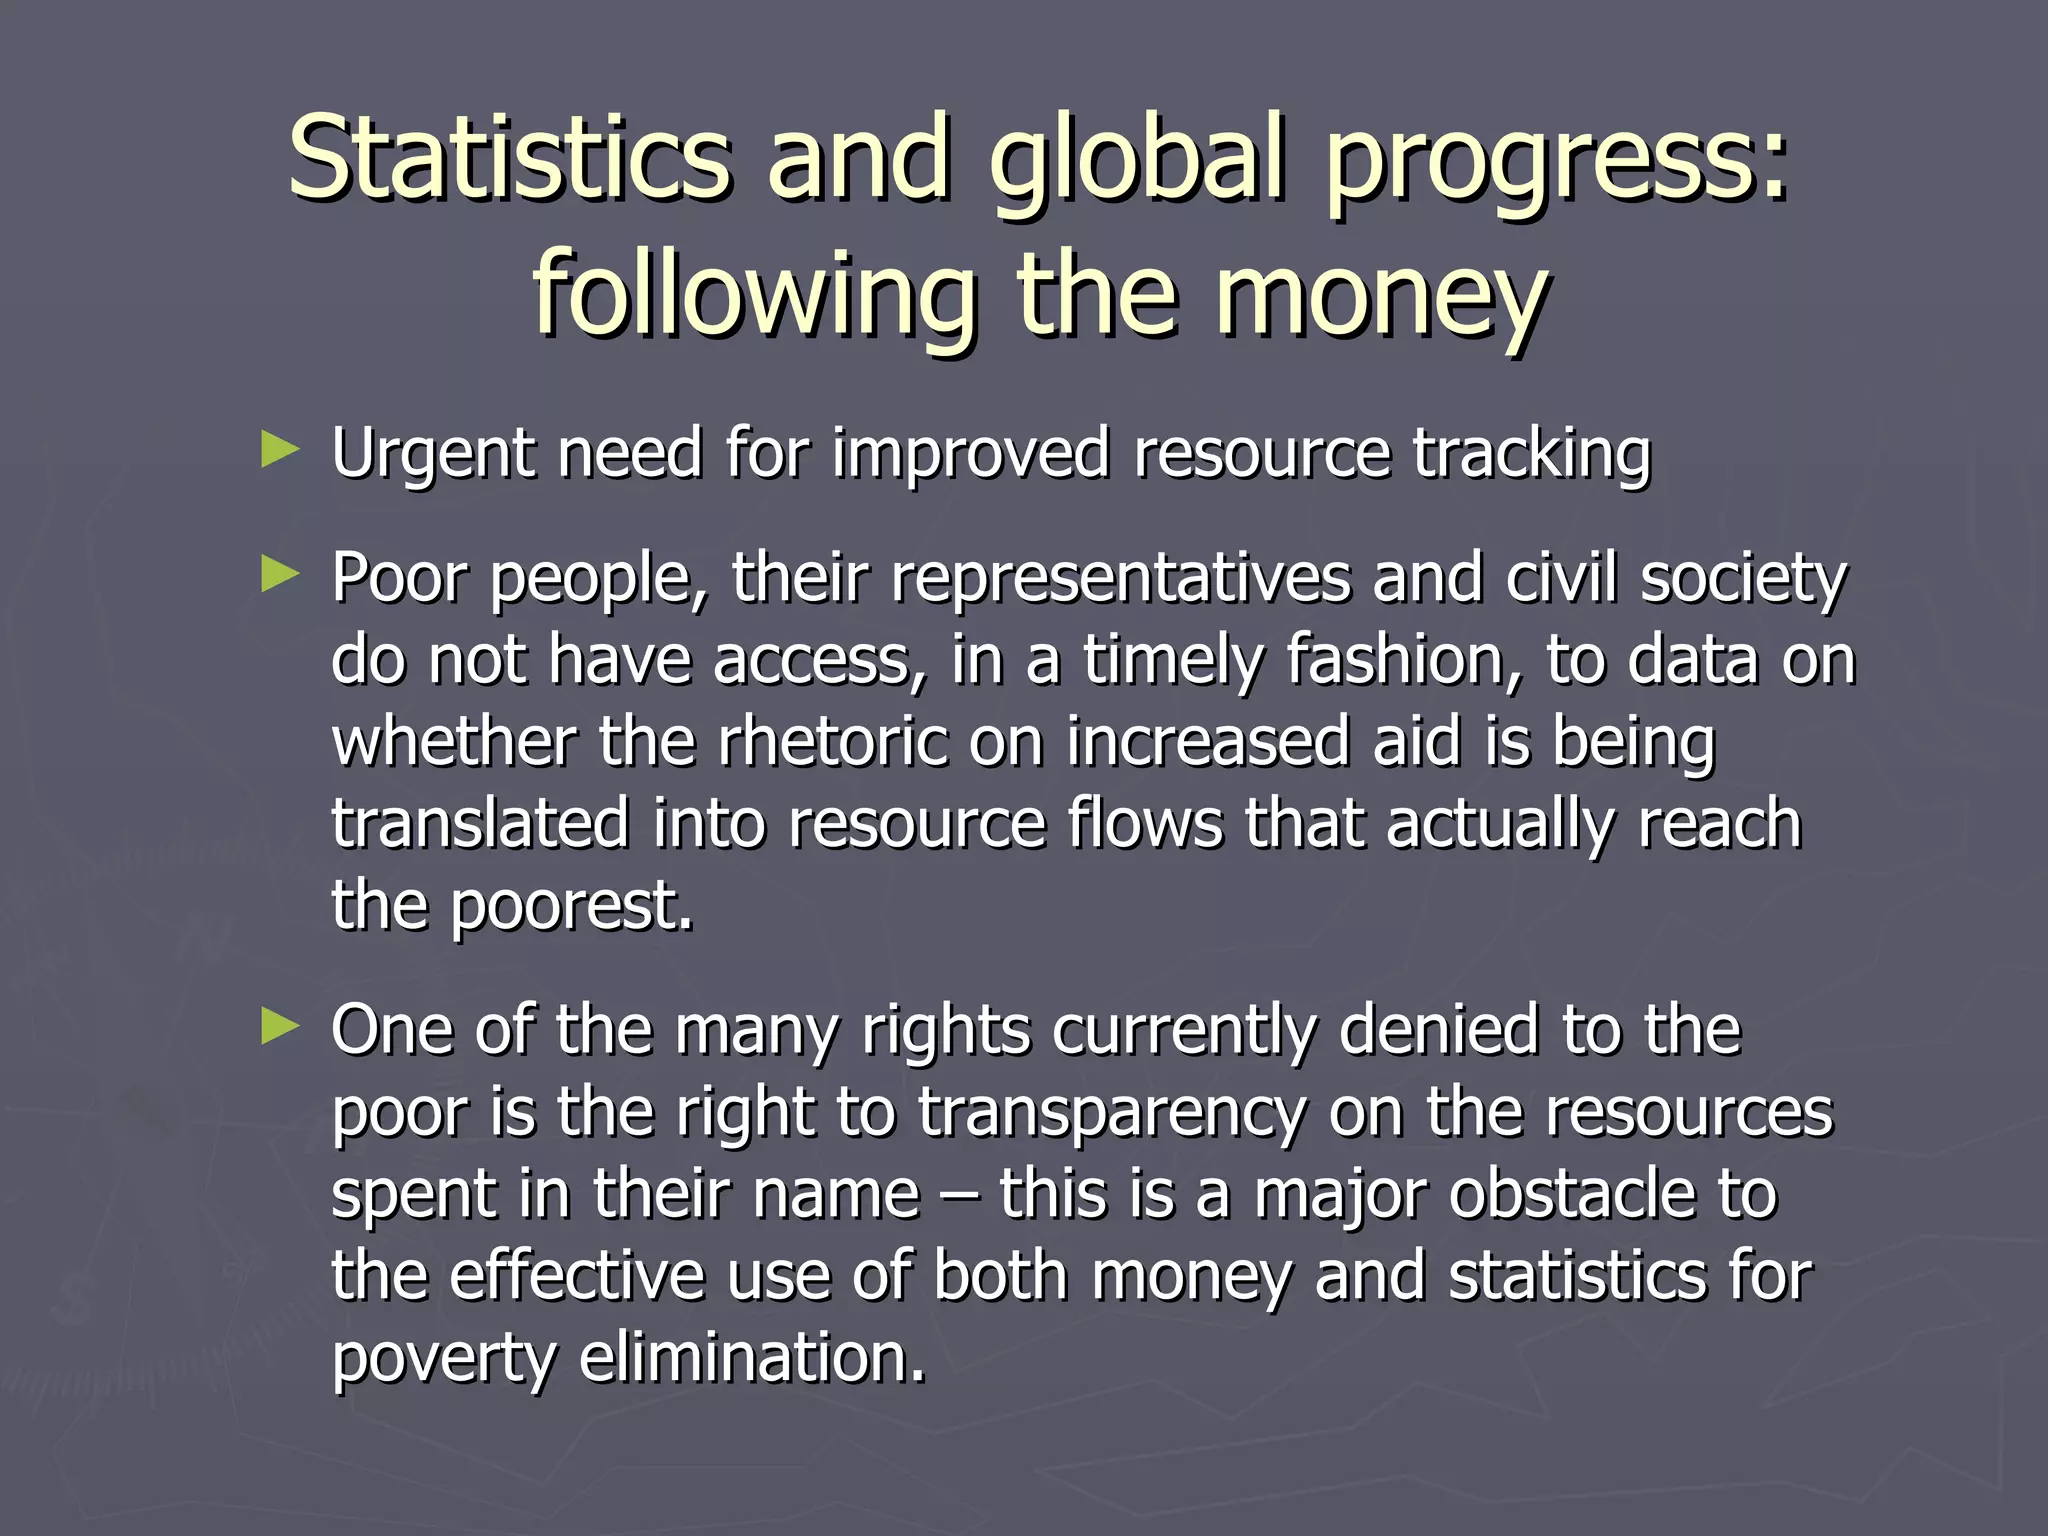
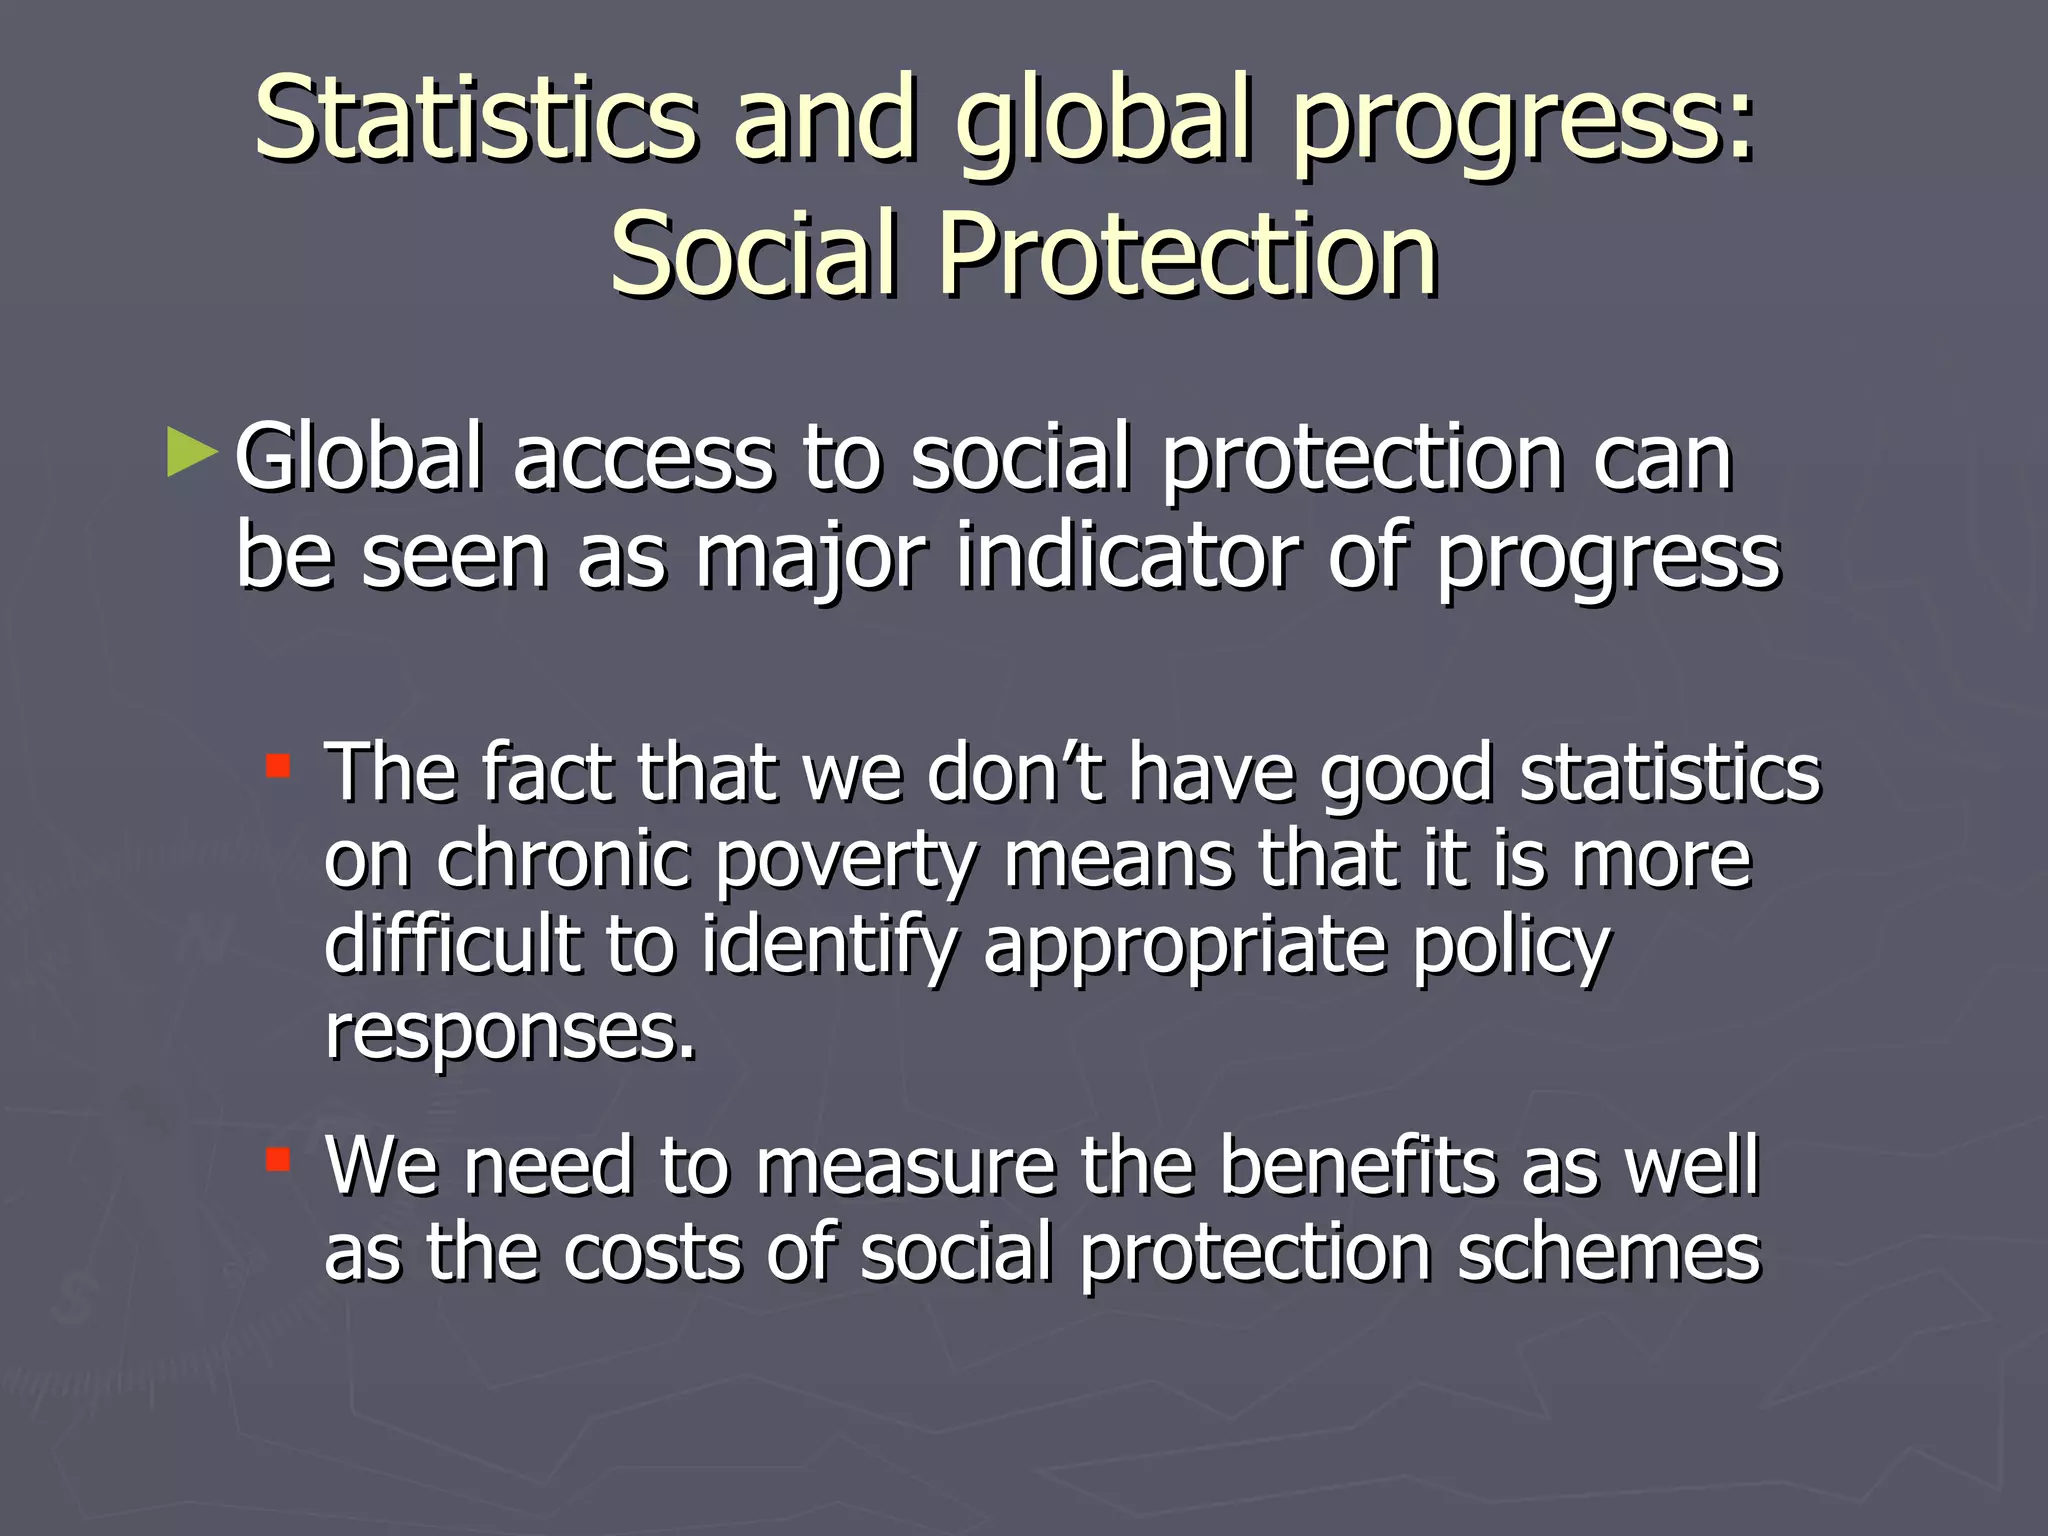
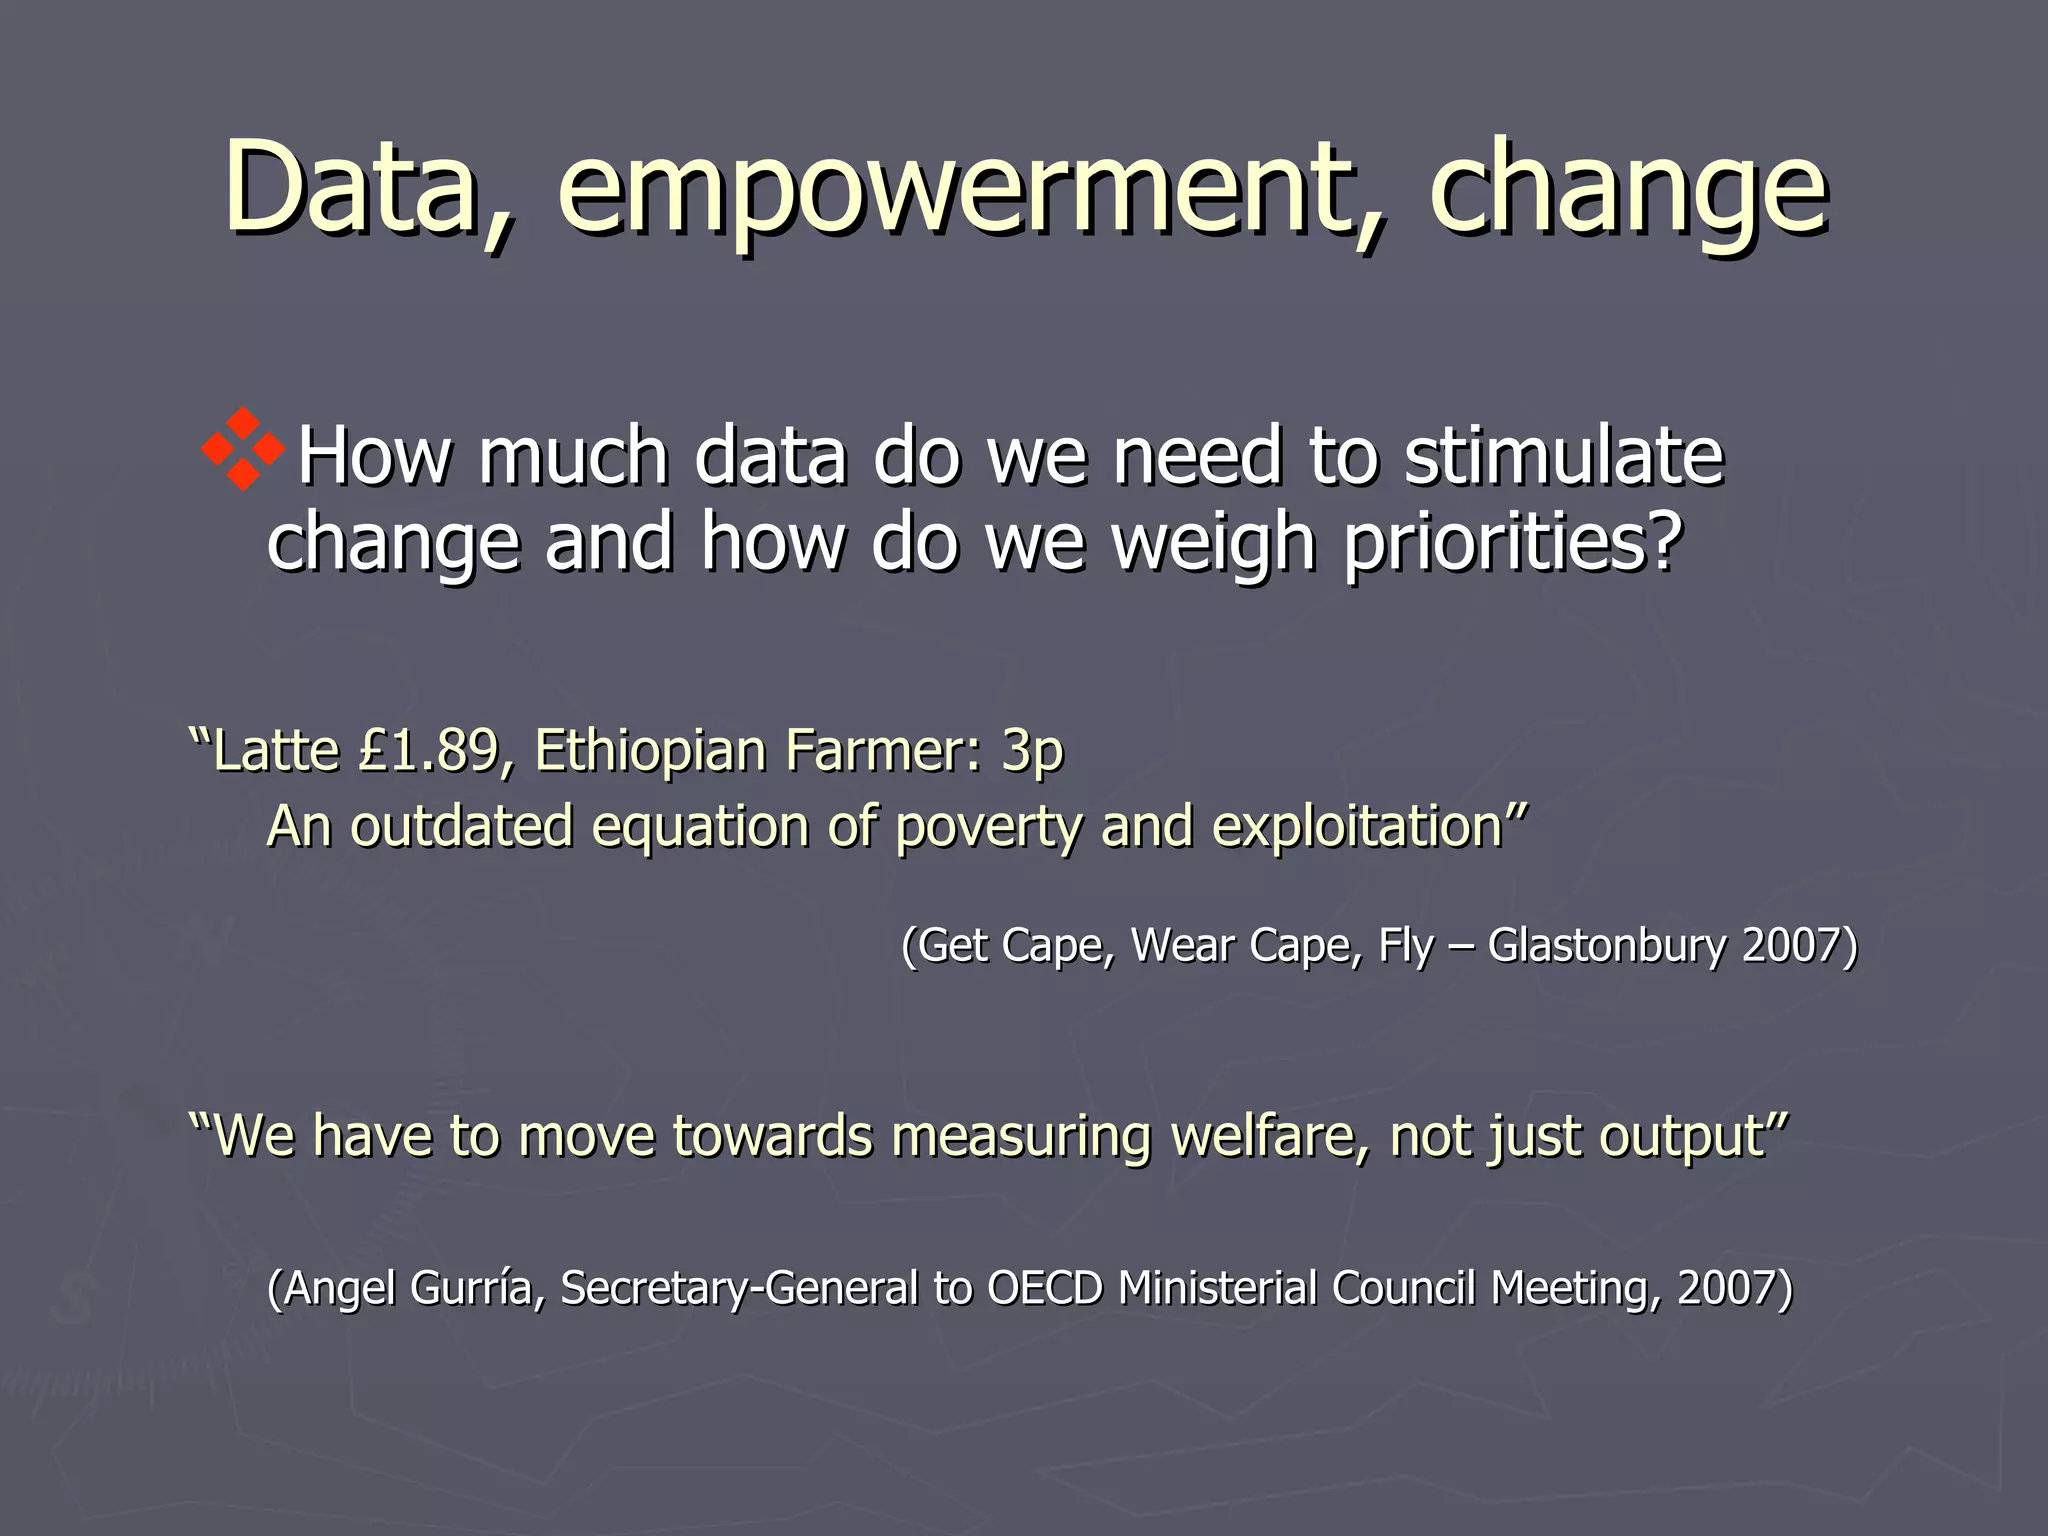
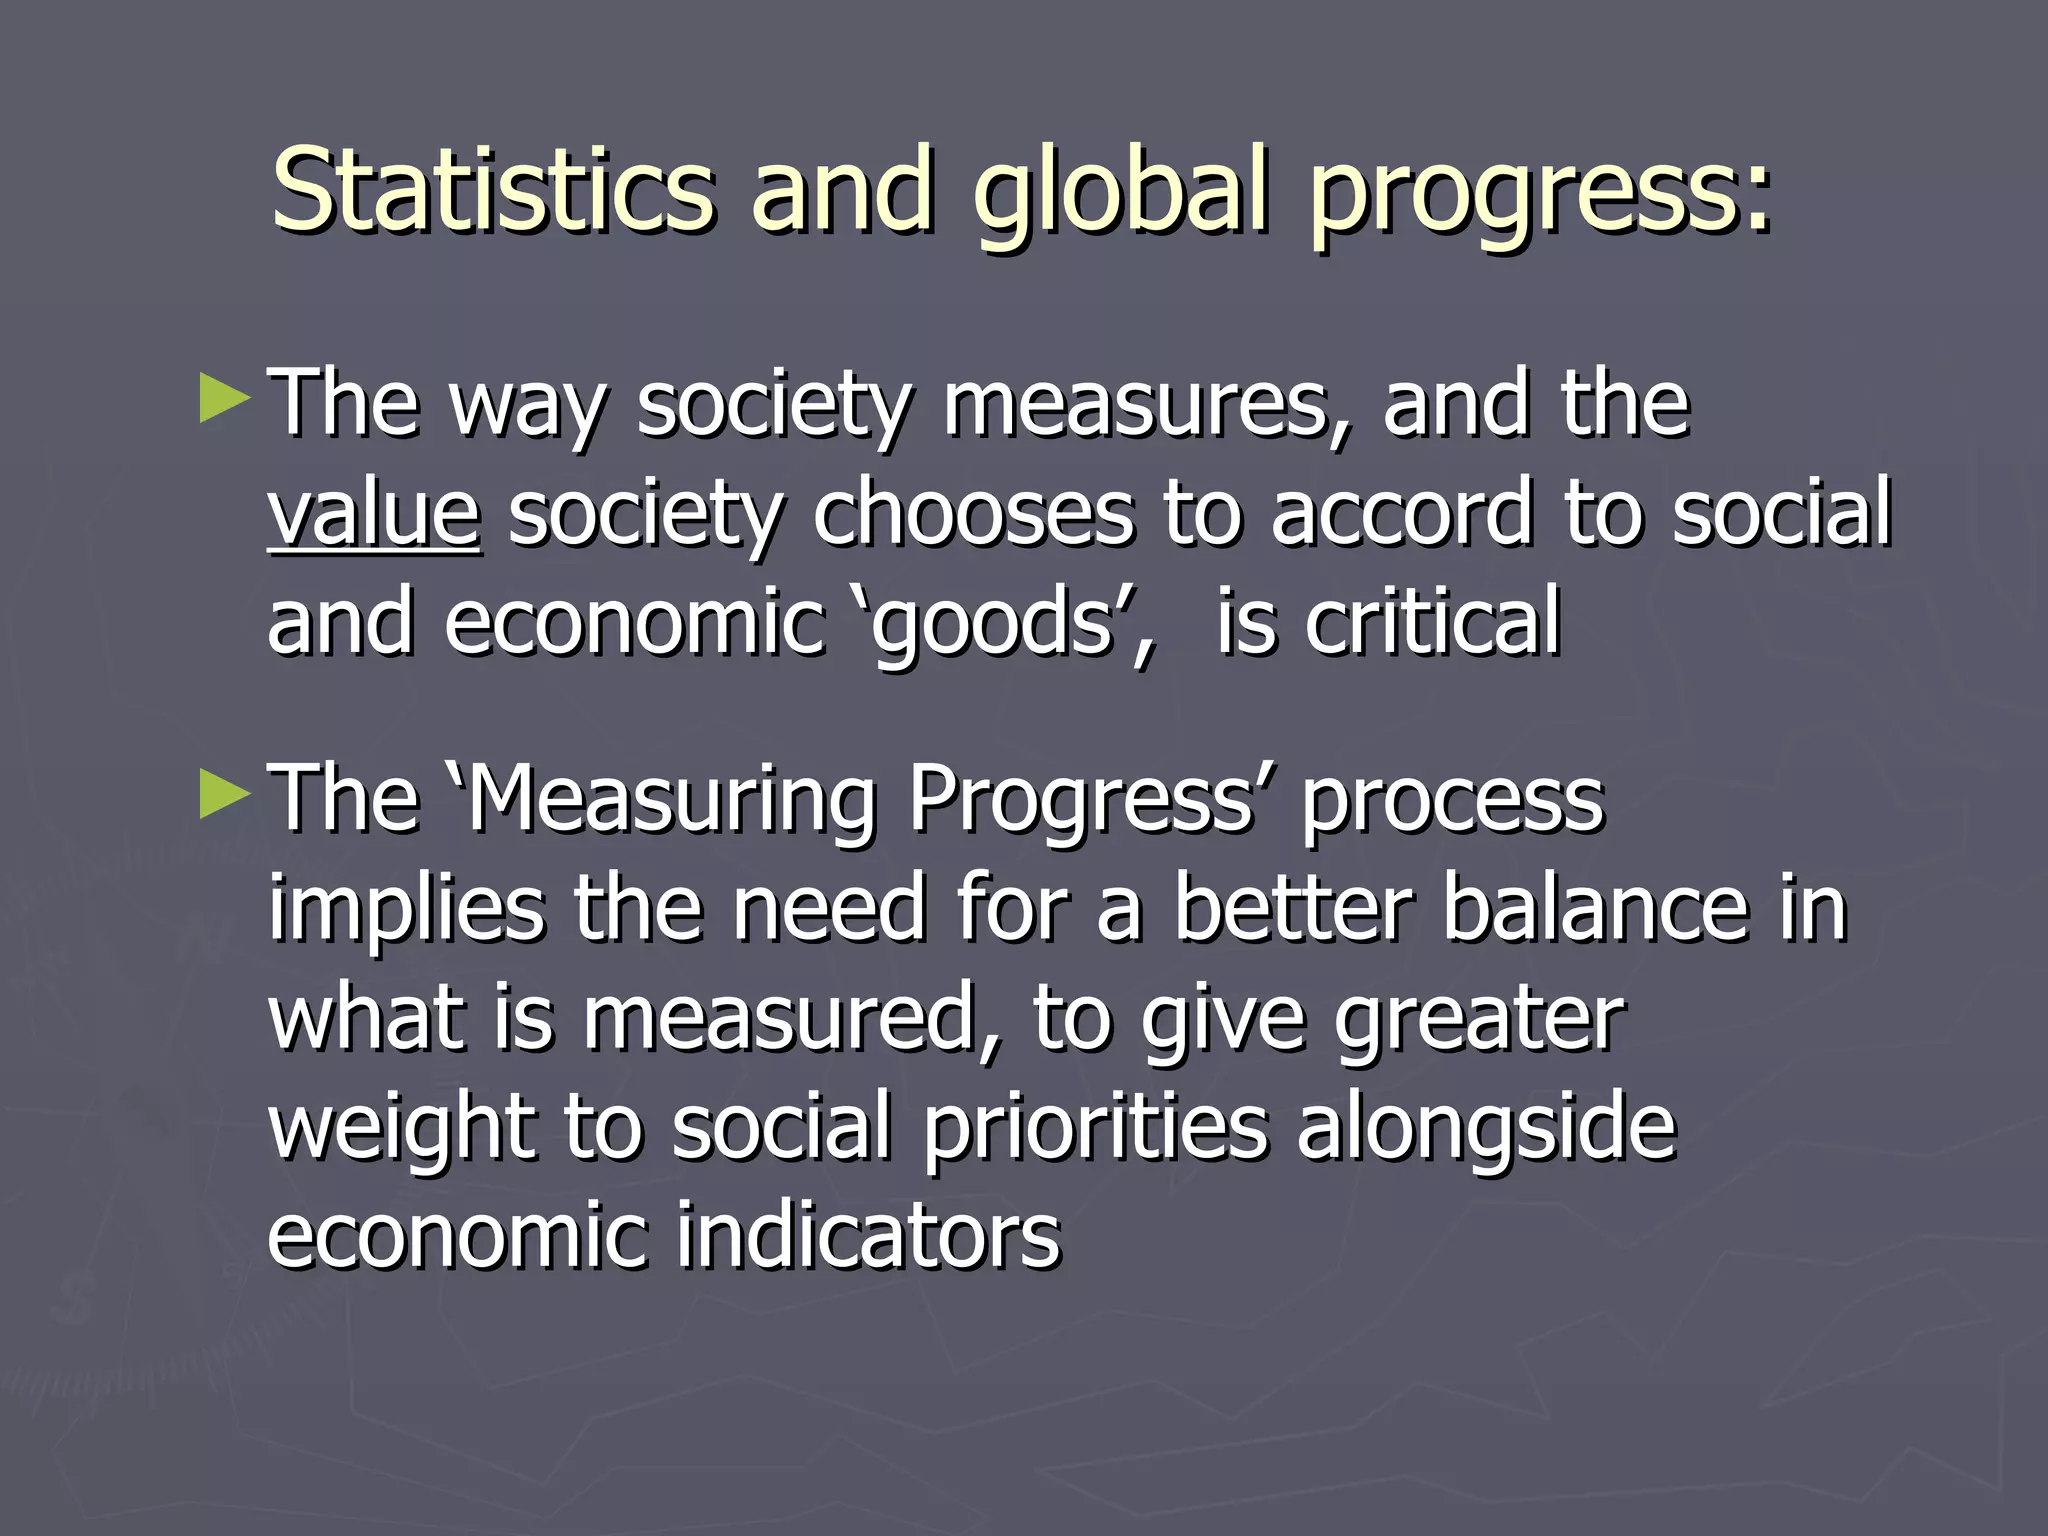
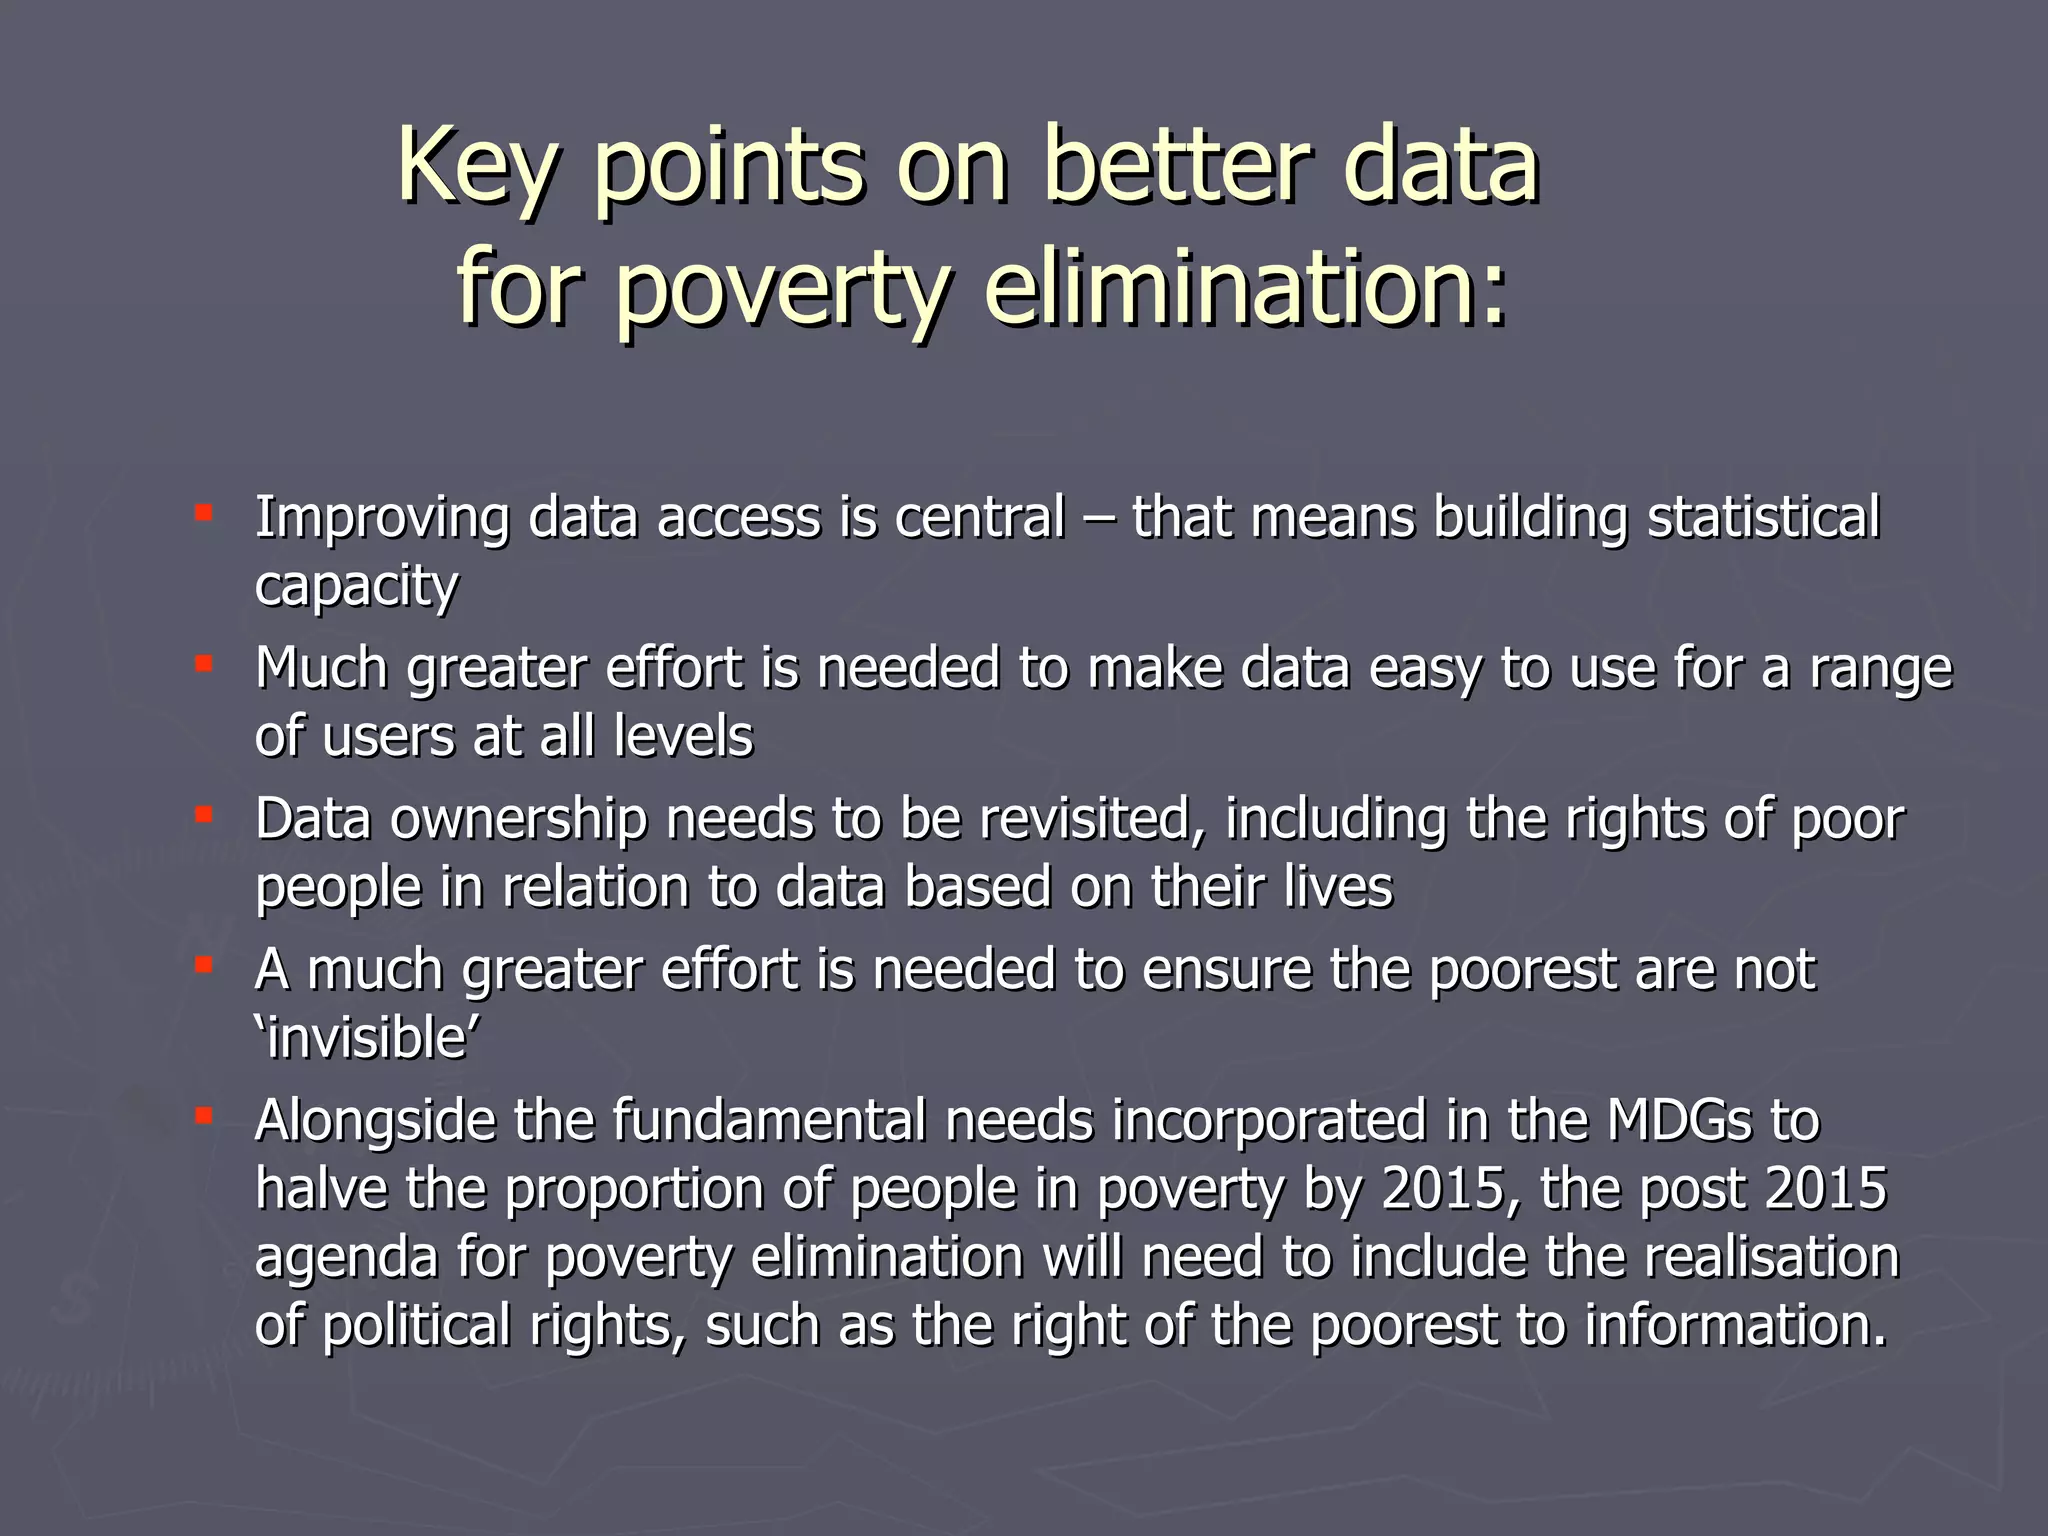
Measuring and Fostering
the Progress of Societies:
  Poverty and Exclusion
        Judith Randel and Tony German
      di@devinit.org +44 (0) 1749 831141
Progress, Poverty and Exclusion
► What    do we mean by progress on poverty and
    exclusion and how can statistics help?

   The post 2015 agenda for the eradication of poverty
   Dis-aggregation and panel data
   Counting the uncounted
   Excluded or exploited?

► Fostering    and Measuring progress of the global
    society in the fight against poverty and exclusion
Progress: MDGs PLUS
    The MDGs have been a major force for progress
    But…

►   Even if the MDGs are met in 2015 there will still be
    hundreds of millions of people living in chronic poverty

►   Only one goal (education) requires universal access – but
    others are milestones

►   Achieving the milestones means including the ‘hard-to-
    reach’ poor
Attention to universal rights and post
2015 agenda for poverty eradication


           “When we all signed up to the Millennium

        Declaration, which committed us to making the
           right to development a reality for everyone
                        …we meant everyone”

 (Hilary Benn, May 2004, UK Secretary of State for International Development)
We need to frame the way we gather
and use data in the context of the
post-2015 agenda on poverty
eradication

► Data   relevant to rights, means capturing:

     multidimensionality,
     vulnerability
     and structural issues
Disaggregating data on poverty
– need for panel data
►   We need to know who stays poor and who moves into
    and out of poverty so we need to measure what is
    happening to specific people over time
►   Between 1992 and 1999 the national poverty rate in
    Uganda fell from 56% to 34%
►   The panel data shows that in the same period, 30% of
    people moved out of poverty, but 20% of people stayed
    poor and 10% fell into poverty.
►   In other words there was a lot of mobility of living
    conditions over time.
Panel data: understanding impact on poverty
►   The Rwandan government has been encouraging farmers to make
    increased use of fertiliser.
►   Two cross section surveys show % of farmers using fertiliser
    increased from 2000 to 2005. They also show that the non-poor are
    more likely to use fertiliser than the poor.
►   But we don’t know whether the non-poor who used fertiliser in 2005
    were poor in 2000.
►   It may be that many of them were poor in 2000 and use of fertiliser
    helped them become non-poor;
►   OR it may be they were always non poor and the non-poor are
    always more likely to use fertiliser.

•   With panel data we could distinguish these two cases.
•   Without panel data we do not know the answer, so we don’t know if
    fertiliser use has contributed to poverty reduction.
Issues on panel data
Limitations of panel data

►  “age” over time - samples representative at the beginning
  become less so over time
► Attrition: People drop out - they may be the most revealing.


Very few panel data sets AND difficult to access

► Serious difficulties of researchers and others (including
  sometimes government) getting access.
► Panel data seen as a valuable private resource for individual
  researchers or groups of researchers (often international). This
  is an issue with privately funded and statistics offices’ data.

    Do we need a code of good practice (or something
    stronger) on access to data, especially panel data?
Counting the Uncounted
    Statistics often exclude the most vulnerable

►   Household surveys and censuses don’t cover the
    homeless
►   Disabled people & unwanted relatives often missed
►   Difficult to count people in war zones, or remote
    areas
►   Children are often undercounted
►   “We also miss the rich – they don’t want to
    participate in income and expenditure surveys”
Death and Invisibility bias
► And the most extreme form of
 invisibility is death – deaths due
 from poverty make the statistics look
 better.

 “Holding everything else constant, if
 a poor person dies, the first MDG is
 closer to being attained”
                              (Ravi Kanbur)
Respecting the perspective
       of poor people
Extremely poor people experience
multidimensional disadvantage, vulnerable to
major impacts from tiny shocks.
Consequently…
 Looking through development ‘sectors’ makes little
  sense

 Classifying response according to donors’
  management categories of ‘humanitarian’ and
  ‘development’ makes even less sense.
Dependent or productive?
“Njuma is 70, a widow, she depends on gifts
from neighbours and earns about US$0.03 an
hour gleaning corn.
Economic surveys and the census would, if
they recognised her at all, class her as poor
and not working.
The reality is that she is employed in some of
the lowest paid work in the world”

(David Hulme, Chronic Poverty Report 2004)
Excluded or Exploited?
 Will very poor people be able to escape
  poverty if they are fully included in the
  process of development and growth – or
  are they already included – just on
  profoundly disadvantageous terms?
  (Adversely incorporated).
 What we measure will be very different
  according to the hypothesis we choose. If
  we consider exploitation, then the statistics
  need to reveal the systemic conditions that
  entrench poverty.
Statistics and global progress:
     following the money
►   Urgent need for improved resource tracking
►   Poor people, their representatives and civil society
    do not have access, in a timely fashion, to data on
    whether the rhetoric on increased aid is being
    translated into resource flows that actually reach
    the poorest.
►   One of the many rights currently denied to the
    poor is the right to transparency on the resources
    spent in their name – this is a major obstacle to
    the effective use of both money and statistics for
    poverty elimination.
Statistics and global progress:
          Social Protection
► Global
       access to social protection can
 be seen as major indicator of progress

   The fact that we don’t have good statistics
    on chronic poverty means that it is more
    difficult to identify appropriate policy
    responses.
   We need to measure the benefits as well
    as the costs of social protection schemes
Data, empowerment, change

How much data do we need to stimulate
  change and how do we weigh priorities?

“Latte £1.89, Ethiopian Farmer: 3p
   An outdated equation of poverty and exploitation”

                                 (Get Cape, Wear Cape, Fly – Glastonbury 2007)


“We have to move towards measuring welfare, not just output”

  (Angel Gurría, Secretary-General to OECD Ministerial Council Meeting, 2007)
Statistics and global progress:
► Theway society measures, and the
 value society chooses to accord to social
 and economic ‘goods’, is critical
► The ‘Measuring Progress’ process
 implies the need for a better balance in
 what is measured, to give greater
 weight to social priorities alongside
 economic indicators
Key points on better data
         for poverty elimination:

 Improving data access is central – that means building statistical
  capacity
 Much greater effort is needed to make data easy to use for a range
  of users at all levels
 Data ownership needs to be revisited, including the rights of poor
  people in relation to data based on their lives
 A much greater effort is needed to ensure the poorest are not
  ‘invisible’
 Alongside the fundamental needs incorporated in the MDGs to
  halve the proportion of people in poverty by 2015, the post 2015
  agenda for poverty elimination will need to include the realisation
  of political rights, such as the right of the poorest to information.

Measuring and fostering the progress of societies

  • 1.
    Measuring and Fostering theProgress of Societies: Poverty and Exclusion Judith Randel and Tony German di@devinit.org +44 (0) 1749 831141
  • 2.
    Progress, Poverty andExclusion ► What do we mean by progress on poverty and exclusion and how can statistics help?  The post 2015 agenda for the eradication of poverty  Dis-aggregation and panel data  Counting the uncounted  Excluded or exploited? ► Fostering and Measuring progress of the global society in the fight against poverty and exclusion
  • 3.
    Progress: MDGs PLUS The MDGs have been a major force for progress But… ► Even if the MDGs are met in 2015 there will still be hundreds of millions of people living in chronic poverty ► Only one goal (education) requires universal access – but others are milestones ► Achieving the milestones means including the ‘hard-to- reach’ poor
  • 4.
    Attention to universalrights and post 2015 agenda for poverty eradication “When we all signed up to the Millennium Declaration, which committed us to making the right to development a reality for everyone …we meant everyone” (Hilary Benn, May 2004, UK Secretary of State for International Development)
  • 5.
    We need toframe the way we gather and use data in the context of the post-2015 agenda on poverty eradication ► Data relevant to rights, means capturing:  multidimensionality,  vulnerability  and structural issues
  • 6.
    Disaggregating data onpoverty – need for panel data ► We need to know who stays poor and who moves into and out of poverty so we need to measure what is happening to specific people over time ► Between 1992 and 1999 the national poverty rate in Uganda fell from 56% to 34% ► The panel data shows that in the same period, 30% of people moved out of poverty, but 20% of people stayed poor and 10% fell into poverty. ► In other words there was a lot of mobility of living conditions over time.
  • 7.
    Panel data: understandingimpact on poverty ► The Rwandan government has been encouraging farmers to make increased use of fertiliser. ► Two cross section surveys show % of farmers using fertiliser increased from 2000 to 2005. They also show that the non-poor are more likely to use fertiliser than the poor. ► But we don’t know whether the non-poor who used fertiliser in 2005 were poor in 2000. ► It may be that many of them were poor in 2000 and use of fertiliser helped them become non-poor; ► OR it may be they were always non poor and the non-poor are always more likely to use fertiliser. • With panel data we could distinguish these two cases. • Without panel data we do not know the answer, so we don’t know if fertiliser use has contributed to poverty reduction.
  • 8.
    Issues on paneldata Limitations of panel data ► “age” over time - samples representative at the beginning become less so over time ► Attrition: People drop out - they may be the most revealing. Very few panel data sets AND difficult to access ► Serious difficulties of researchers and others (including sometimes government) getting access. ► Panel data seen as a valuable private resource for individual researchers or groups of researchers (often international). This is an issue with privately funded and statistics offices’ data. Do we need a code of good practice (or something stronger) on access to data, especially panel data?
  • 9.
    Counting the Uncounted Statistics often exclude the most vulnerable ► Household surveys and censuses don’t cover the homeless ► Disabled people & unwanted relatives often missed ► Difficult to count people in war zones, or remote areas ► Children are often undercounted ► “We also miss the rich – they don’t want to participate in income and expenditure surveys”
  • 10.
    Death and Invisibilitybias ► And the most extreme form of invisibility is death – deaths due from poverty make the statistics look better. “Holding everything else constant, if a poor person dies, the first MDG is closer to being attained” (Ravi Kanbur)
  • 11.
    Respecting the perspective of poor people Extremely poor people experience multidimensional disadvantage, vulnerable to major impacts from tiny shocks. Consequently…  Looking through development ‘sectors’ makes little sense  Classifying response according to donors’ management categories of ‘humanitarian’ and ‘development’ makes even less sense.
  • 12.
    Dependent or productive? “Njumais 70, a widow, she depends on gifts from neighbours and earns about US$0.03 an hour gleaning corn. Economic surveys and the census would, if they recognised her at all, class her as poor and not working. The reality is that she is employed in some of the lowest paid work in the world” (David Hulme, Chronic Poverty Report 2004)
  • 13.
    Excluded or Exploited? Will very poor people be able to escape poverty if they are fully included in the process of development and growth – or are they already included – just on profoundly disadvantageous terms? (Adversely incorporated).  What we measure will be very different according to the hypothesis we choose. If we consider exploitation, then the statistics need to reveal the systemic conditions that entrench poverty.
  • 14.
    Statistics and globalprogress: following the money ► Urgent need for improved resource tracking ► Poor people, their representatives and civil society do not have access, in a timely fashion, to data on whether the rhetoric on increased aid is being translated into resource flows that actually reach the poorest. ► One of the many rights currently denied to the poor is the right to transparency on the resources spent in their name – this is a major obstacle to the effective use of both money and statistics for poverty elimination.
  • 15.
    Statistics and globalprogress: Social Protection ► Global access to social protection can be seen as major indicator of progress  The fact that we don’t have good statistics on chronic poverty means that it is more difficult to identify appropriate policy responses.  We need to measure the benefits as well as the costs of social protection schemes
  • 16.
    Data, empowerment, change Howmuch data do we need to stimulate change and how do we weigh priorities? “Latte £1.89, Ethiopian Farmer: 3p An outdated equation of poverty and exploitation” (Get Cape, Wear Cape, Fly – Glastonbury 2007) “We have to move towards measuring welfare, not just output” (Angel Gurría, Secretary-General to OECD Ministerial Council Meeting, 2007)
  • 17.
    Statistics and globalprogress: ► Theway society measures, and the value society chooses to accord to social and economic ‘goods’, is critical ► The ‘Measuring Progress’ process implies the need for a better balance in what is measured, to give greater weight to social priorities alongside economic indicators
  • 18.
    Key points onbetter data for poverty elimination:  Improving data access is central – that means building statistical capacity  Much greater effort is needed to make data easy to use for a range of users at all levels  Data ownership needs to be revisited, including the rights of poor people in relation to data based on their lives  A much greater effort is needed to ensure the poorest are not ‘invisible’  Alongside the fundamental needs incorporated in the MDGs to halve the proportion of people in poverty by 2015, the post 2015 agenda for poverty elimination will need to include the realisation of political rights, such as the right of the poorest to information.