Download to read offline


![Age decompositions:
Illustrated for 25 countries (Vaz 2014)
Figure 2: Demographic distribution of MPI poor by age categories
[0,9]
[10,18]
[19,64]
65 and older
Figure 1: Age structure of population
[0,9]
[10,18]
[19,64]
65 and older](https://image.slidesharecdn.com/helpagecartagenadatafestival2015pt1-150428113207-conversion-gate02/75/Cartagena-Data-Festival-2015-Making-older-people-count-Pt-1-18-2048.jpg)
![Age decompositions:
Illustrated for 25 countries
Figure 2: Demographic distribution of MPI poor by age categories
[0,9]
[10,18]
[19,64]
65 and older
Figure 1: Age structure of population
[0,9]
[10,18]
[19,64]
65 and older
The Global MPI shows that the percentage of people who are
MPI poor and 65 higher is:
- The same as the population in 7 countries
- Lower than the population in 8 countries (less elder MPI)
- Higher than the population in 10 (more elder MPI)
- Congo is highest: 2.6% of pop; but 3.8% of poor are 65+](https://image.slidesharecdn.com/helpagecartagenadatafestival2015pt1-150428113207-conversion-gate02/75/Cartagena-Data-Festival-2015-Making-older-people-count-Pt-1-19-2048.jpg)

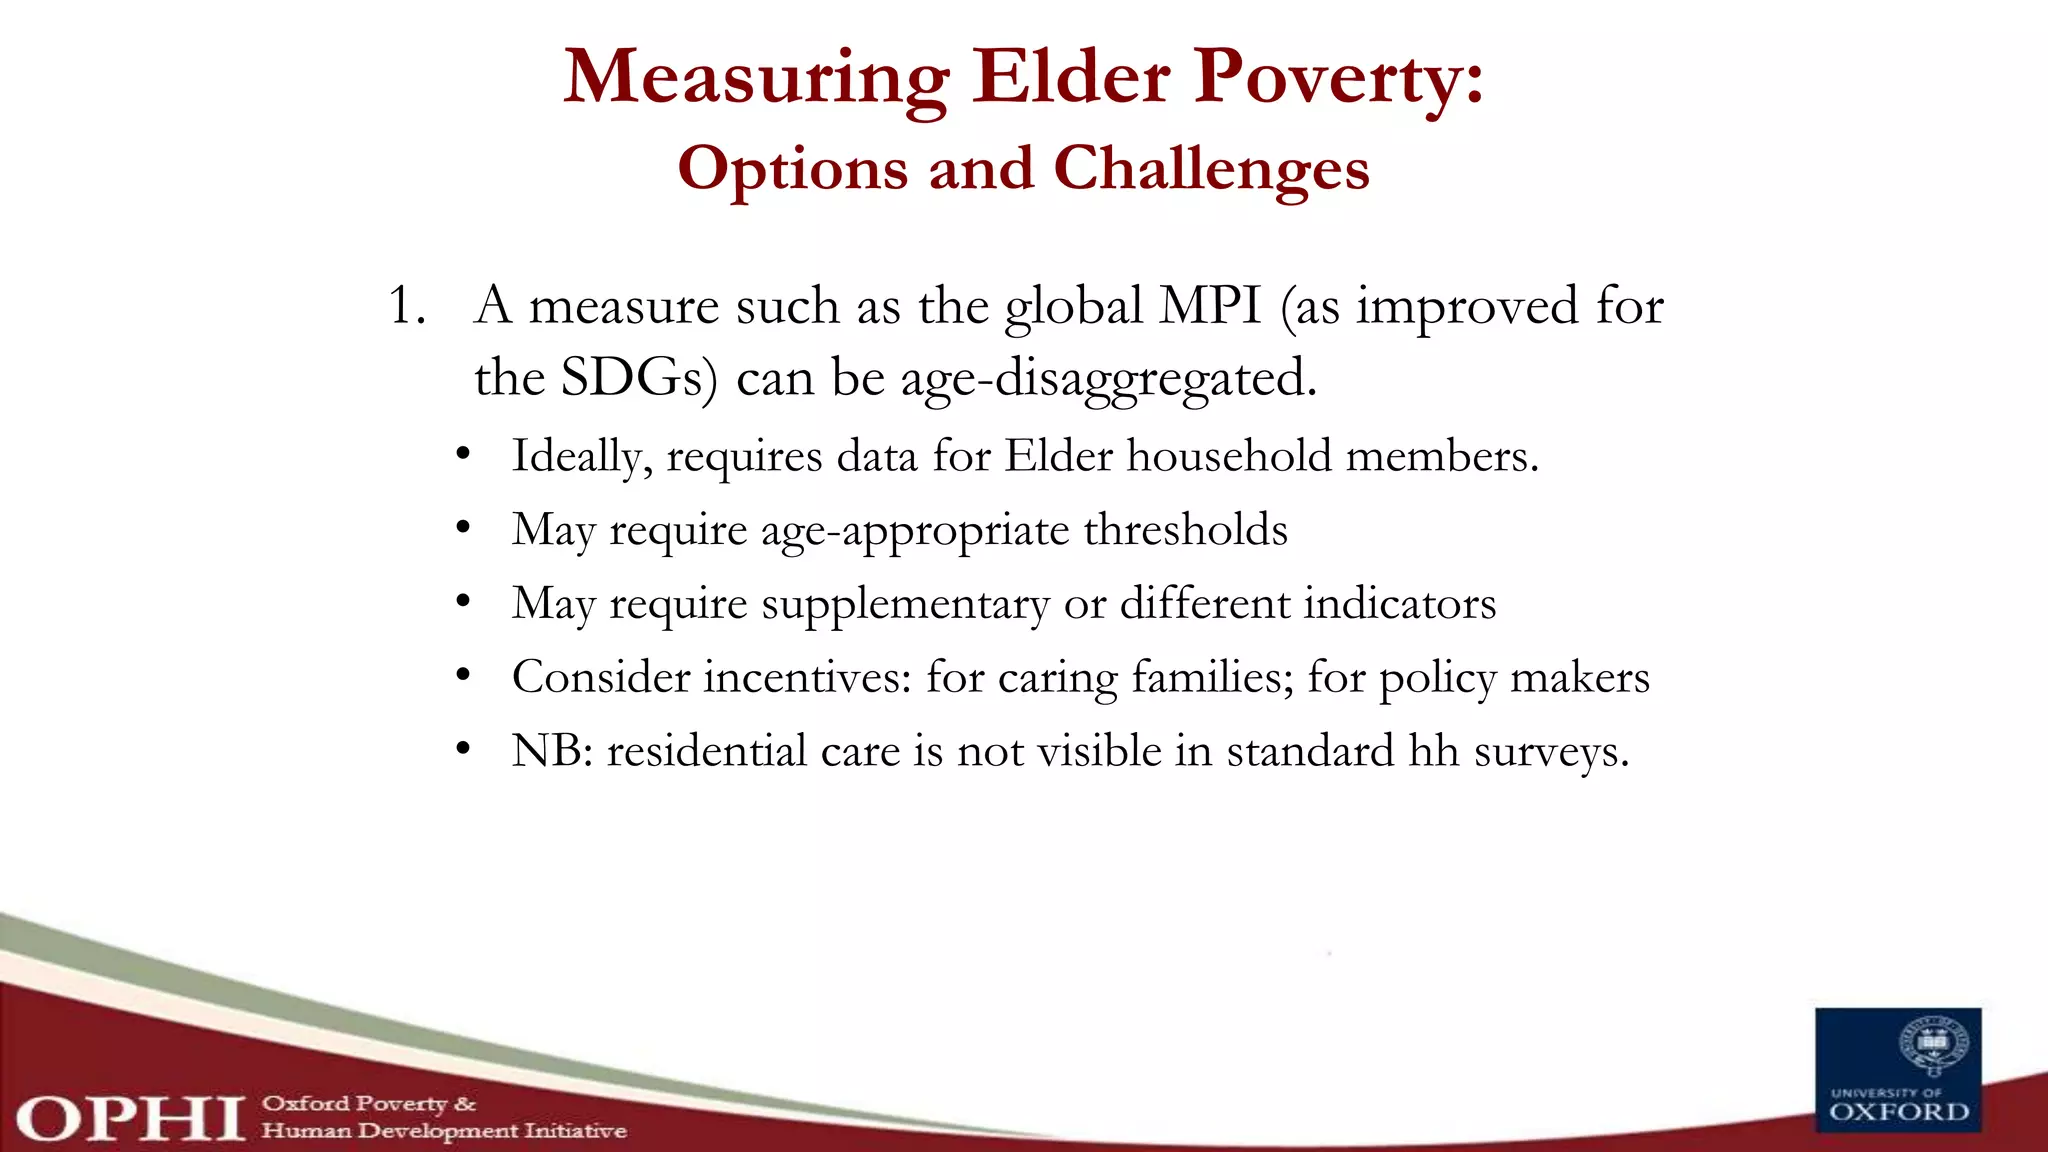


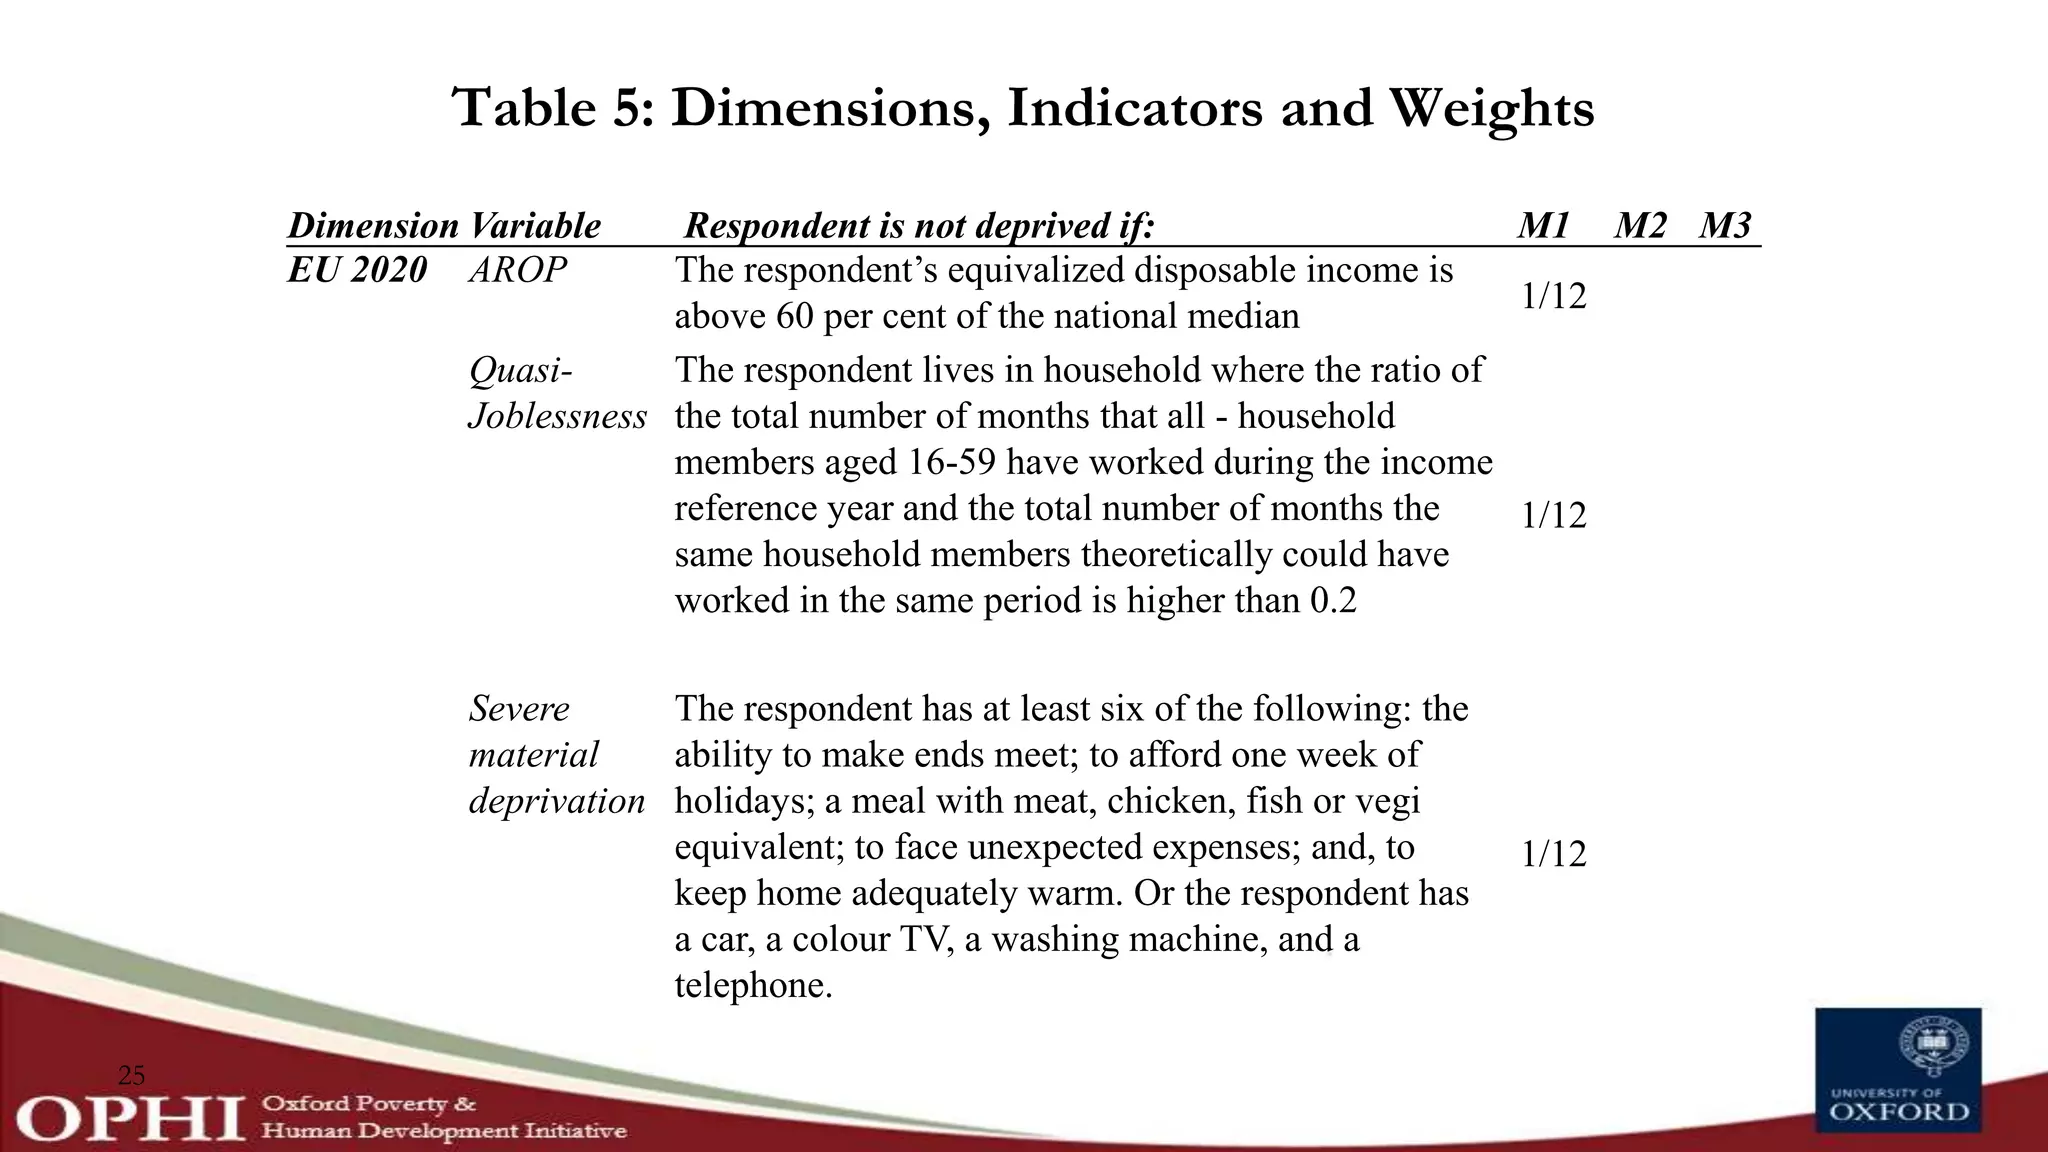


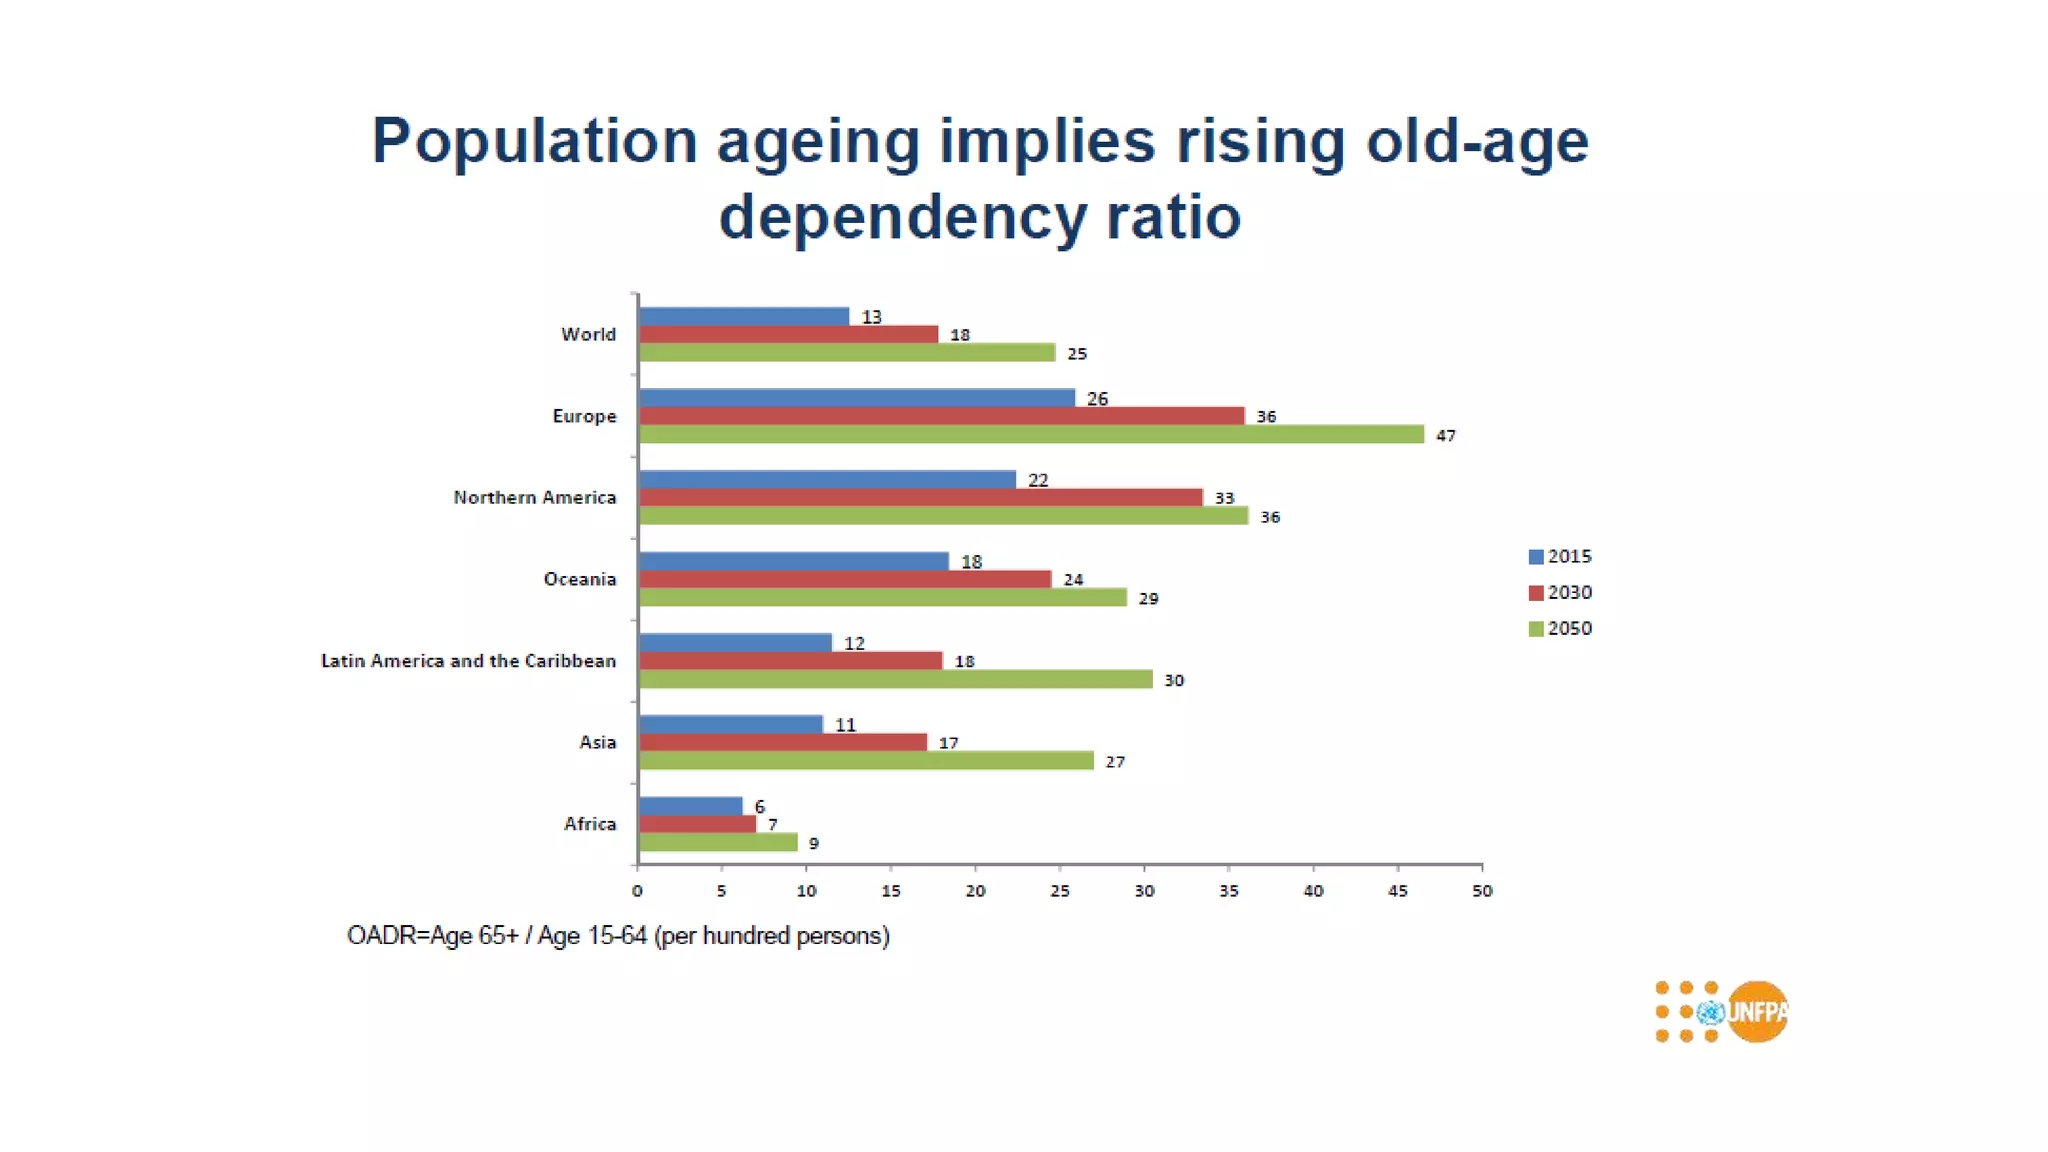


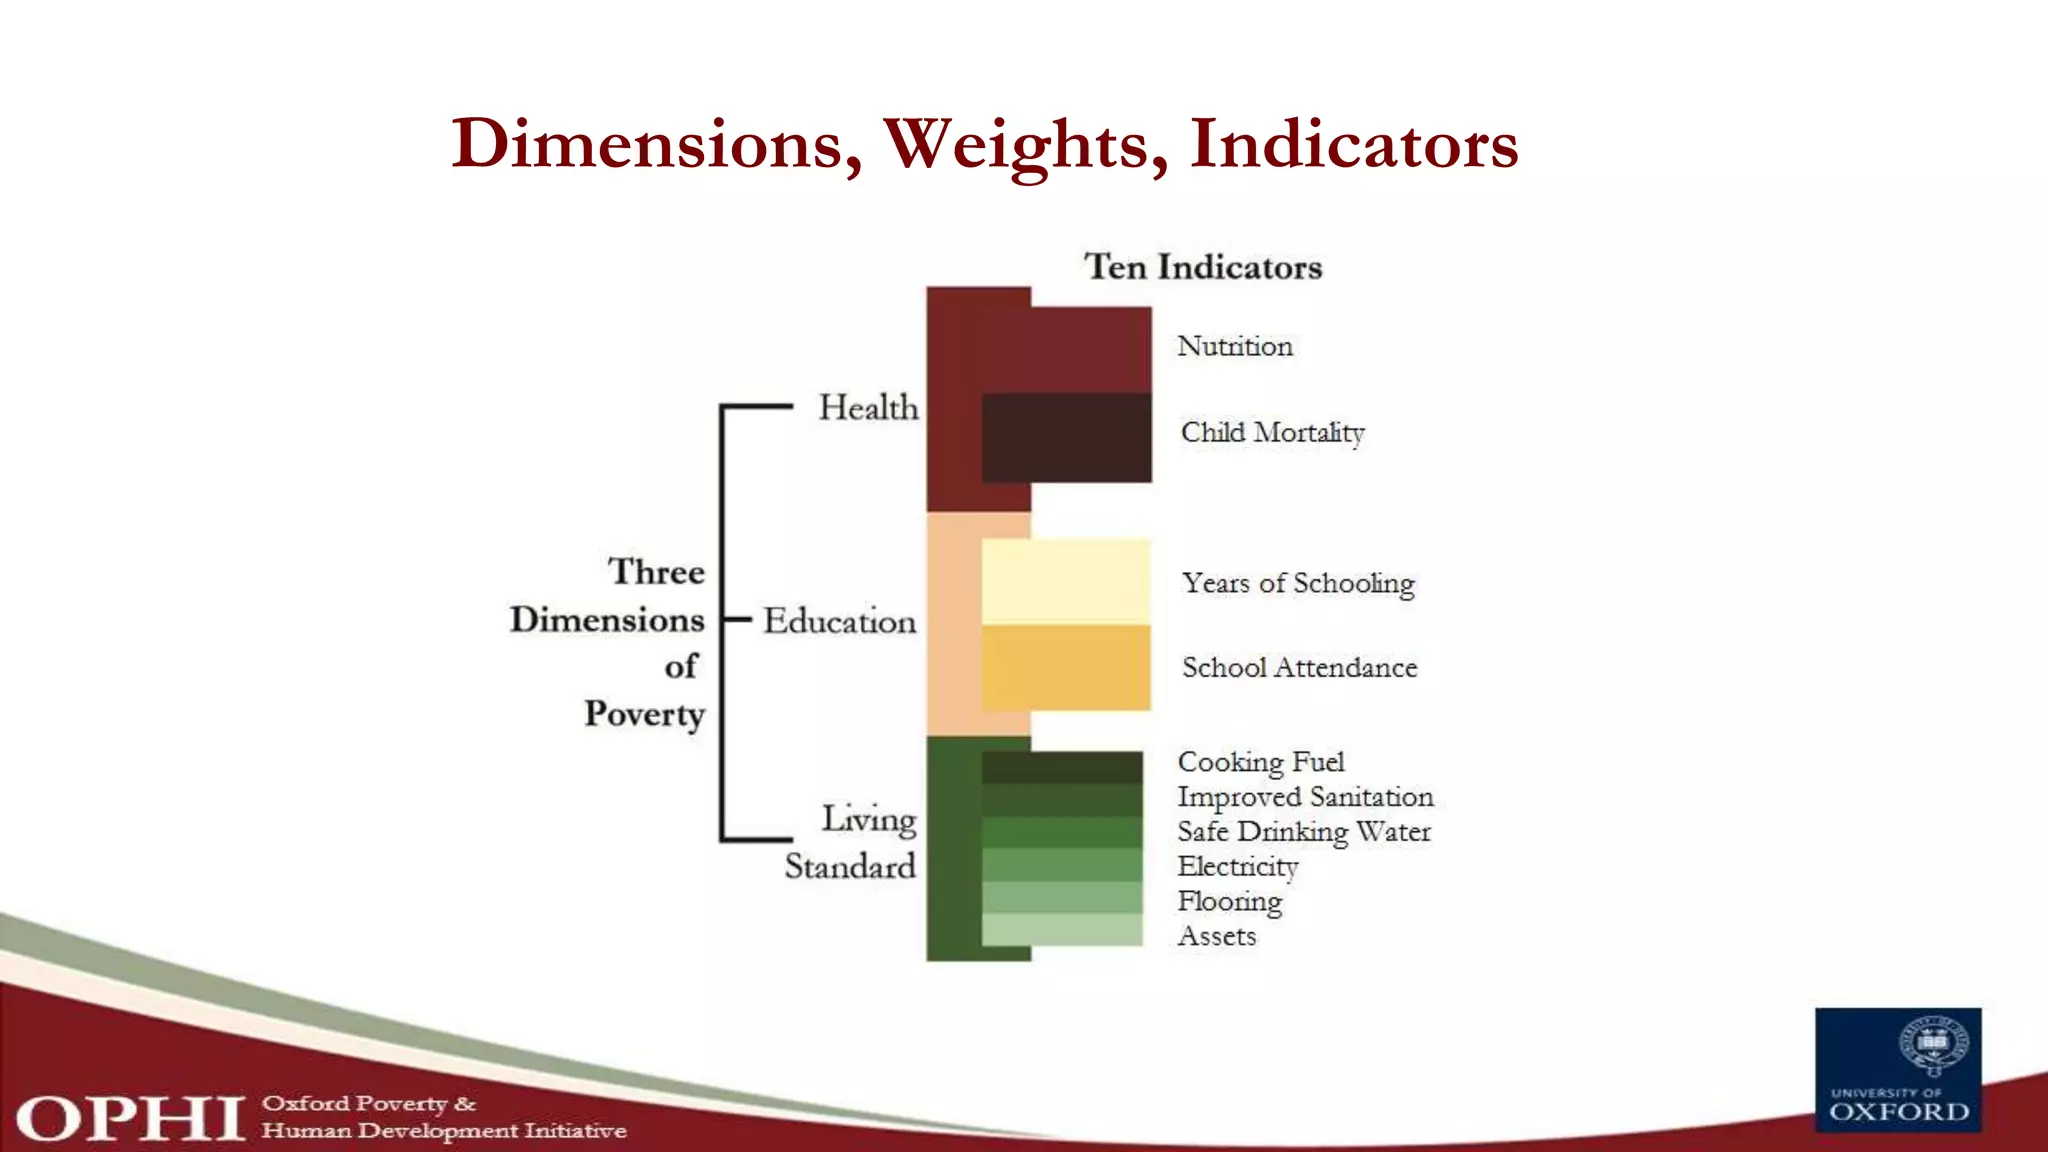
The document discusses the challenges and strategies for measuring elder poverty, highlighting the need for age-disaggregated data in the context of global poverty indices like the Global MPI. It addresses the limitations of current data collection practices and emphasizes the importance of the data revolution for sustainable development. Additionally, the document stresses the invisibility of older individuals in data analytics and the need for inclusive measures to assess their well-being and contributions.


![[DSC Europe 25] Aleksandra Dragicevic - AI-Boosted Research in Healthcare: Fr...](https://cdn.slidesharecdn.com/ss_thumbnails/iqwngszurf2r7pi1lnnj-4-aleksandra-dragicevic-ad-dsc-europe-conference-20-251208151905-37c3238a-thumbnail.jpg?width=640&height=640&fit=bounds)
![[DSC Europe 25] Katherine Forrest - AI NOW: Understanding the Velocity of Cha...](https://cdn.slidesharecdn.com/ss_thumbnails/wvvbruqfrci0sfq9xwgb-4-251212104007-e5ad1987-thumbnail.jpg?width=640&height=640&fit=bounds)

![[DSC Europe 25] Imai Jen-La Plante - The New Generation: AI and the Future of...](https://cdn.slidesharecdn.com/ss_thumbnails/kxi8t2l5rggivgcenyba-1-jenlaplante-dsc-251208152532-d1e076c2-thumbnail.jpg?width=640&height=640&fit=bounds)


![[DSC Europe 25] Nikolay Burlutskiy - Best Practices for Building Enterprise M...](https://cdn.slidesharecdn.com/ss_thumbnails/uirvaiuvq8y1w8hzd9tx-7-251212103249-2619edb4-thumbnail.jpg?width=640&height=640&fit=bounds)


![[DSC Europe 25] Bassam Maharmeh - Artificial Intelligence: Opportunities and ...](https://cdn.slidesharecdn.com/ss_thumbnails/thhfmr2fqpawzj7hsjpg-5-251211083048-2c23204f-thumbnail.jpg?width=640&height=640&fit=bounds)


![[DSC Europe 25] Branko Dzakula - From Defense to Attack: How AI Redefines Cyb...](https://cdn.slidesharecdn.com/ss_thumbnails/80bdzdxpr3ky2g0qvyk9-8-251211083048-ce5fc1ee-thumbnail.jpg?width=640&height=640&fit=bounds)
![[DSC Europe 25] Ivan Peric - Intelligence Swarm Logic and Techno-Functional M...](https://cdn.slidesharecdn.com/ss_thumbnails/7my7c97fsduiccadgavw-2-251212103249-5a03f7c6-thumbnail.jpg?width=640&height=640&fit=bounds)
![[DSC Europe 25] Miodrag Pesovic & Vladislav Radonjic - Federated Data Archite...](https://cdn.slidesharecdn.com/ss_thumbnails/gsbe3y5it5uhndi4e08e-1-251212103249-f1008e0c-thumbnail.jpg?width=640&height=640&fit=bounds)


![[DSC Europe 25] Behzad Hosseini - AI Agents in the Wild: Deploying Models tha...](https://cdn.slidesharecdn.com/ss_thumbnails/3qtejajvsjqrzwfept2c-10-251212103250-7f2b1068-thumbnail.jpg?width=640&height=640&fit=bounds)
![[DSC Europe 25] Dragana Ilic - AI for Big Data in Astronomy.pptx](https://cdn.slidesharecdn.com/ss_thumbnails/8palya86qaatvjhva1ms-2-dragana-ilic-ai-ilic-251208151906-652b819c-thumbnail.jpg?width=640&height=640&fit=bounds)