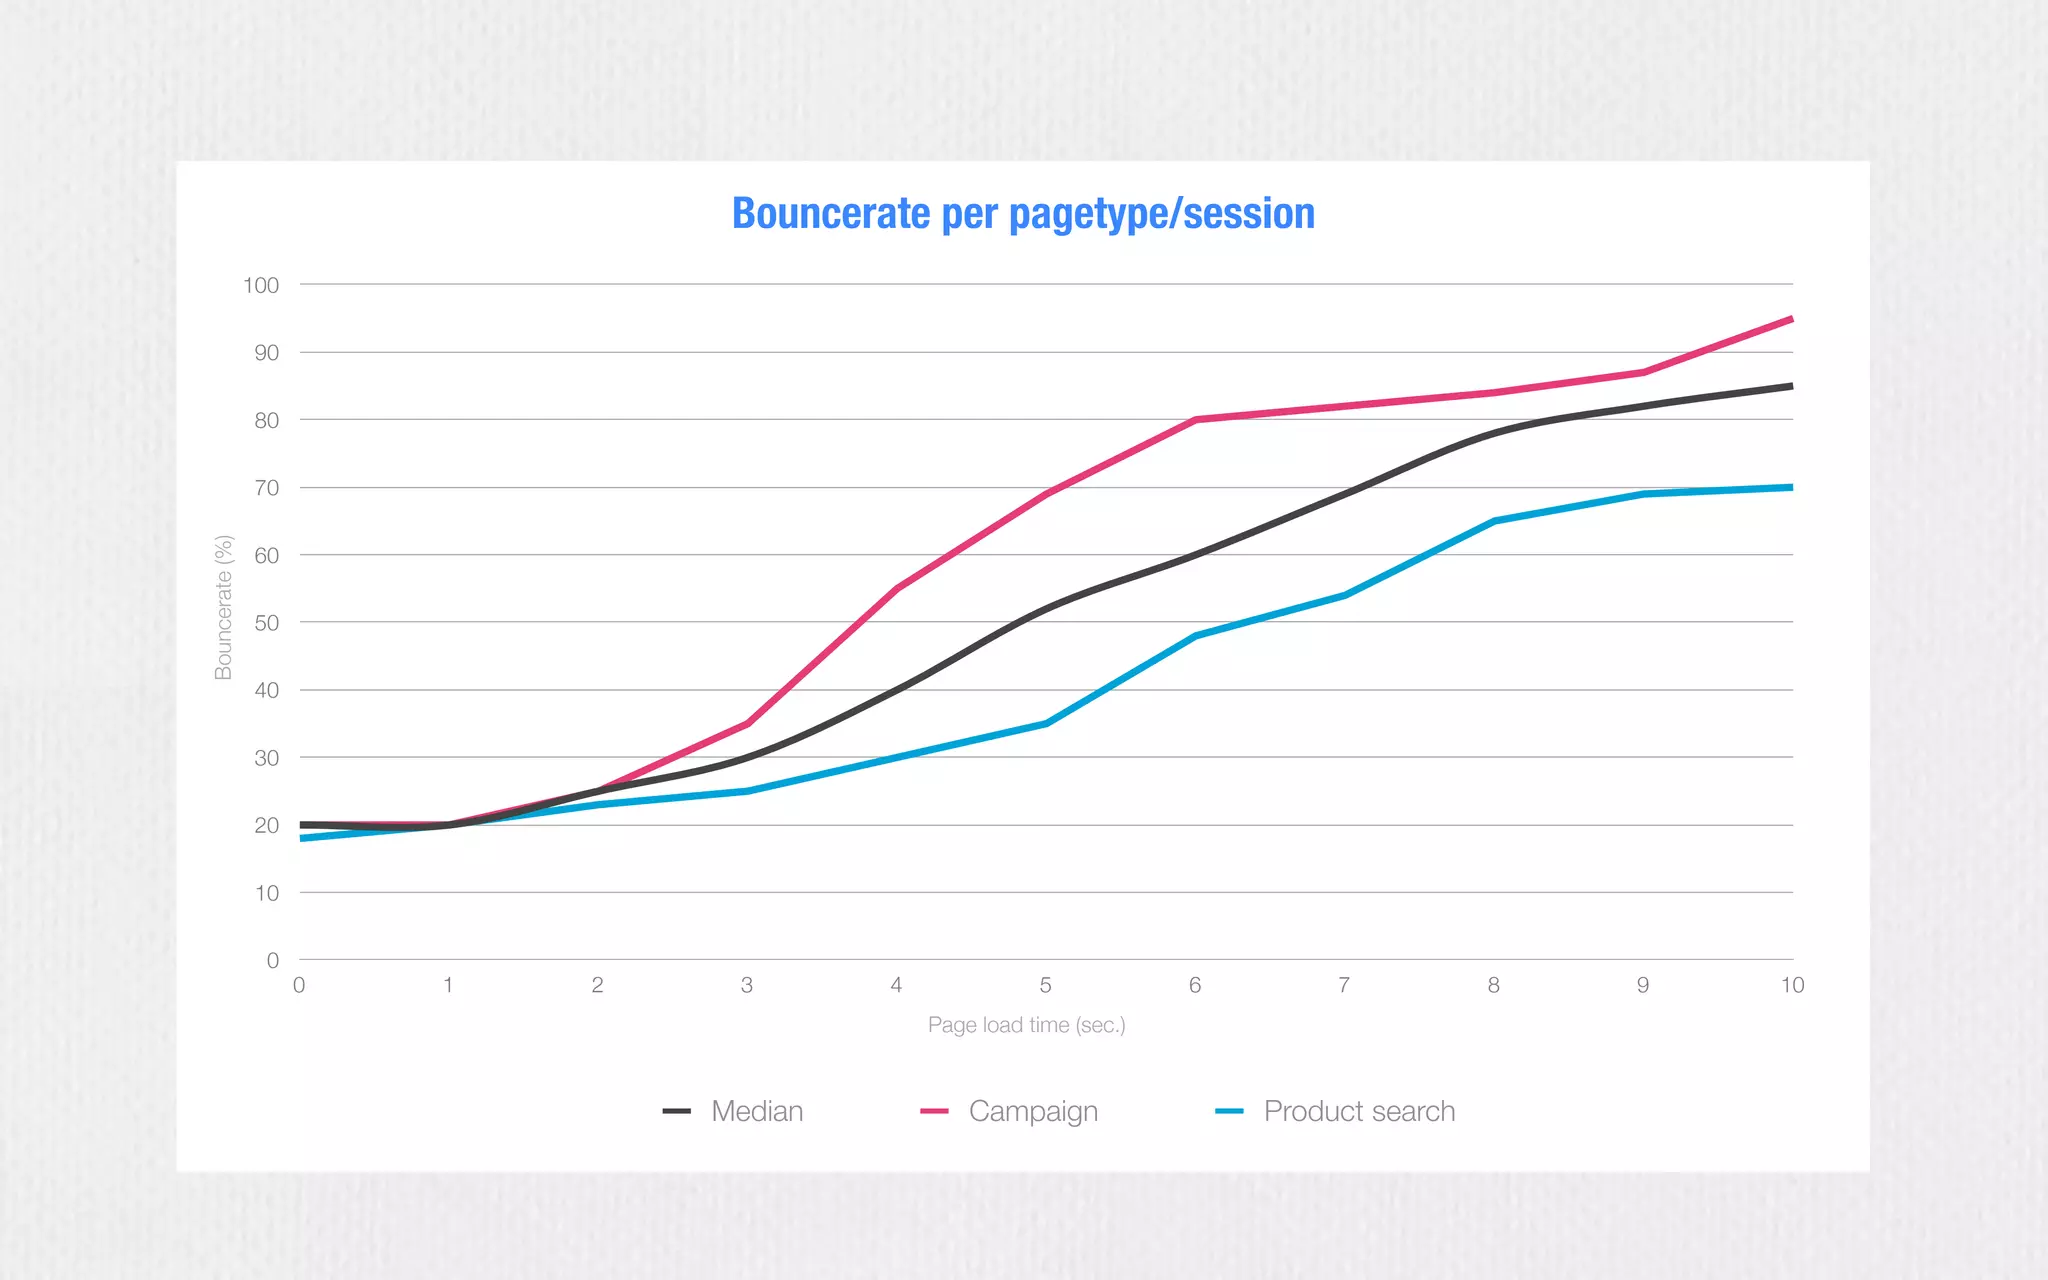
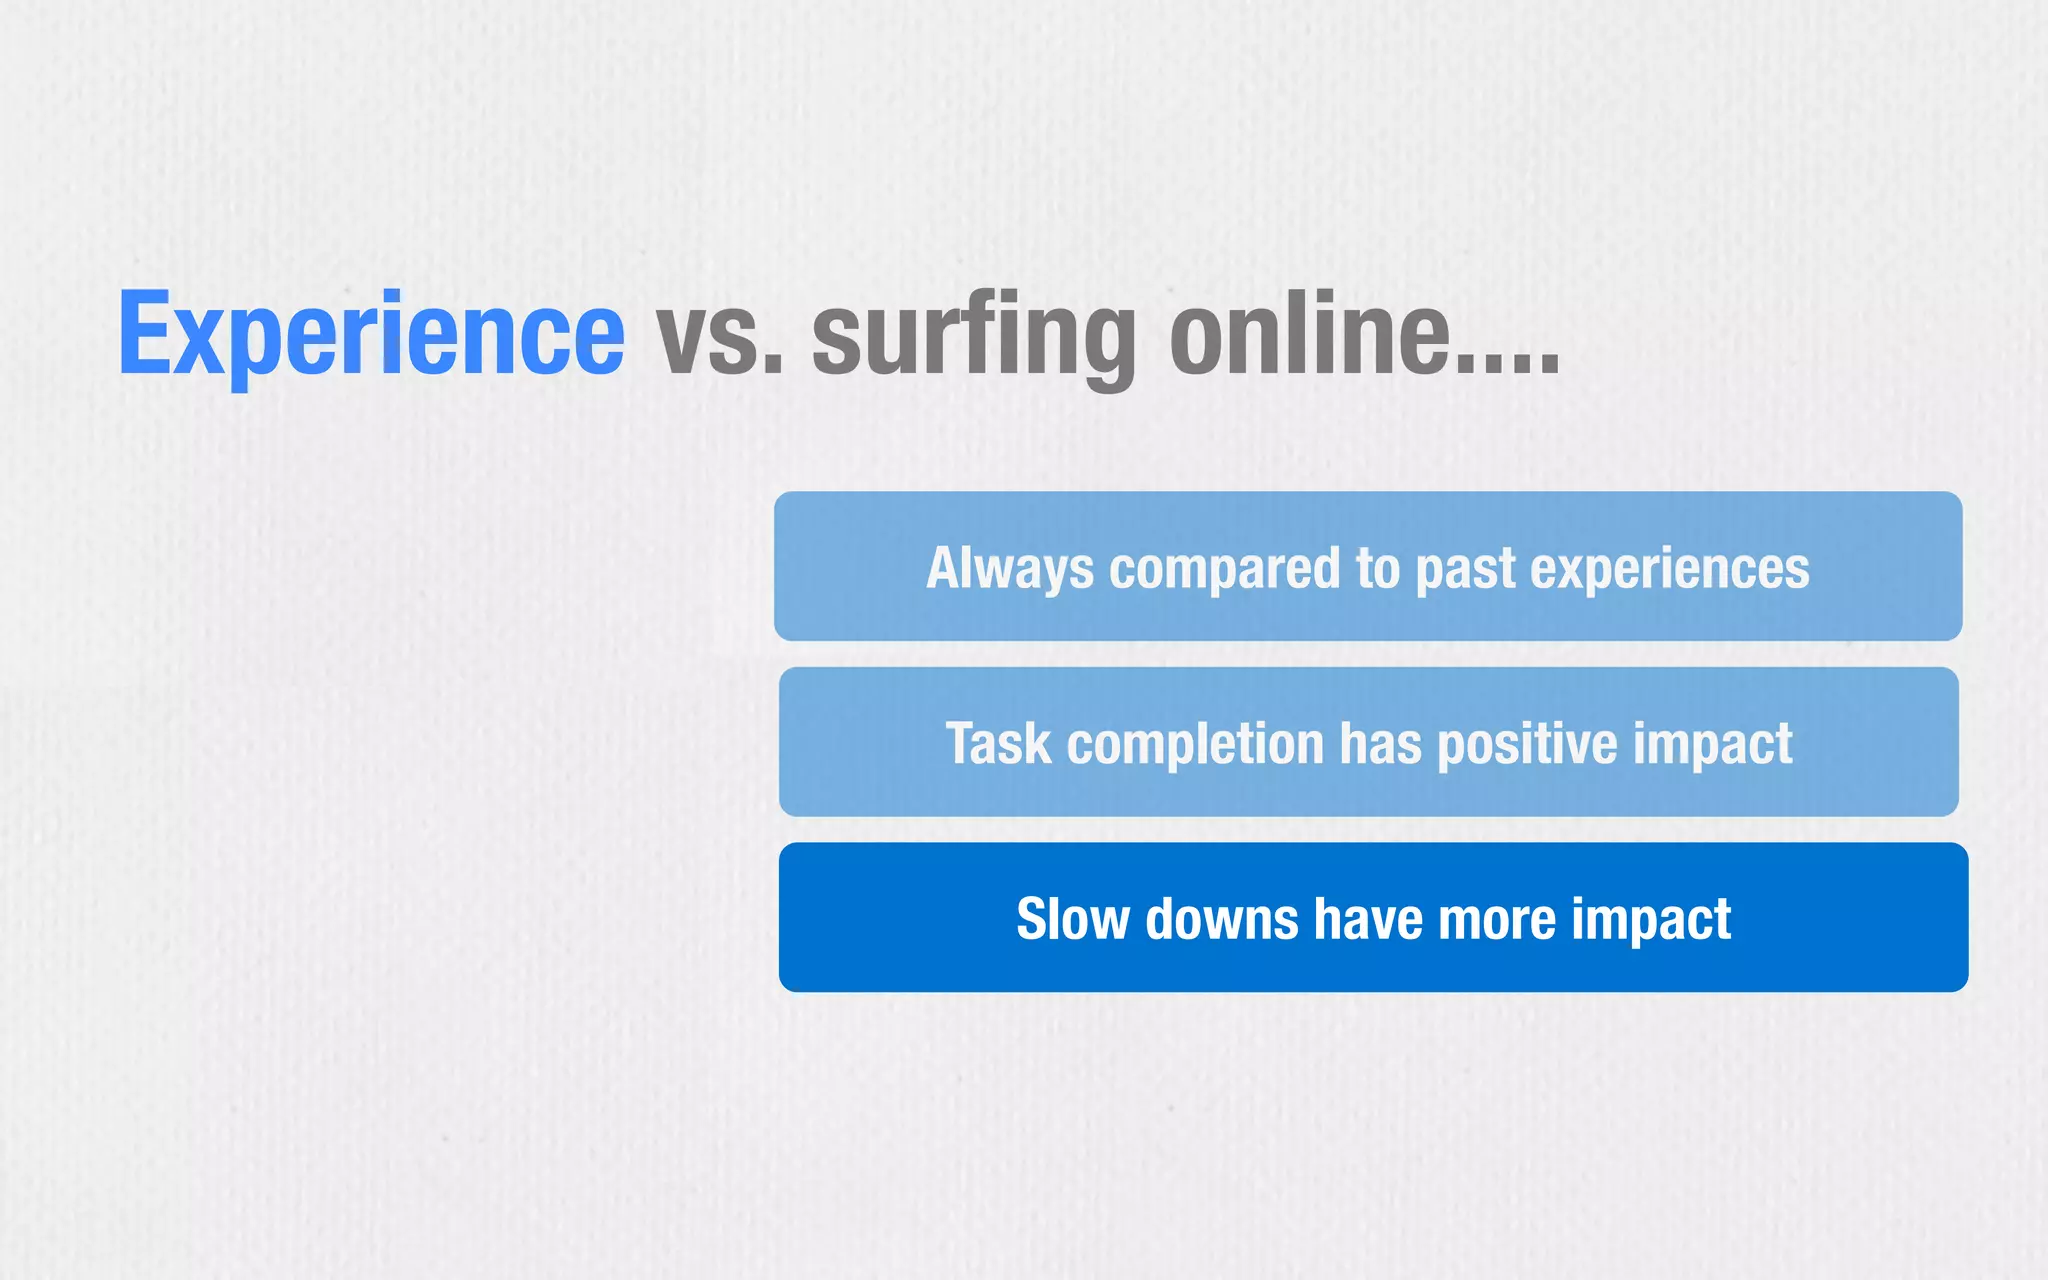
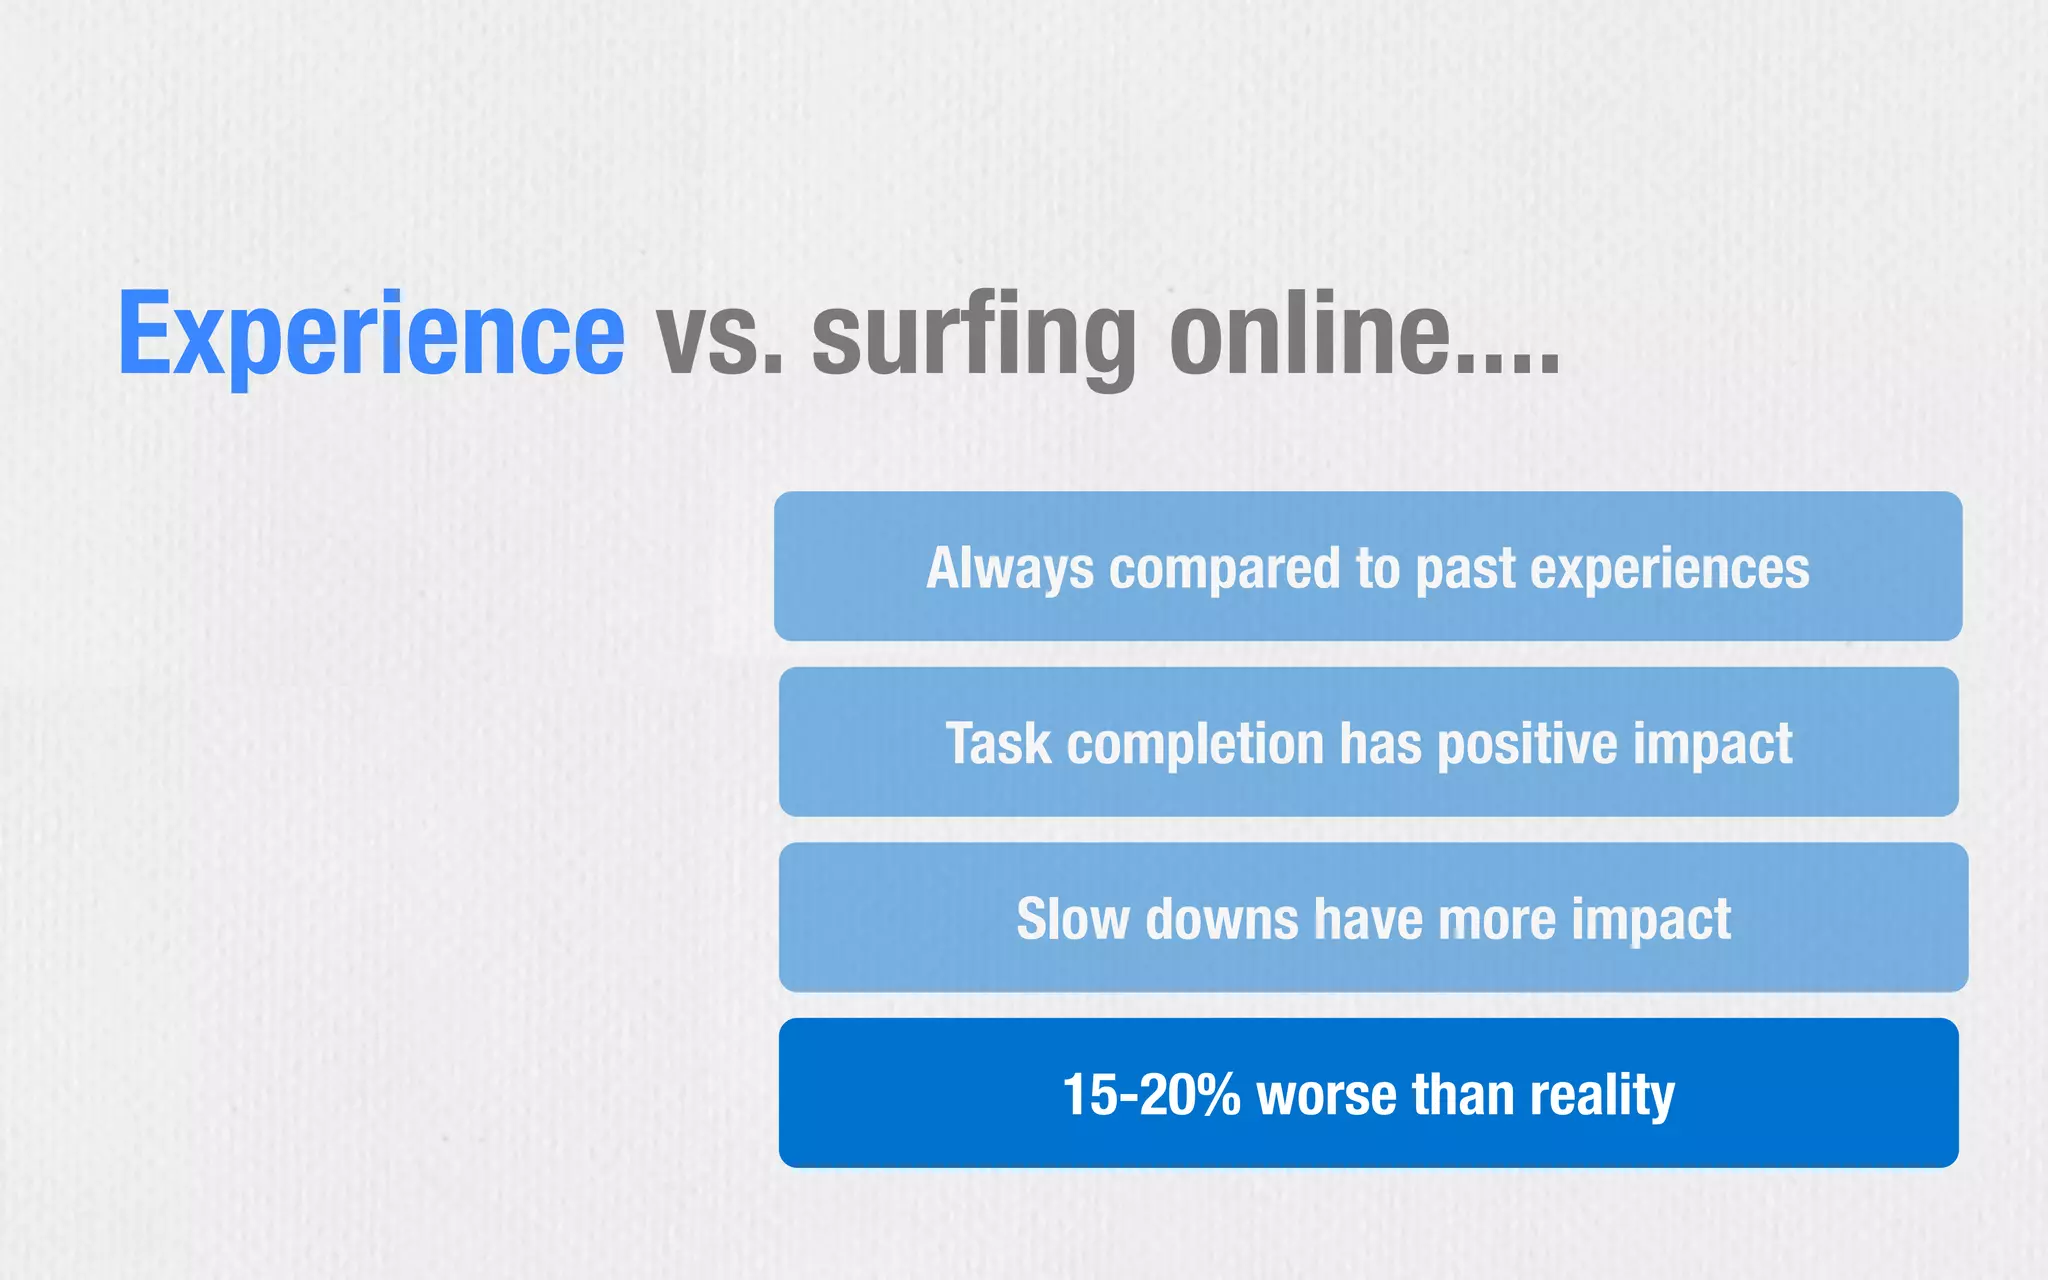
Why people don’t wait for you website to load
(and how to fix that)
@jeroentjepkema
DrupalJam 2014
Waiting = Engagement
Mobile browsing...
“Both offline and online consumers
associate long wait times with
poor customer service”
Click away slide
Performance tolerance
0
10
20
30
40
50
60
70
80
90
100
0 1 2 3 4 5 6 7 8 9 10
Bouncerate per pagetype/sessionBouncerate(%)
Page load time (sec.)
Median Campaign Product search
0
10
20
30
40
50
60
70
80
90
100
0 1 2 3 4 5 6 7 8 9 10
Bouncerate(%)
Page load time (sec.)
Median Campaign Product search
Bouncerate per pagetype/session
Purpose vs. Context
Online users often lack context for delays...
...and see no other option than to click away
Good Design
+
Fast Delivery
=
Great User Experience
NS Hispeed: Site optimization
0
12,5
25
37,5
50
62,5
75
87,5
100
0-0,5 0,5-1 1-1,5 1,5-2 2-2,5 2,5-3 3-3,5 3,5-4 4-5 5-6 6-7 7-8 8-9 9-10 >10
Non-Bouncerate(%)
Categorienaam
Pageviews(#)
Bouncerate # Pageviews
Bol.com: Speed vs. Engagement per month
Data presented by MeasureWorks at Velocity Conference London 2013: http://bit.ly/MW-VEUrum
Load time
Availability
Homepage
Transaction time
Availability
Ticket ordering funnel (7 steps)
Before After
11,5s
95,61%
3,8s
99,52%
Before After
43,2s
88,72%
35,7s
97,65%
30% higher
site success
rate
NS Hispeed: Site optimization
Design vs. Speed?
0
25
50
75
100
1 2 3 4 5
Slow Average Fast
%ofrespondentsthatratedtheactualwebsitespeed
Design score (1=bad - 5=beautiful)
Over 60% of people that experienced a slow website ranked
design 2 points lower compared to a fast experience
So... why doesn’t everybody have a
fast website?
Trouble is stickyness?
Gum/Shoe
How to make performance stick?
Design for experience!
Source: Jakob Nielsen
99% of time online is spent on other sites
than yours...
Experience vs. surfing online....
Always compared to past experiences
Experience vs. surfing online....
Task completion has positive impact
Always compared to past experiences
Experience vs. surfing online....
Task completion has positive impact
Slow downs have more impact
Always compared to past experiences
Experience vs. surfing online....
15-20% worse than reality
Task completion has positive impact
Slow downs have more impact
Always compared to past experiences
Experience vs. surfing online....
Consumers visit 18-23 travel websites
before they finally convert
Source: TNS/Nipo
Search/Orientation phase
Perception of experience
1
Performance influence cycle
http://twinkle100.measureworks.nl
Delivered
experience
Your website
3
5
2
Stimulate content/
conversion
4
Performance influence cycle
Search/Orientation phase
Perception of experience
1
http://twinkle100.measureworks.nl
The waiting experience
Performance vs.
Performance vs. Content
What’s your time to first tweet?
https://blog.twitter.com/2012/improving-performance-on-twittercom
3 (performance) design questions to ask...
Above the fold?
Which priority?
Improving which metrics?
Why do we need that Carousel?
Priority 1
Priority 1
Priority 2
Priority 1
Priority 2
Priority 3
Priority?
Tested on iPhone with webpagetest.org (3G traffic shaping, 2000Kbps Down, 764Kbps Up, 150ms latency)
Performance vs. Perception
http://www.nytimes.com/2012/08/19/opinion/sunday/why-waiting-in-line-is-torture.html?pagewanted=all&_r=0
http://answers.yahoo.com/question/index?qid=1005081200005
nytimes.com/2004/02/27/nyregion/27BUTT.html
Perception = Fast Experience
http://www.fastcodesign.com/1669788/the-3-white-lies-behind-instagrams-lightning-speed
@jeroentjepkema, MeasureWorks
How fast should I be?
“Speed is at it’s best when it creates the feeling
that you don’t have to work to achieve your goal”
0,3
0 Source: Jakob Nielsen
Instantaneous: I like it!
1
0,3
0 Source: Jakob Nielsen
Instantaneous: I like it!
Interaction: Let’s conversate...
1
0,3
0 Source: Jakob Nielsen
Instantaneous: I like it!
Interaction: Let’s conversate...
1
3
0,3
0 Source: Jakob Nielsen
Instantaneous: I like it!
Interaction: Let’s conversate...
Mmm, shall I click away?
10
1
3
0,3
Instantaneous: I like it!
Interaction: Let’s conversate...
Mmm, shall I click away?
Only if the task/content is relevant
0 Source: Jakob Nielsen
Don’t stop with one page:
Flow state
Provide relevant content to
support task completion...
...deliver it fast, focus on perception!
The bottom line...
Performance vs. Diet
WiFi 4G 3G
What happens if I don’t optimize?
Tested with webpagetest.org (WiFi (10Mbs down/1,5Mbs up), 4G (5Mbps Down, 1Mbps Up) & 3G (2000Kbps Down, 764Kbps Up))
Responsive Web Design?
WiFi 3G
Tested with webpagetest.org (WiFi (10Mbs down/1,5Mbs up), 4G (5Mbps Down, 1Mbps Up) & 3G (2000Kbps Down, 764Kbps Up))
A typical webpage...
A set of resources to be fetched from a server...
The browser performs it’s job...
This results in the page being displayed on your
screen
1
2
3
1. DNS resolution
2. TCP connection
3. Send request
4. Wait for response
5. Download response
6. Parse (DOM, CSSOM)
7. Execute JS/Apply CSS
8. Compose Layout
9. Render
1. DNS resolution
2. TCP connection
3. Send request
4. Wait for response
5. Download response
6. Parse (DOM, CSSOM)
7. Execute JS/Apply CSS
8. Compose Layout
9. Render
Server
1. DNS resolution
2. TCP connection
3. Send request
4. Wait for response
5. Download response
6. Parse (DOM, CSSOM)
7. Execute JS/Apply CSS
8. Compose Layout
9. Render
Network
Server
1. DNS resolution
2. TCP connection
3. Send request
4. Wait for response
5. Download response
6. Parse (DOM, CSSOM)
7. Execute JS/Apply CSS
8. Compose Layout
9. Render
Network
Client
Server
1. DNS resolution
2. TCP connection
3. Send request
4. Wait for response
5. Download response
6. Parse (DOM, CSSOM)
7. Execute JS/Apply CSS
8. Compose Layout
9. Render
85-90% of performance
happens in the browser
Network
Client
Server
When it comes to optimization...
...we have our own golden rules
visit www.stevesouders.com for more background or check your site via
https://developers.google.com/speed/pagespeed/insights/
Size reduction, Quality, Latency
Low hanging fruit...
Images
63 17
6
16
57
24
6
13
49
38
7
6
Retail Travel Finance
HTML CSS Javascript Images
% type of element per webpage/industry
(avg. homepage/productpage from benchmark.measureworks.nl)
Reduce image size
(tool imgoptim.com)
Sprite your images....
84 request
84 request Combine 25 to 1 sprite
First Byte time
0
1
2
3
4
5
1 2 3 4 5 6 7 8 9 10 11 12 13 14 15
Daily Median Min Max
0
1
2
3
4
5
1 2 3 4 5 6 7 8 9 10 11 12 13 14 15
Daily Median Min Max
Revenue riskedRevenue risked
above 15-20% variance is detected
0"
2"
4"
6"
8"
10"
12"
14"
"15"april"."8"
16"
0"
"16"april"."8"
16"
0"
"17"april"."8"
16"
0"
"18"april"."8"
16"
0"
"19"april"."8"
16"
0"
"20"april"."8"
16"
0"
"21"april"."8"
16"
0"
"22"april"."8"
16"
0"
"23"april"."8"
16"
0"
"24"april"."8"
16"
0"
"25"april"."8"
16"
0"
"26"april"."8"
16"
0"
"27"april"."8"
16"
0"
"28"april"."8"
16"
0"
"29"april"."8"
16"
Uur$van$de$dag$
Laad,jden$klikpaden$(per$uur)$
Solliciteren"
Korte"naviga;e"
0"
0,5"
1"
1,5"
2"
2,5"
3"
3,5"
4"
4,5"
15" 23" 7" 15" 23" 7" 15" 23" 7" 15" 23" 7" 15" 23" 7" 15" 23" 7" 15" 23" 7" 15" 23" 7" 15" 23" 7" 15" 23" 7" 15" 23" 7" 15" 23" 7" 15" 23" 7" 15" 23" 7" 15"
DNS"Lookup"Time"
Connect"Time"
Time"to"First"Byte"
Content"Download"
Redirect"Time"
Not Optimized
Page size:
1660 Kb
Time to render:
1,97 sec.
# requests:
89
Document complete:
3,68 sec.
Not Optimized
Page size:
1660 Kb
Time to render:
1,97 sec.
# requests:
89
Document complete:
3,68 sec.
OptimizedNot Optimized
Page size:
1660 Kb
Time to render:
1,97 sec.
# requests:
89
Document complete:
3,68 sec.
Page size:
498 Kb
Time to render:
1,03 sec.
# requests:
48
Document complete:
1,54 sec.
OptimizedNot Optimized
Page size:
1660 Kb
Time to render:
1,29 sec.
# requests:
89
Document complete:
3,68 sec.
Page size:
498 Kb
Time to render:
1,10 sec.
# requests:
48
Document complete:
1,54 sec.
OptimizedNot Optimized
Time to first visual:
1,03 sec. vs 1,97 sec.
Put your website on a diet...
Metrics to target for:*
Perception
Actionable
Flow
Time to first paint 0.5 - 1 sec.
Time to interact: 1-3 sec
Variation < 20% between pages
* For mobile the target is “screen actionable in 1 sec.”
But, optimization never ends...
Performance vs. Analytics
donothing.com
Defining Service Levels
A practical (and easy DIY) example:
Purchasing a book,
must be completed (speed),
where every page loads under 3 sec.,
from any location in the Netherlands,
for 90% of all users,
every day between 6am and 12pm,
using IE9 and higher,
Customer journey
Metric: Speed
Target: Sec
User scenario
User locations
Percentile
Service Window
measured with Real User Monitoring. Monitoring type
Read more: Metrics 101, Velocityconf 2010
Repeatable, End-User focused & Quantifiable
Data presented by MeasureWorks at Velocity Conference London 2013: http://bit.ly/MW-VEUrum
0
12,5
25
37,5
50
62,5
75
87,5
100
0-0,5 0,5-1 1-1,5 1,5-2 2-2,5 2,5-3 3-3,5 3,5-4 4-5 5-6 6-7 7-8 8-9 9-10 >10
Non-Bouncerate(%)
Categorienaam
Pageviews(#)
Bouncerate # Pageviews
Bol.com: Speed vs. Engagement per month
0
12,5
25
37,5
50
62,5
75
87,5
100
0-0,5 0,5-1 1-1,5 1,5-2 2-2,5 2,5-3 3-3,5 3,5-4 4-5 5-6 6-7 7-8 8-9 9-10 >10
Non-Bouncerate(%)
Categorienaam
Pageviews(#)
Bouncerate # Pageviews
Bol.com: Speed vs. Engagement per month
Non-Bounce Mobile
LD50: 4.85 sec.
Baseline: 2,7 sec.
Poverty Line: 10,6 sec.
Data presented by MeasureWorks at Velocity Conference London 2013: http://bit.ly/MW-VEUrum
“Every release should be better or
equal to previous version”
Measuring the right data
Application Delivery Chain
INTERNET CUSTOMERS
Third-party/
Cloud Services
Content
Delivery
Networks
Local
ISP
Mobile
Carriers
Major
ISP
INTERNAL USERS(CLOUD) DATA CENTER
Storage DB Servers Web Servers
App
Servers
Middleware
ServersMainframe
Load
Balancers
Network
INTERNET CUSTOMERS
Third-party/
Cloud Services
Content
Delivery
Networks
Local
ISP
Mobile
Carriers
Major
ISP
INTERNAL USERS(CLOUD) DATA CENTER
Storage DB Servers Web Servers
App
Servers
Middleware
ServersMainframe
Load
Balancers
Network
Application Delivery Chain
This is what you control This is what you’re blamed for
Measuring performance?
Measuring performance? Always outside-
in, from the browser perspective...
2 ways of measuring performance...
Synthetic
Monitoring
Periodic, simulated, measurement of performance
Go check your site @
Webpagetest.org
(For settings: Akamai State of the Internet)
Ultimately, synthetic monitoring shows you if your
site’s working or not...
(best used for operations and service reports)
Real User
Monitoring
The problem with synthetic...
Synthetic heartbeat
Real Users
..it’s ‘a’ user, not your end user
Relies on navigation timing API, custom variables can be added
Turn on
“Site Speed”
in your GA
account!
http://bit.ly/1ivGWTt
Or try
Soasta mPulse
http://bit.ly/I5ngs8
Ultimately, Real User Monitoring shows you how many
users are affected by bad performance...
(best used for capacity management and conversion optimization)
One truth to rule them all...
Questions so far?
The art of staying fast
1. Understand your customer
The art of staying fast
1. Understand your customer
2. Prioritize content
The art of staying fast
1. Understand your customer
2. Prioritize content
3. Deliver fast
The art of staying fast
1. Understand your customer
2. Prioritize content
3. Deliver fast
4. Design to be measurable
The art of staying fast
1. Understand your customer
2. Prioritize content
3. Deliver fast
4. Design to be measurable
5. Repeat this for every iteration
The art of staying fast
Join the movement #fastweb
Thanks! More questions?
M: jtjepkema@measureworks.nl
T: @jeroentjepkema
W: www.measureworks.nl
View slides: bit.ly/MW-DJAM14

MeasureWorks - Why people hate to wait for your website to load (and how to fix that)