Download as POTX, PPTX

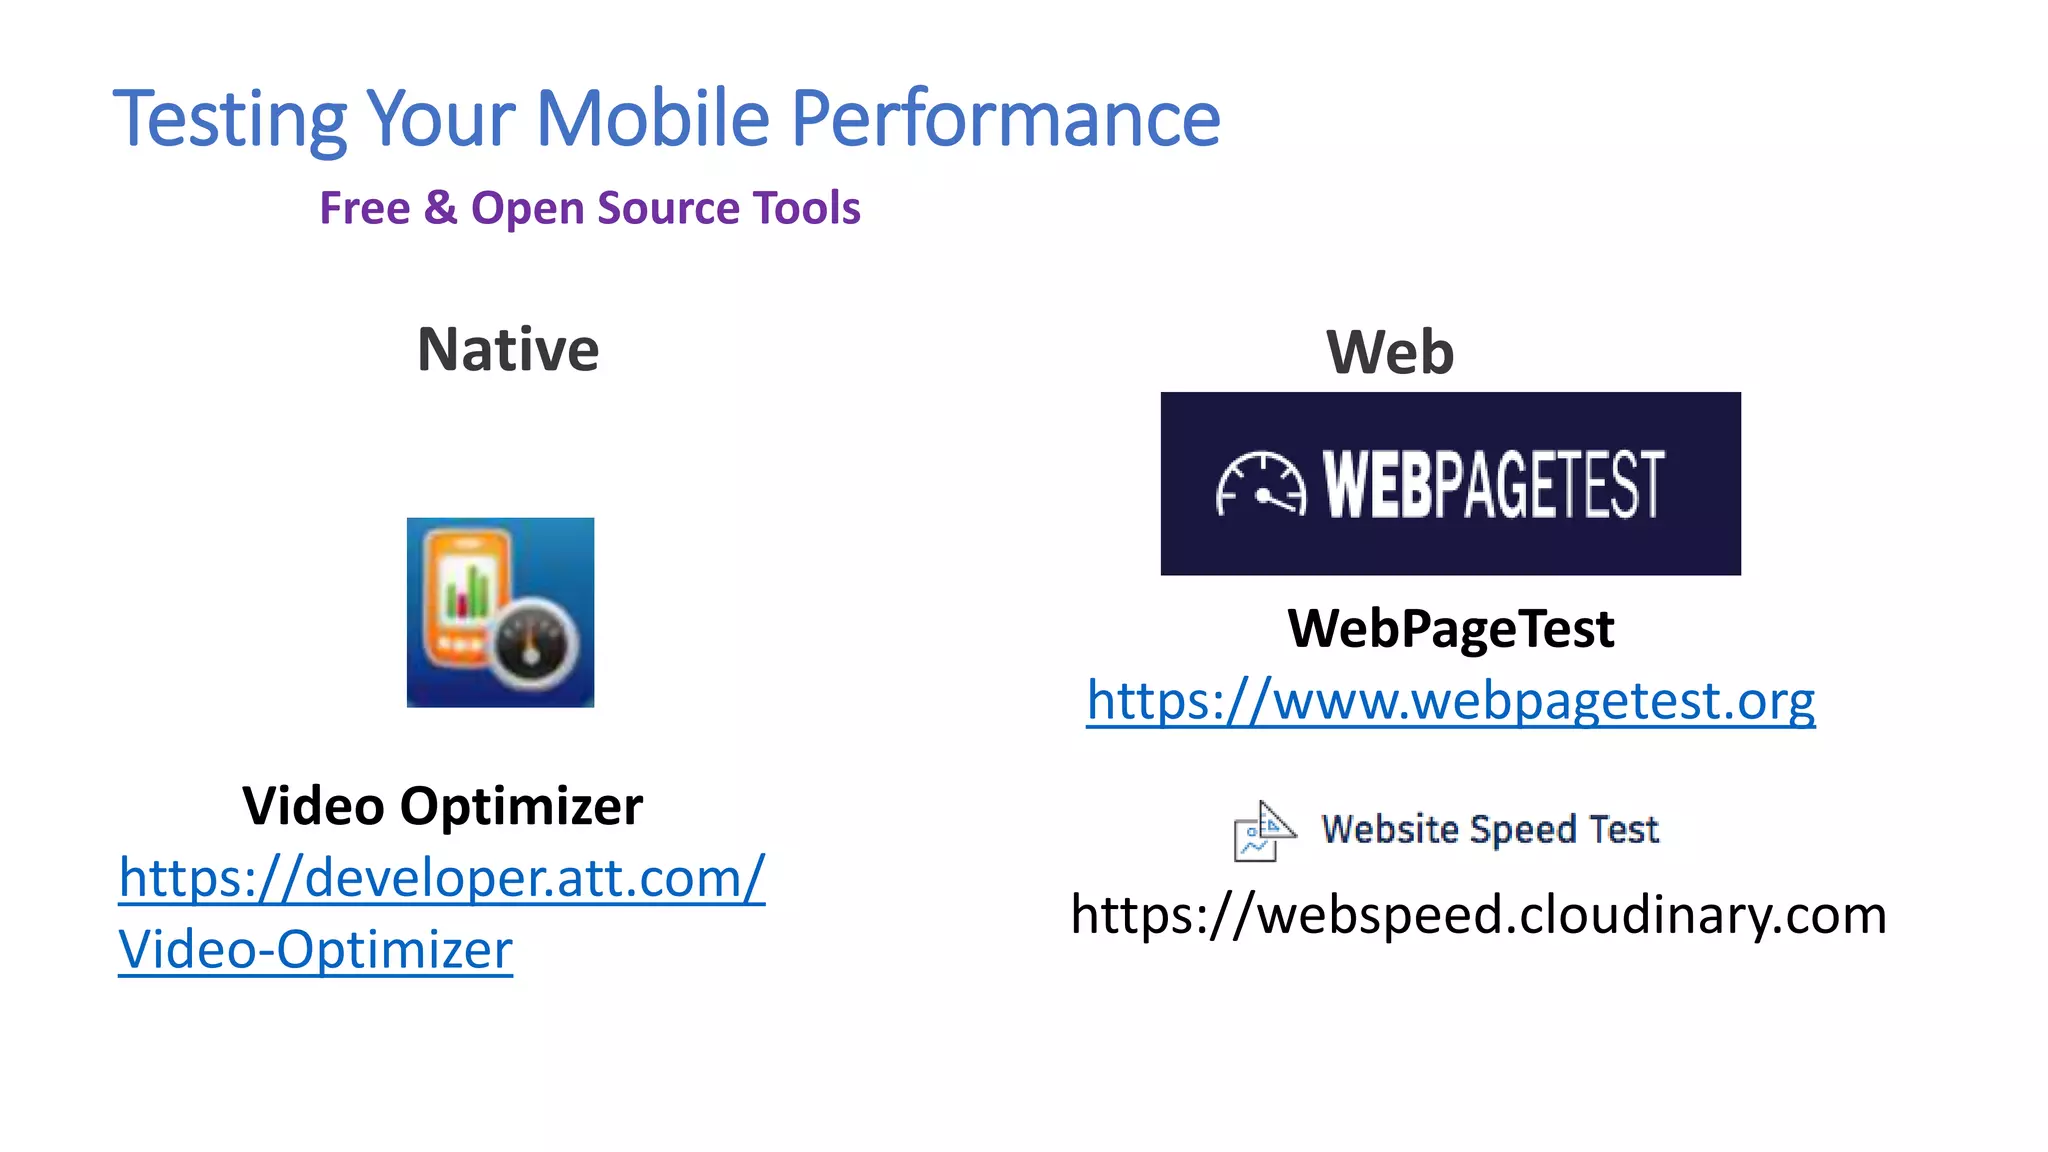
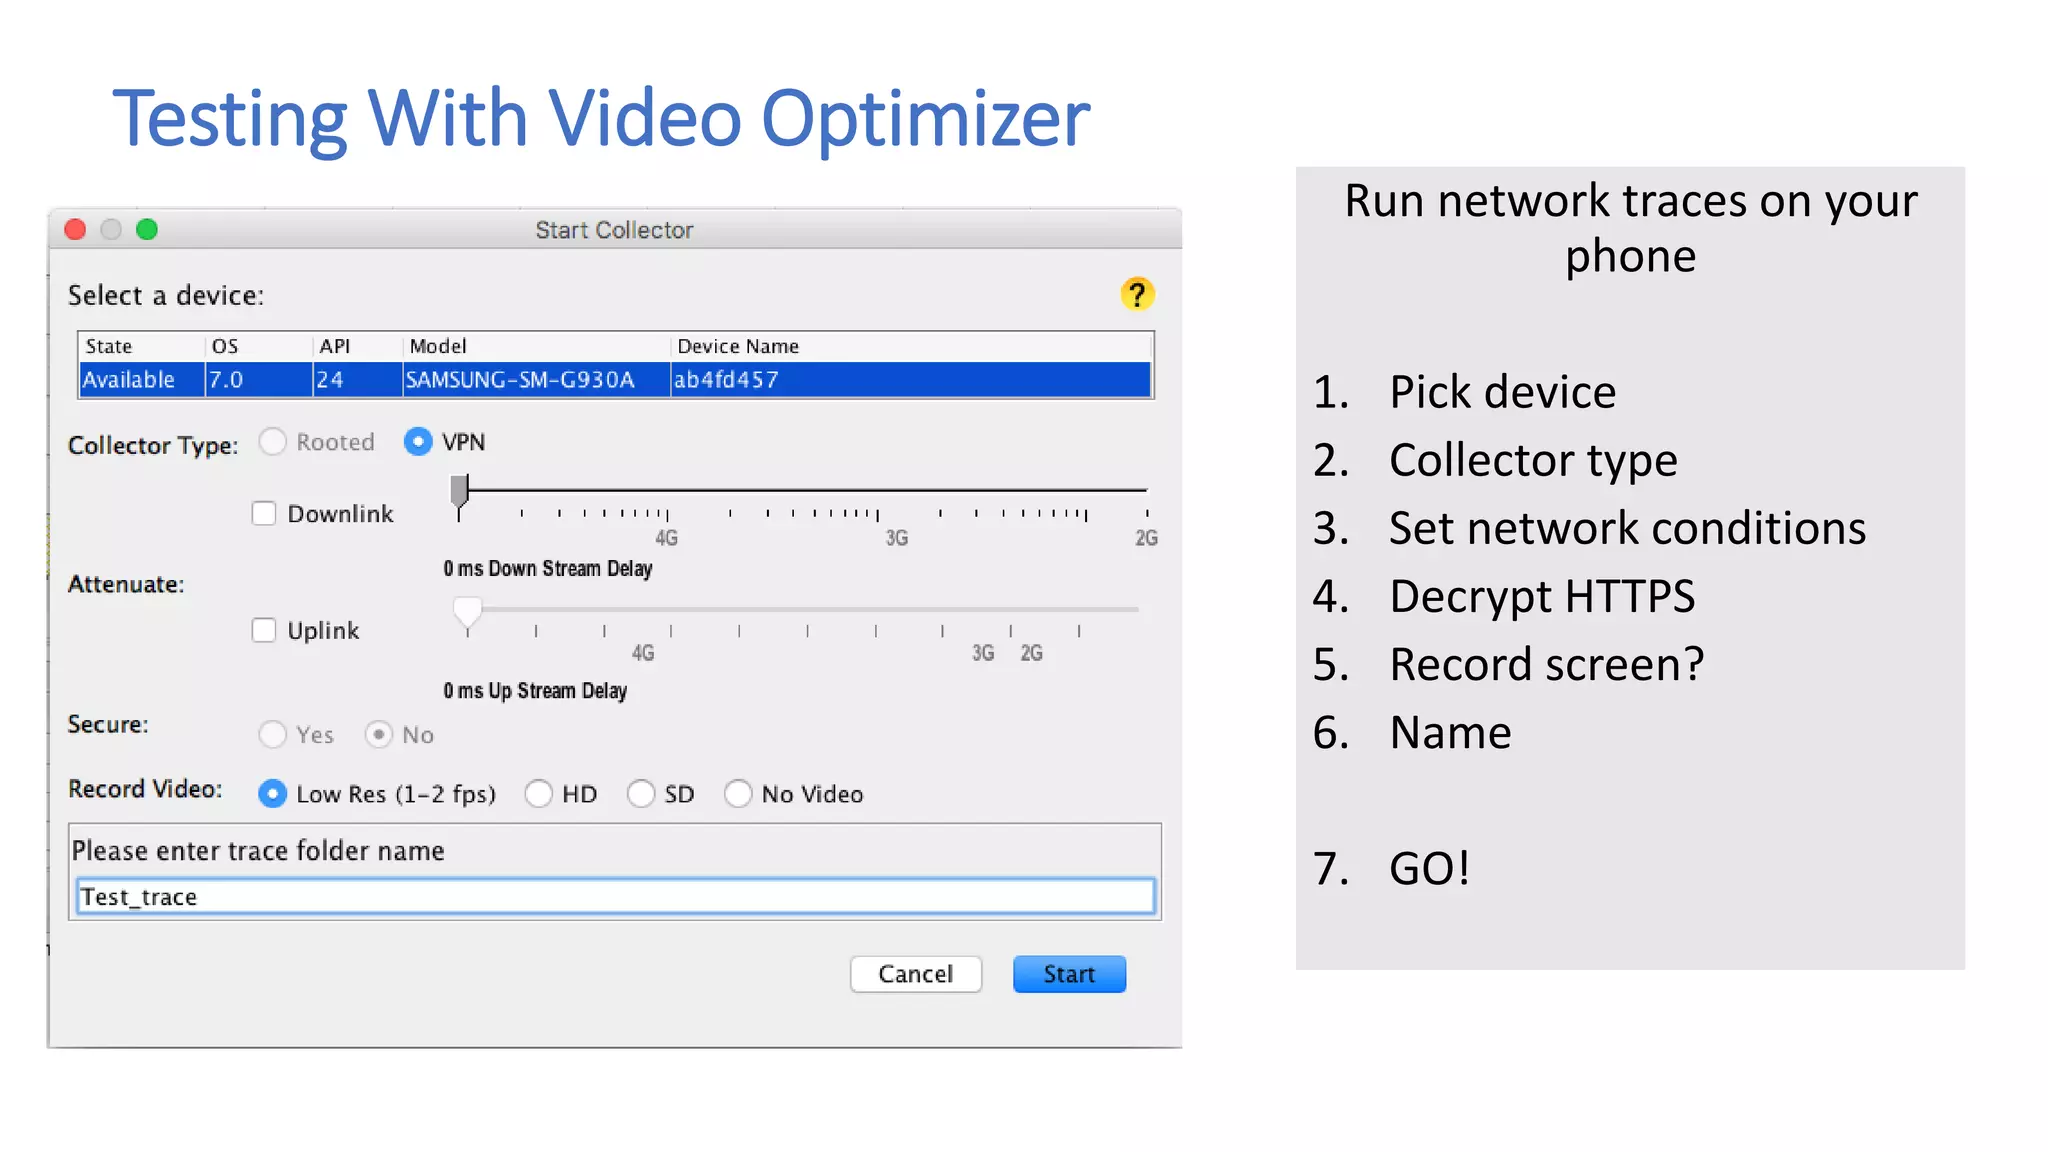
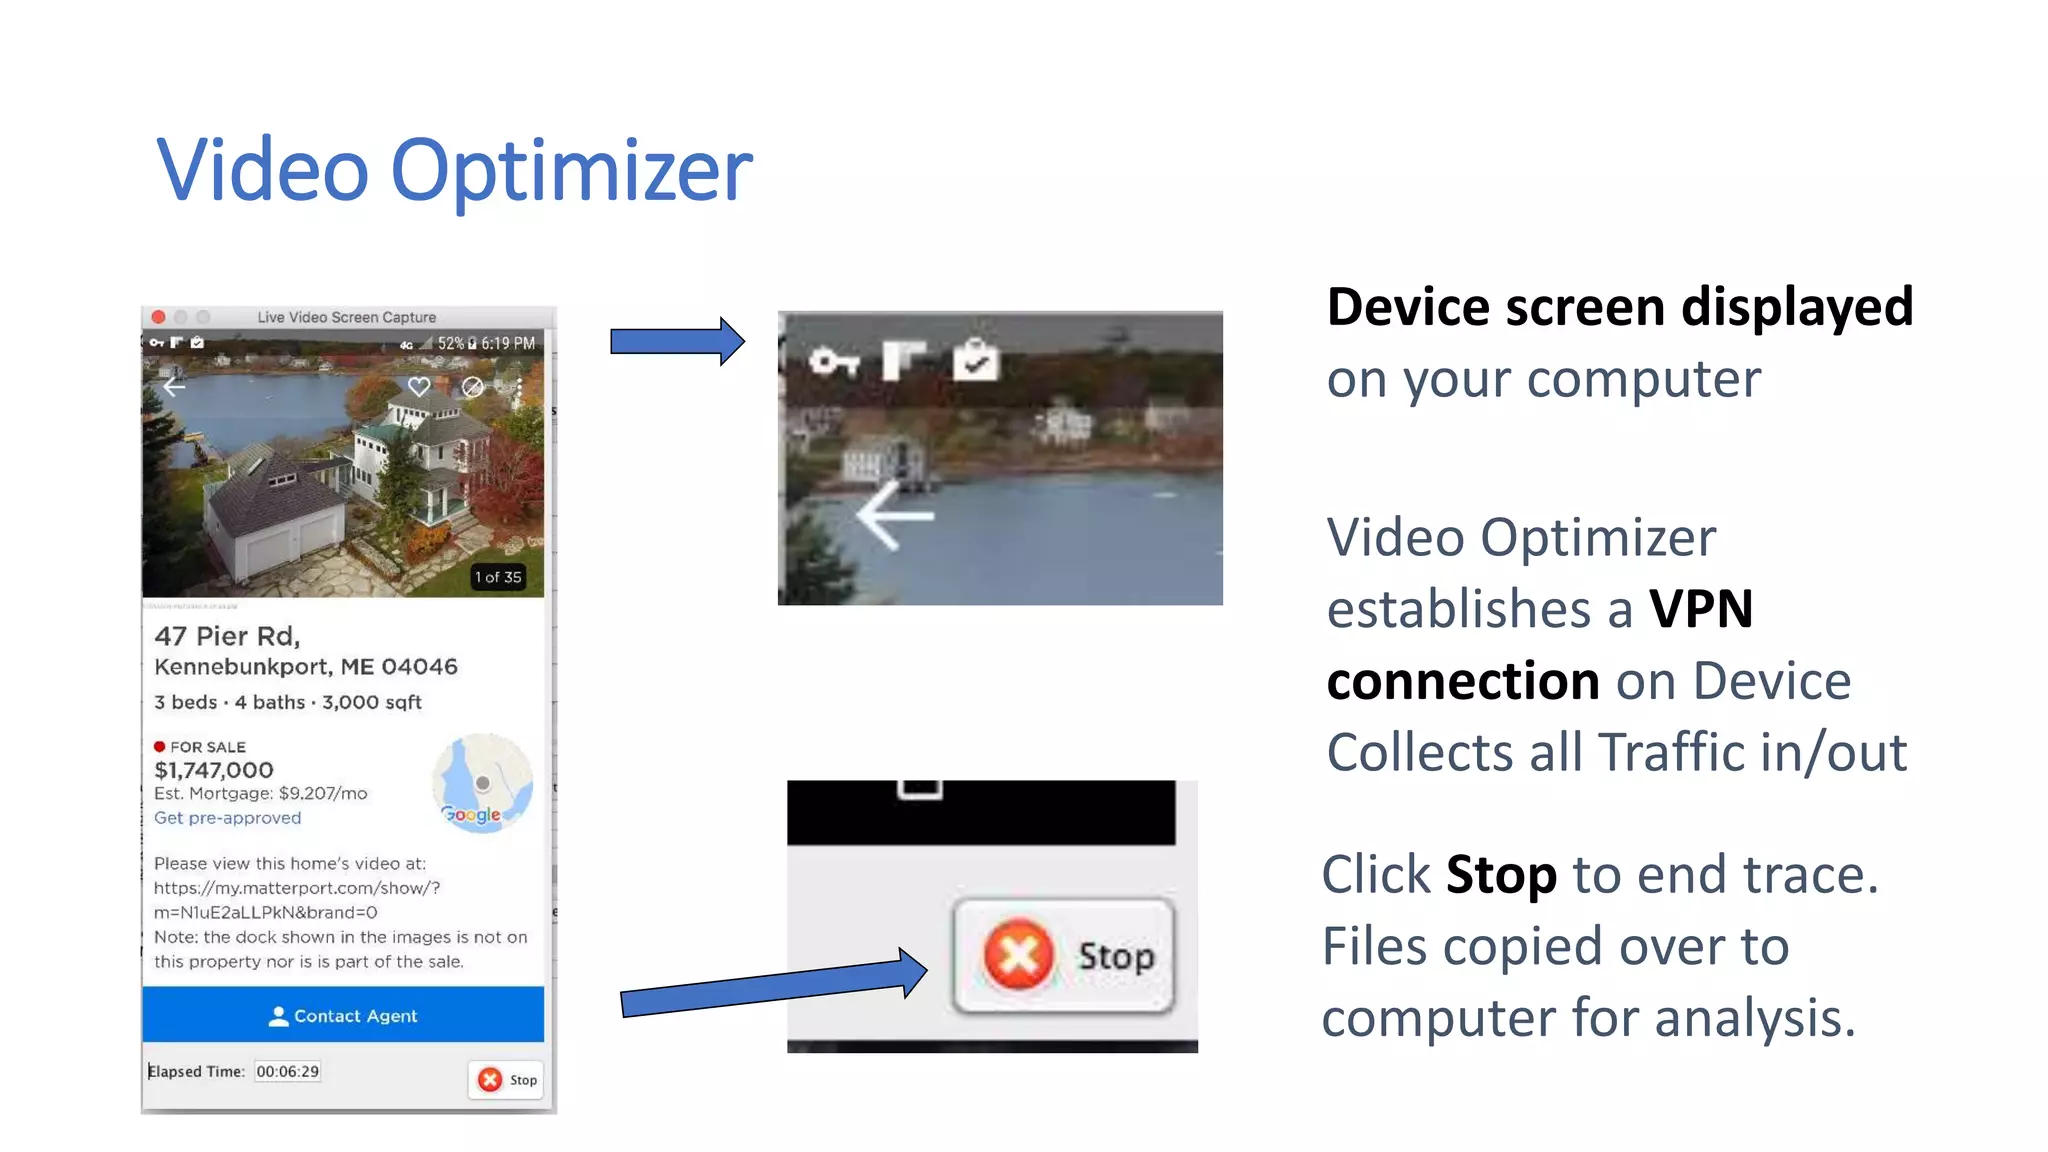
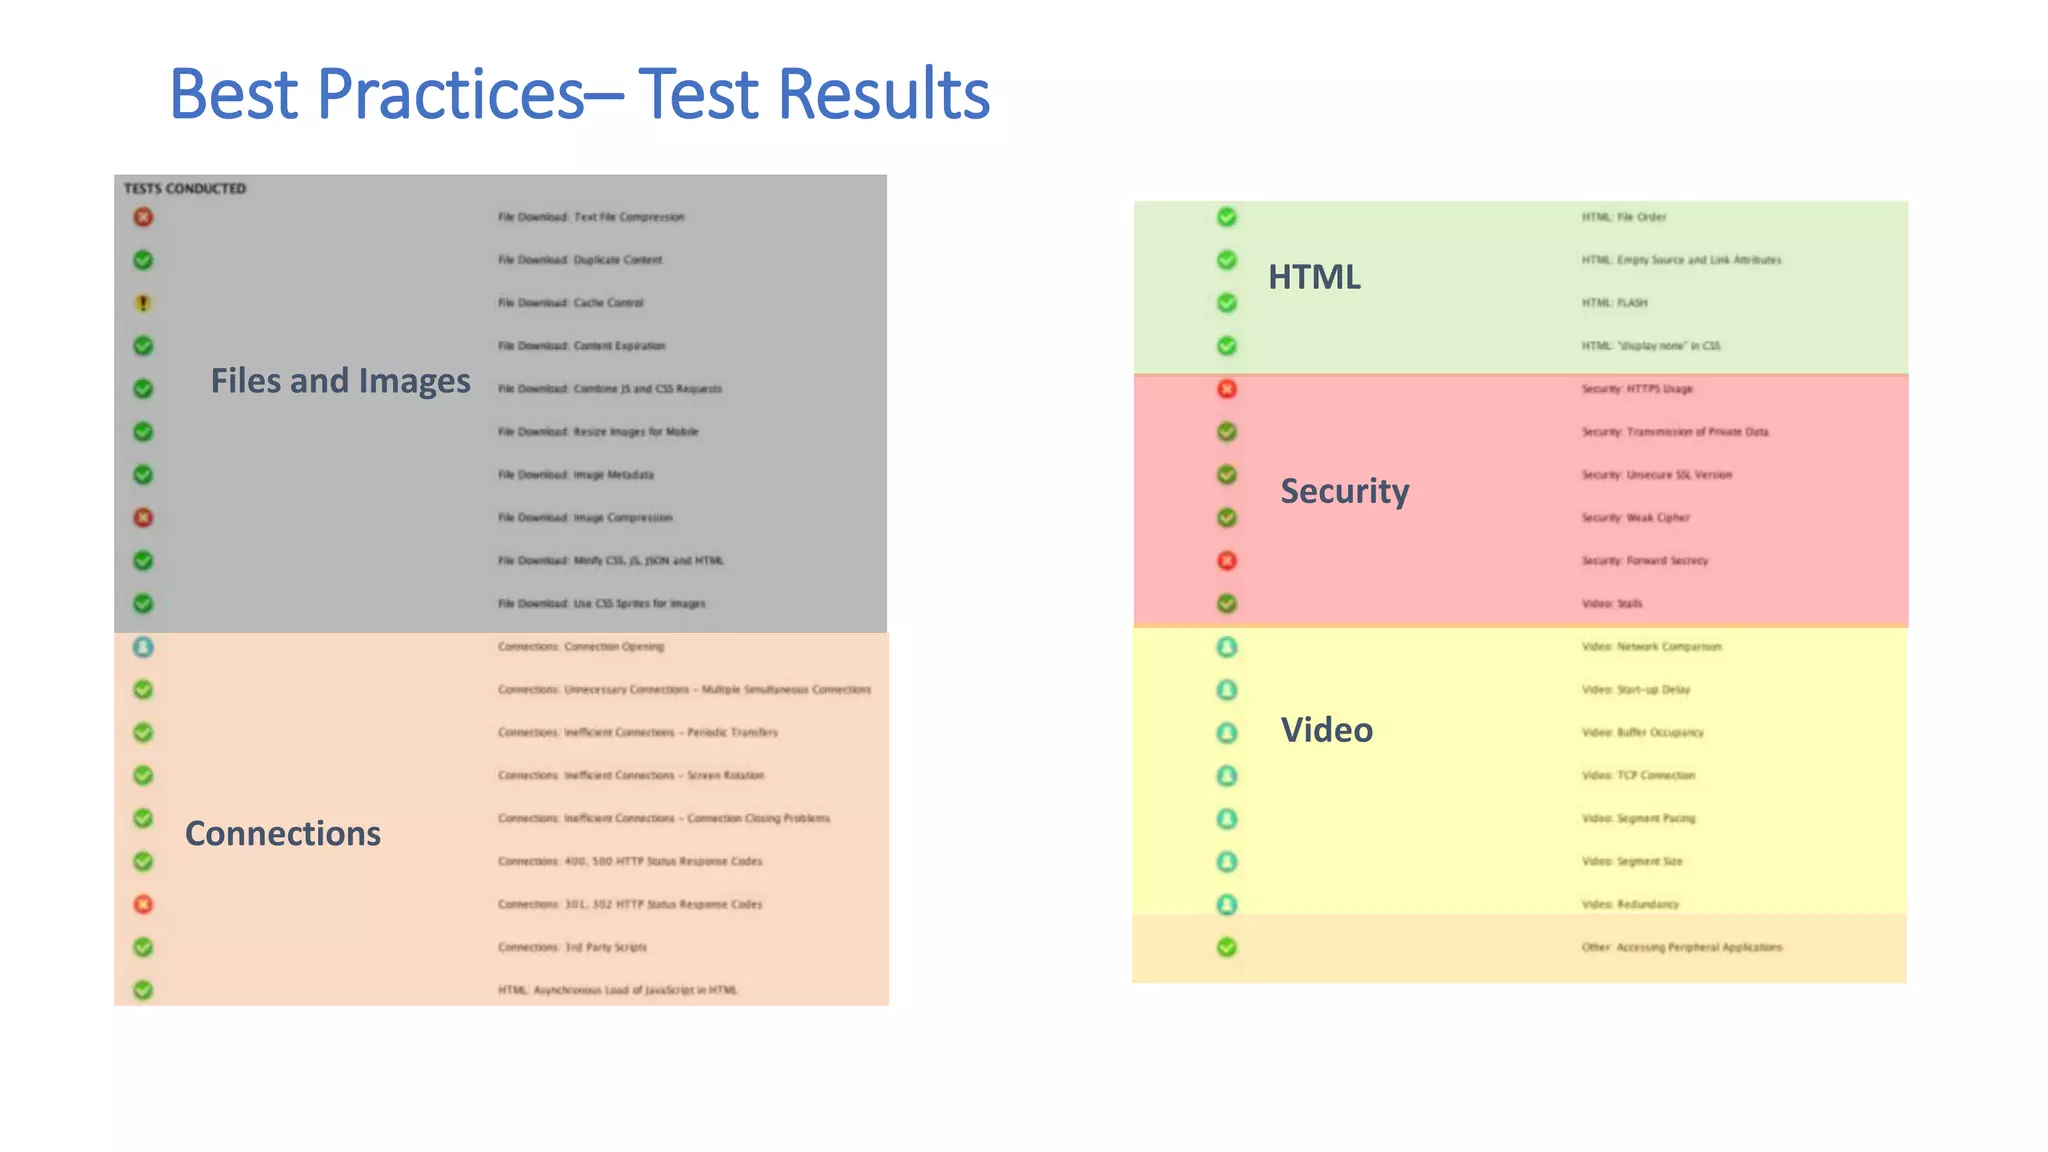
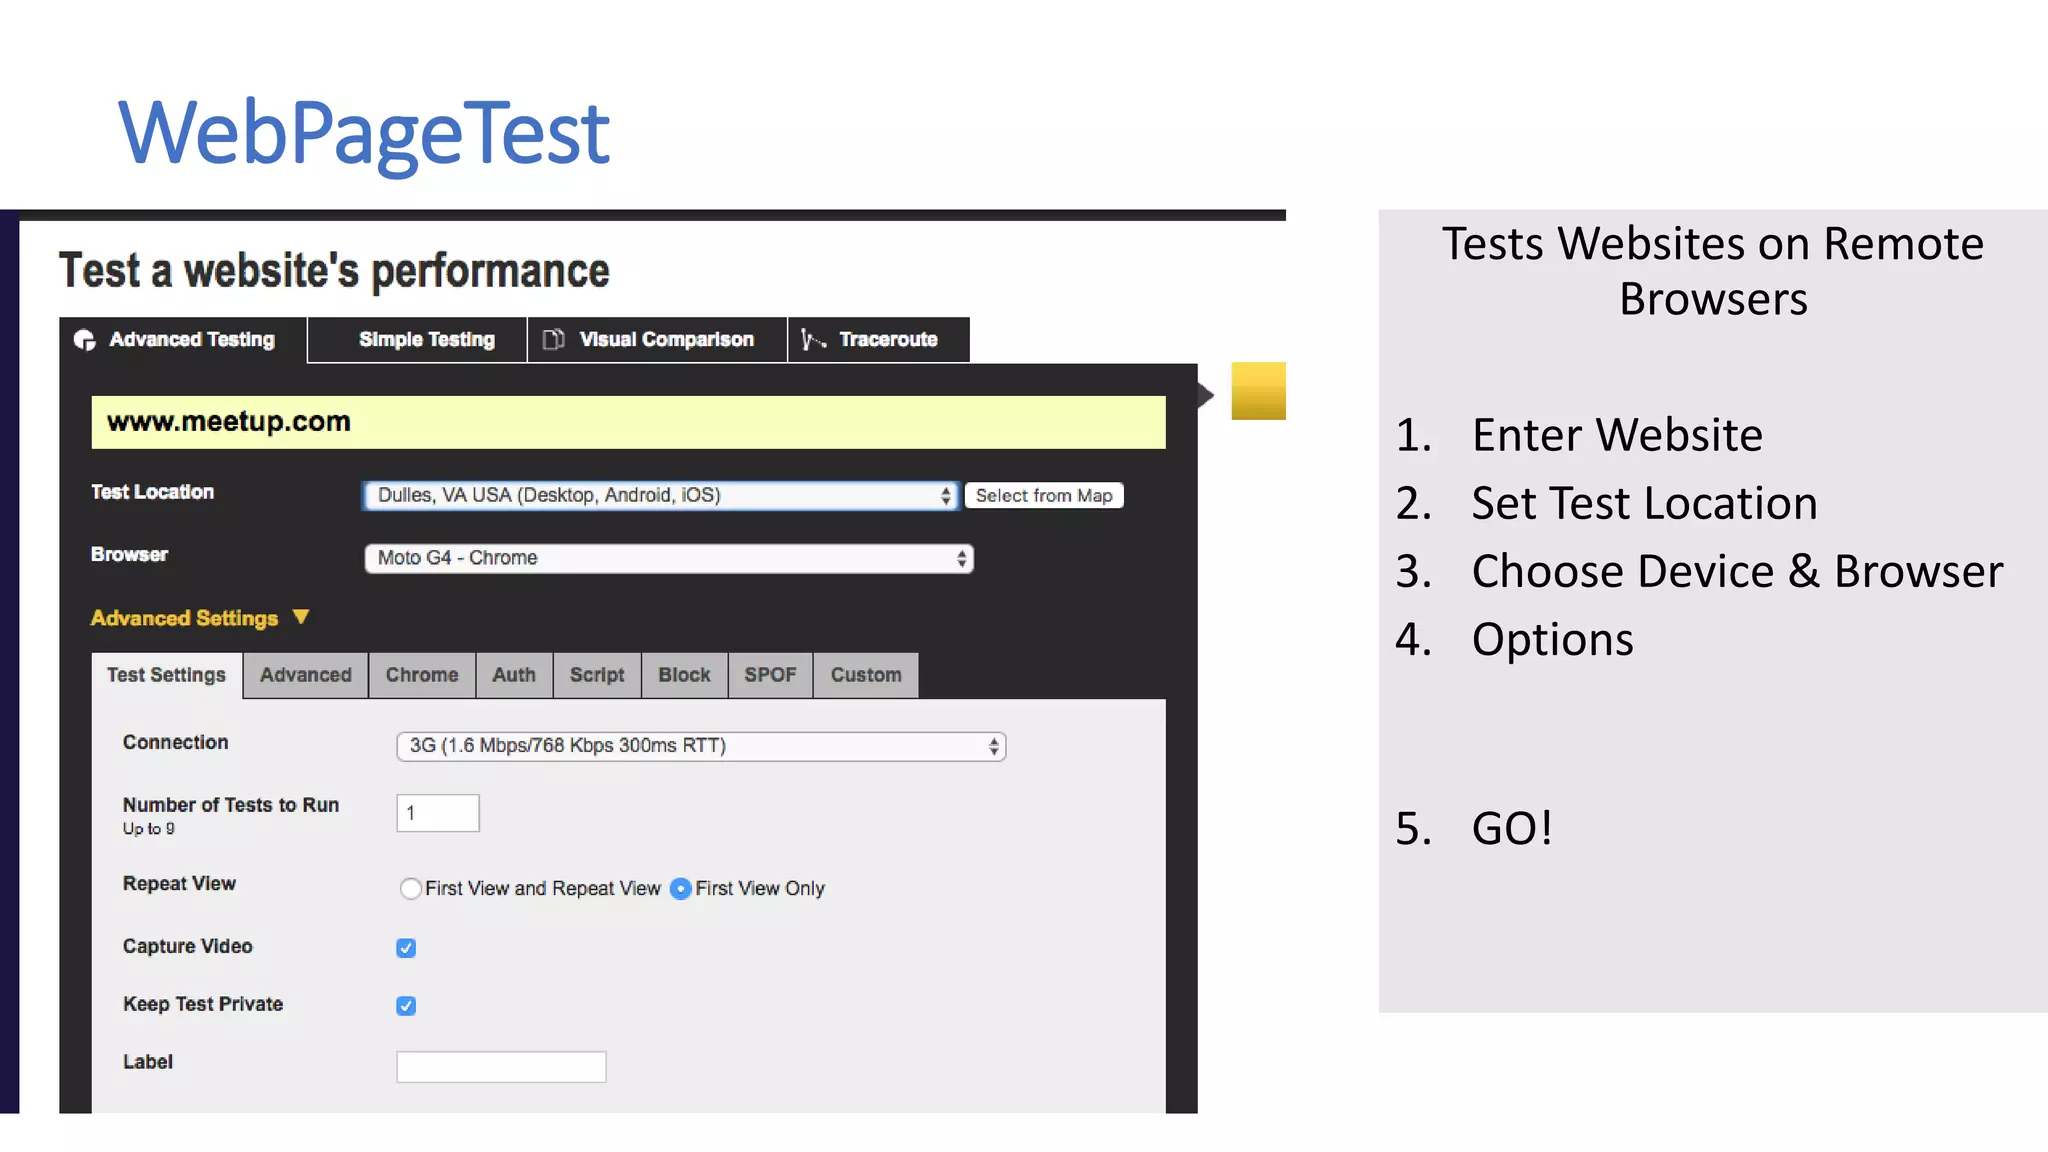
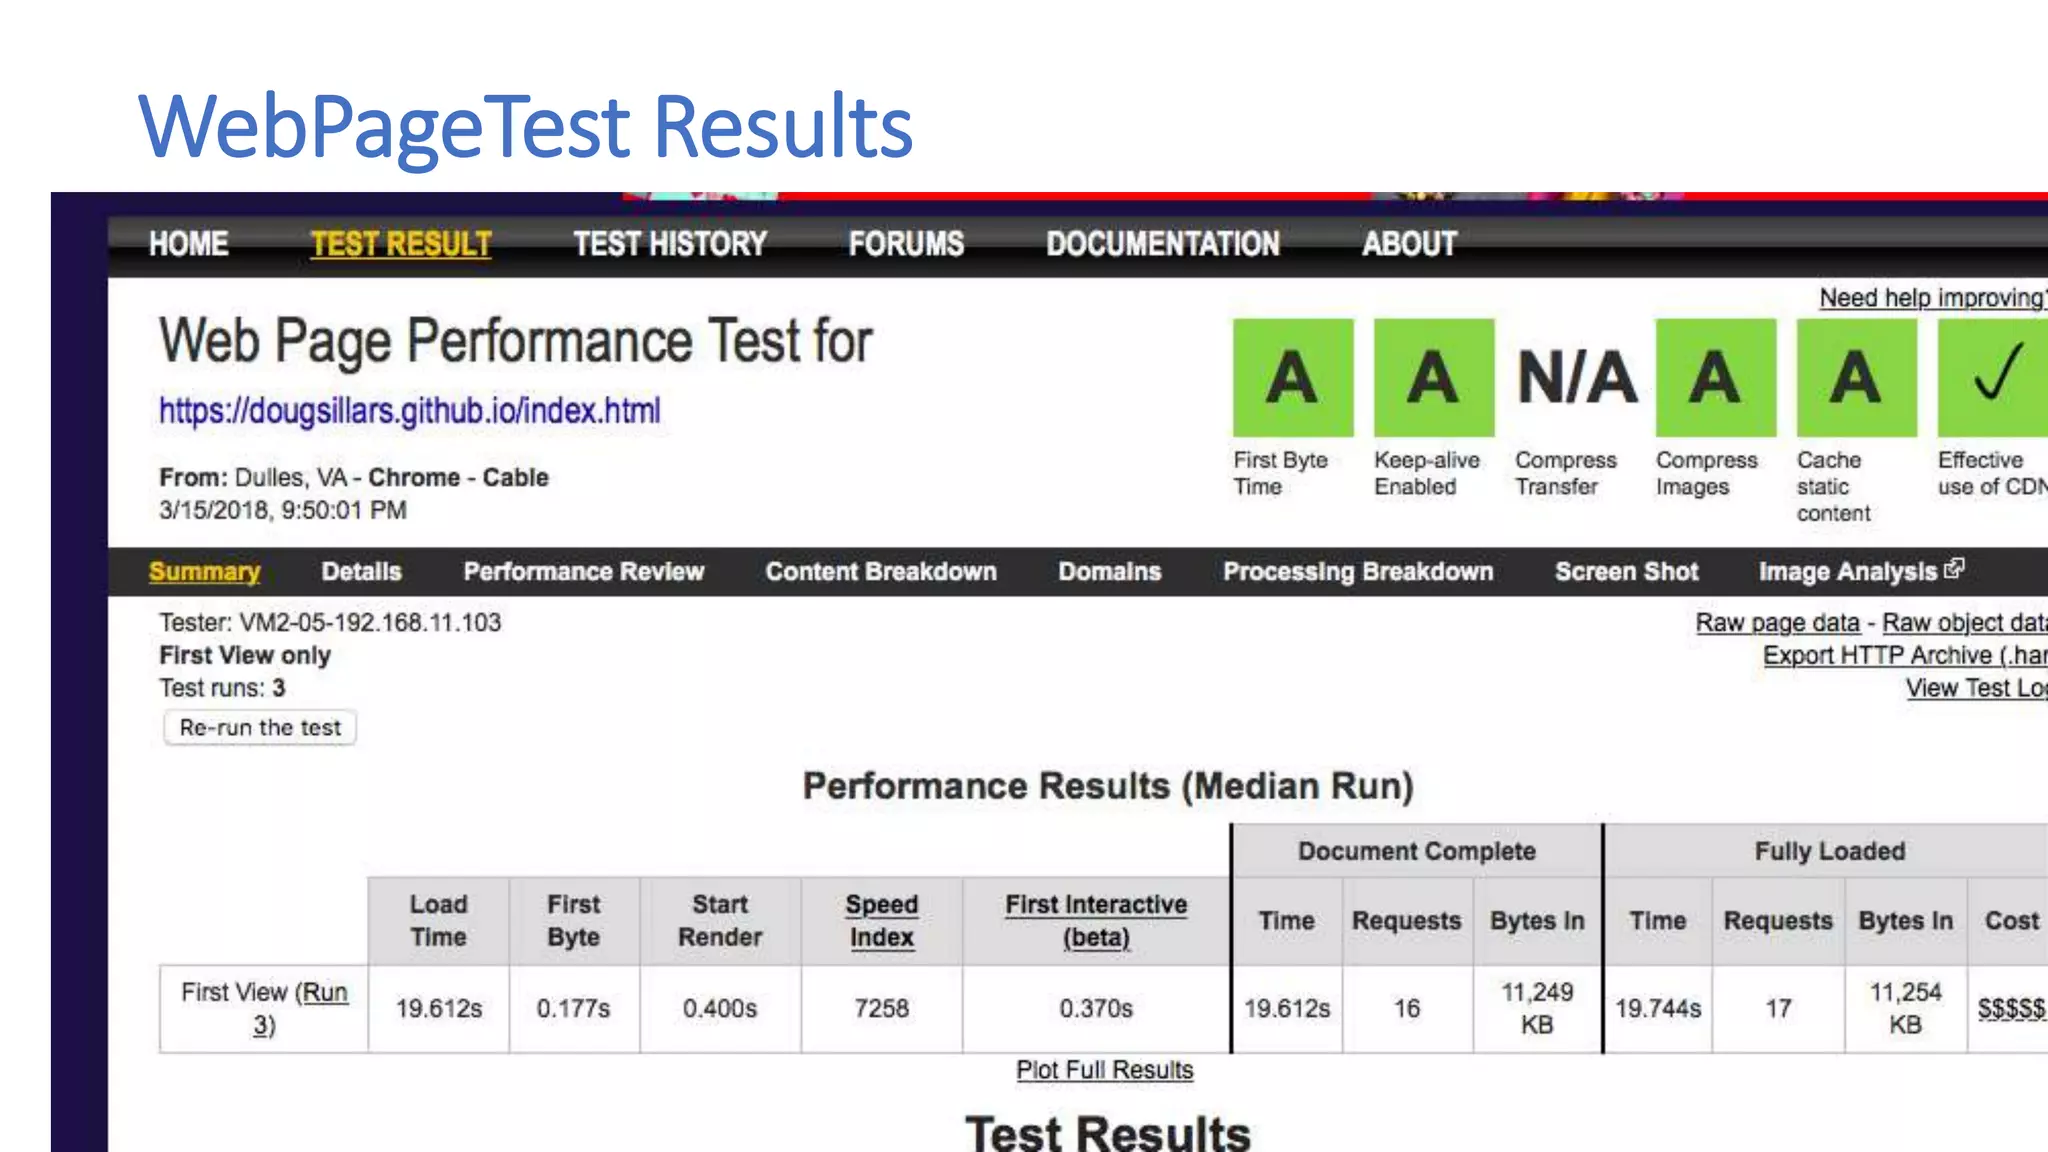
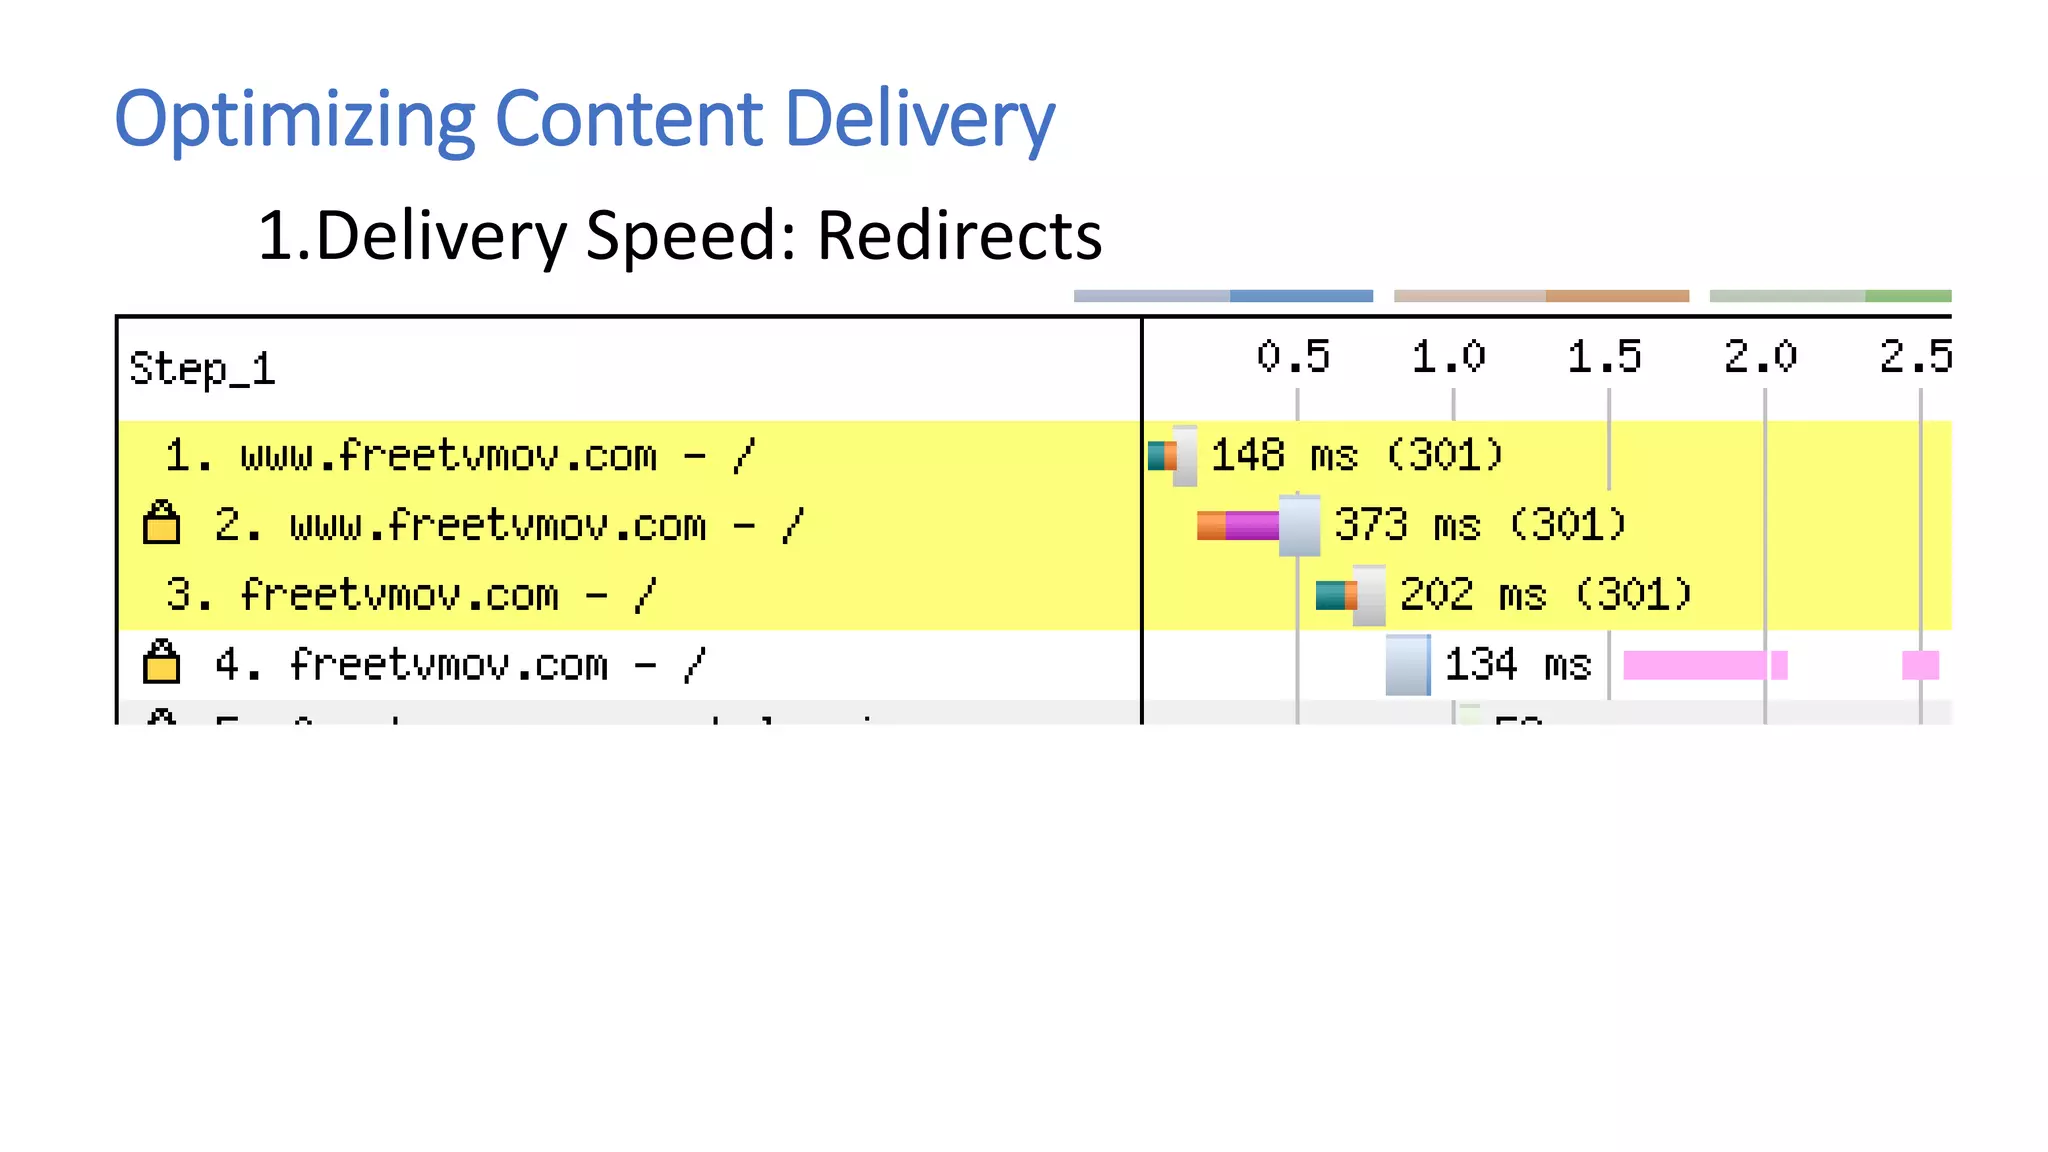
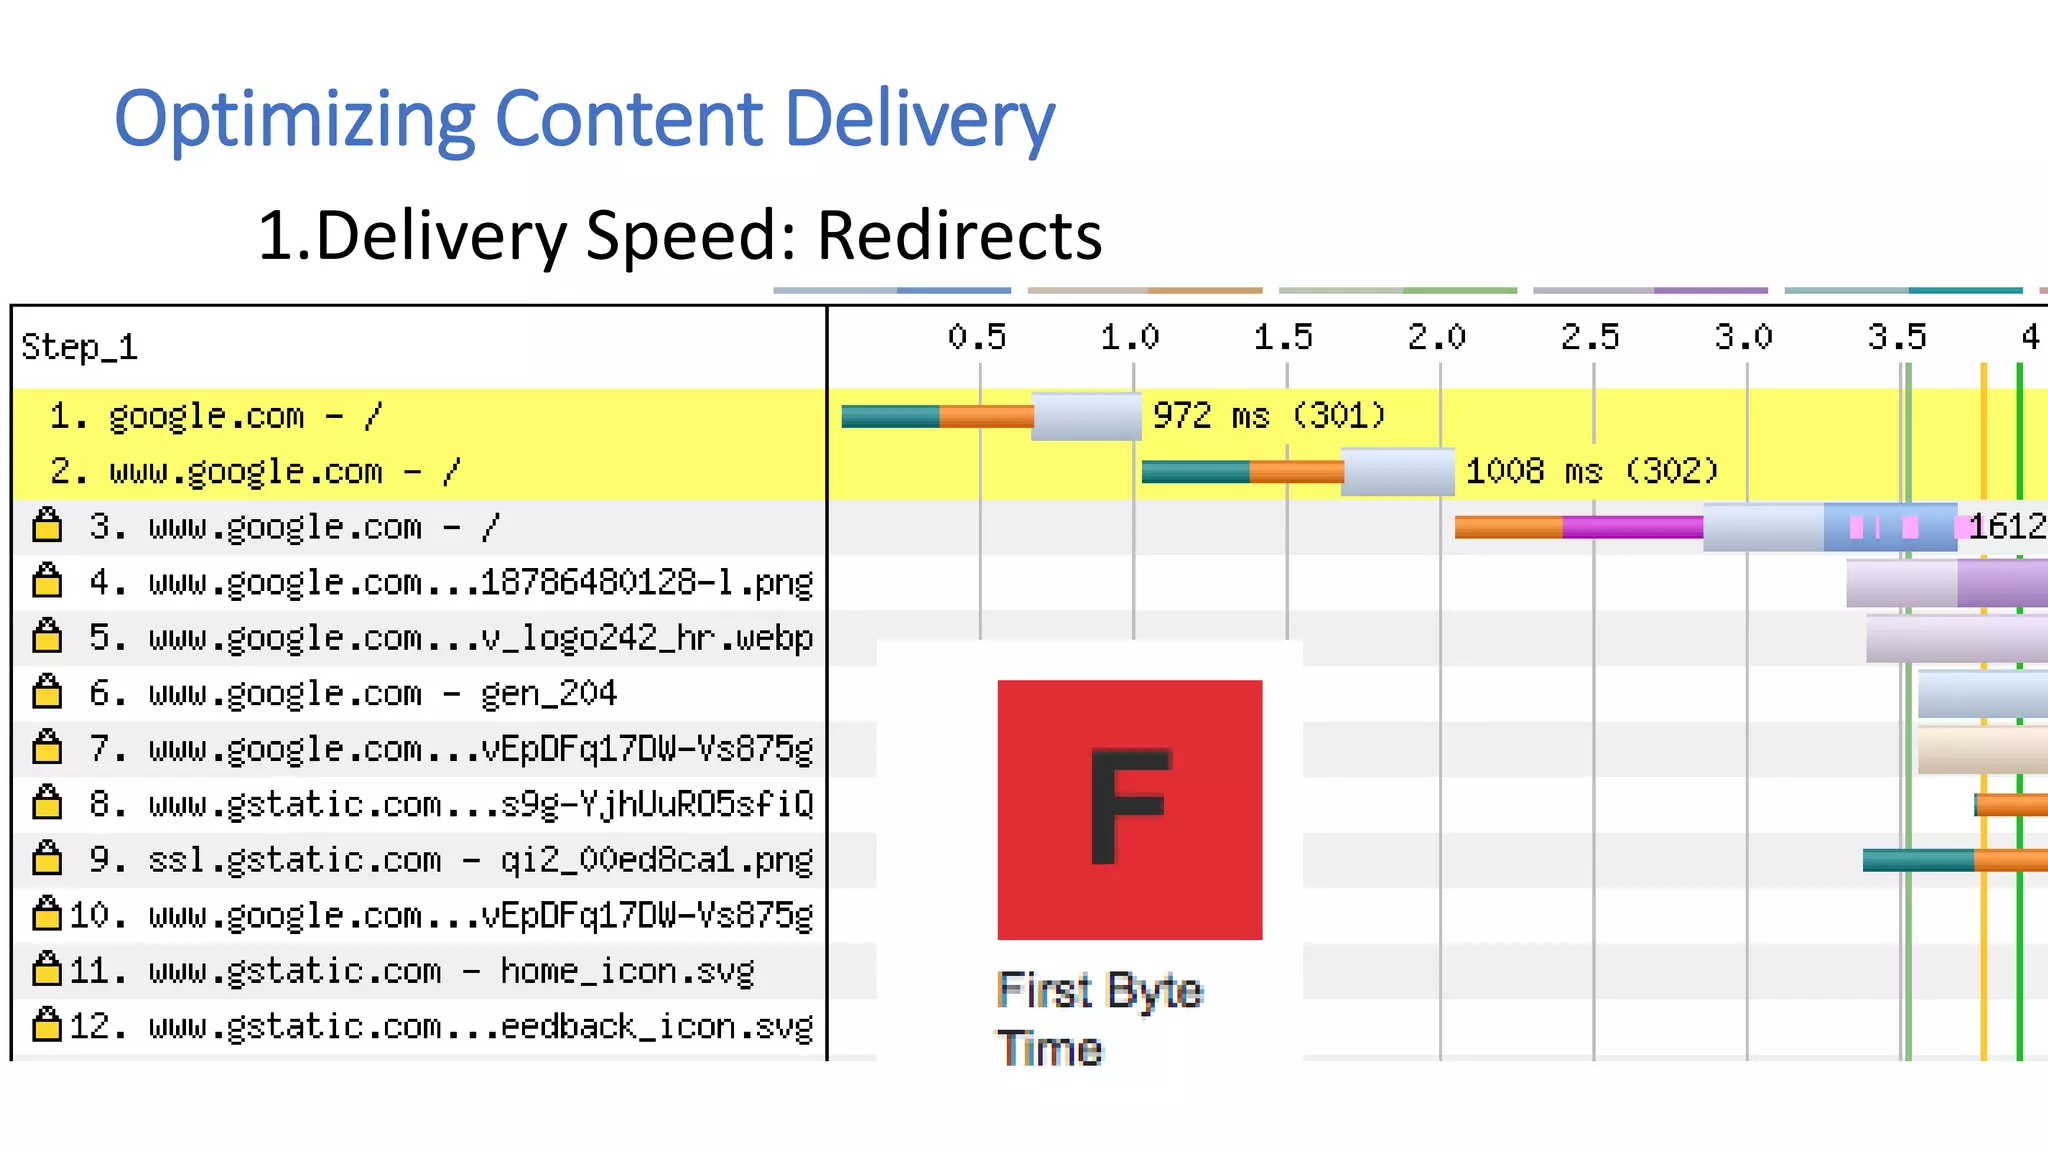
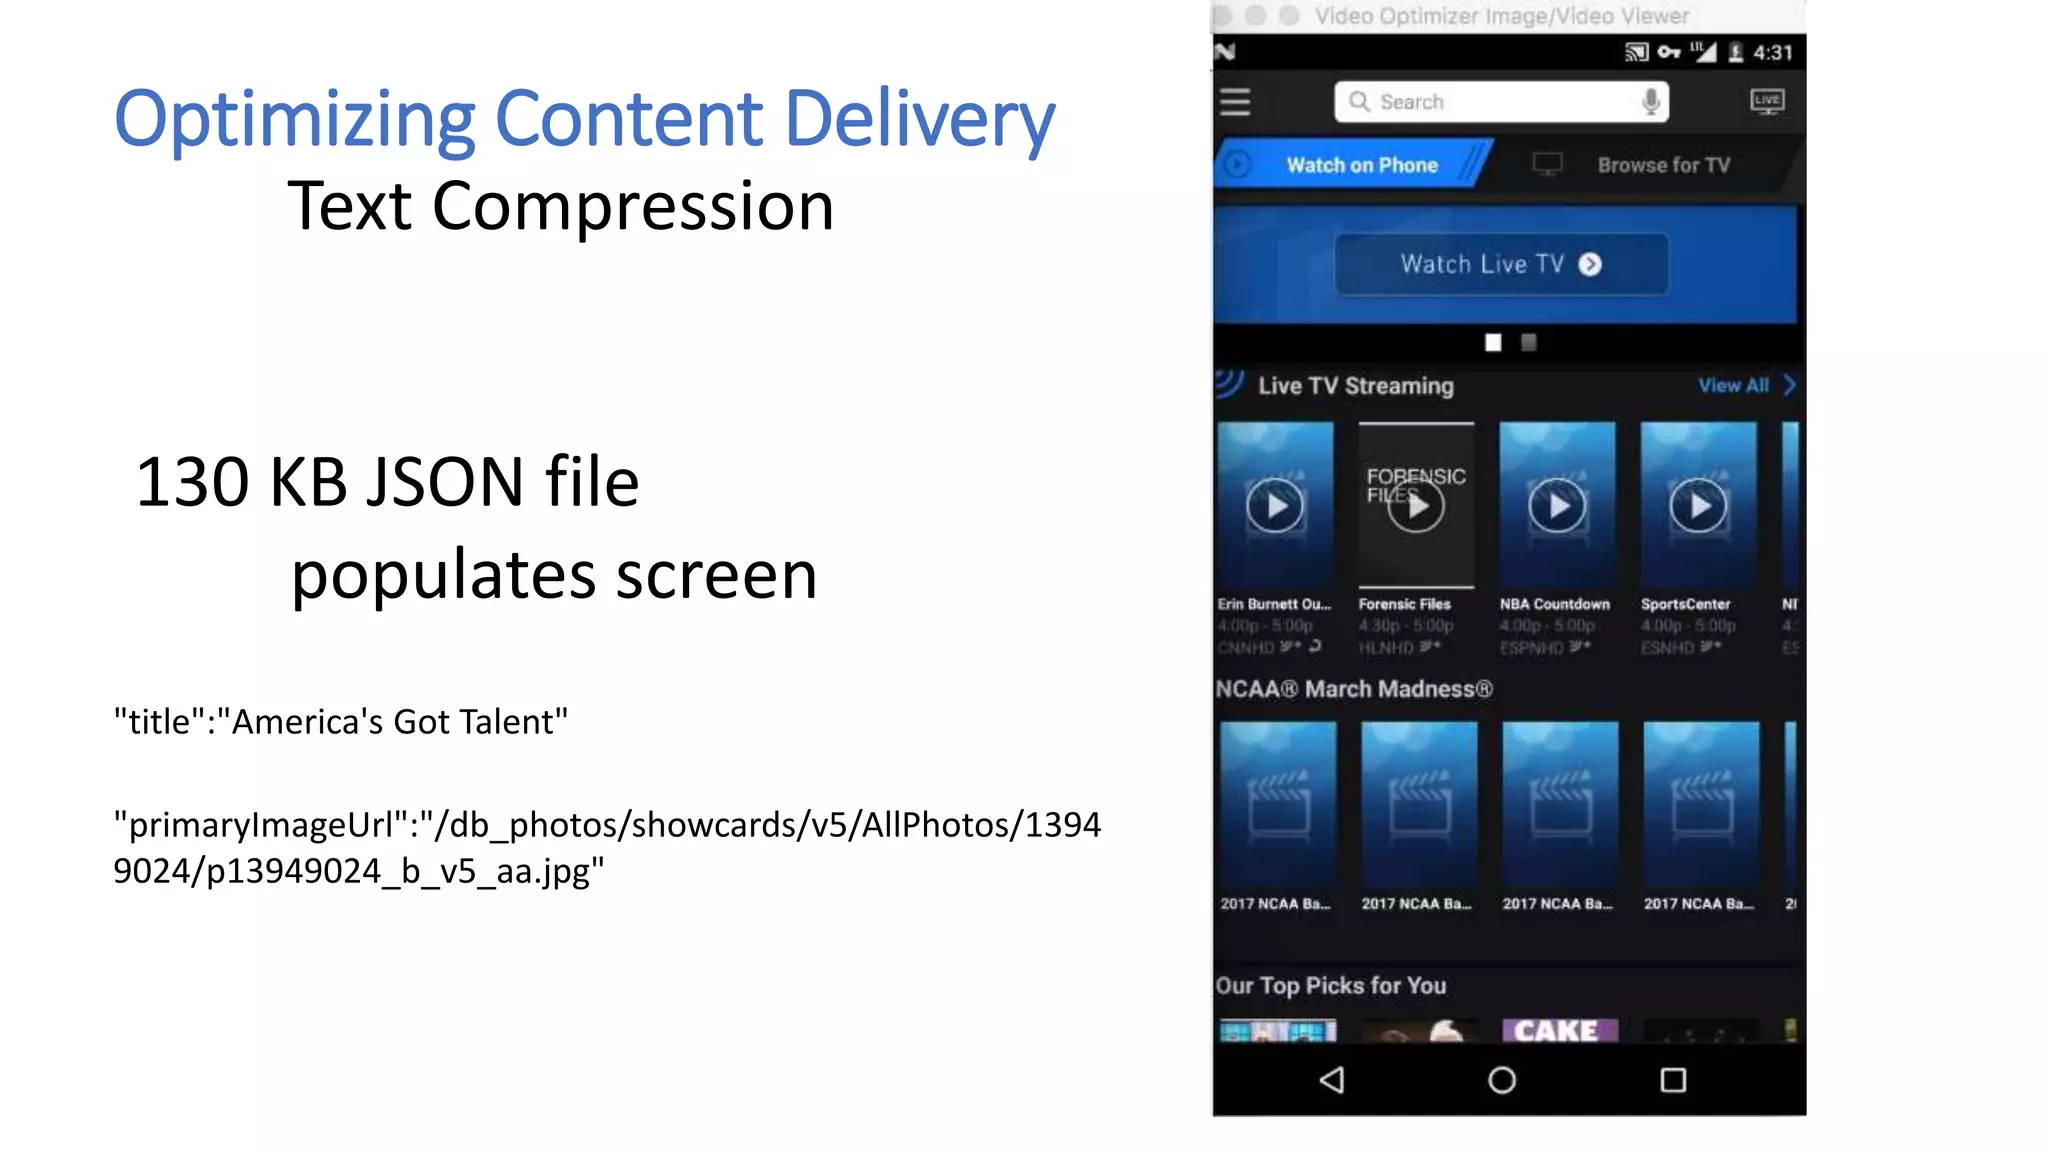
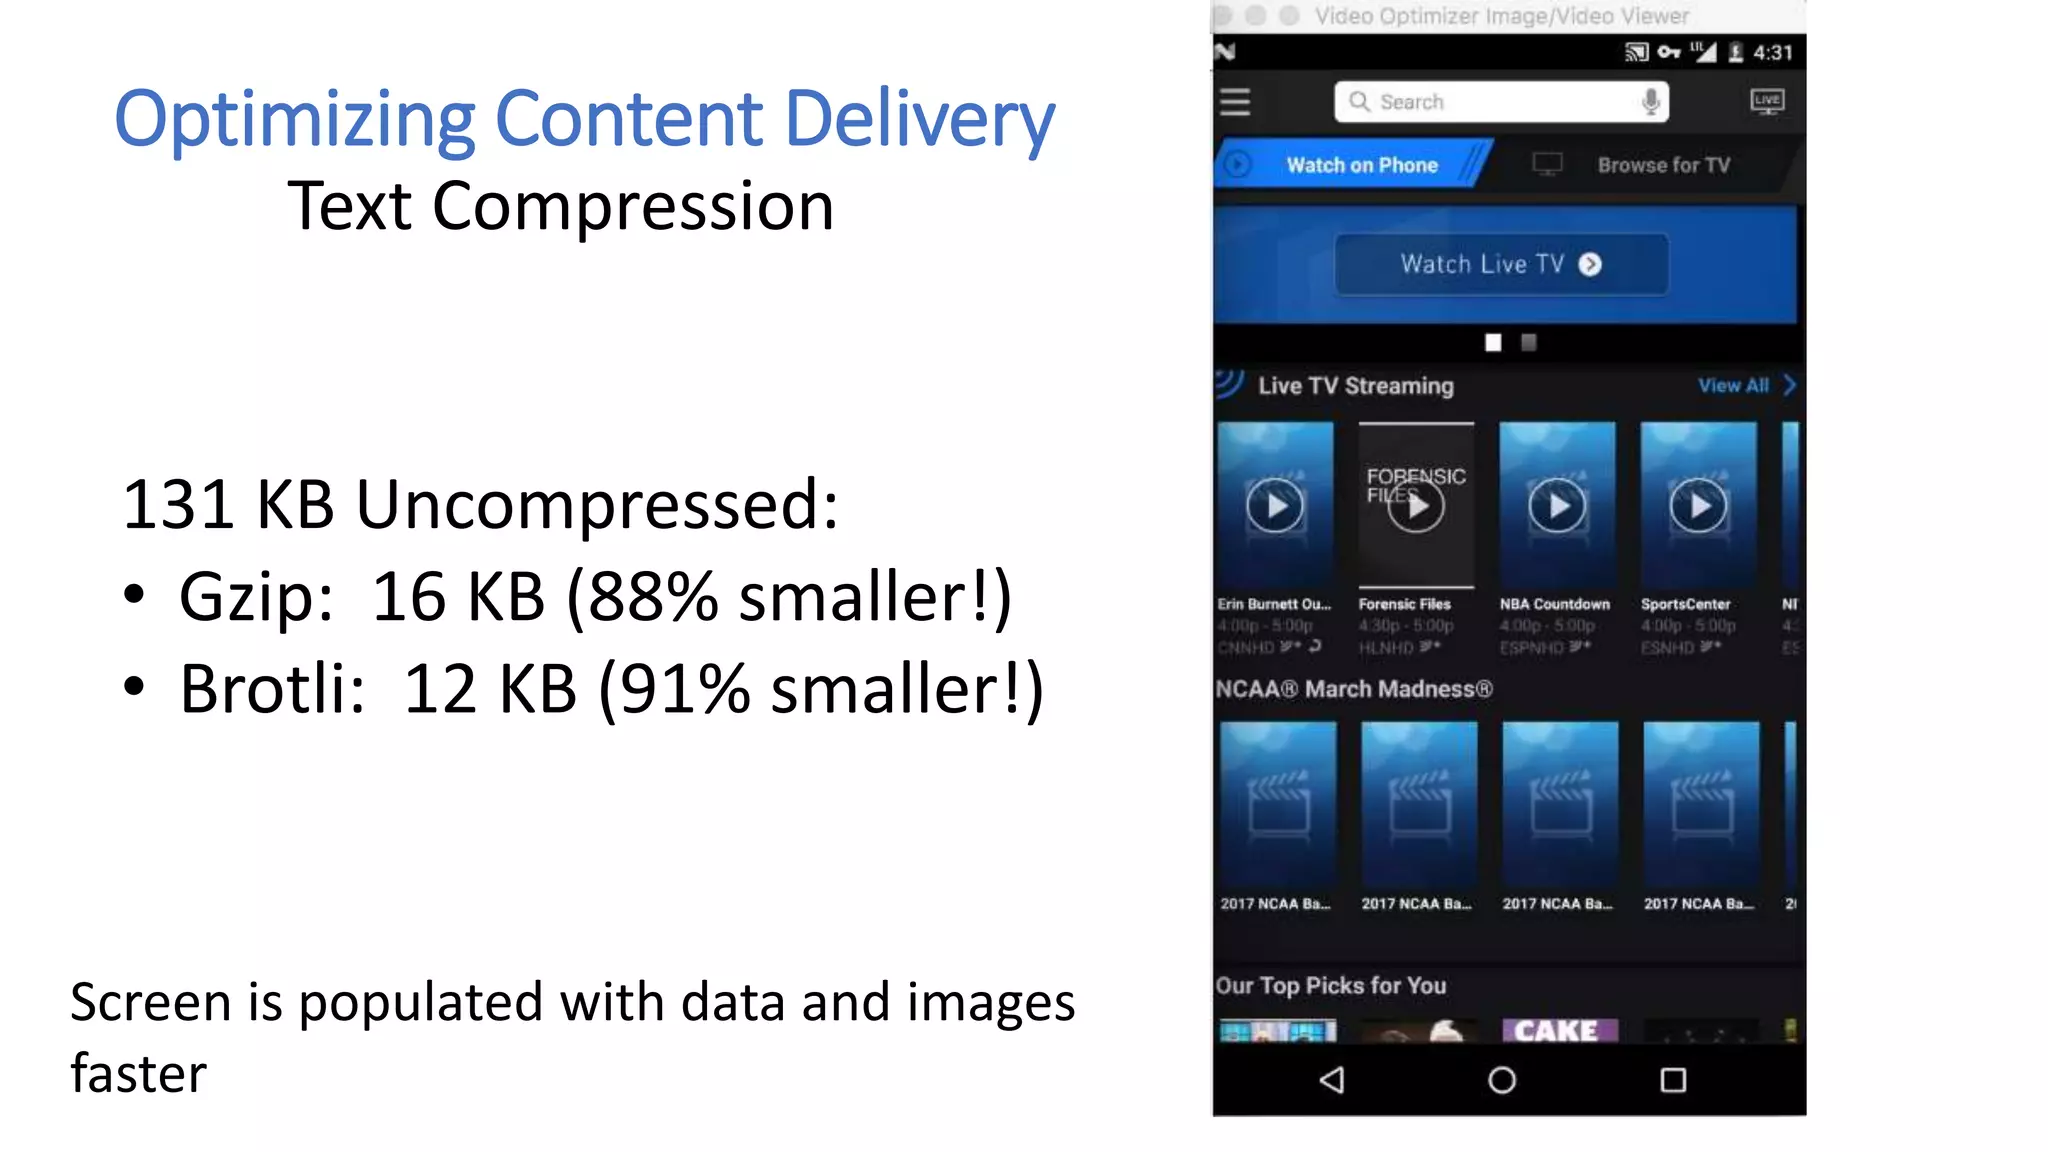
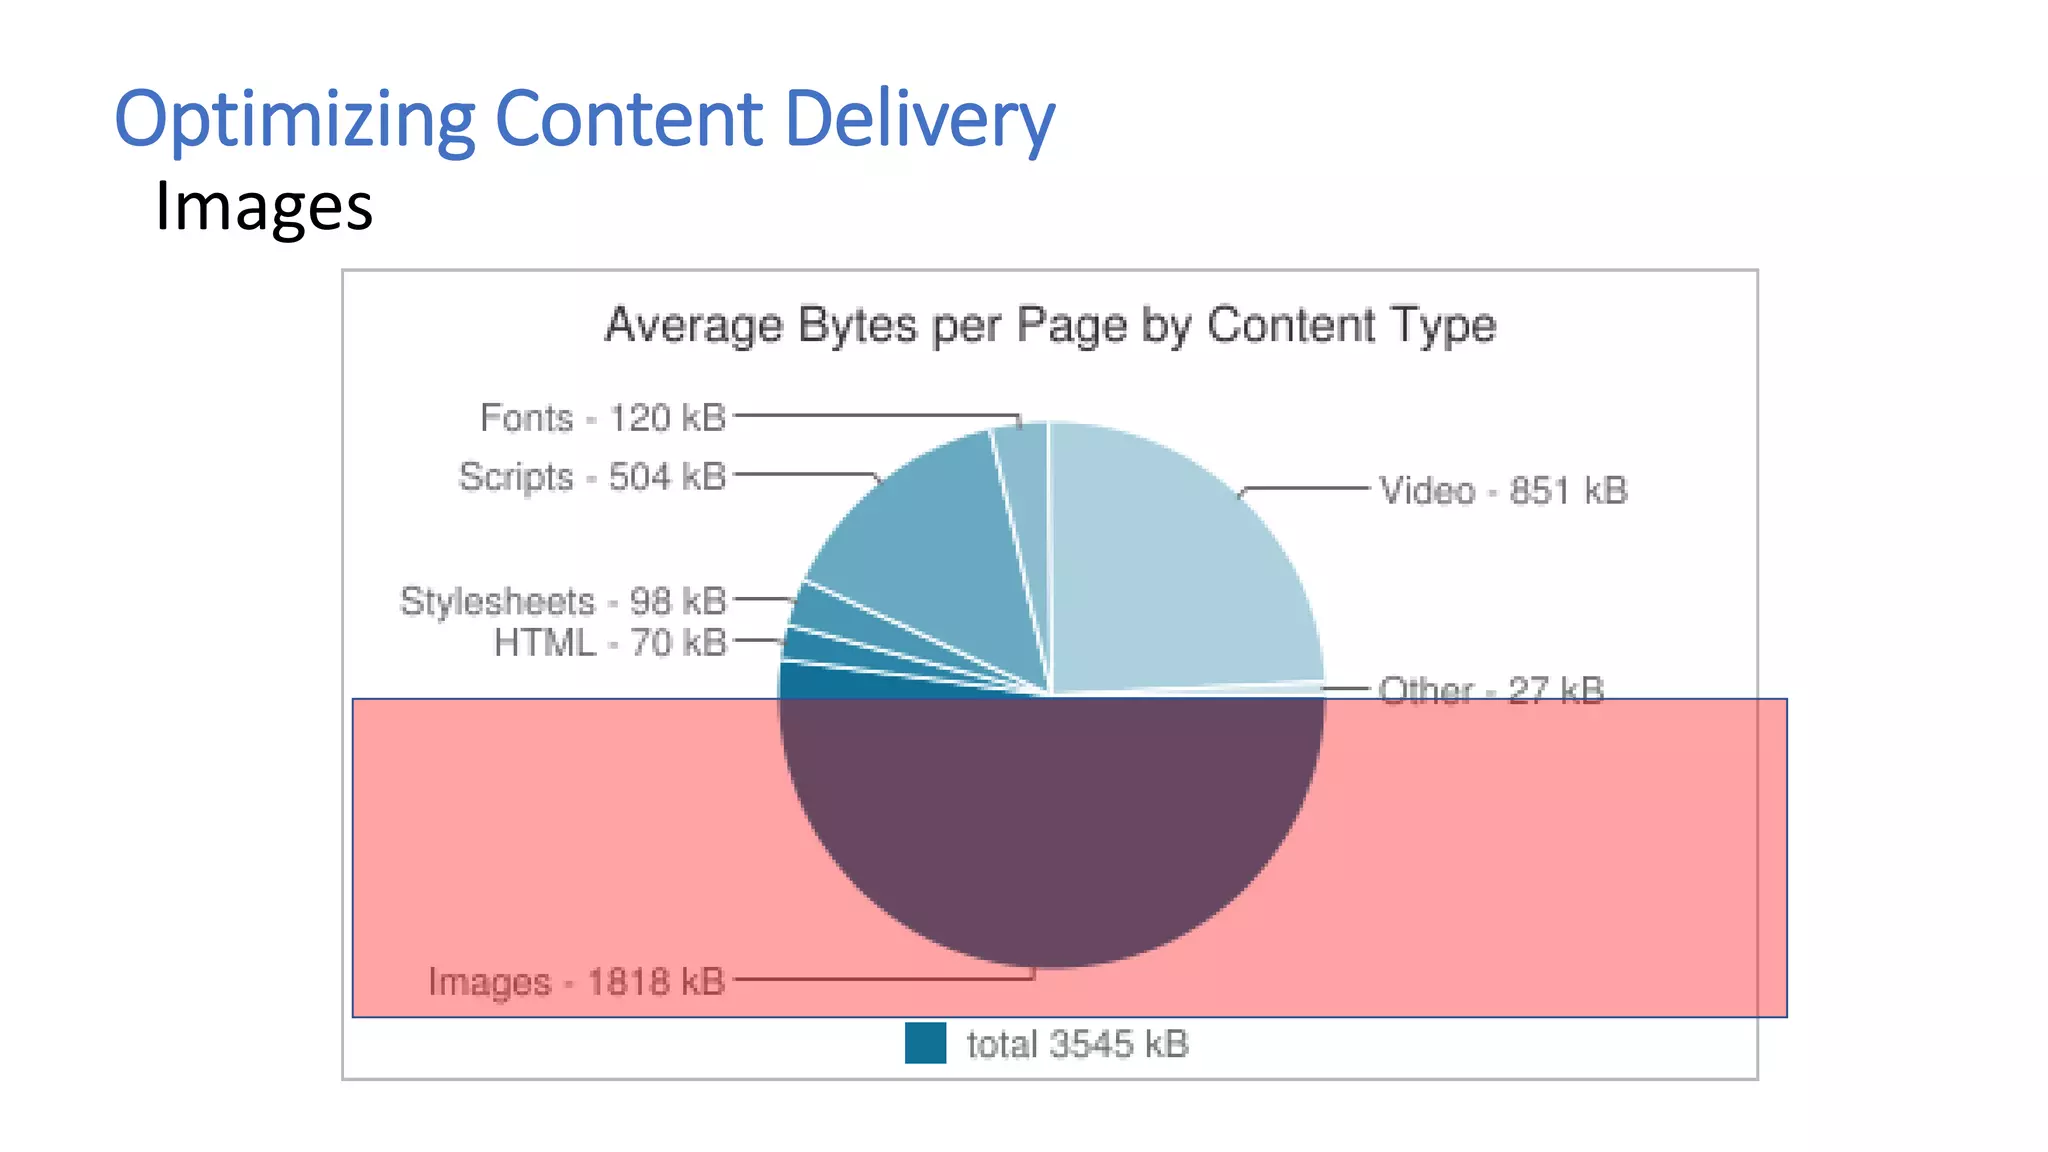

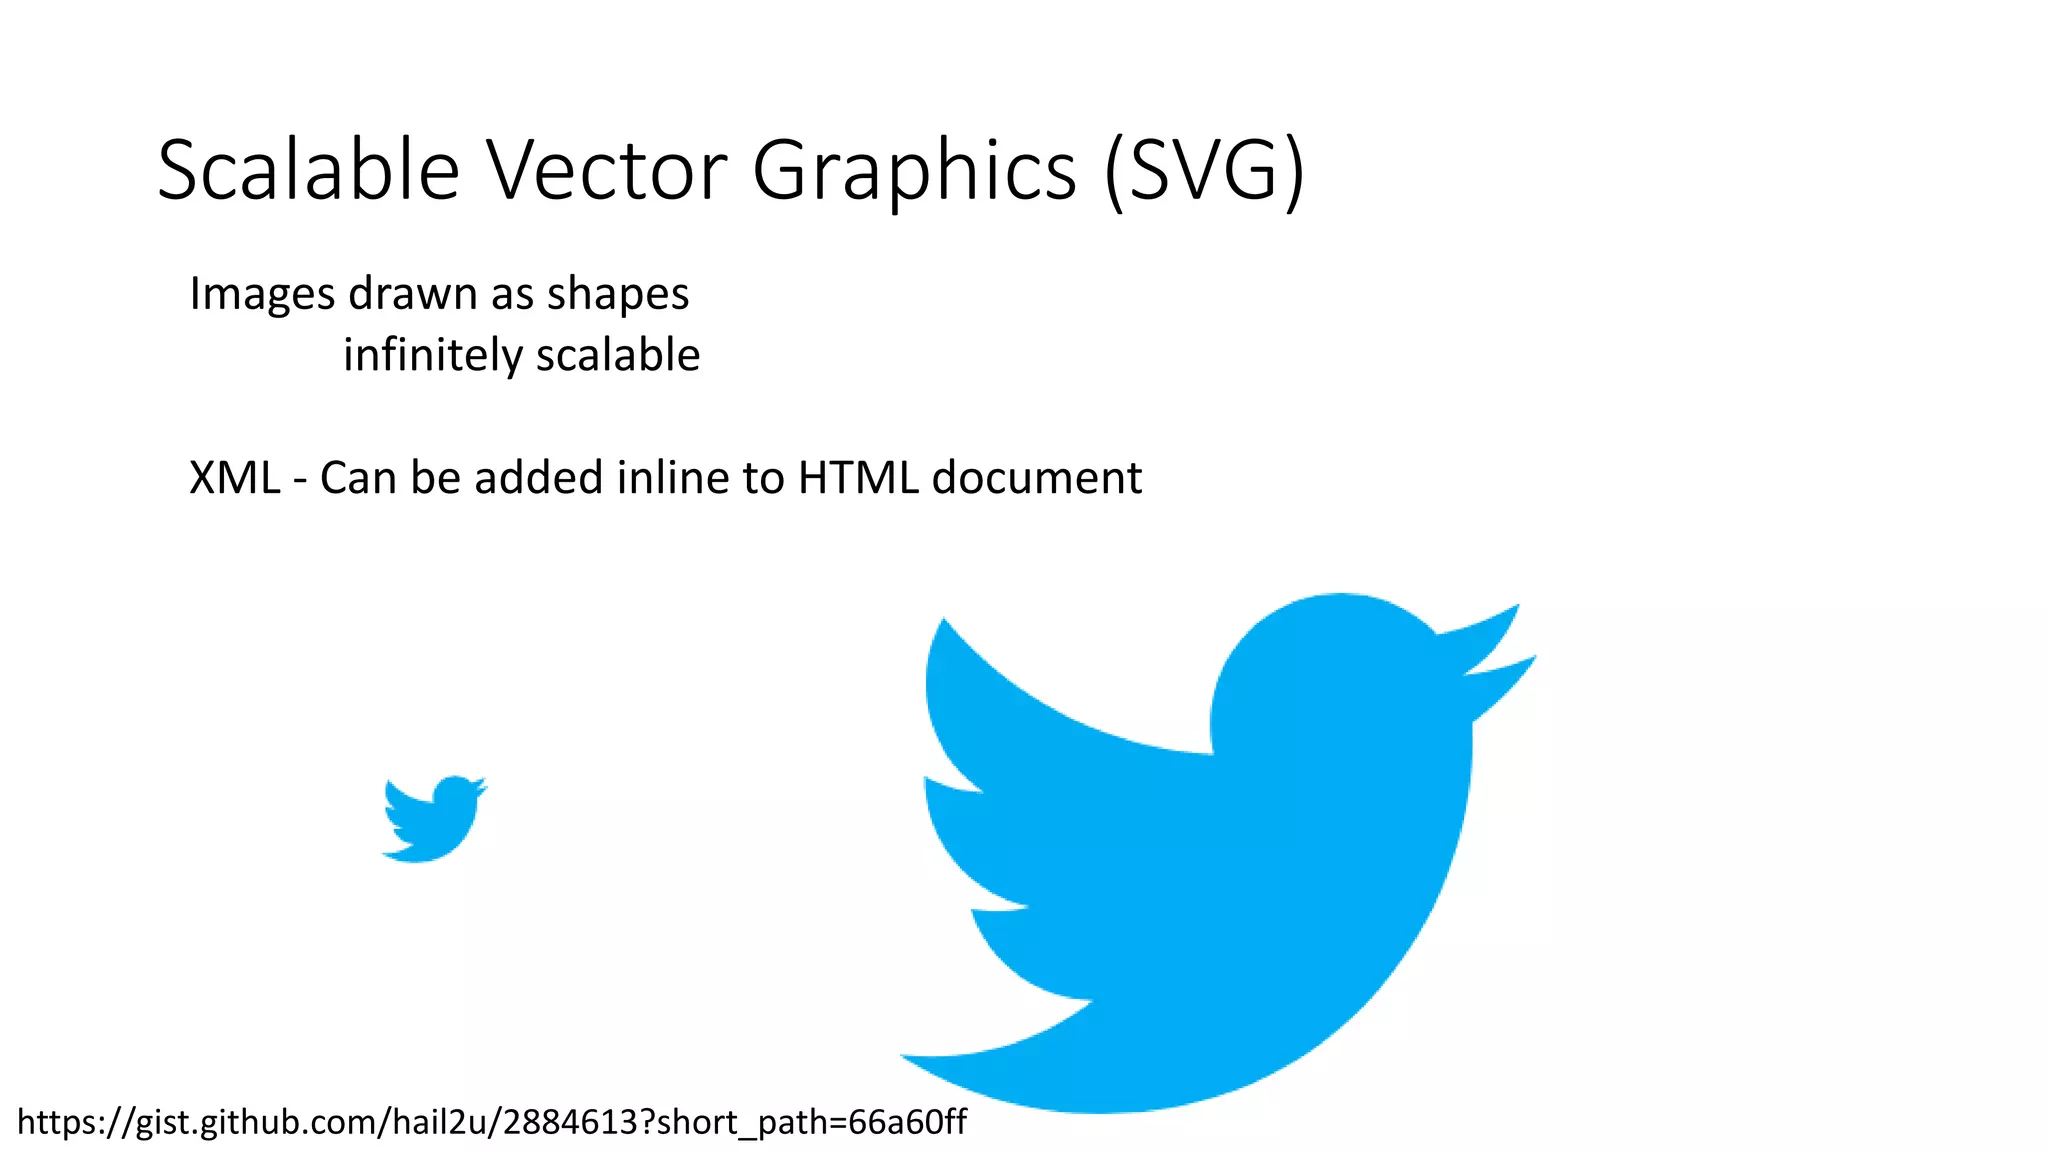


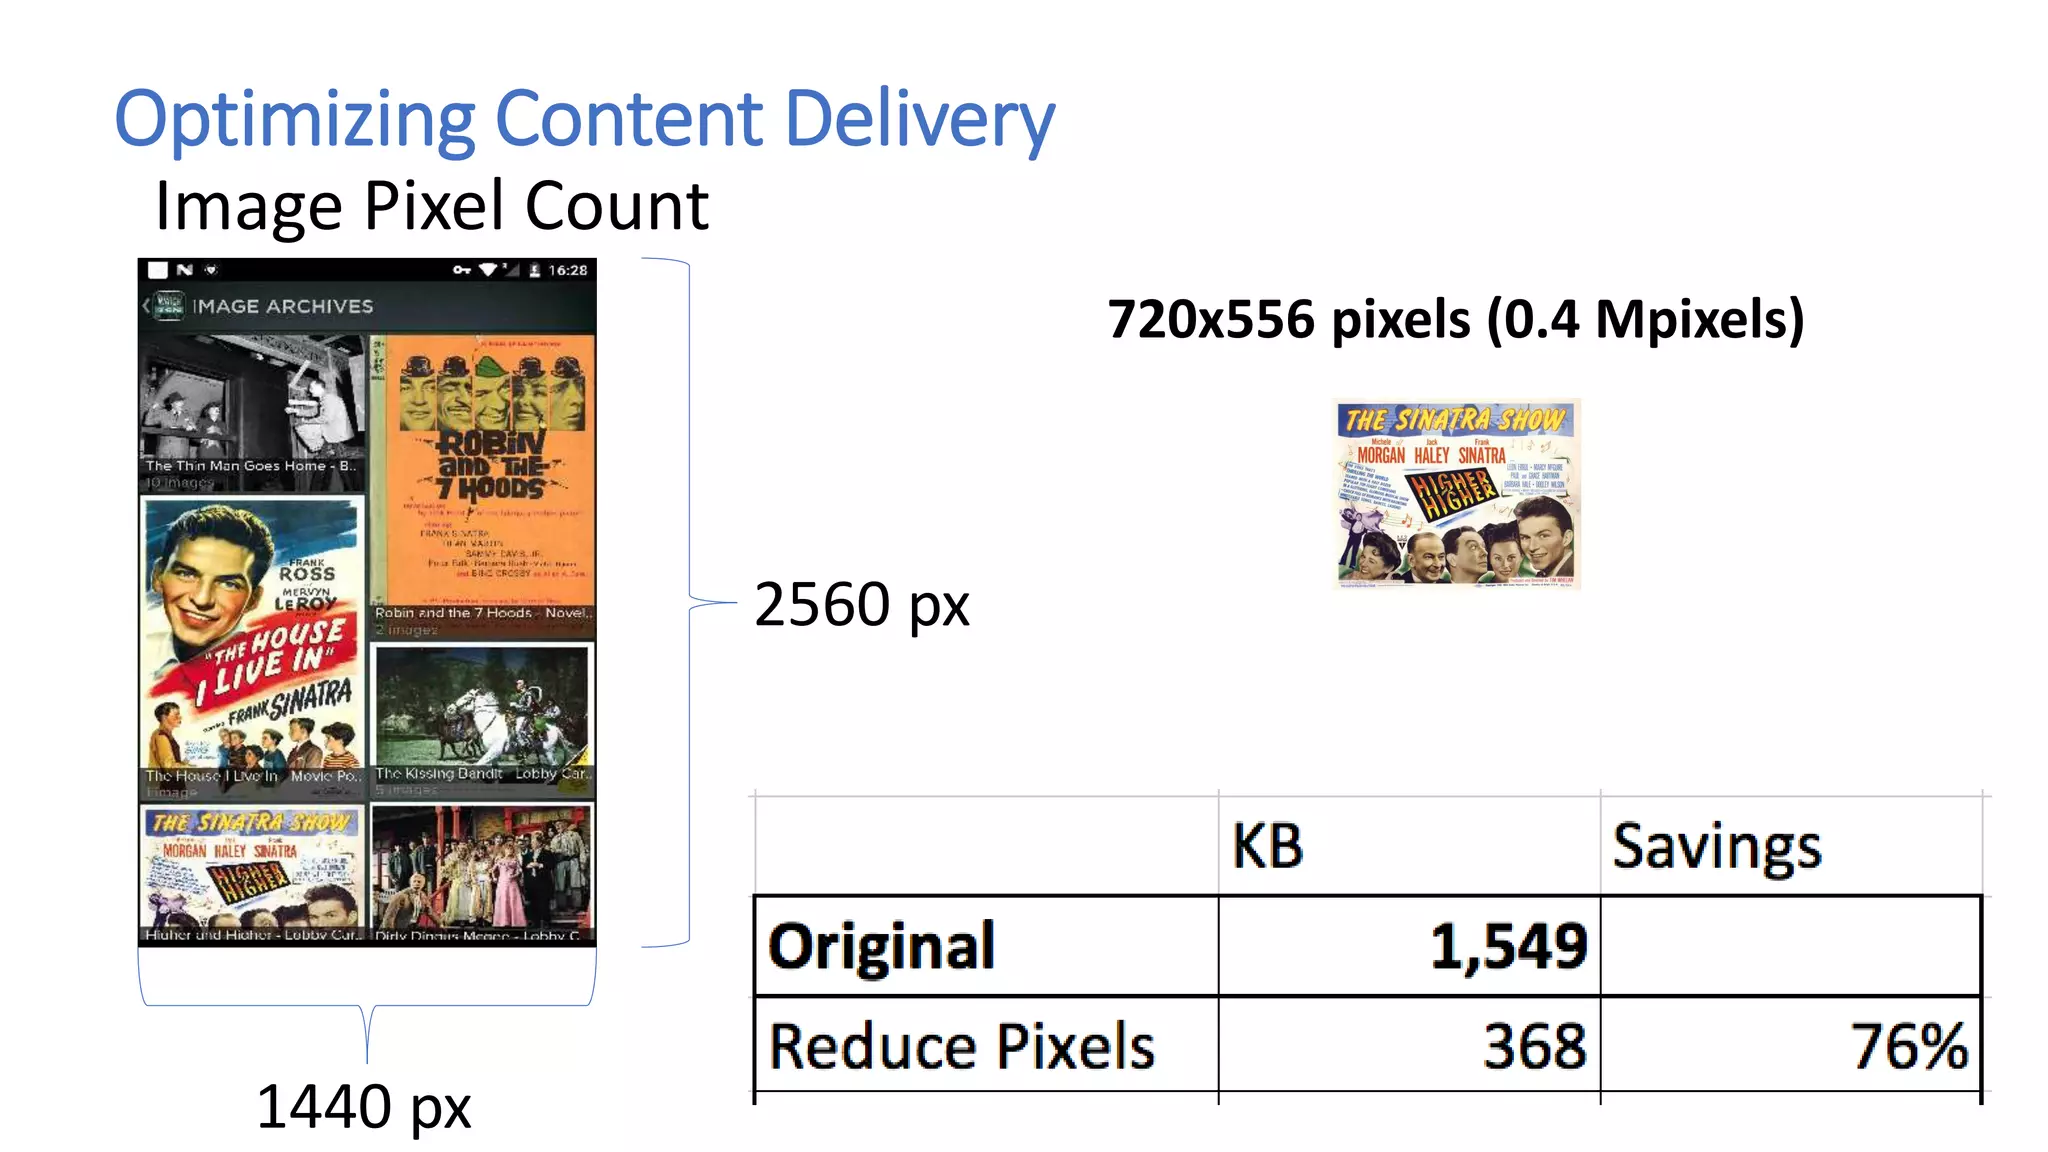

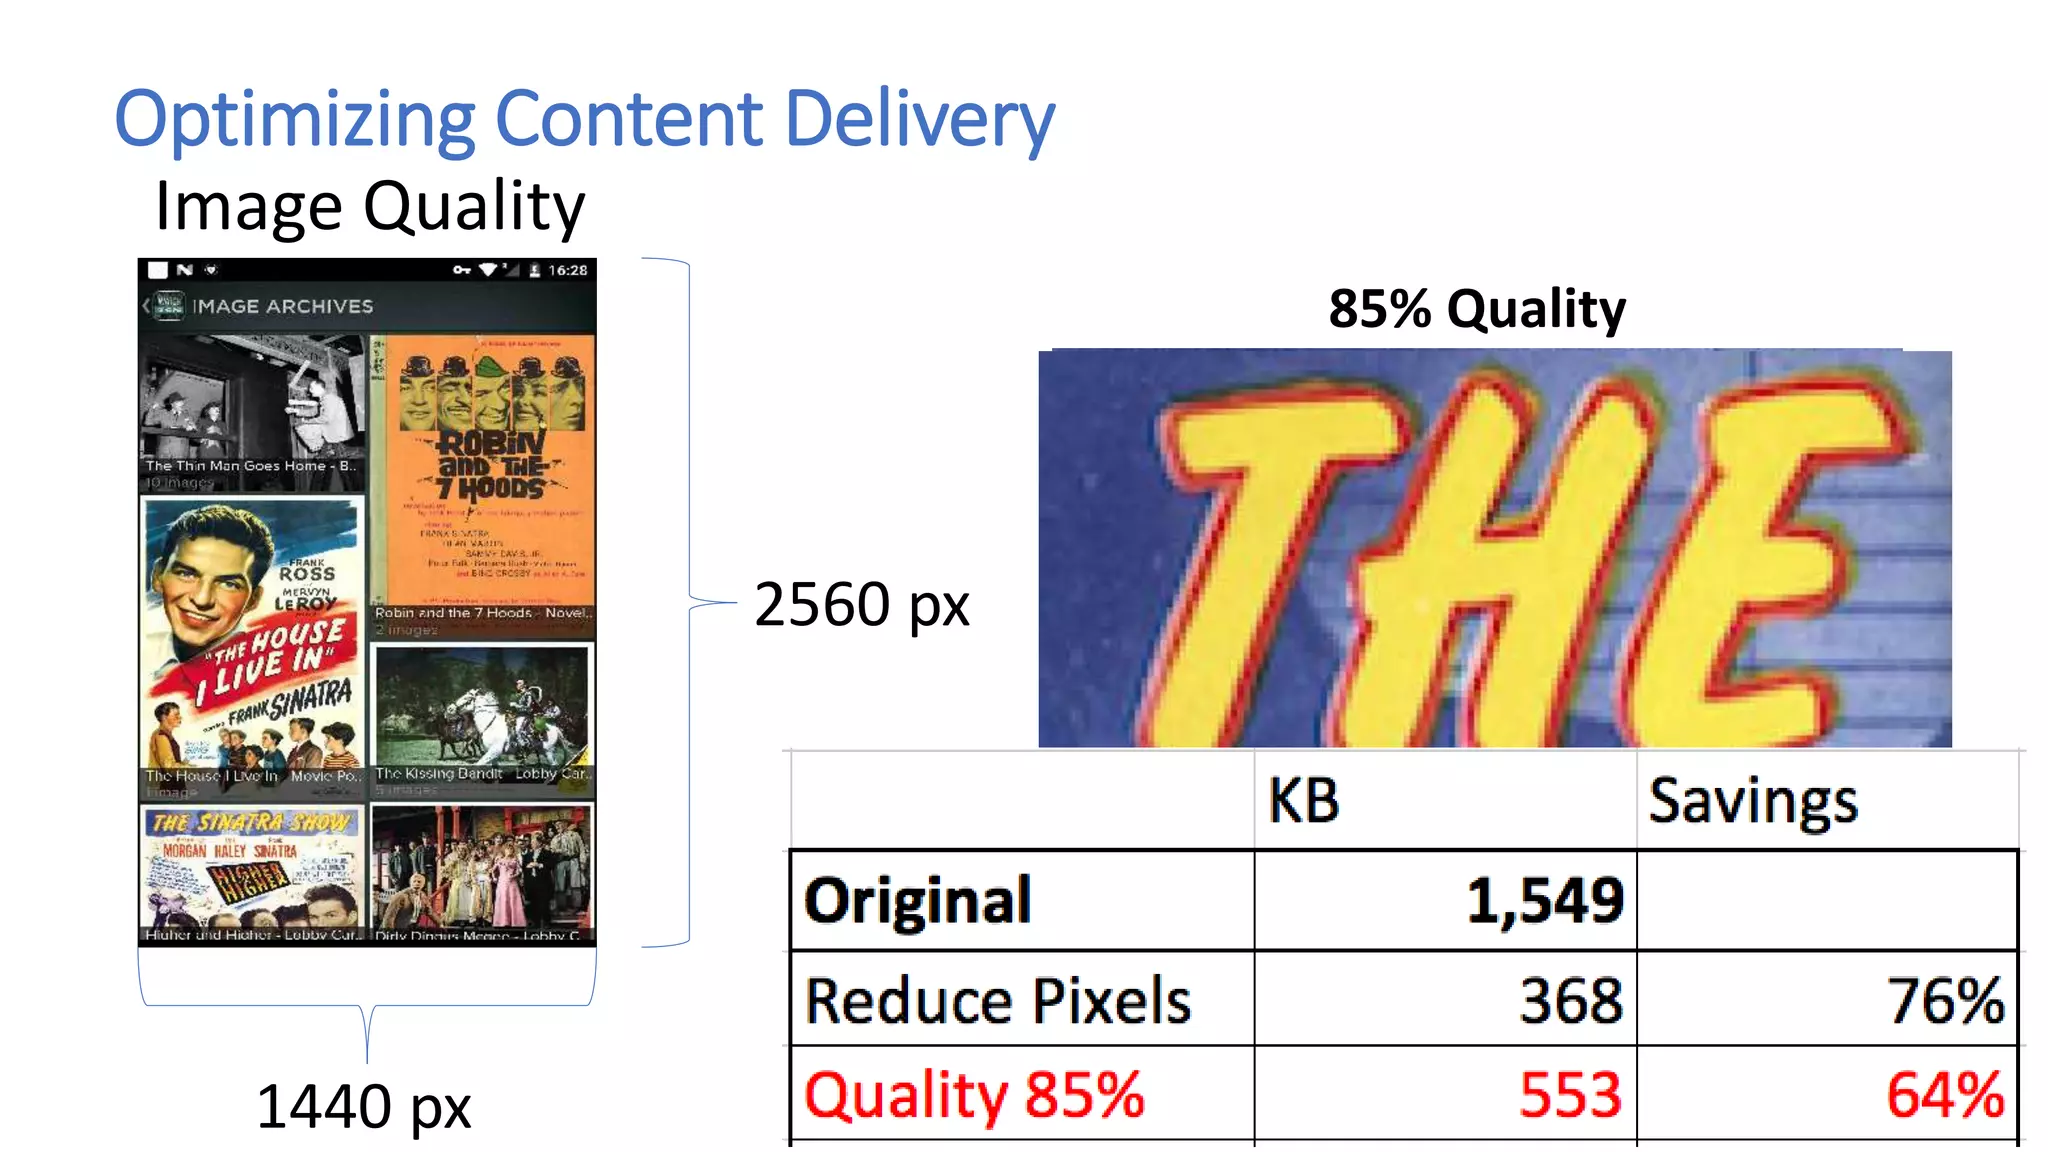

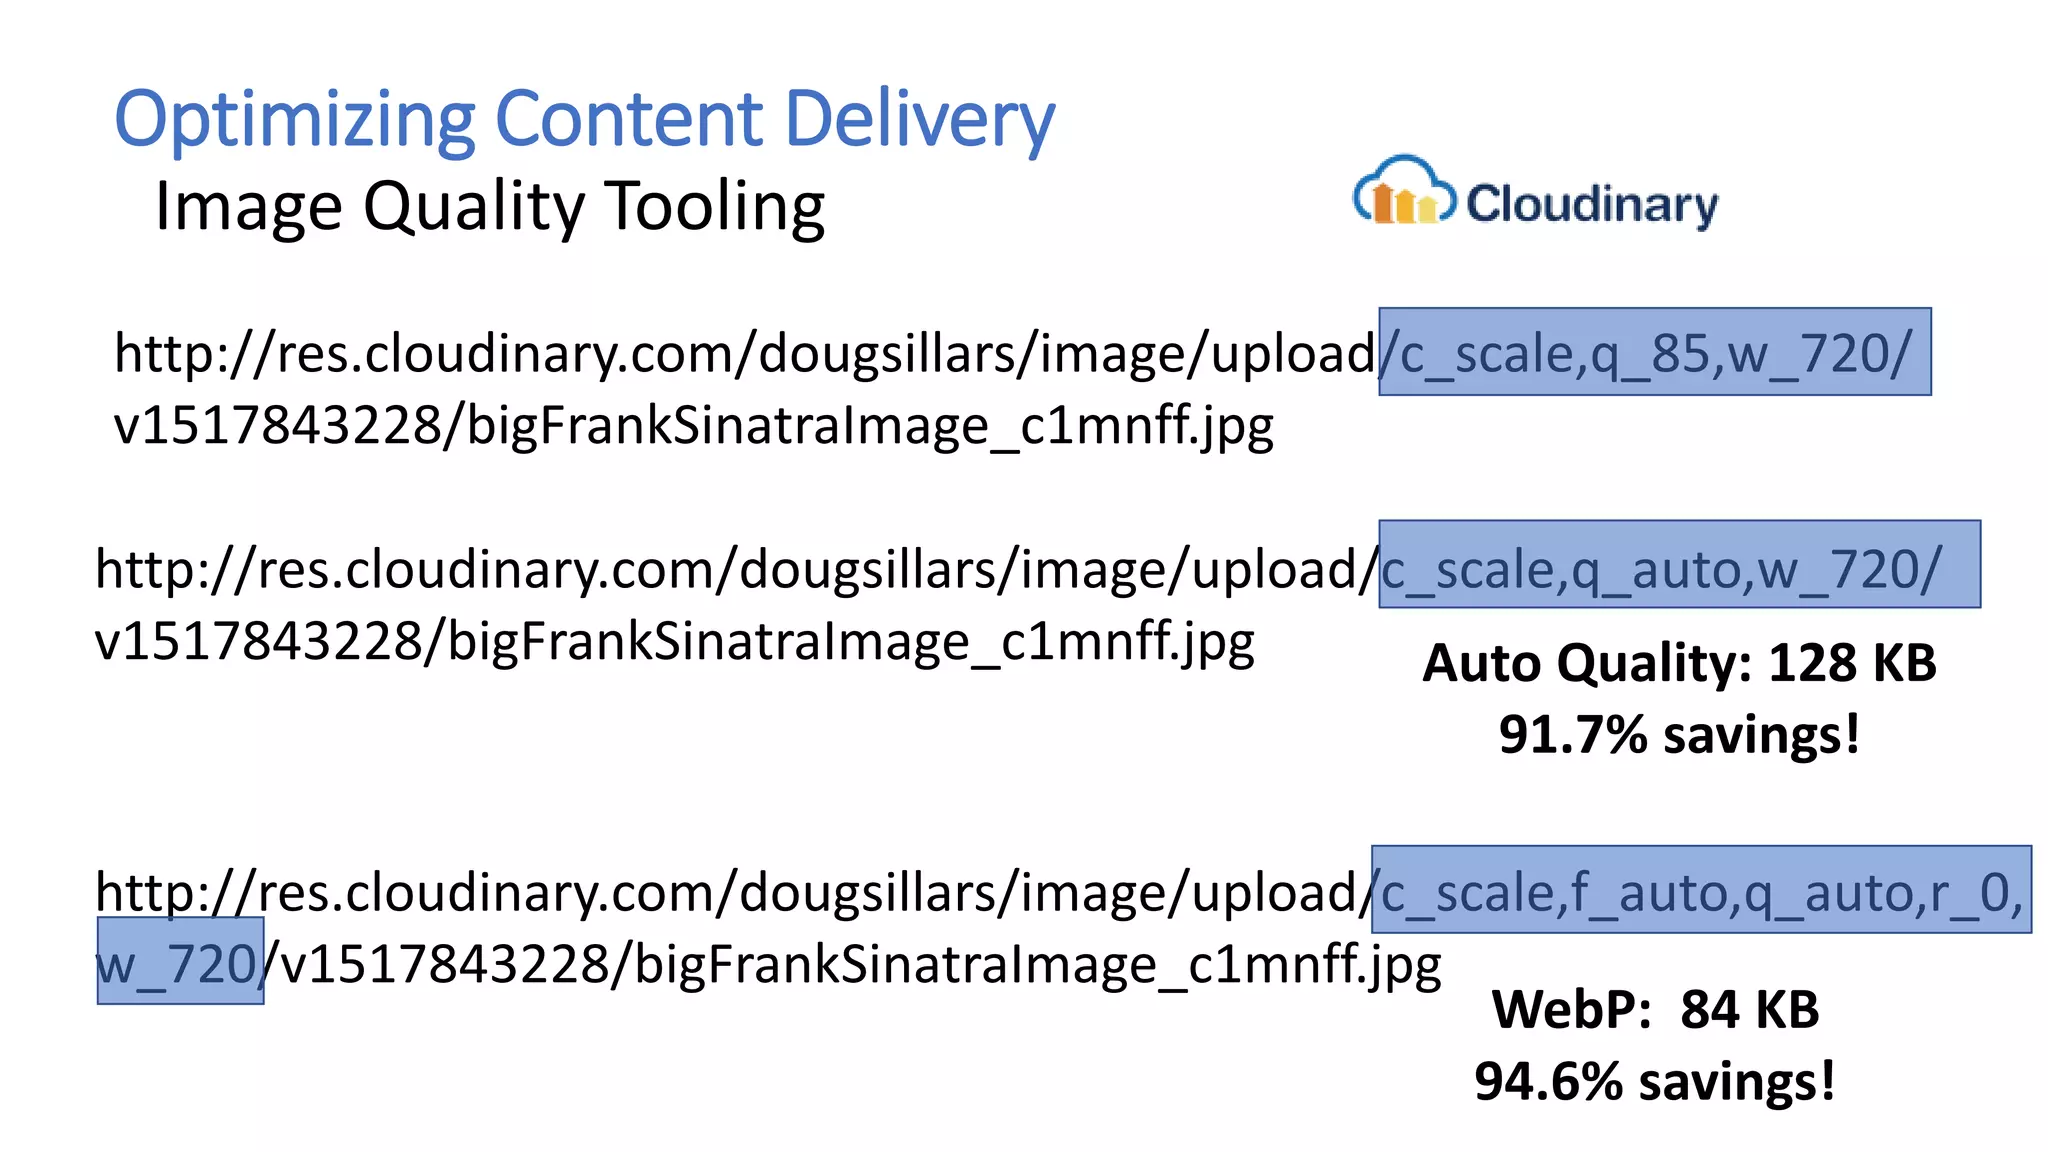
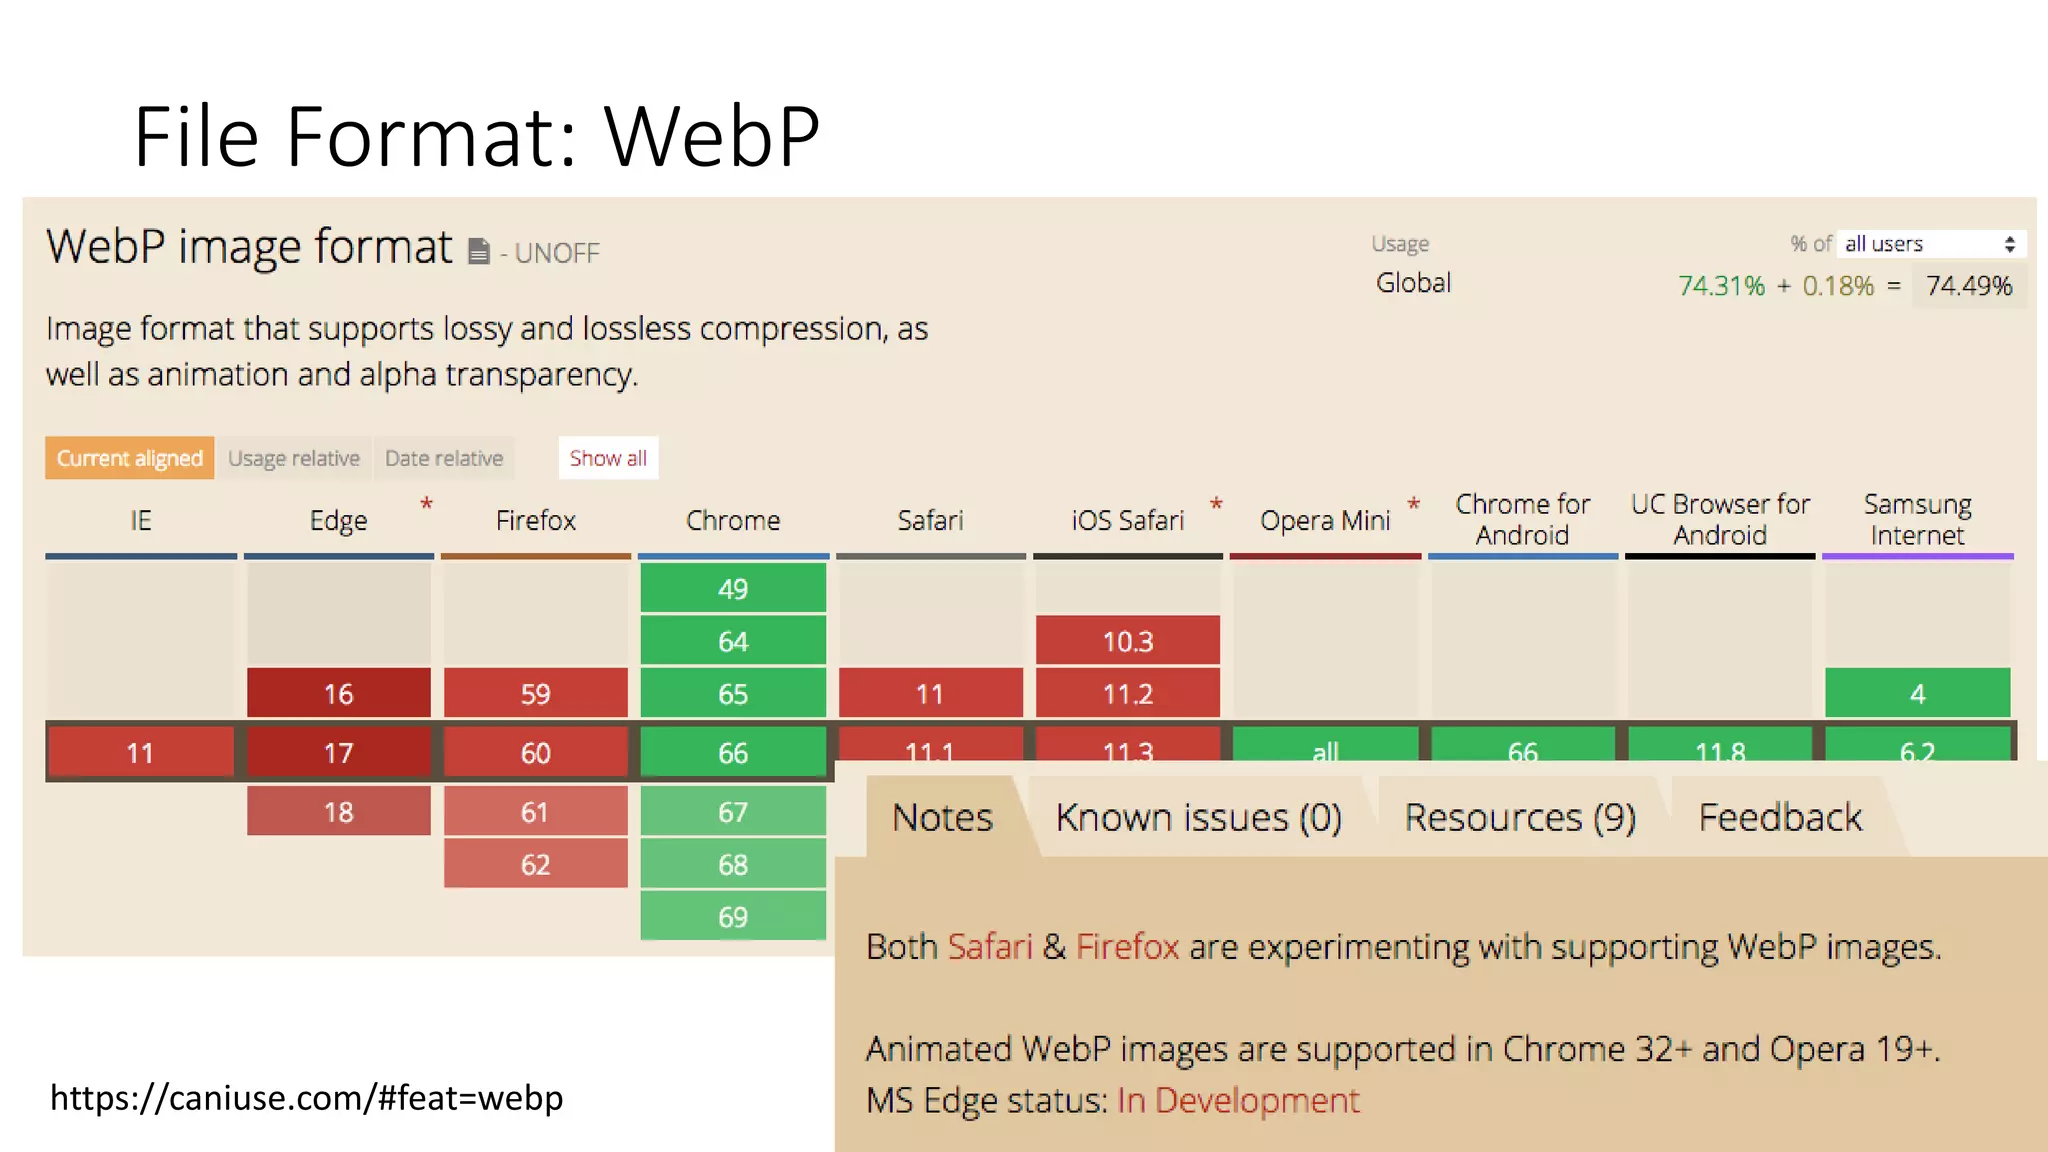
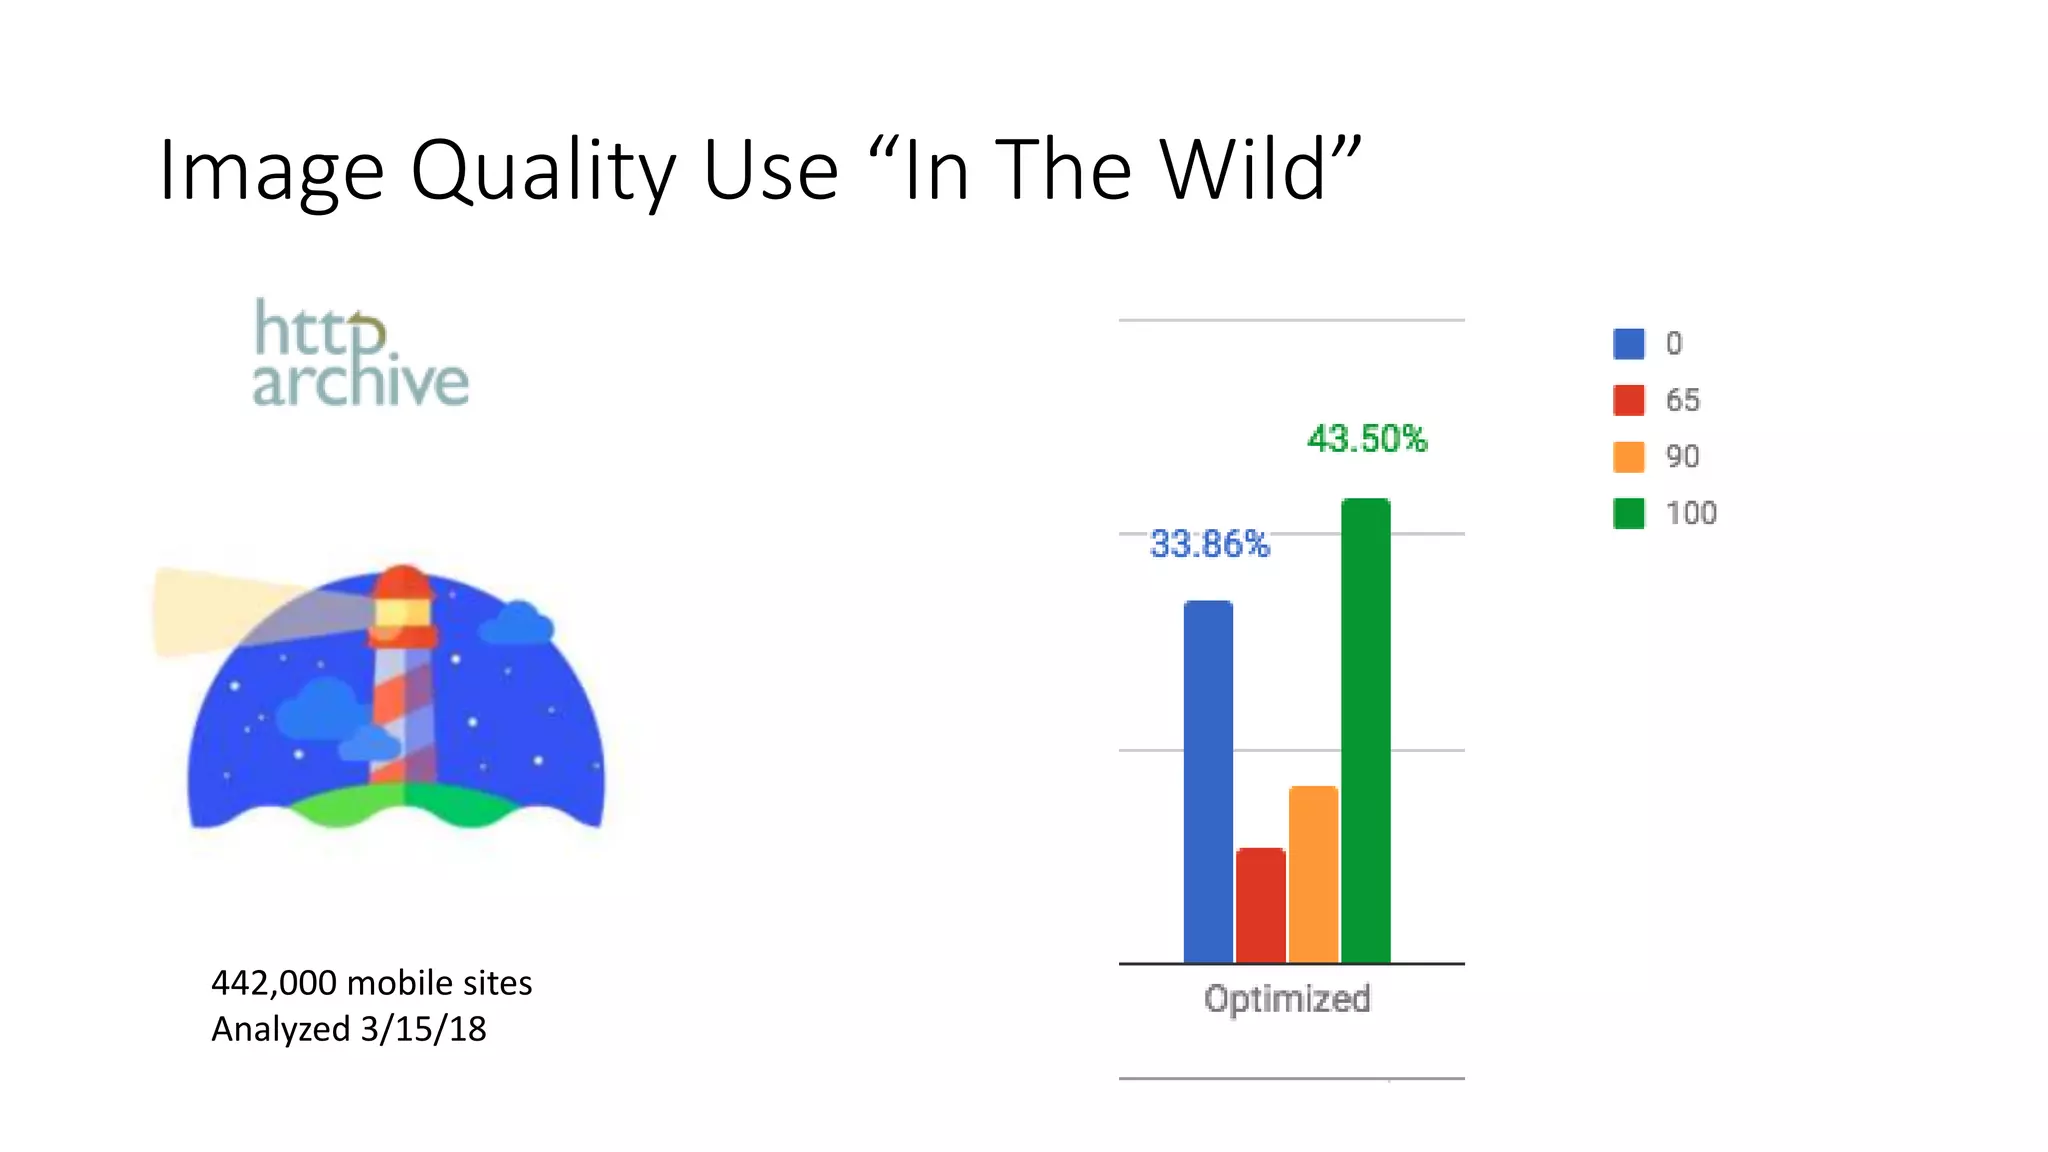
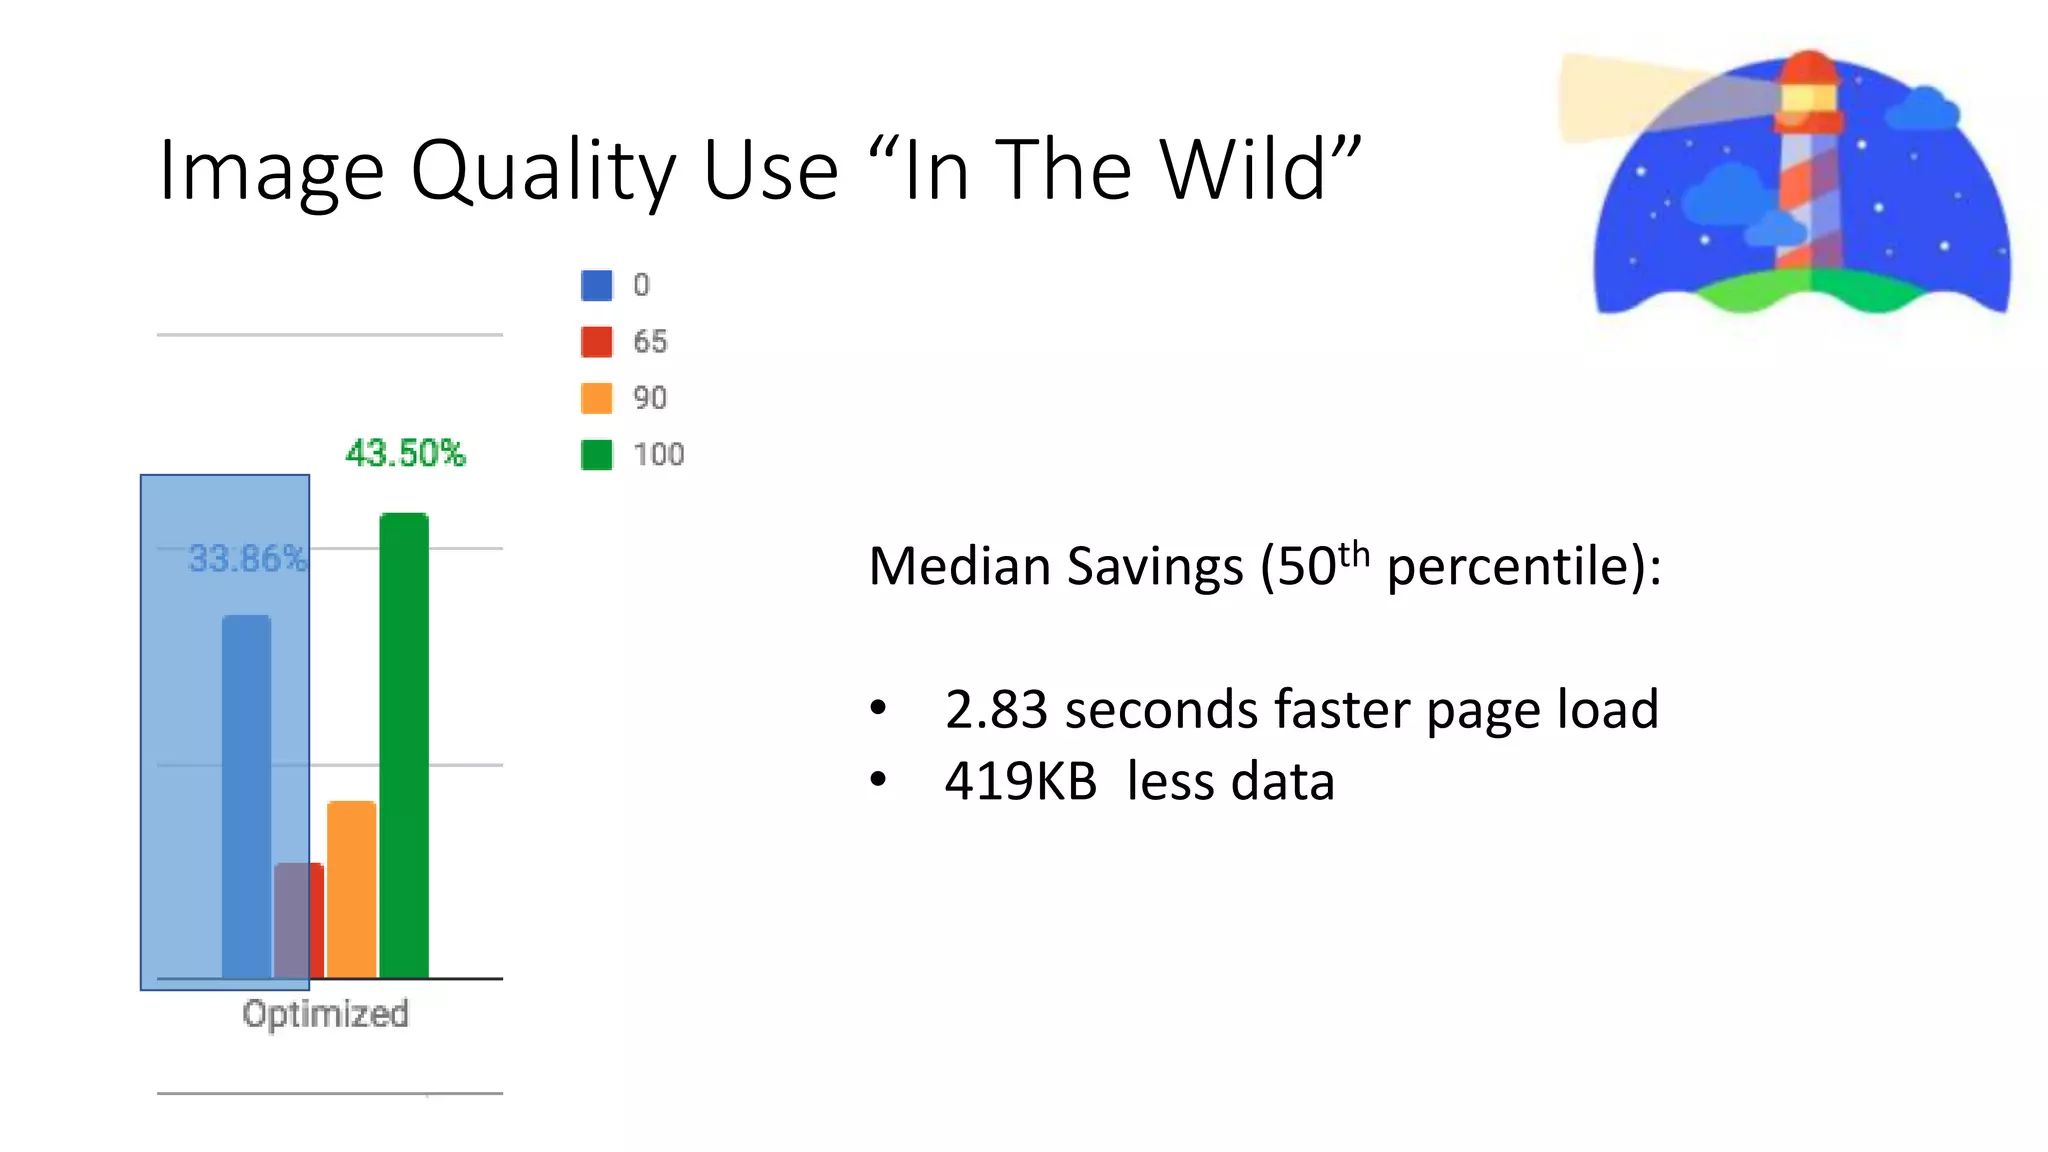
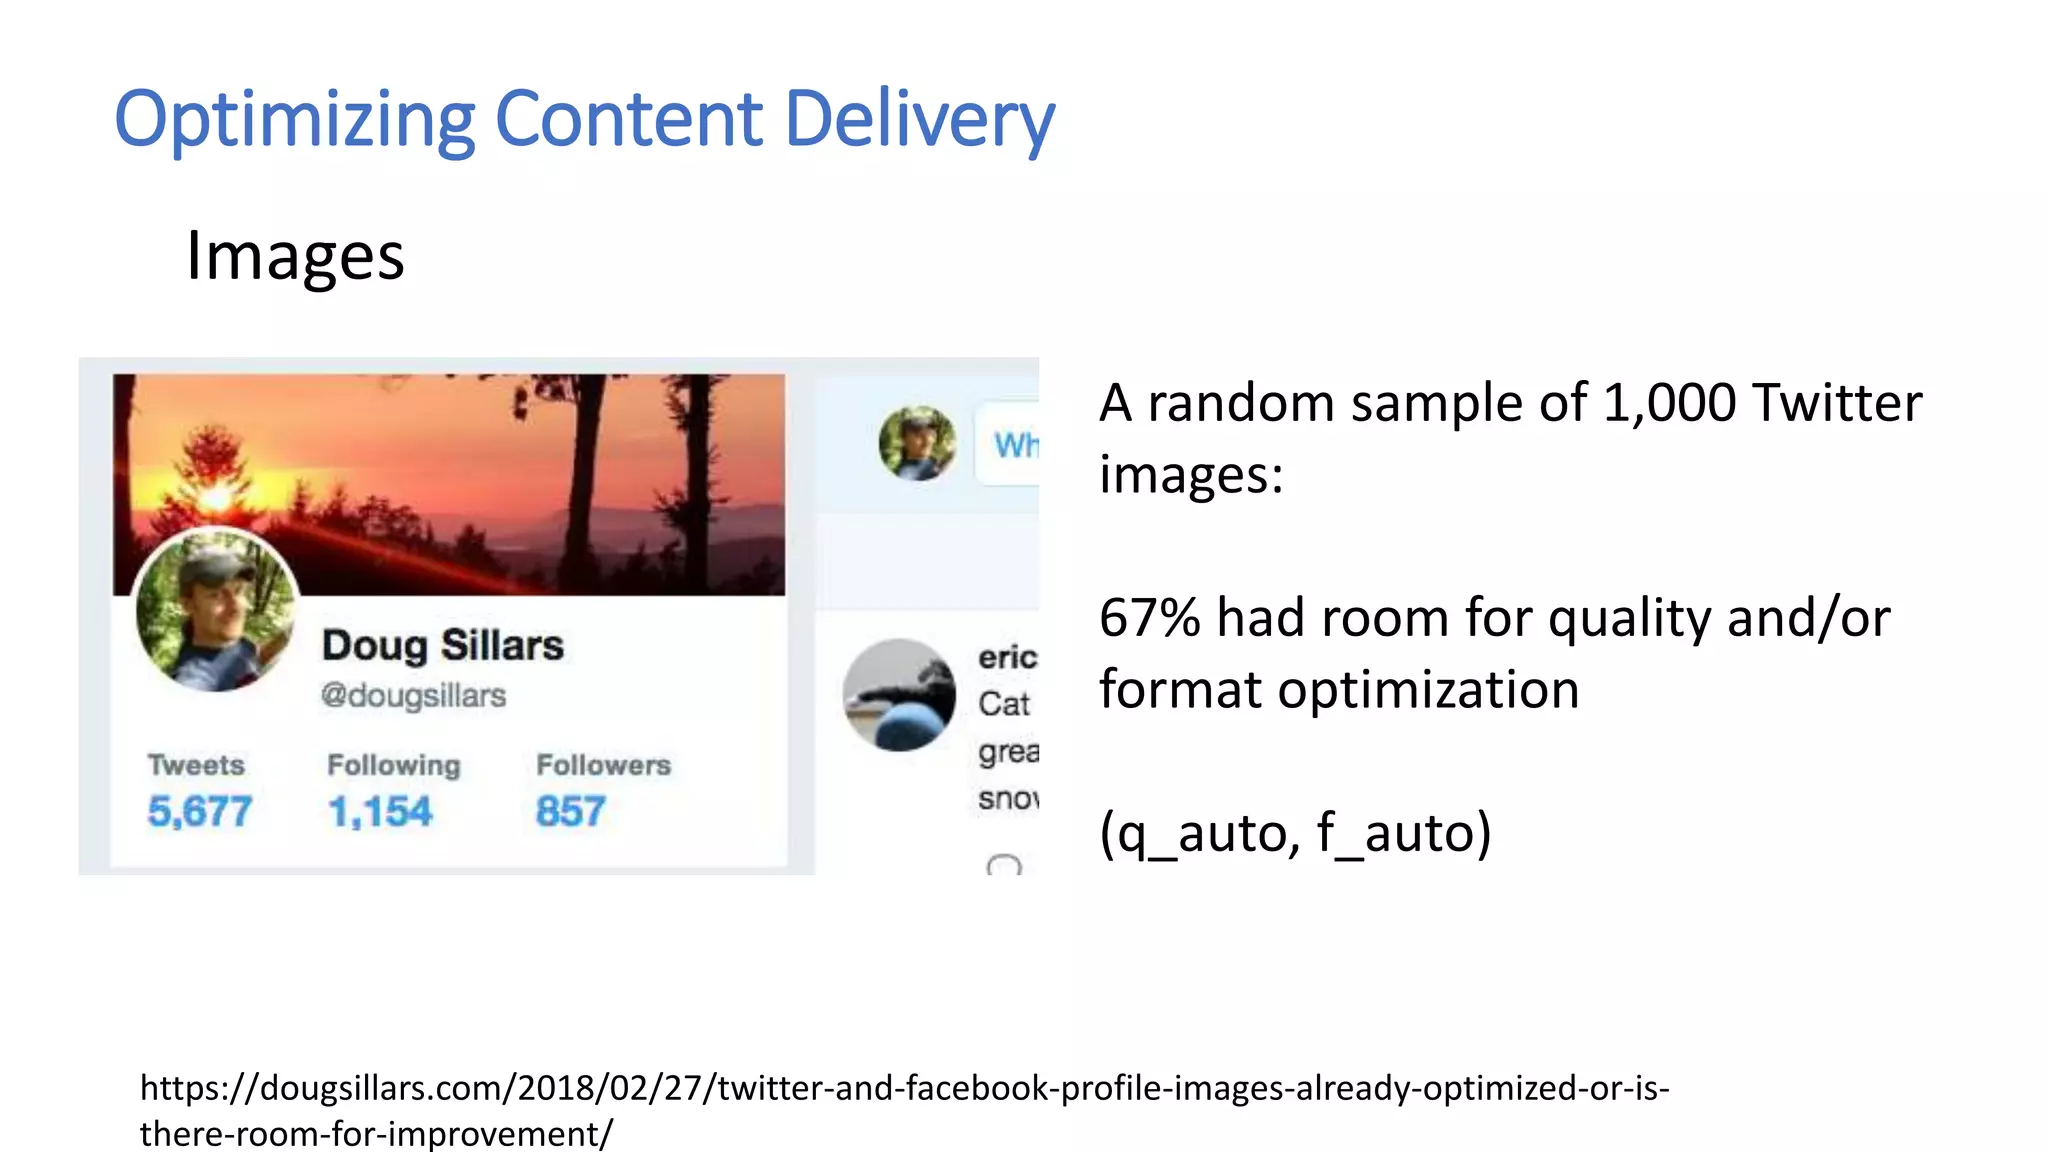


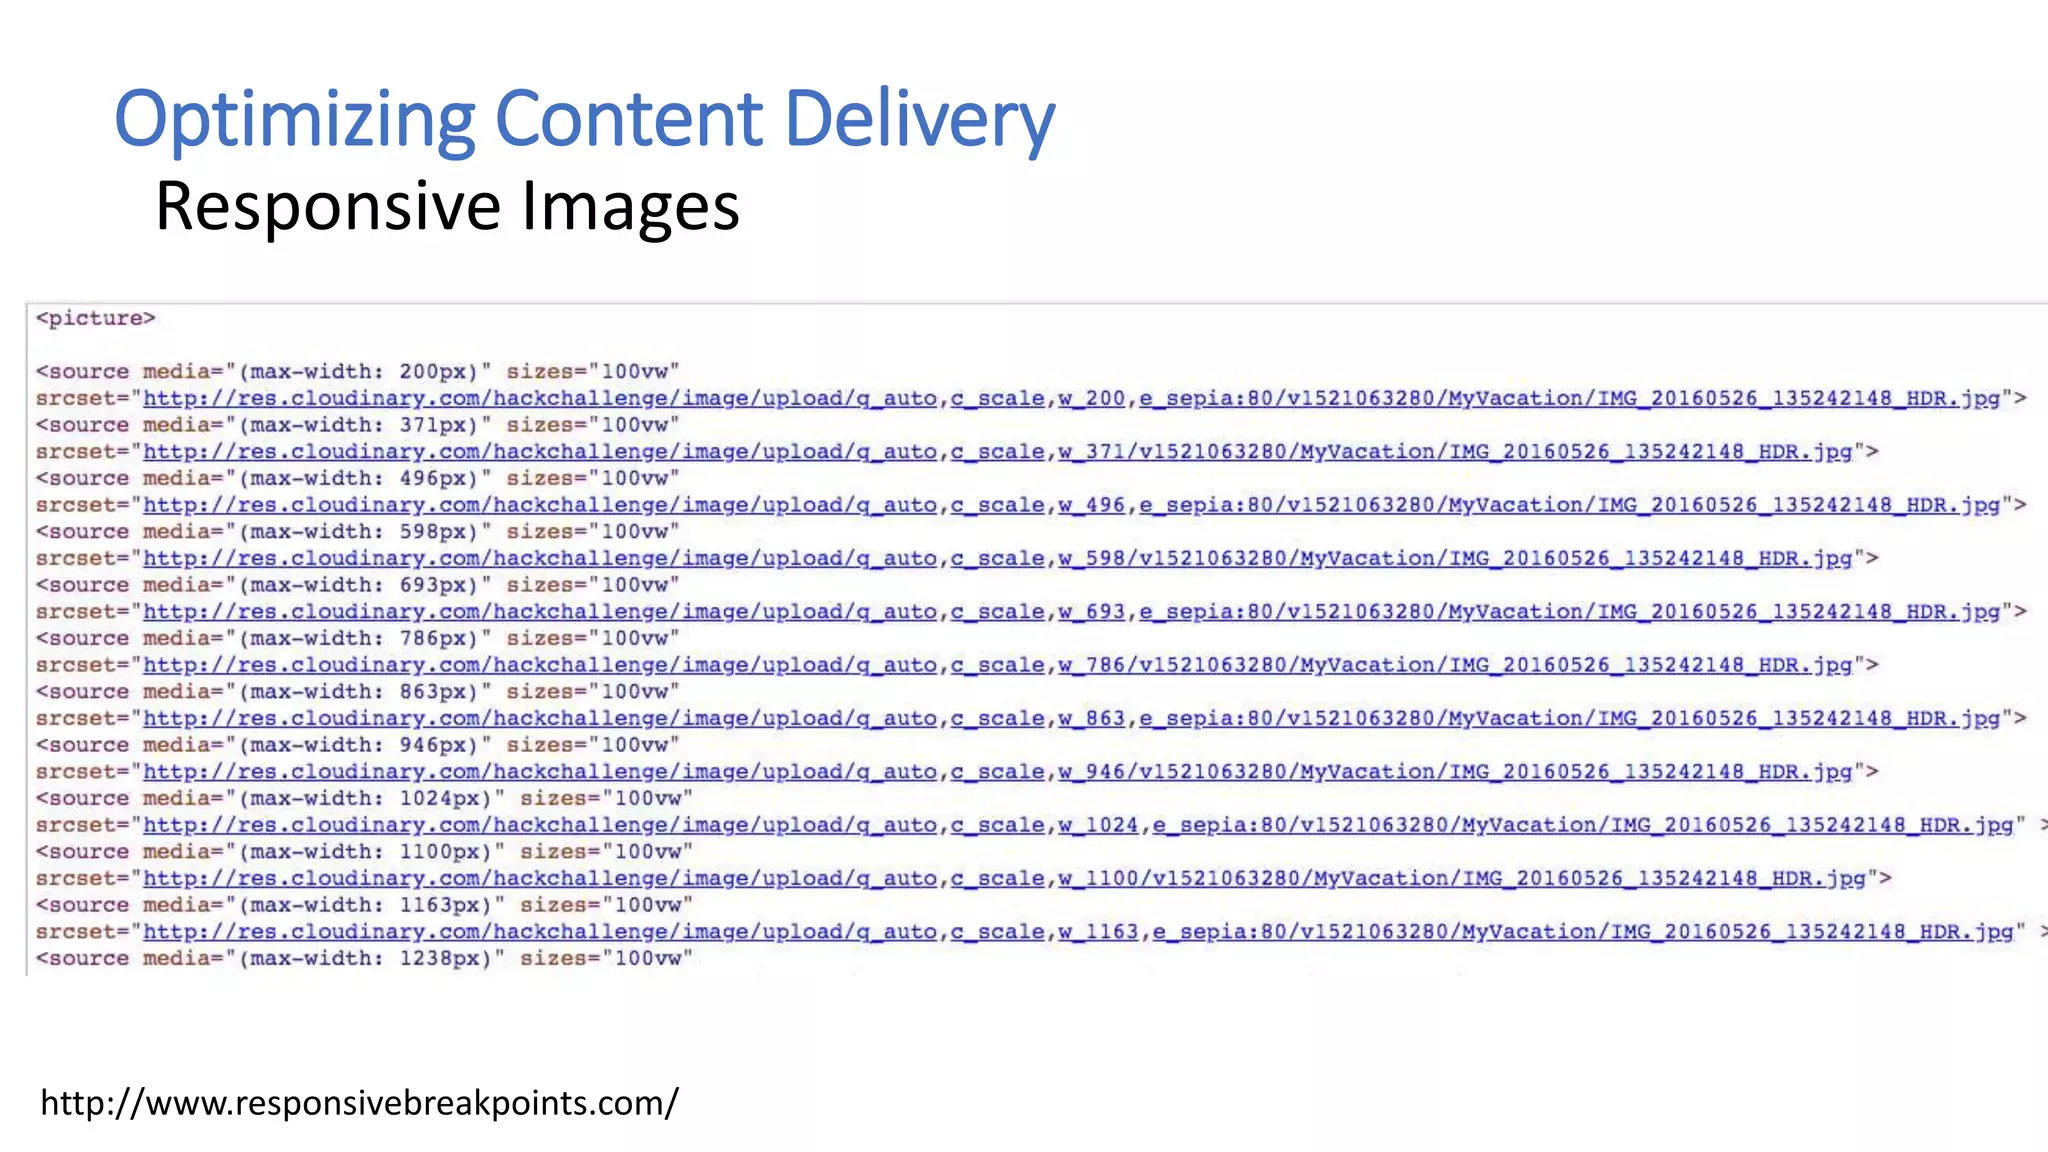
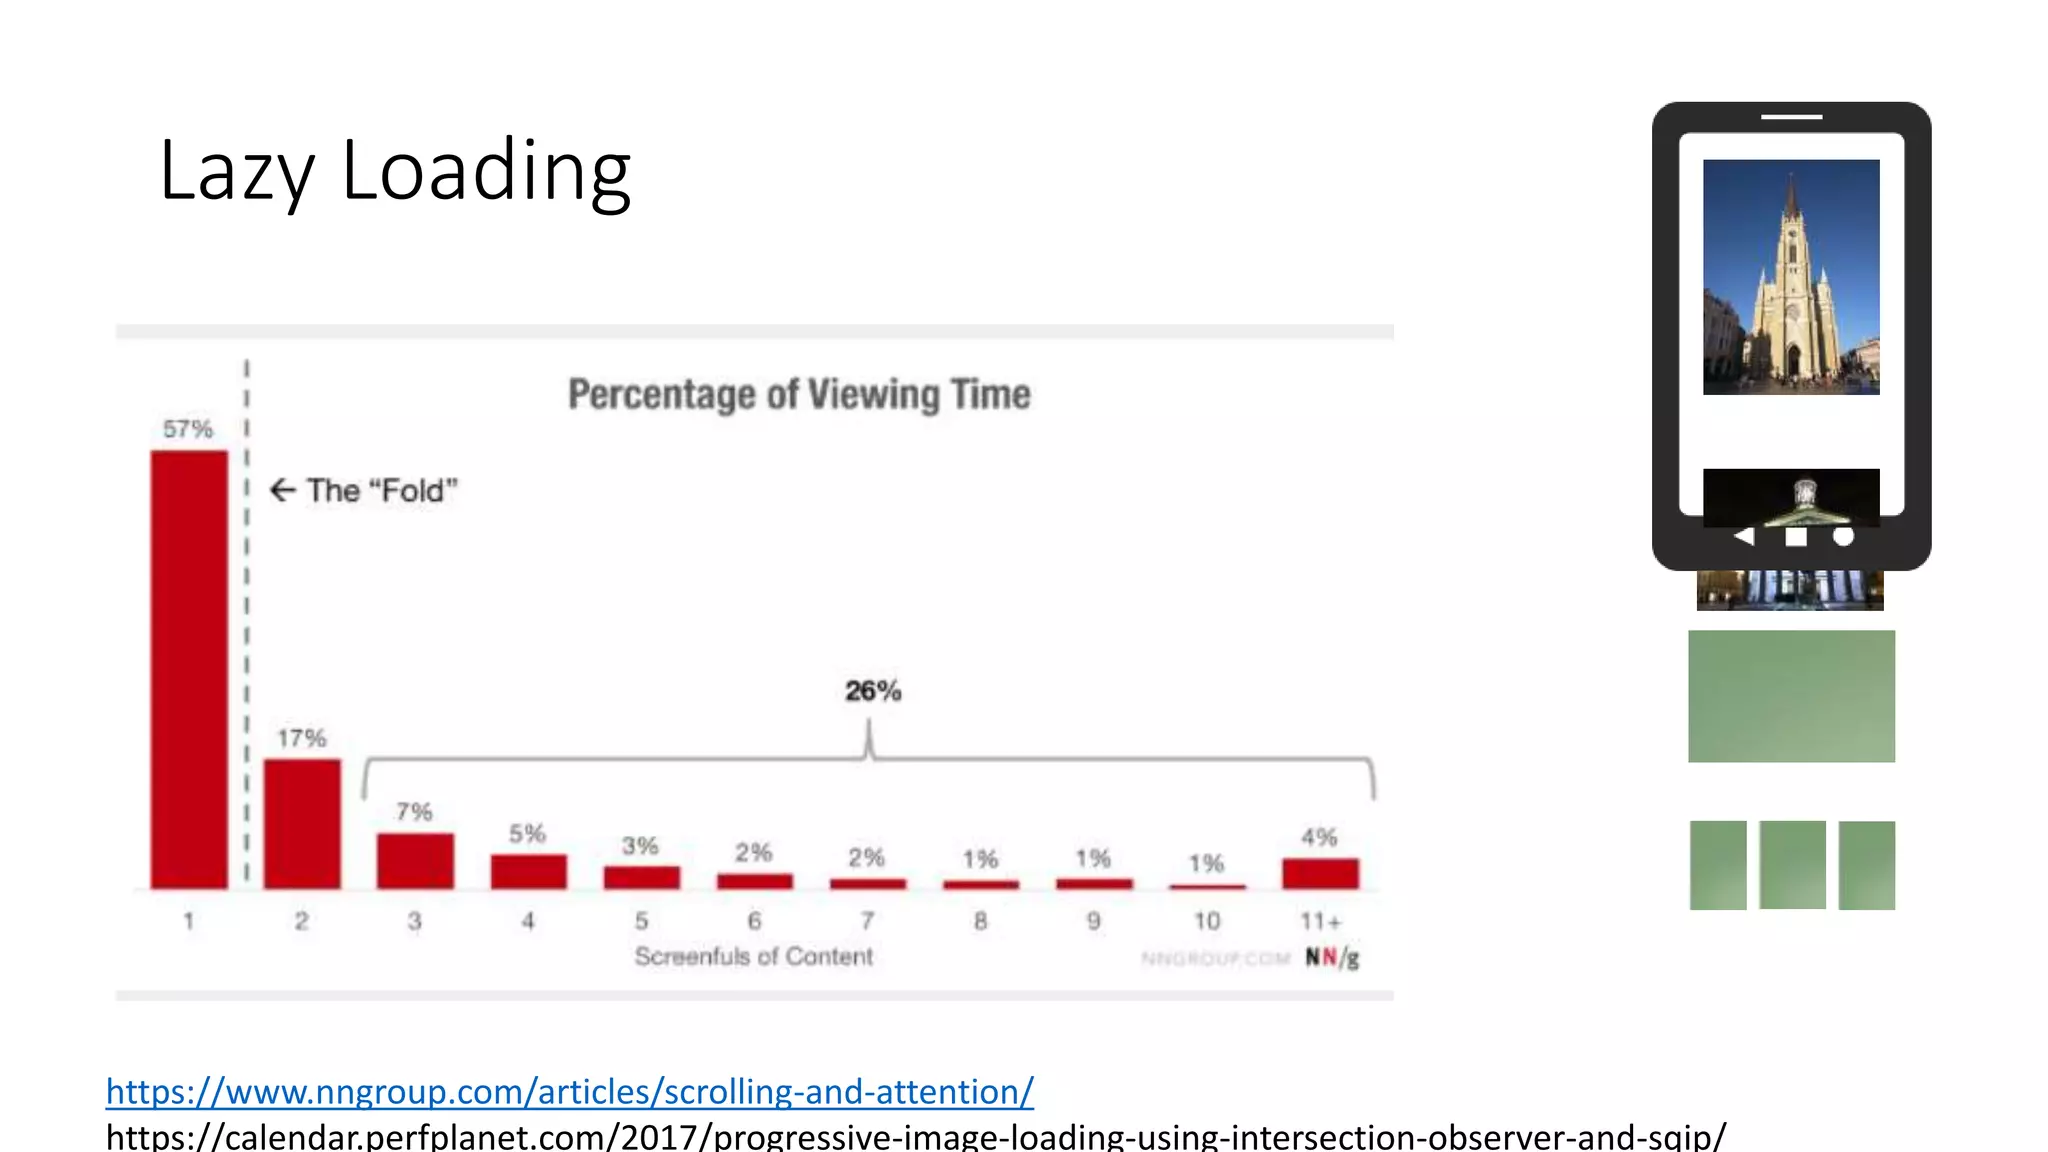


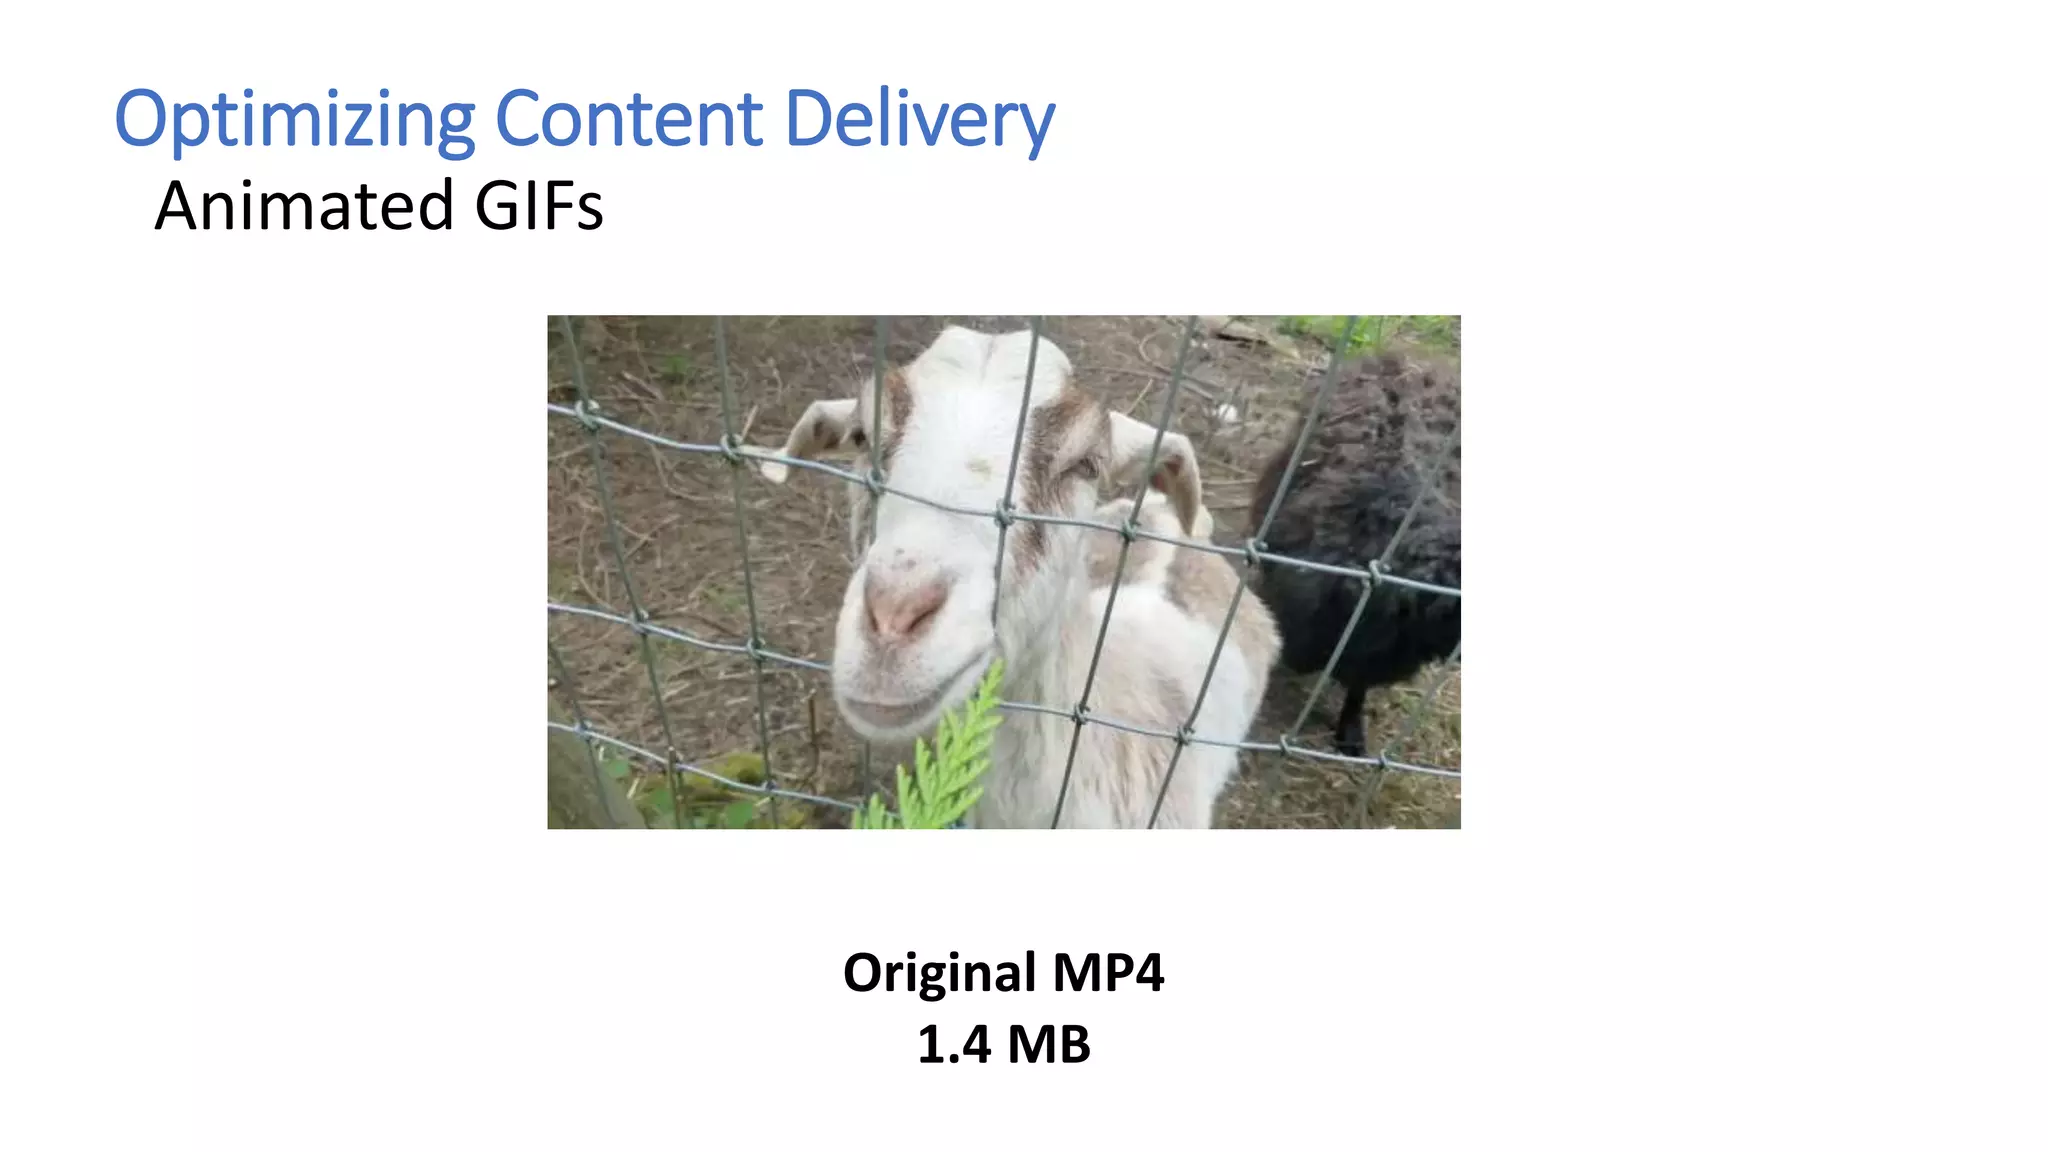
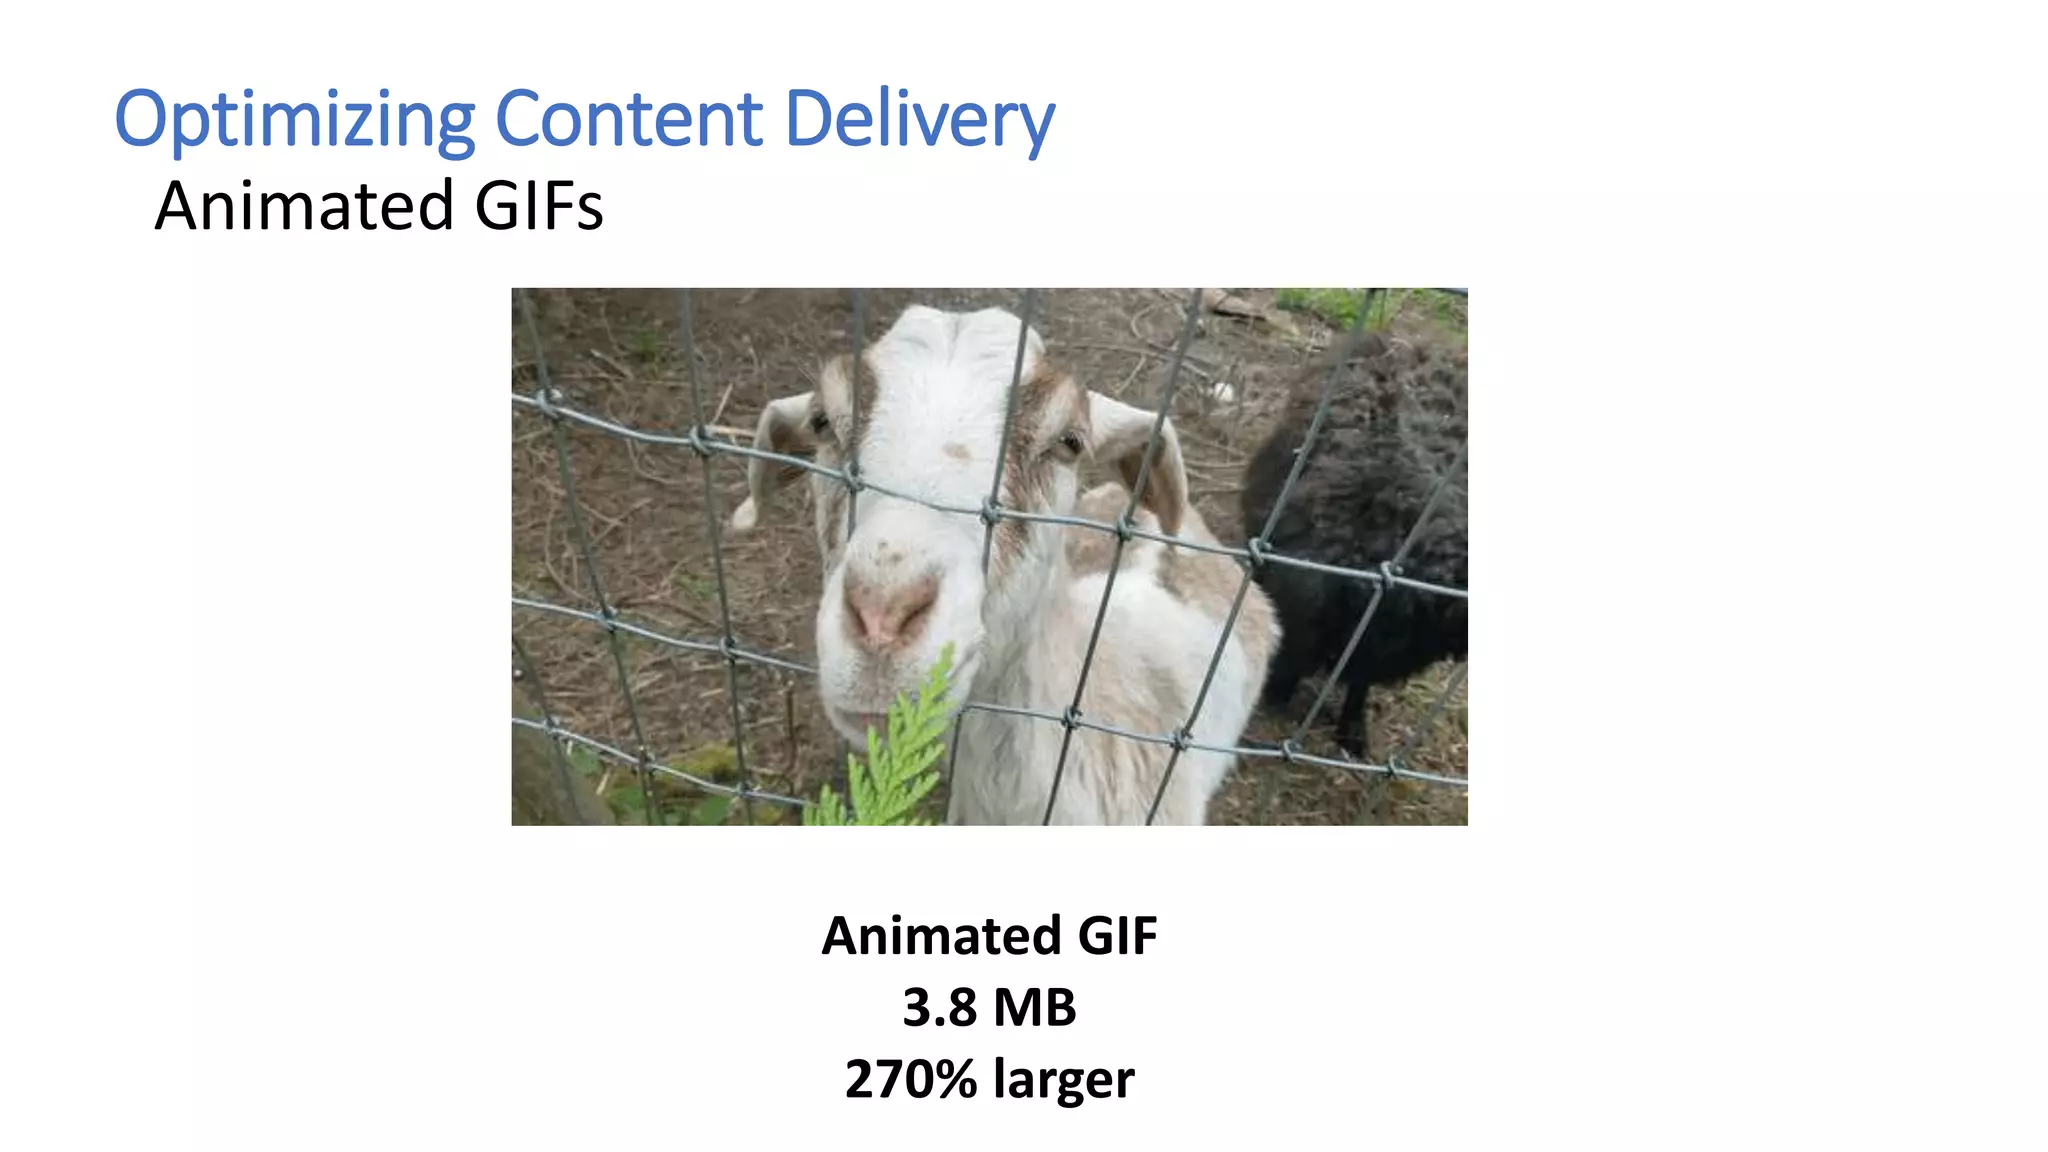
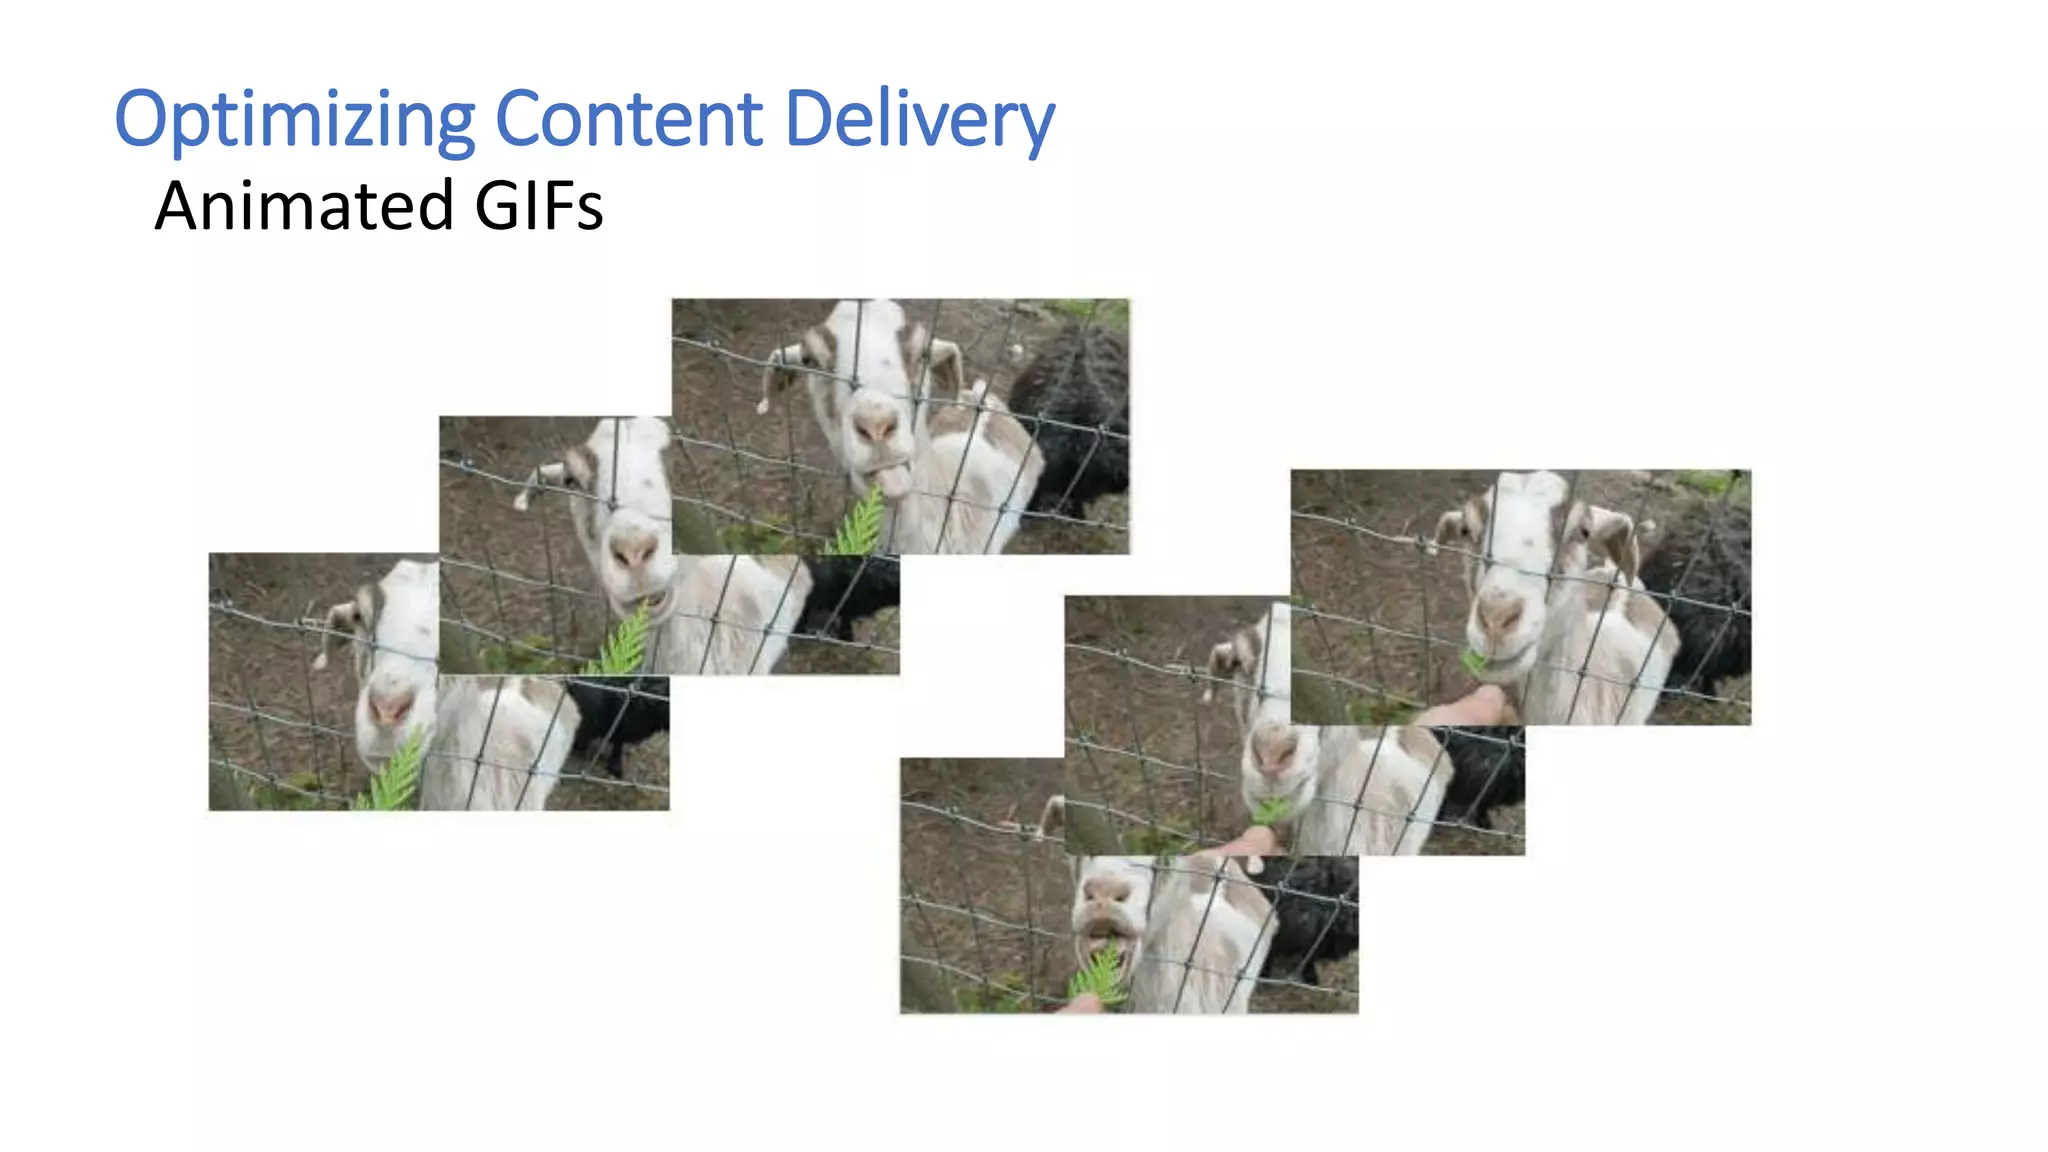
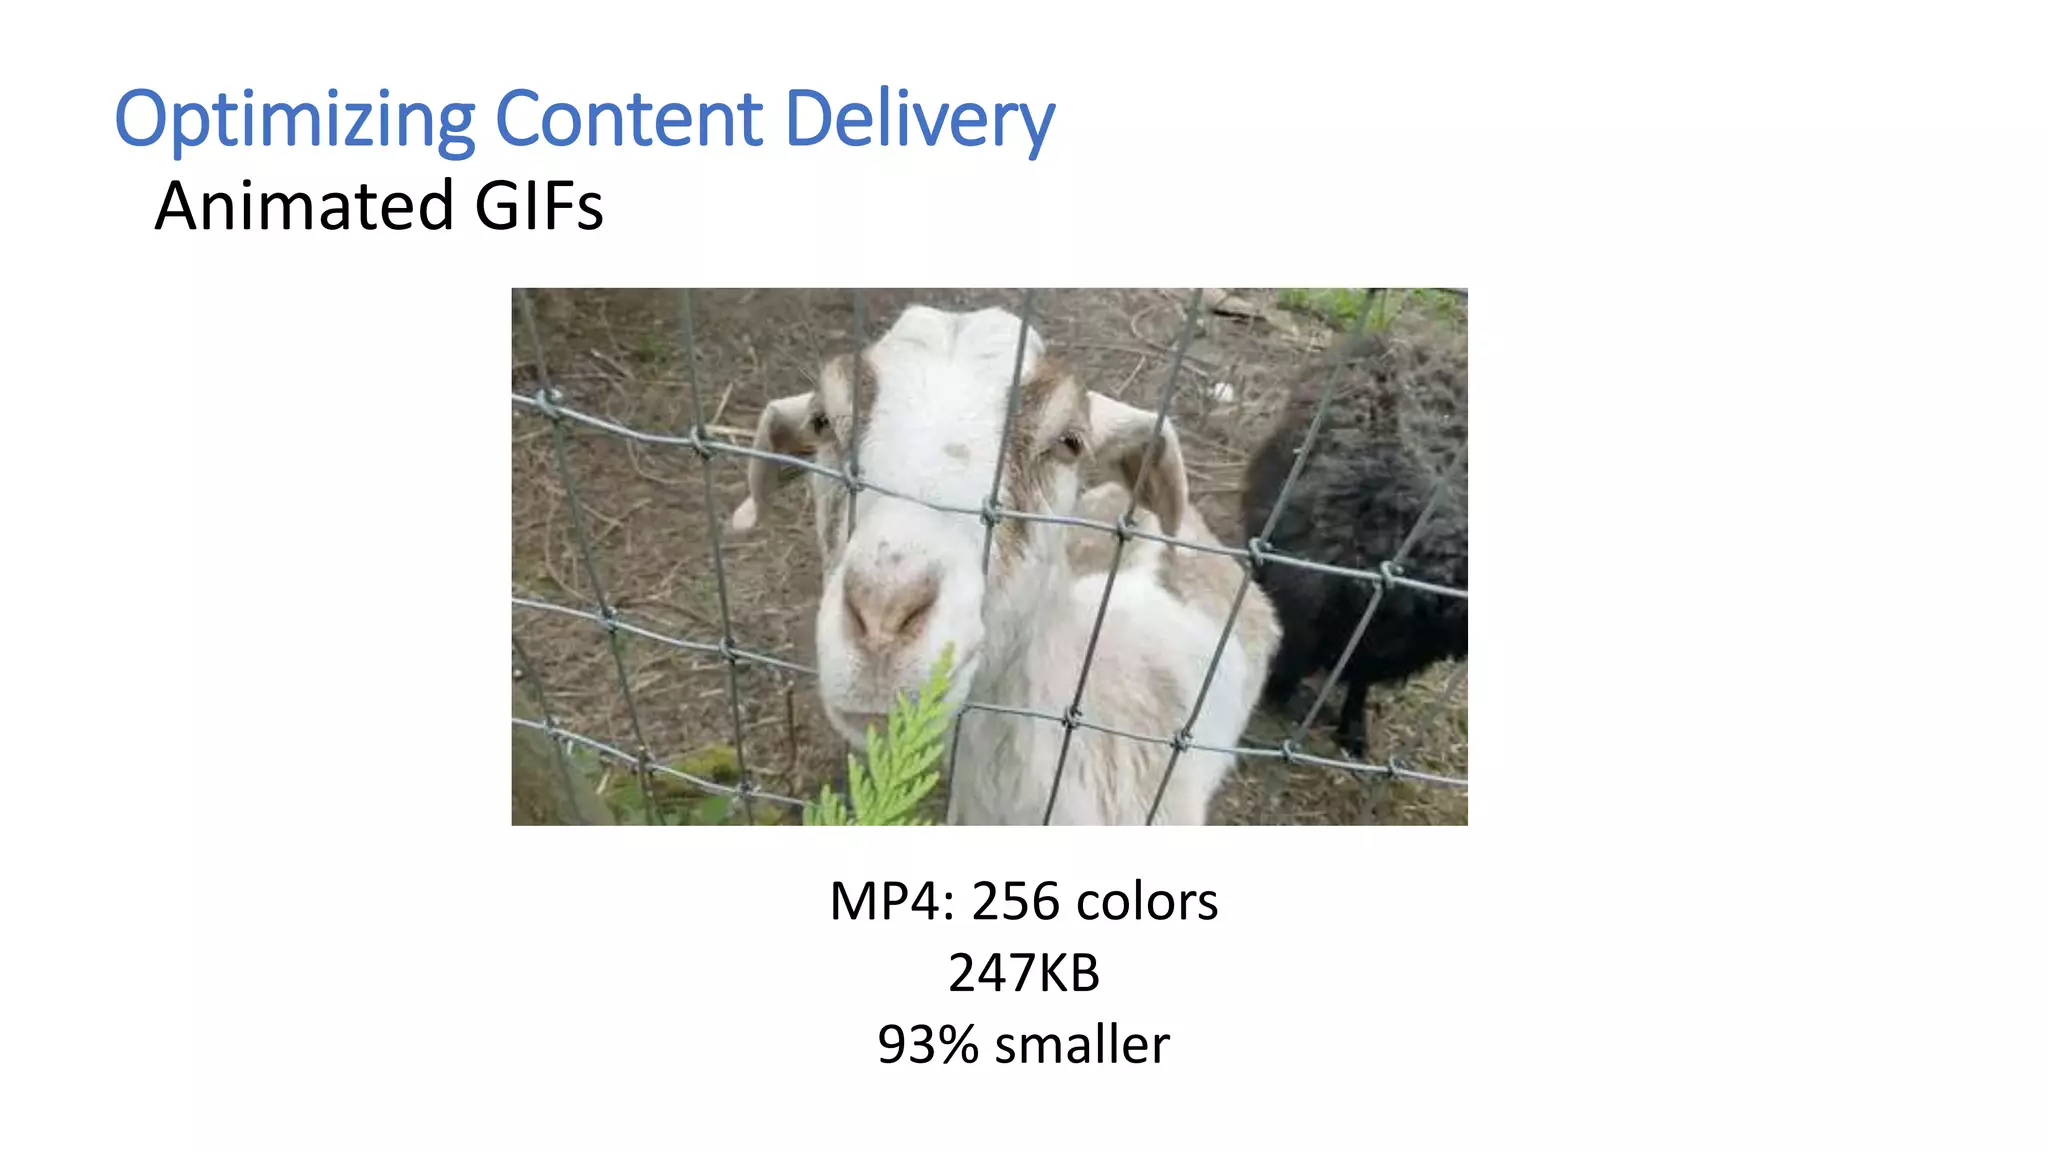


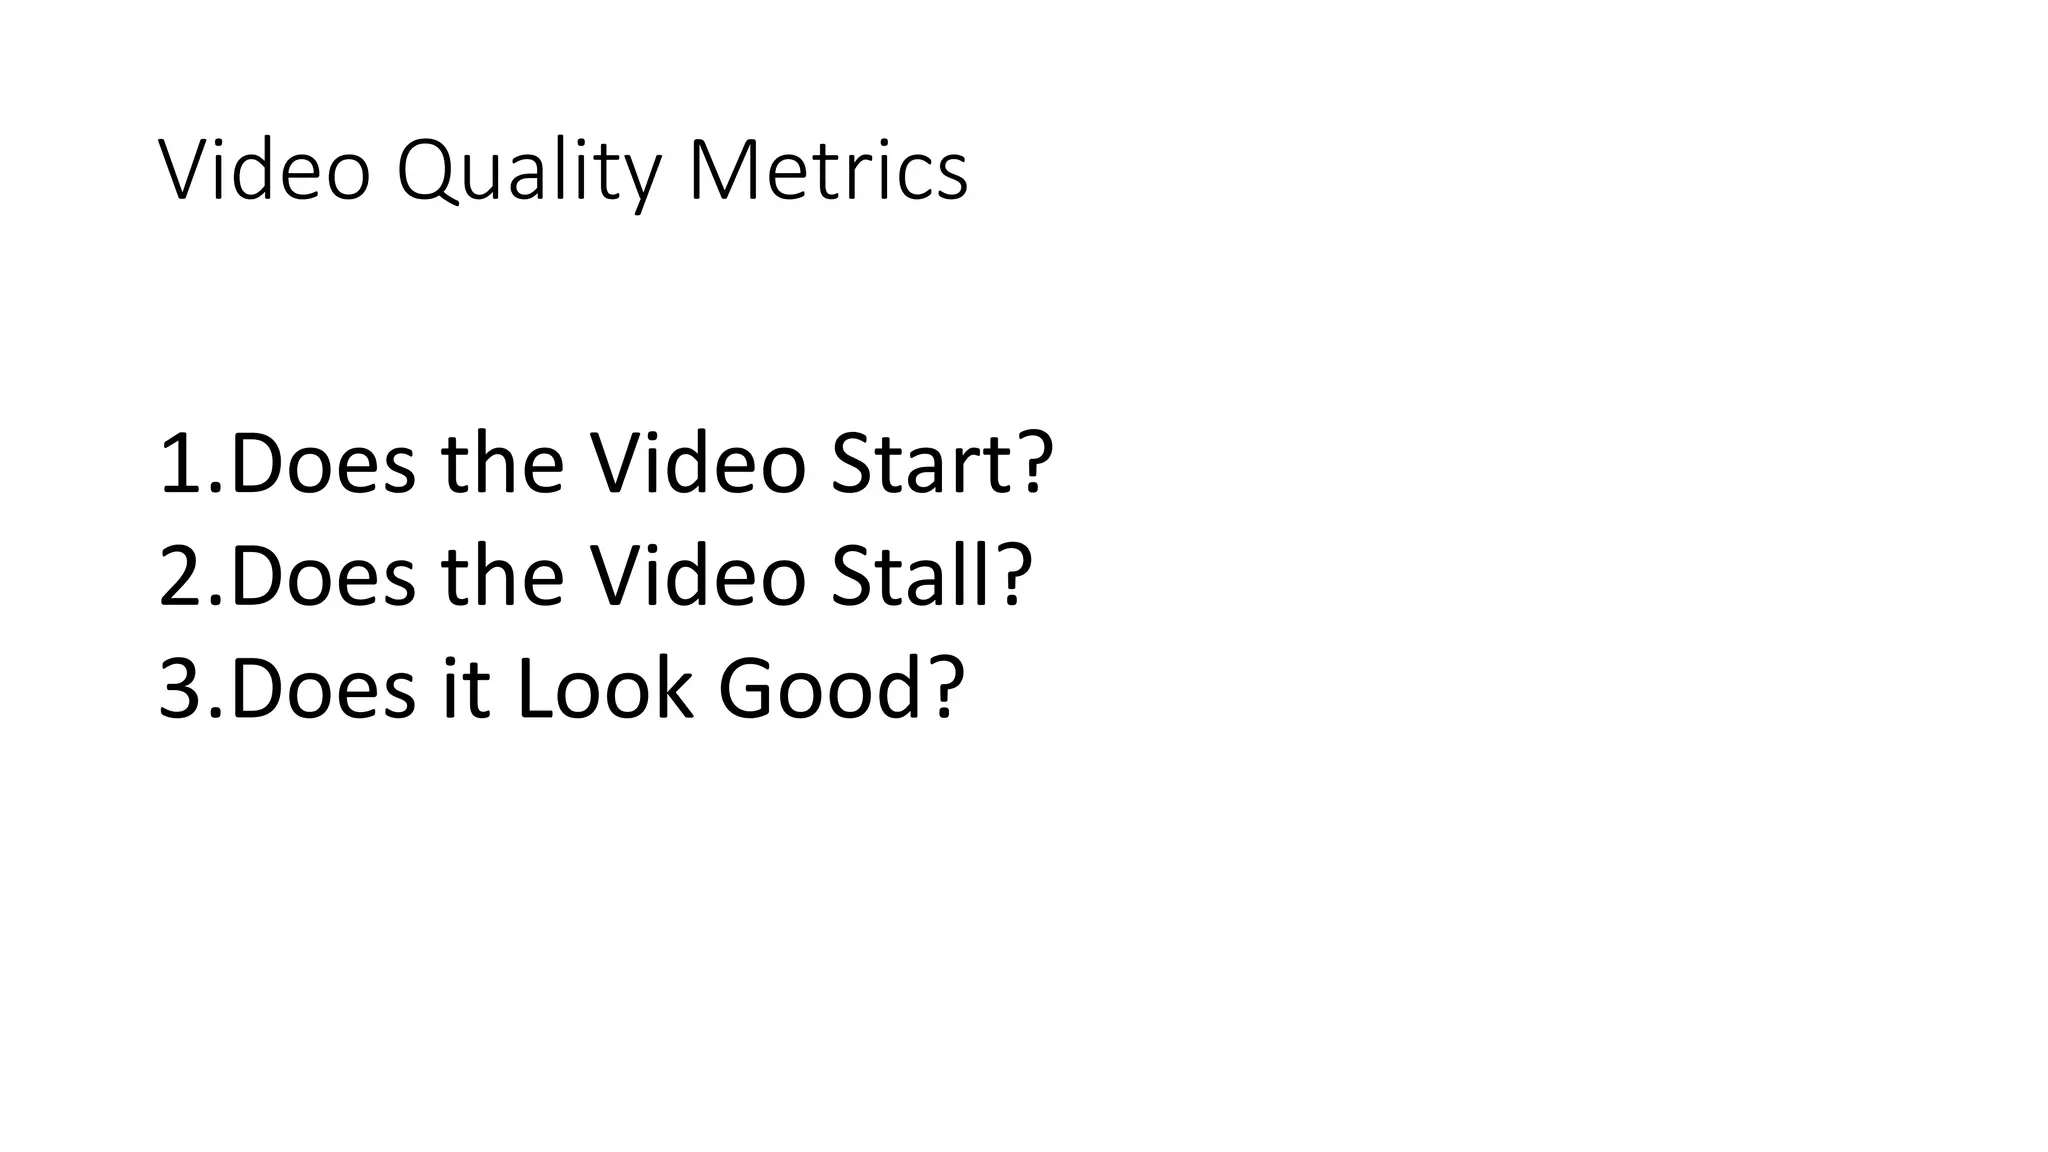


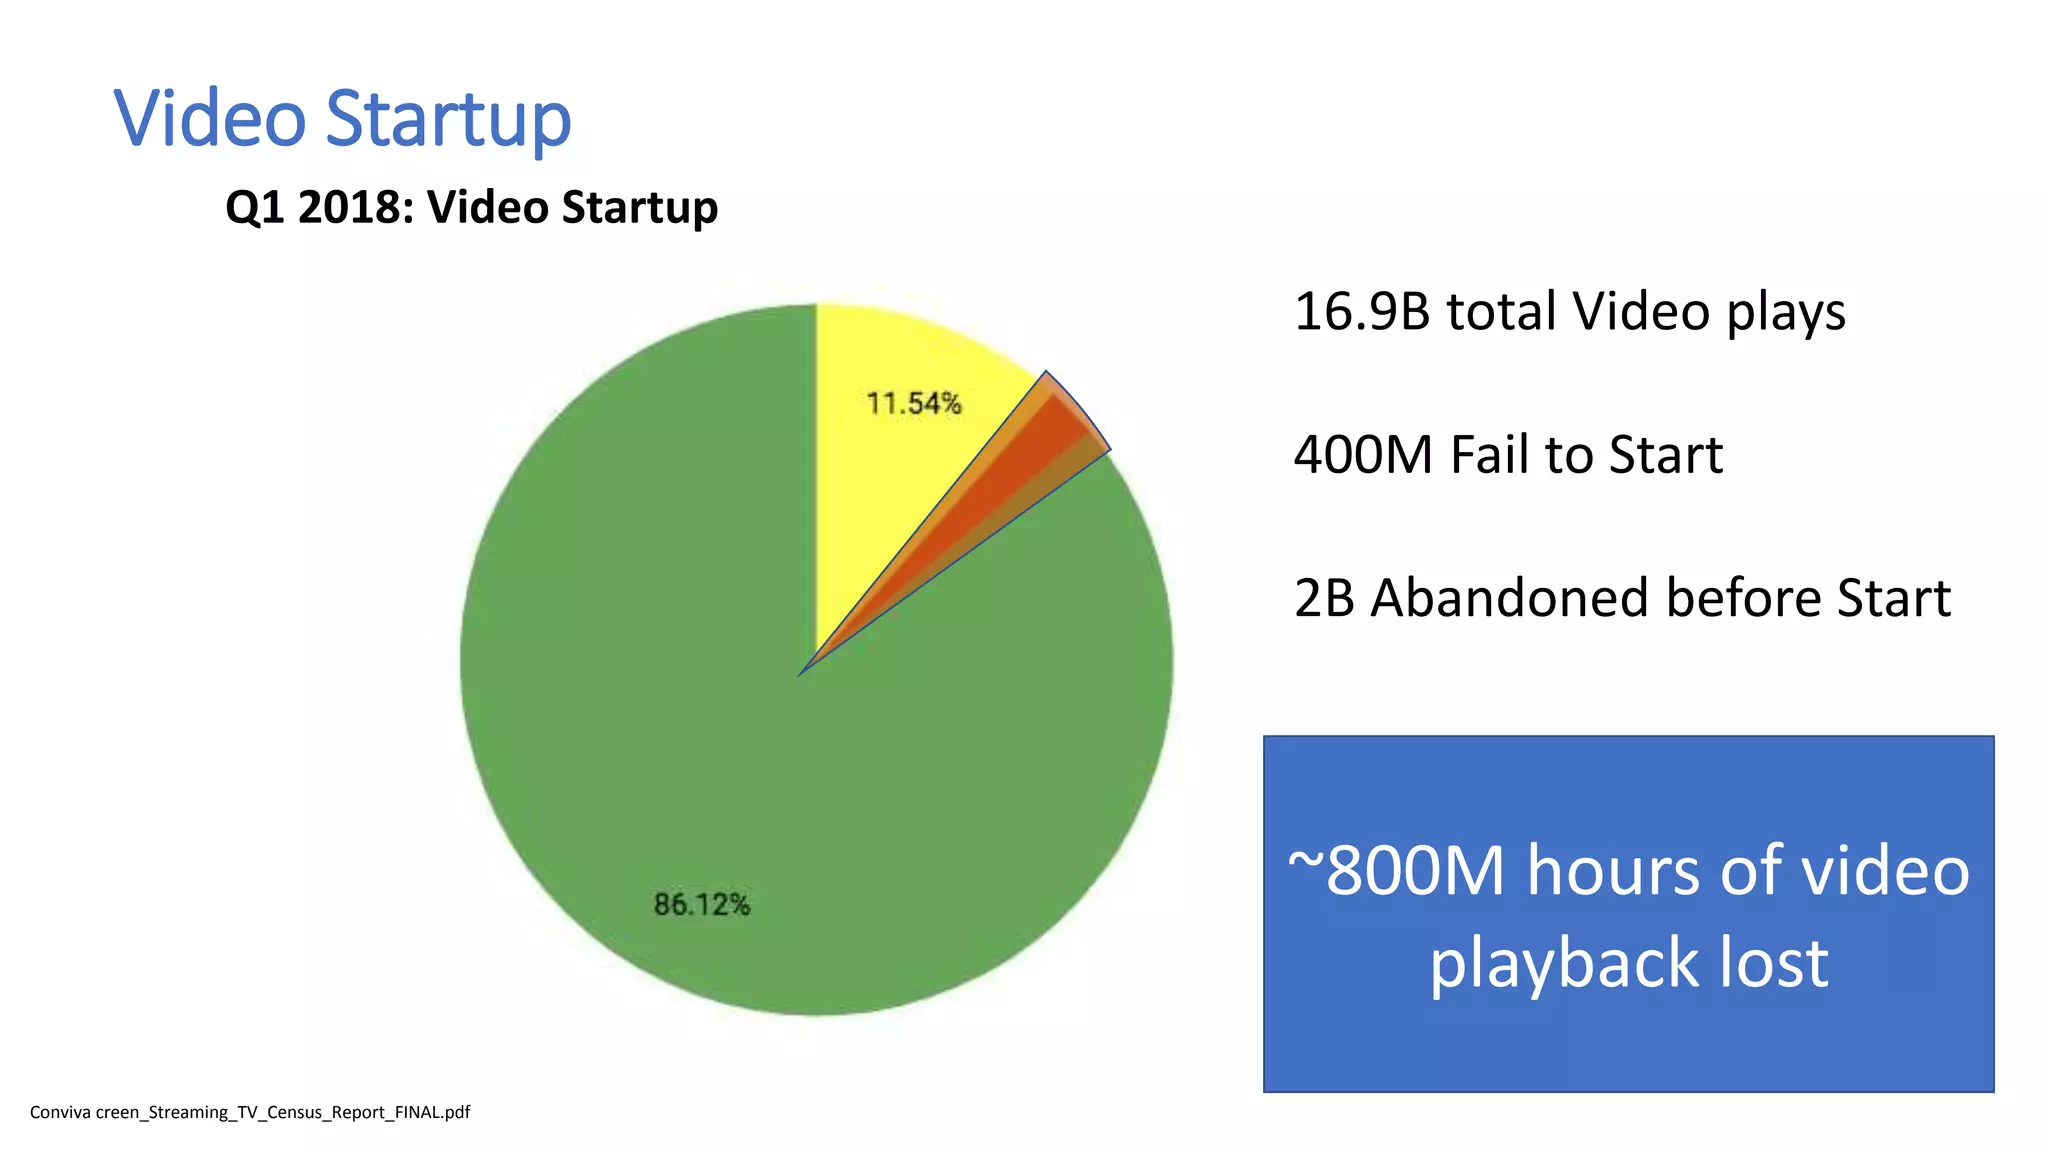
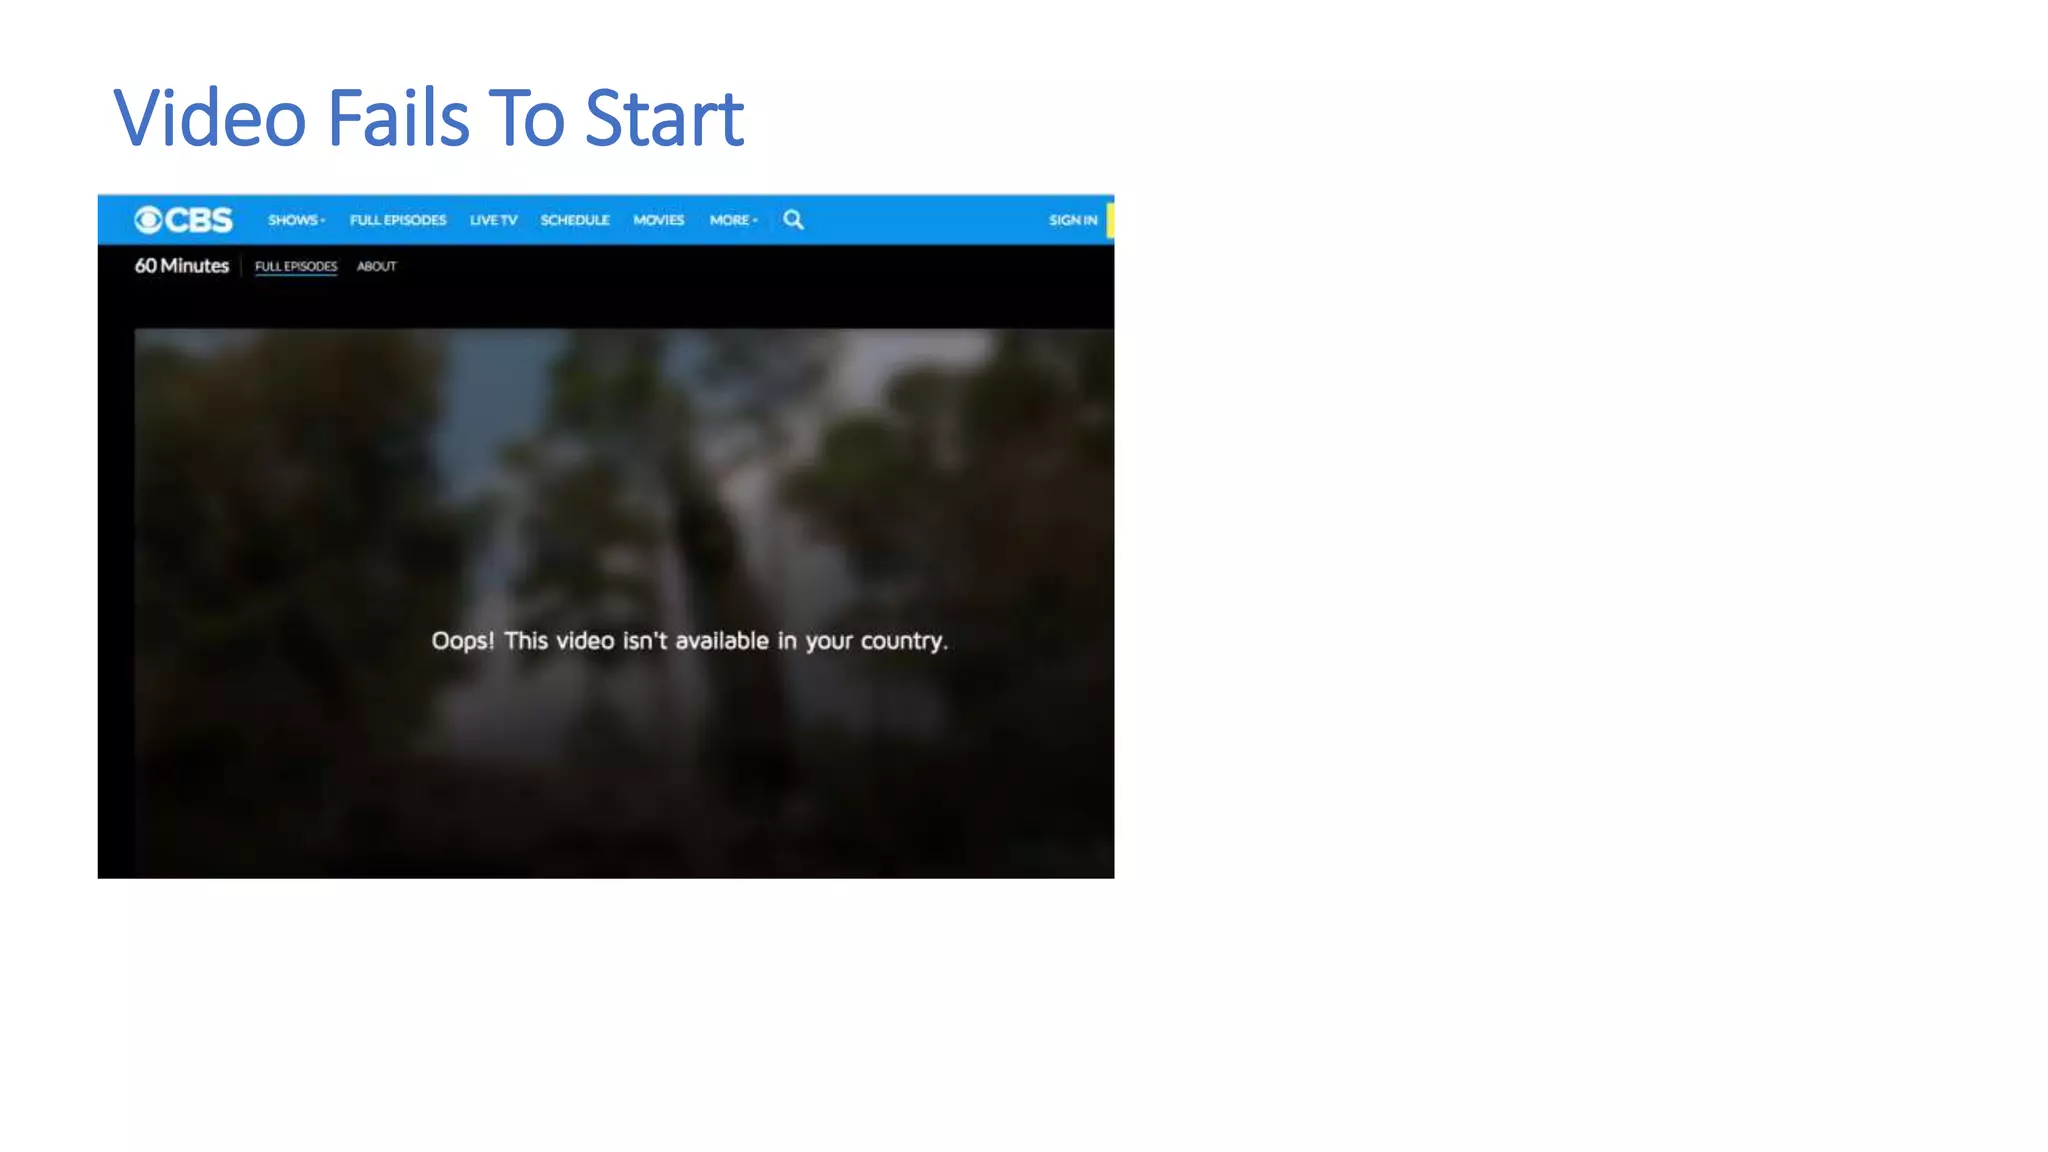


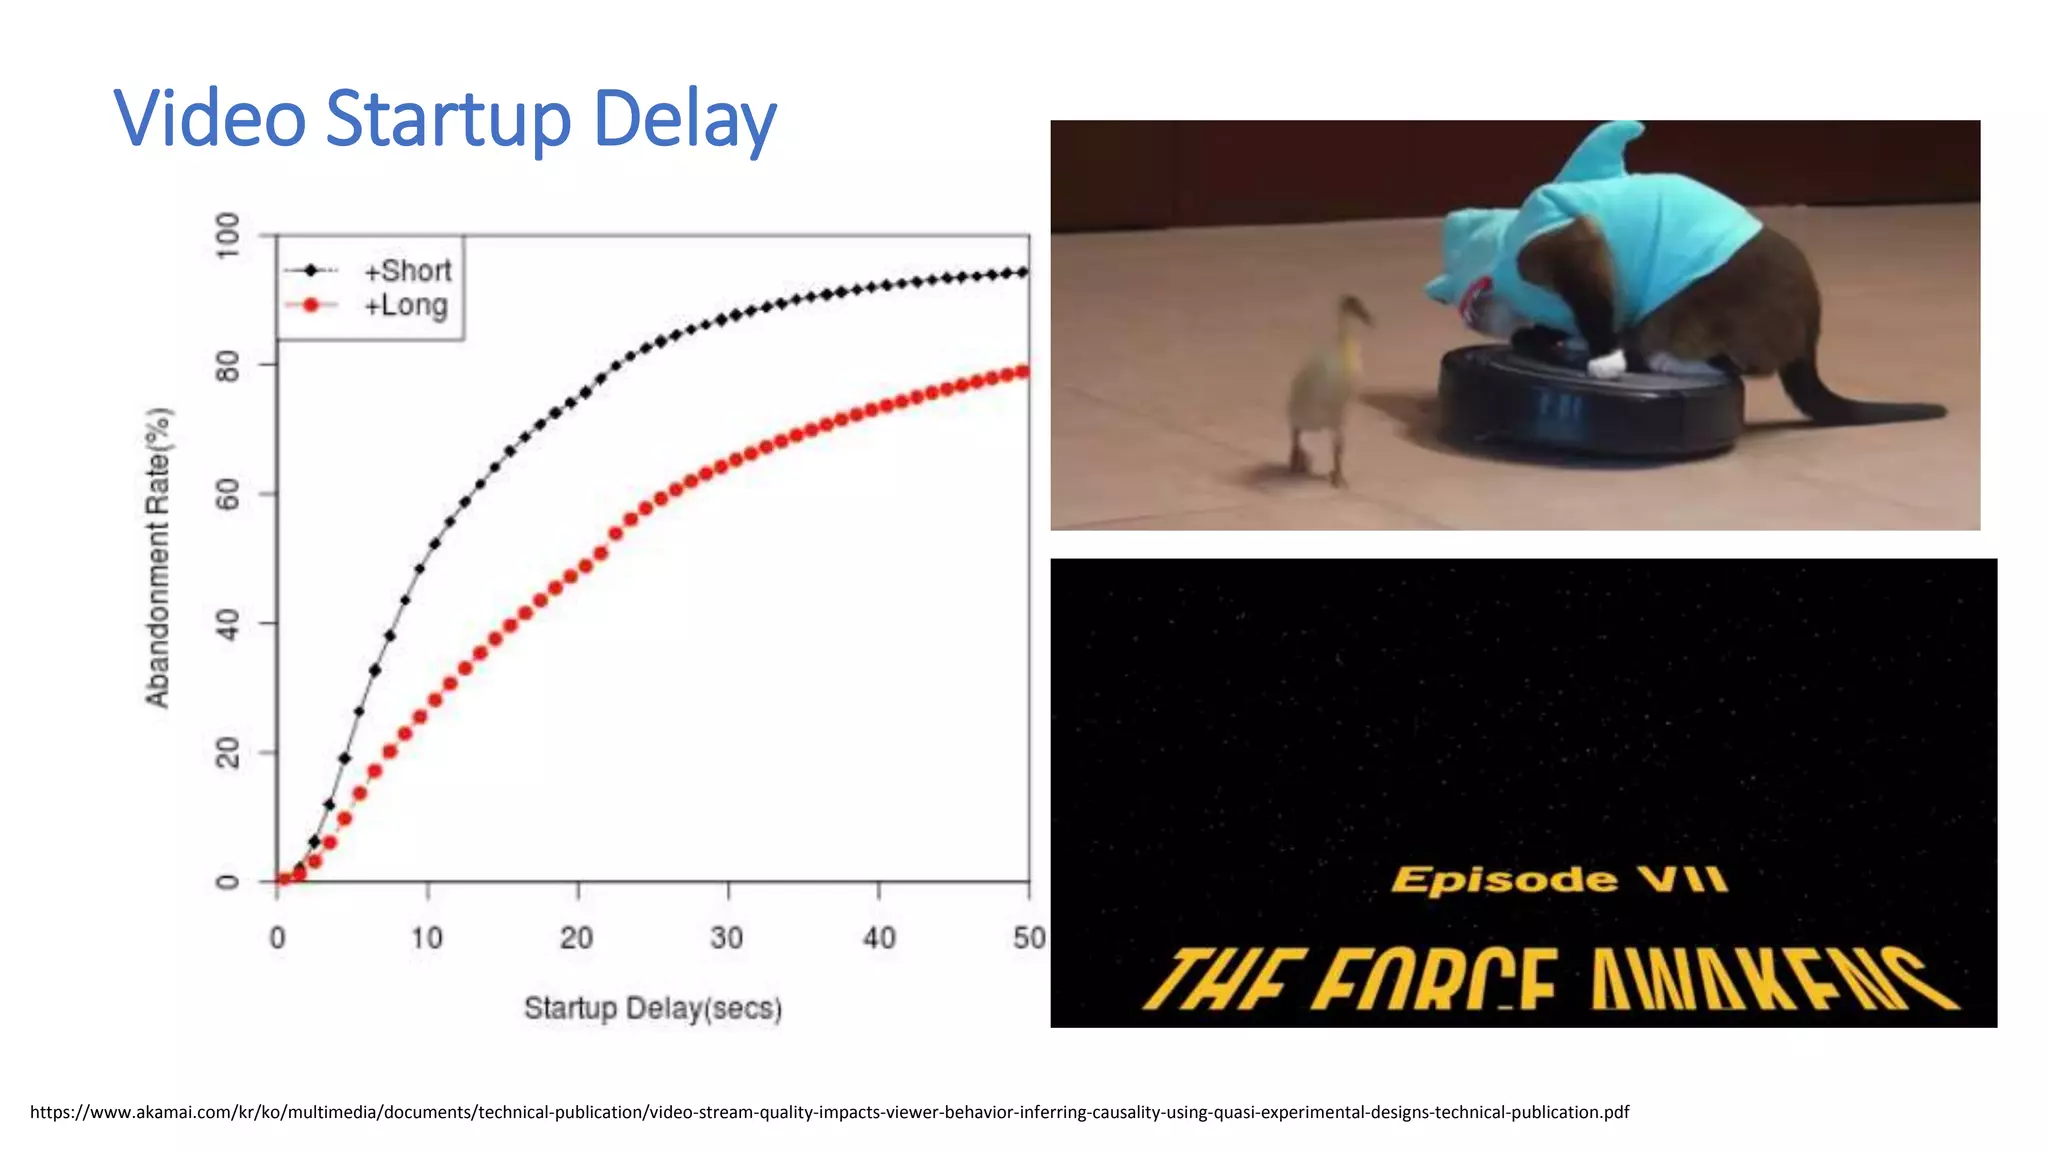
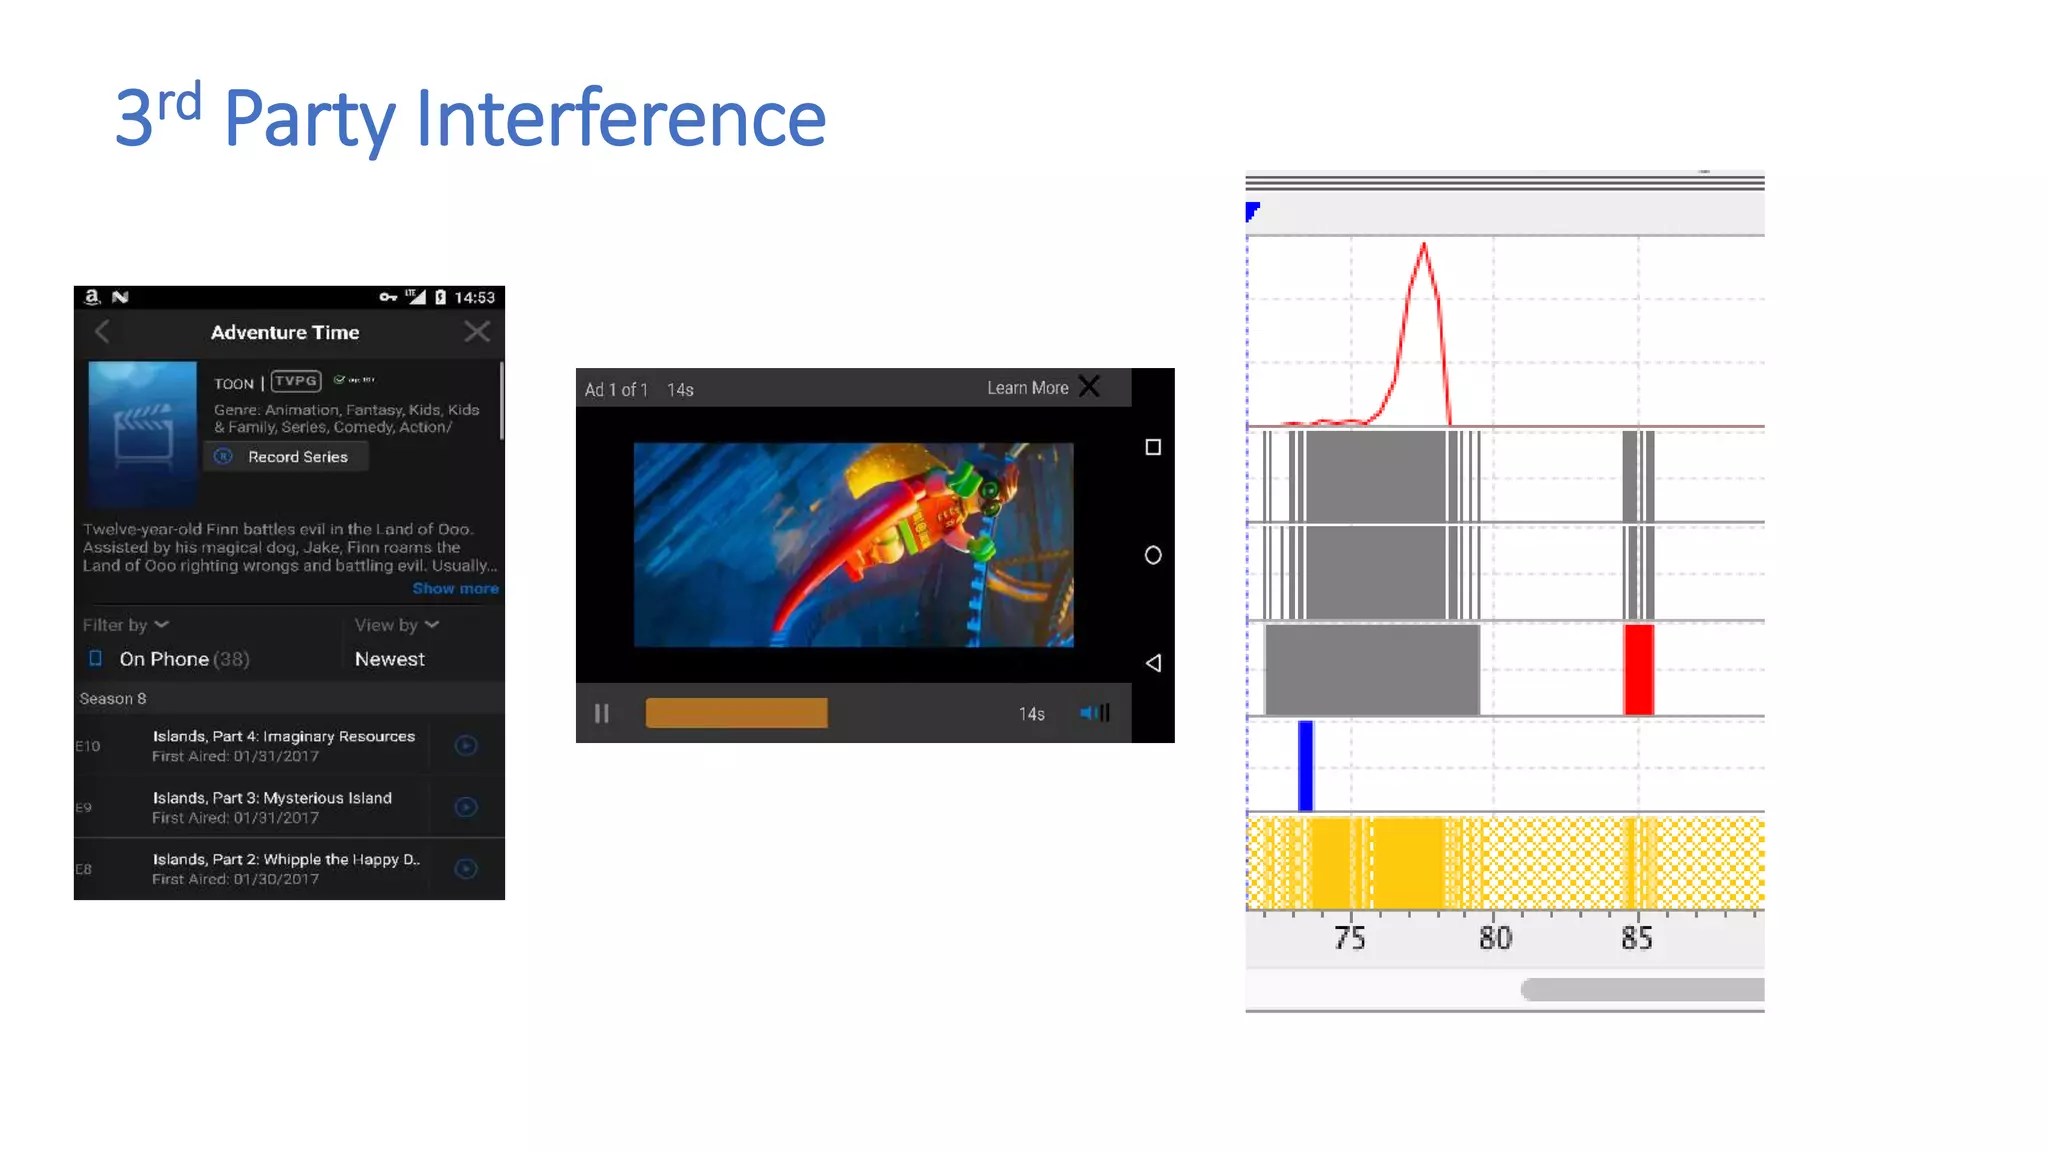
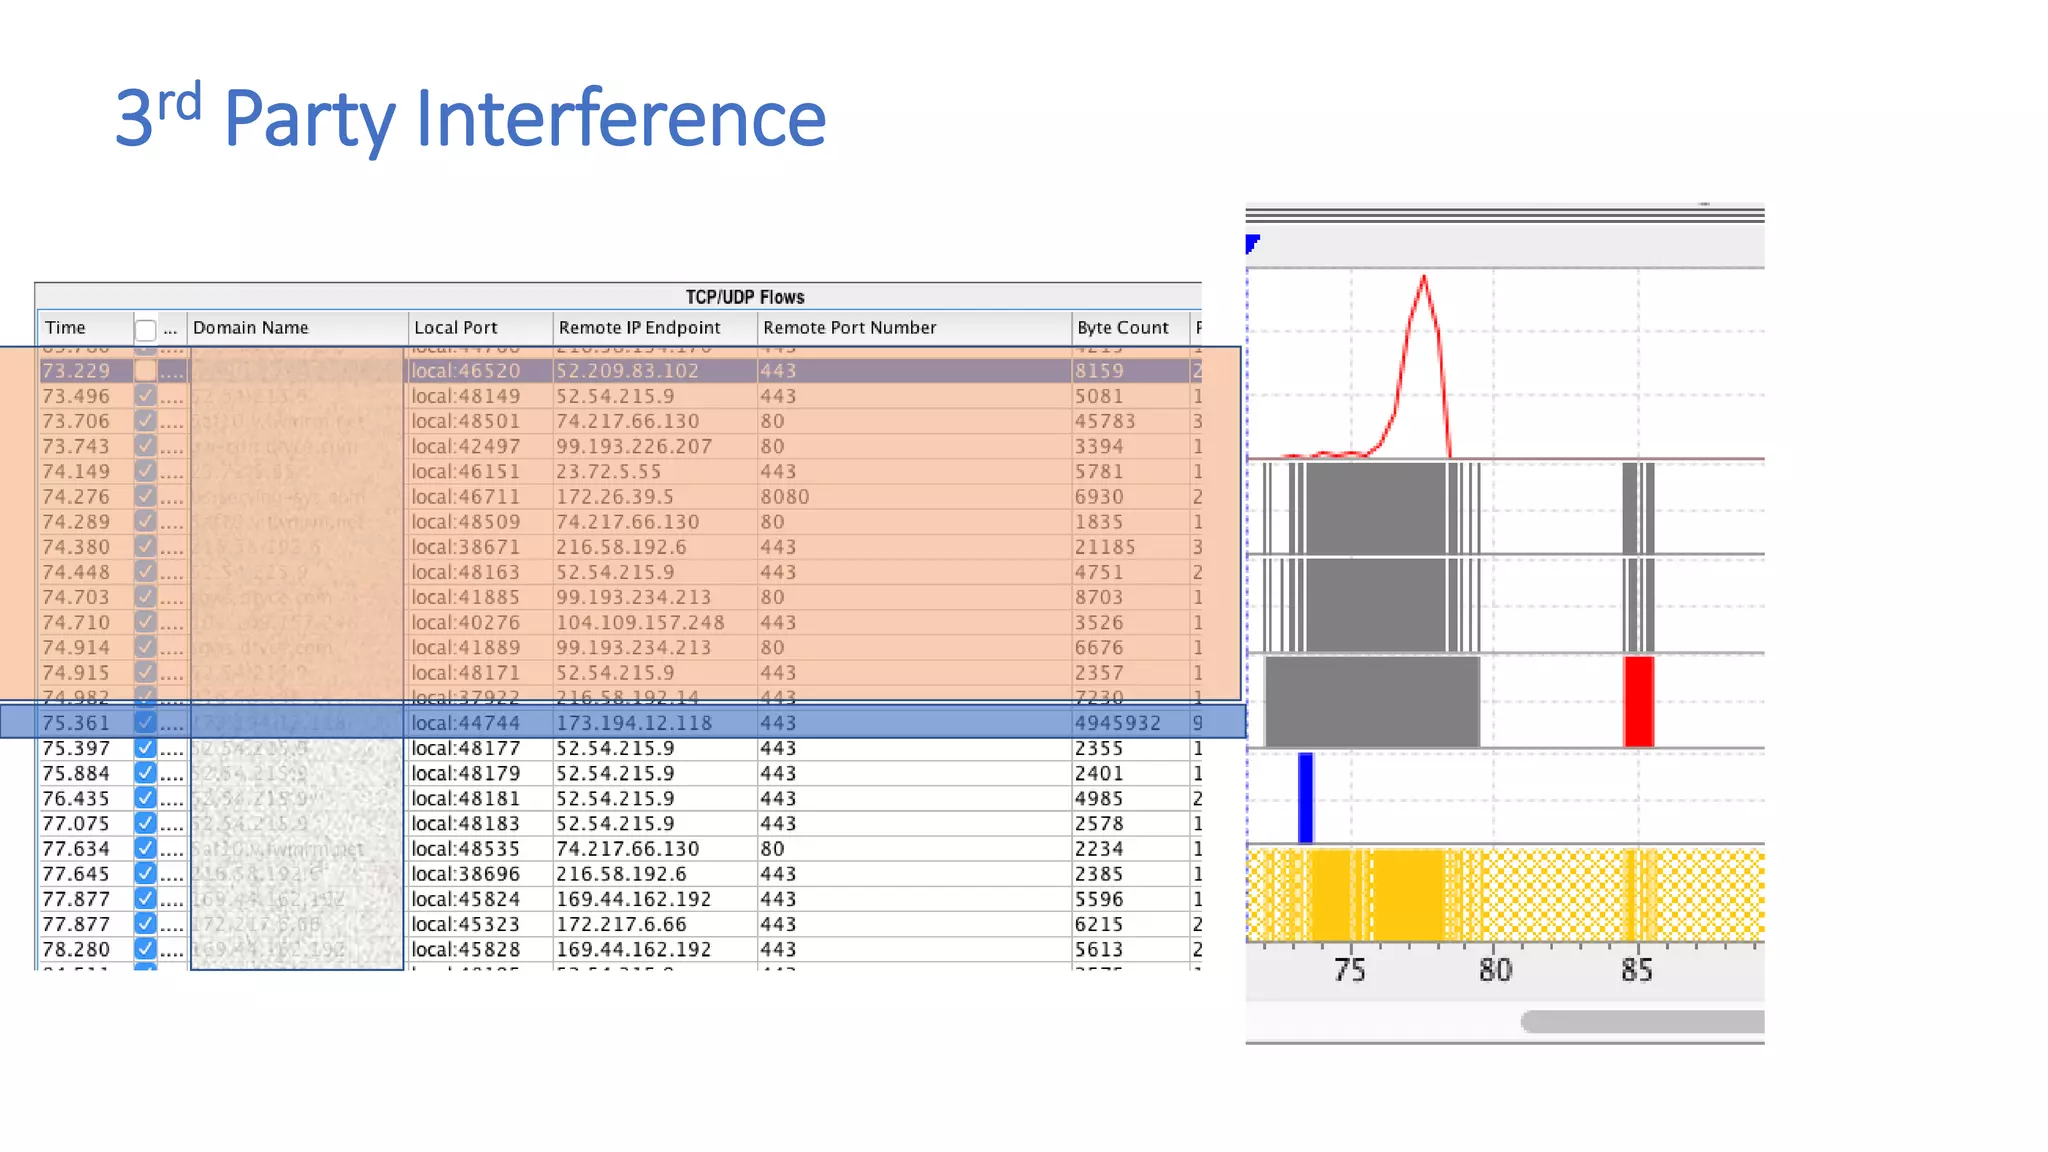
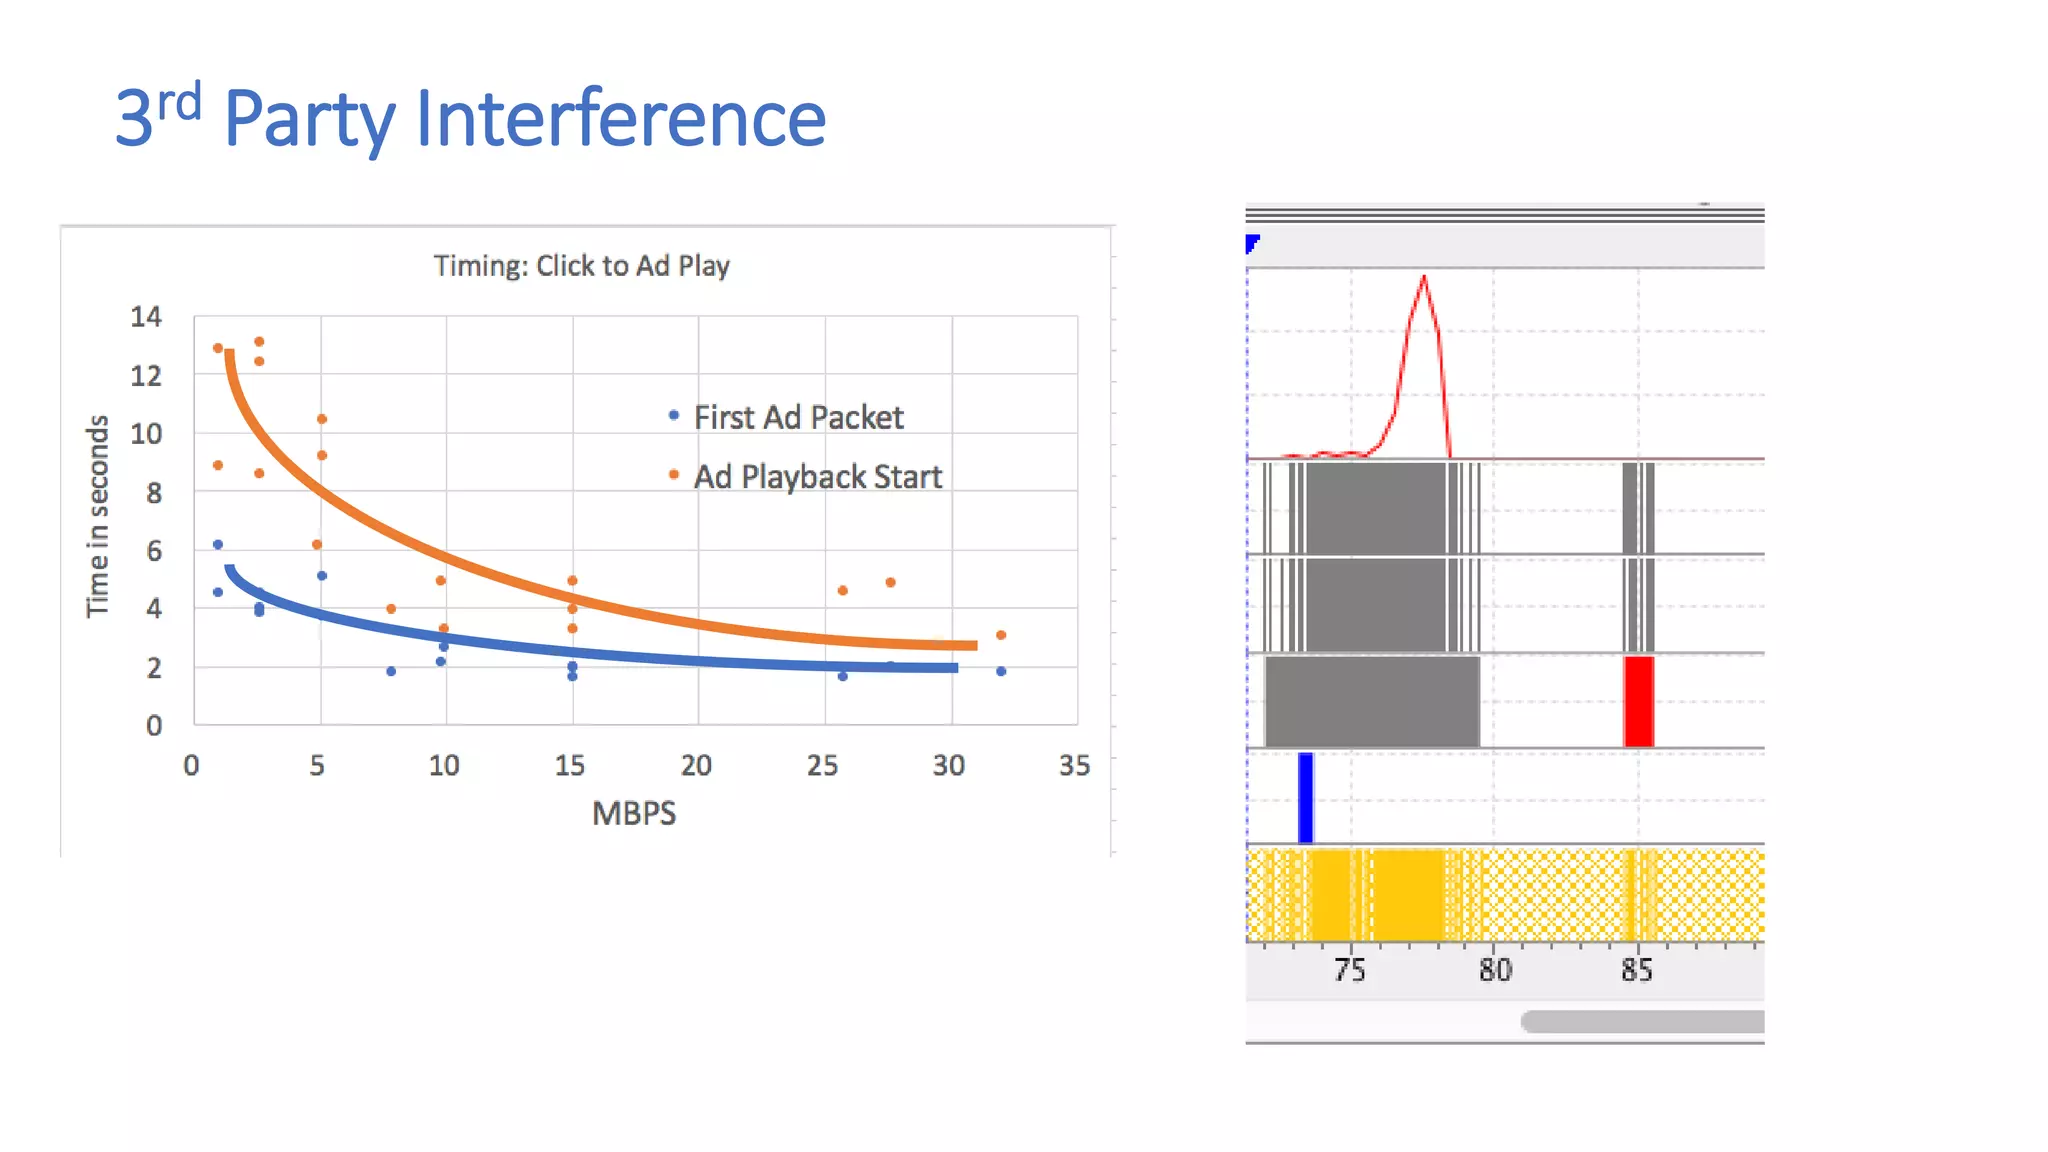
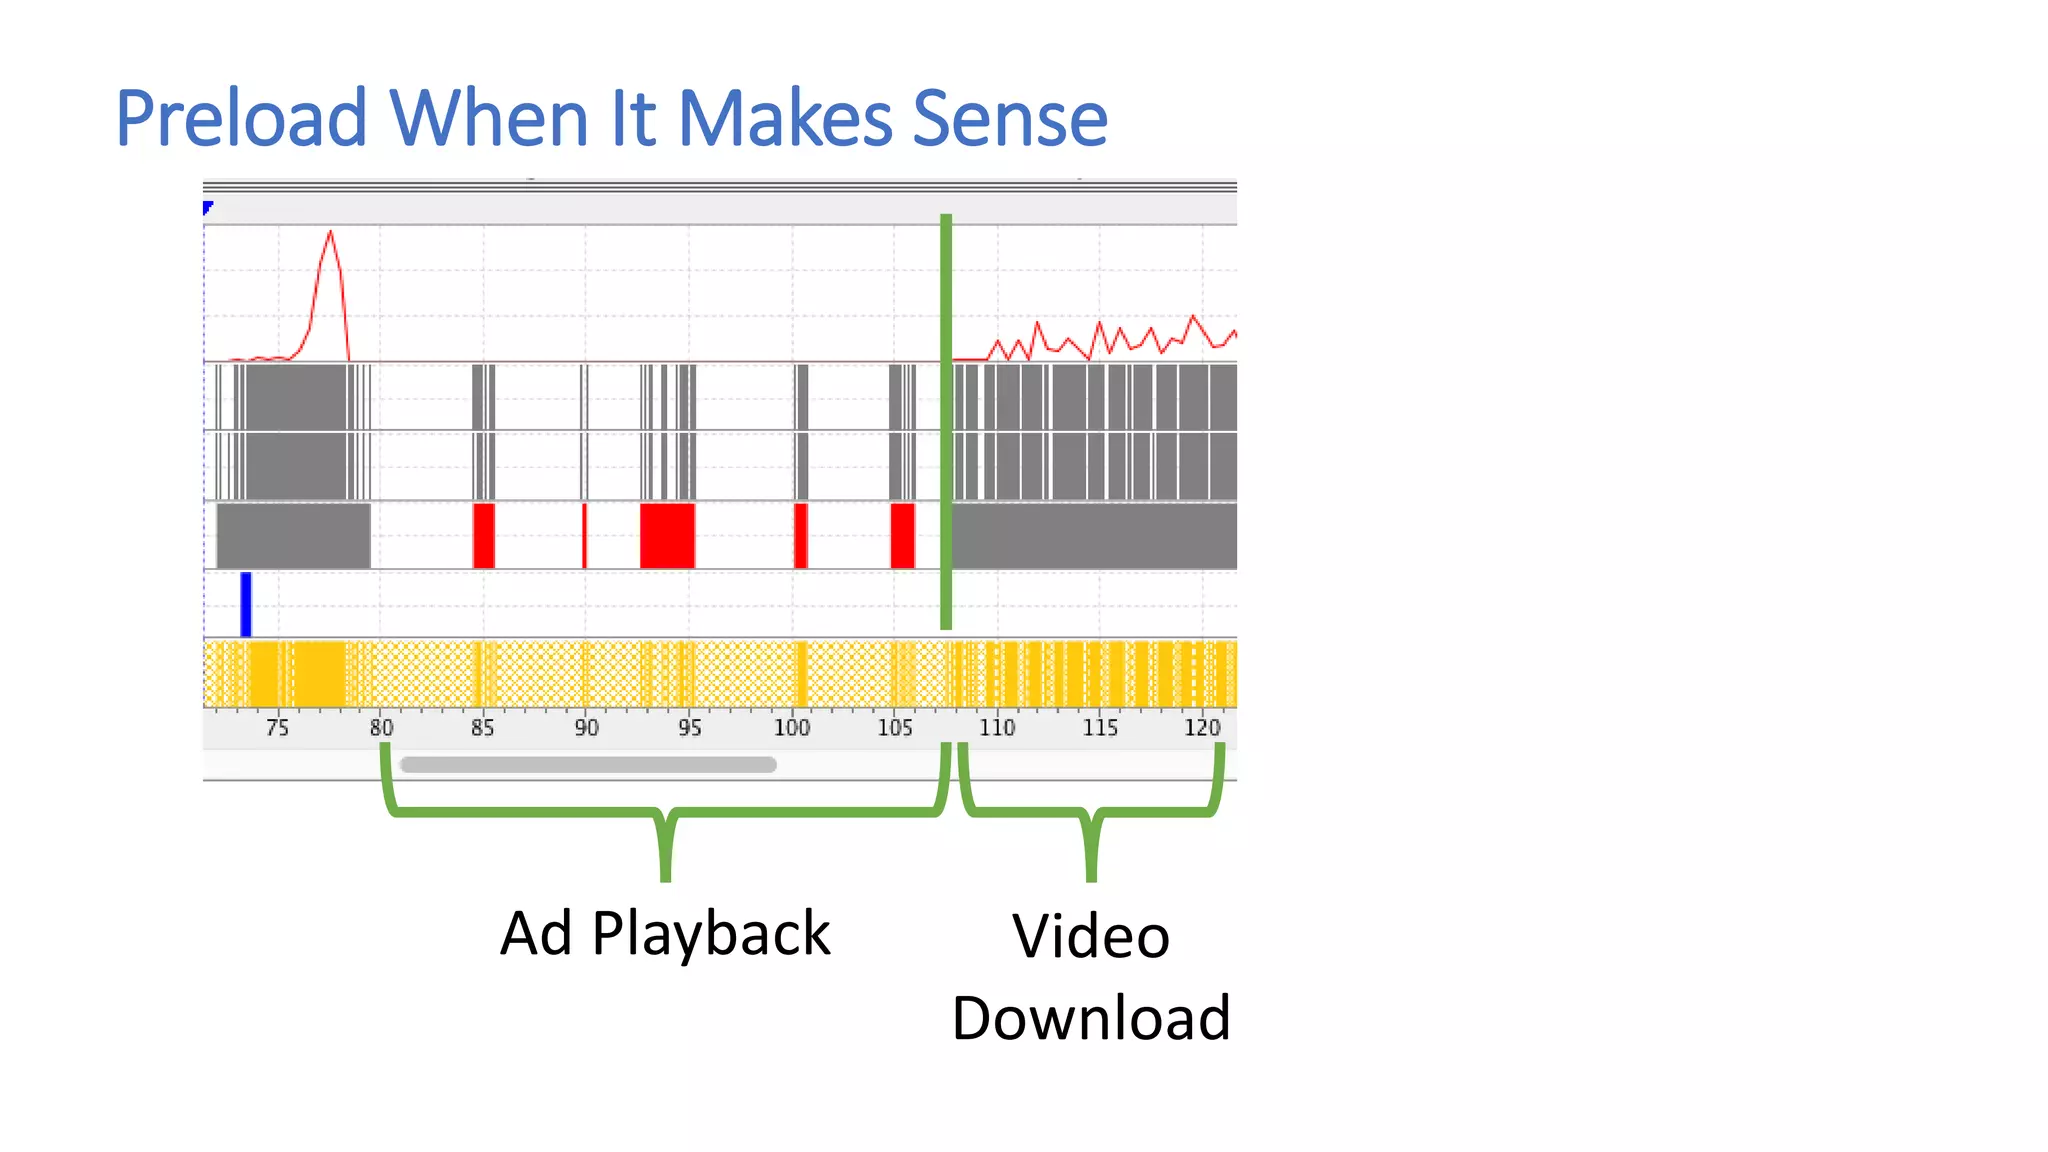

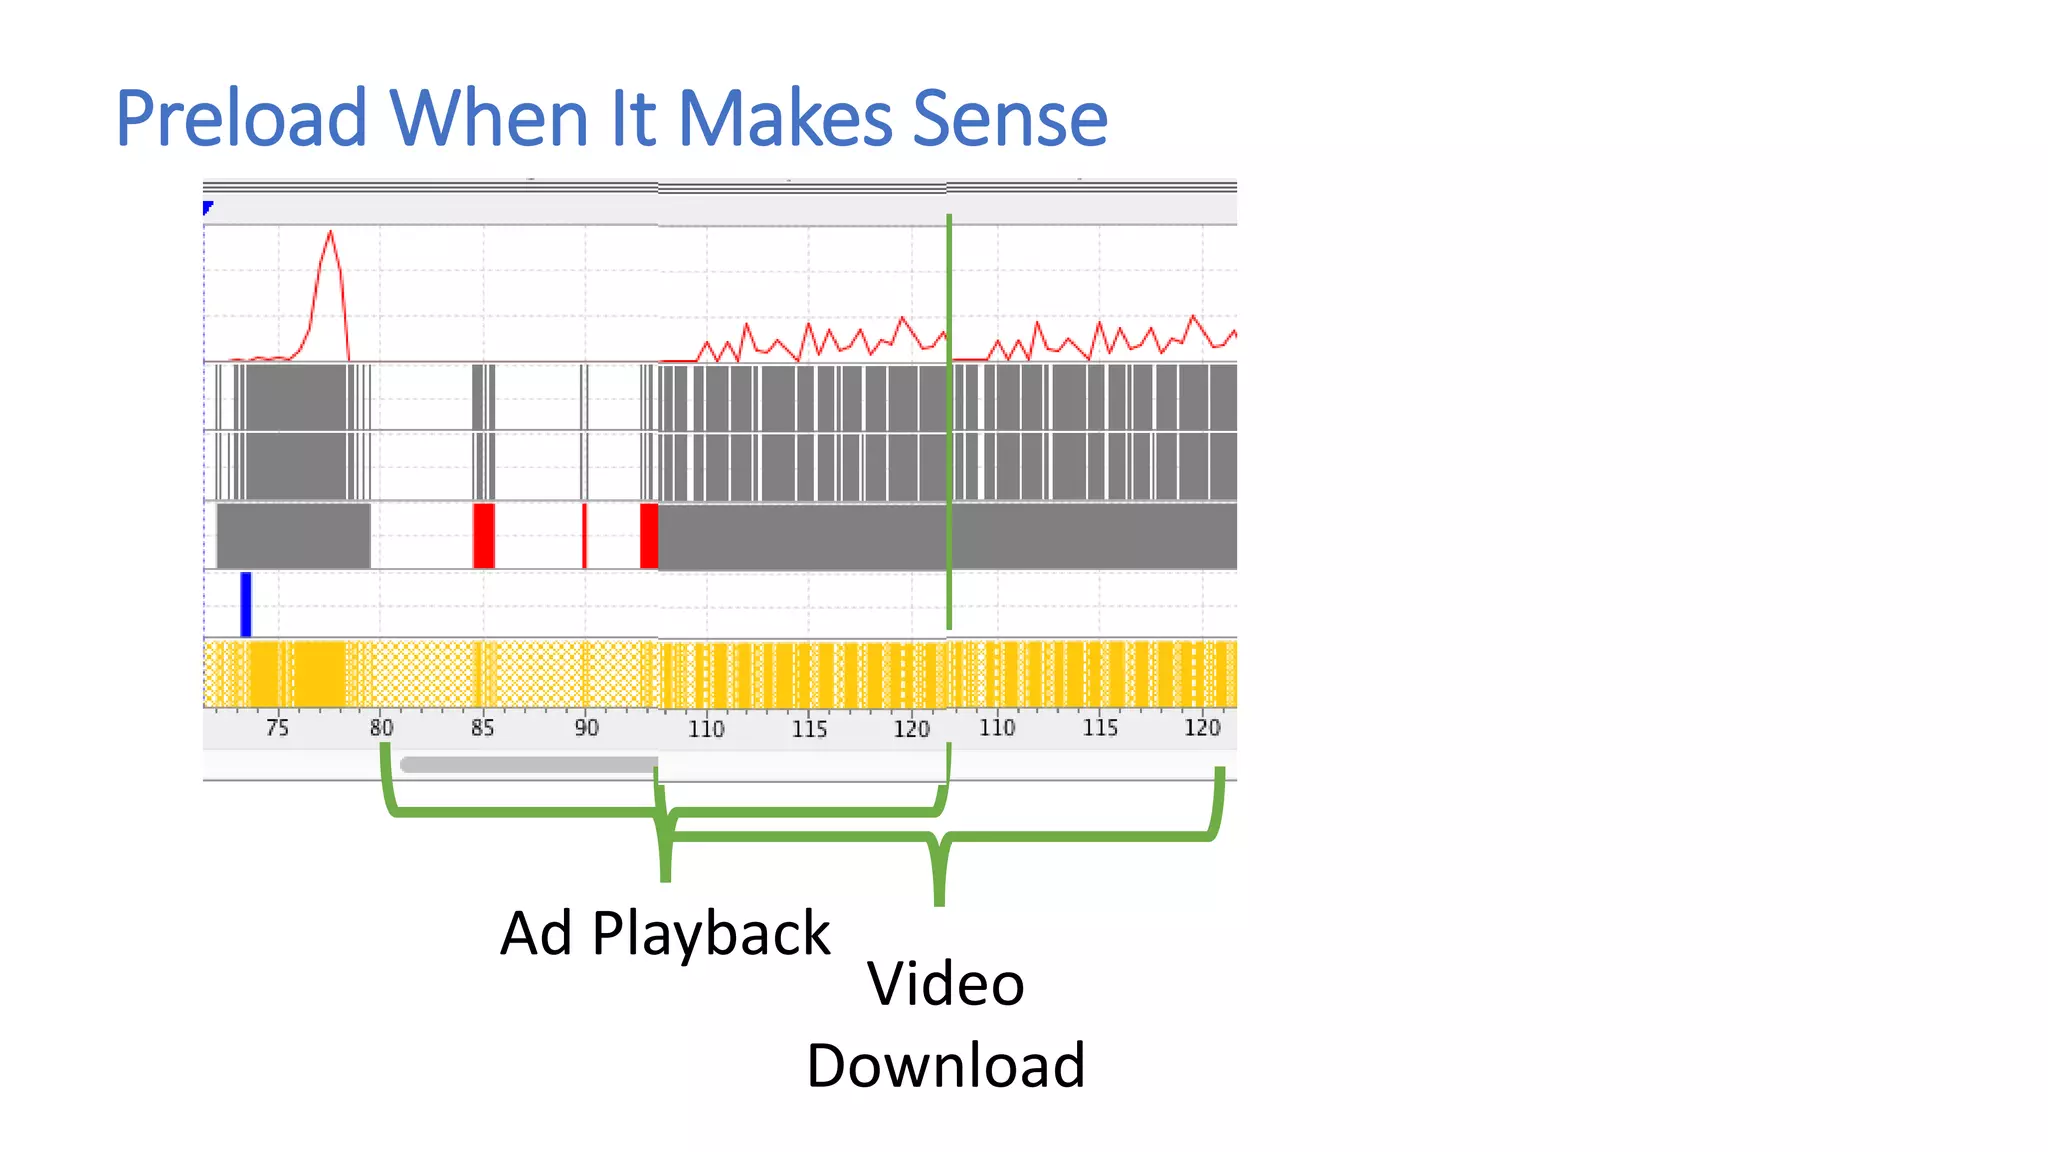


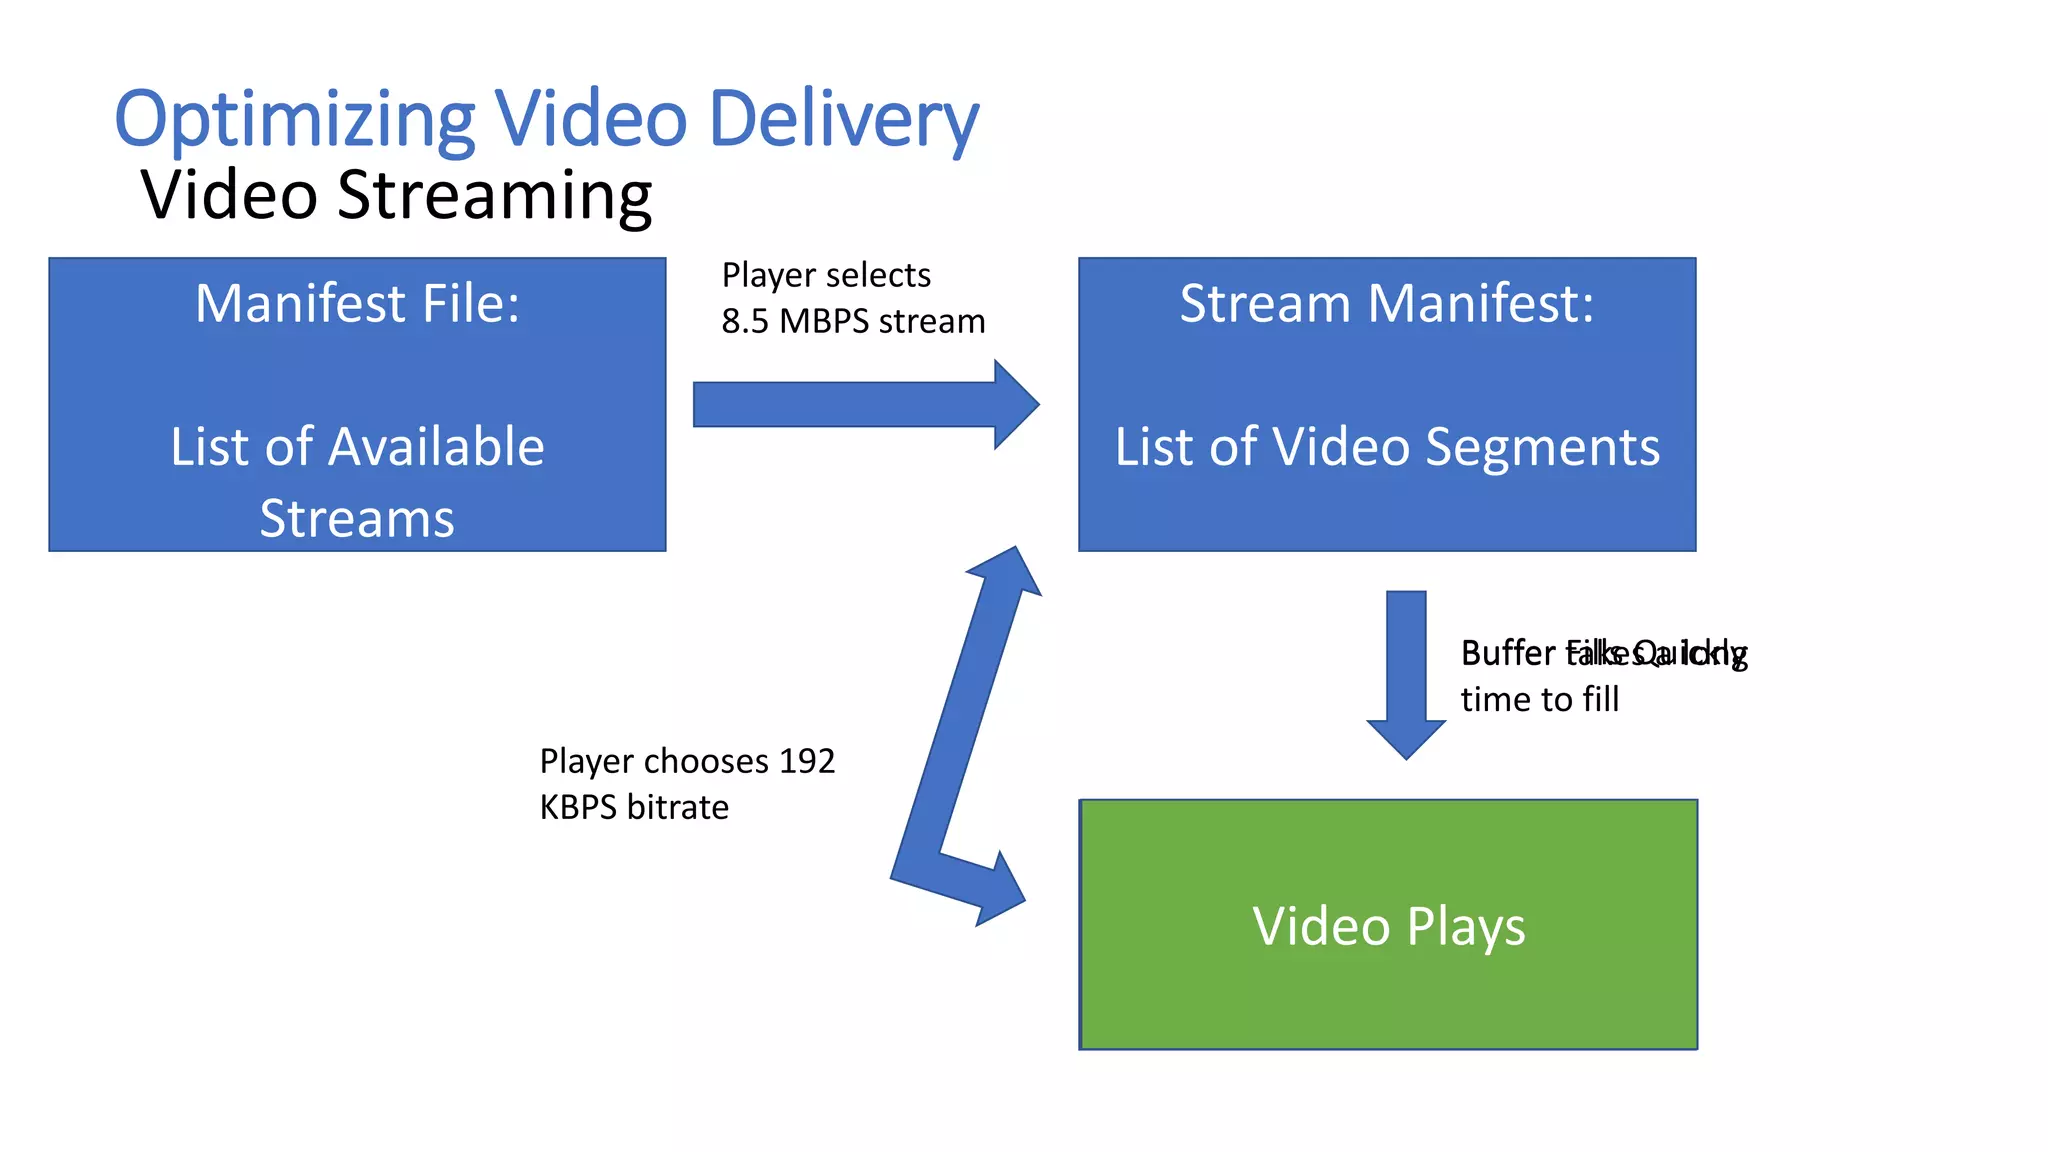
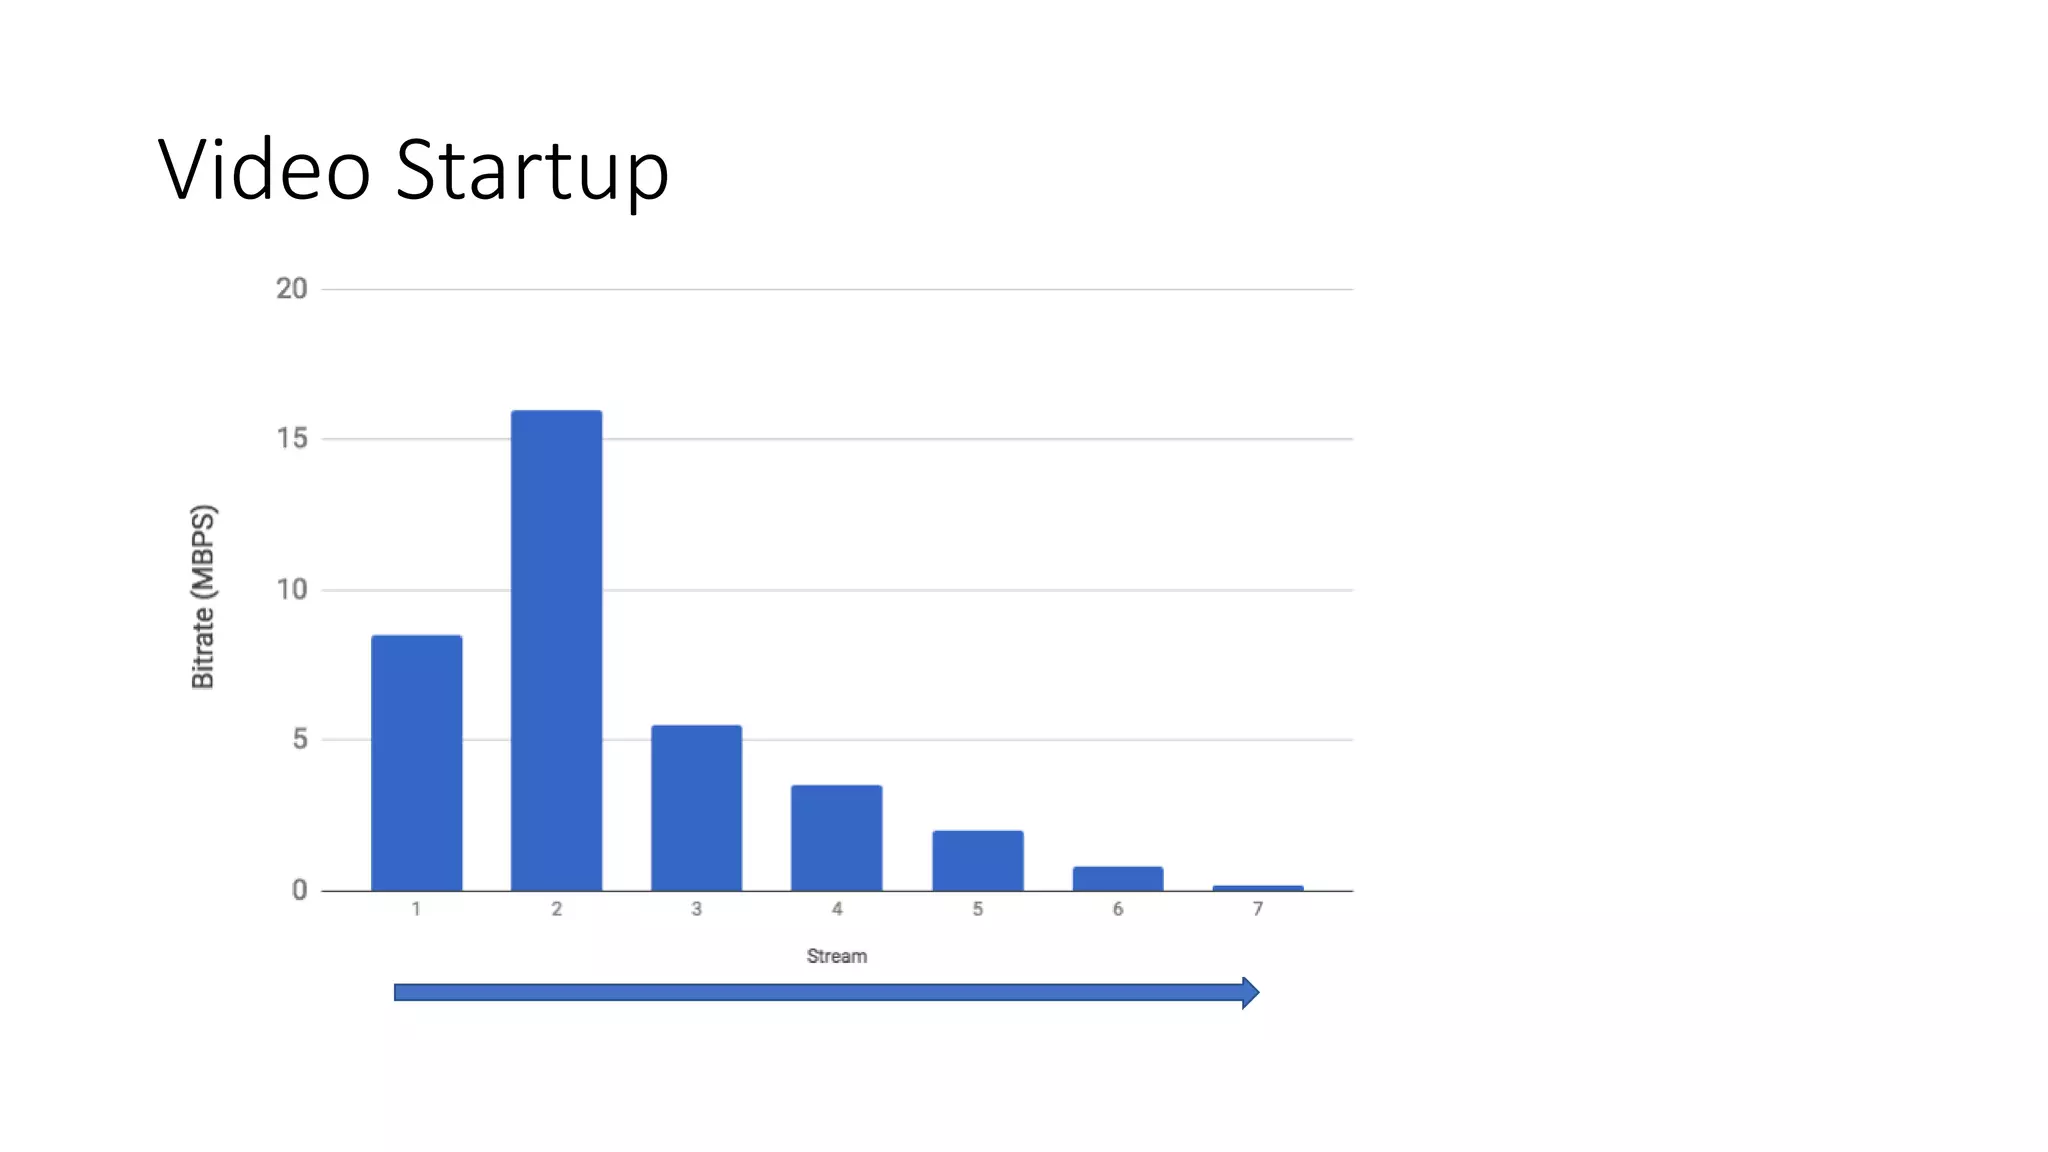
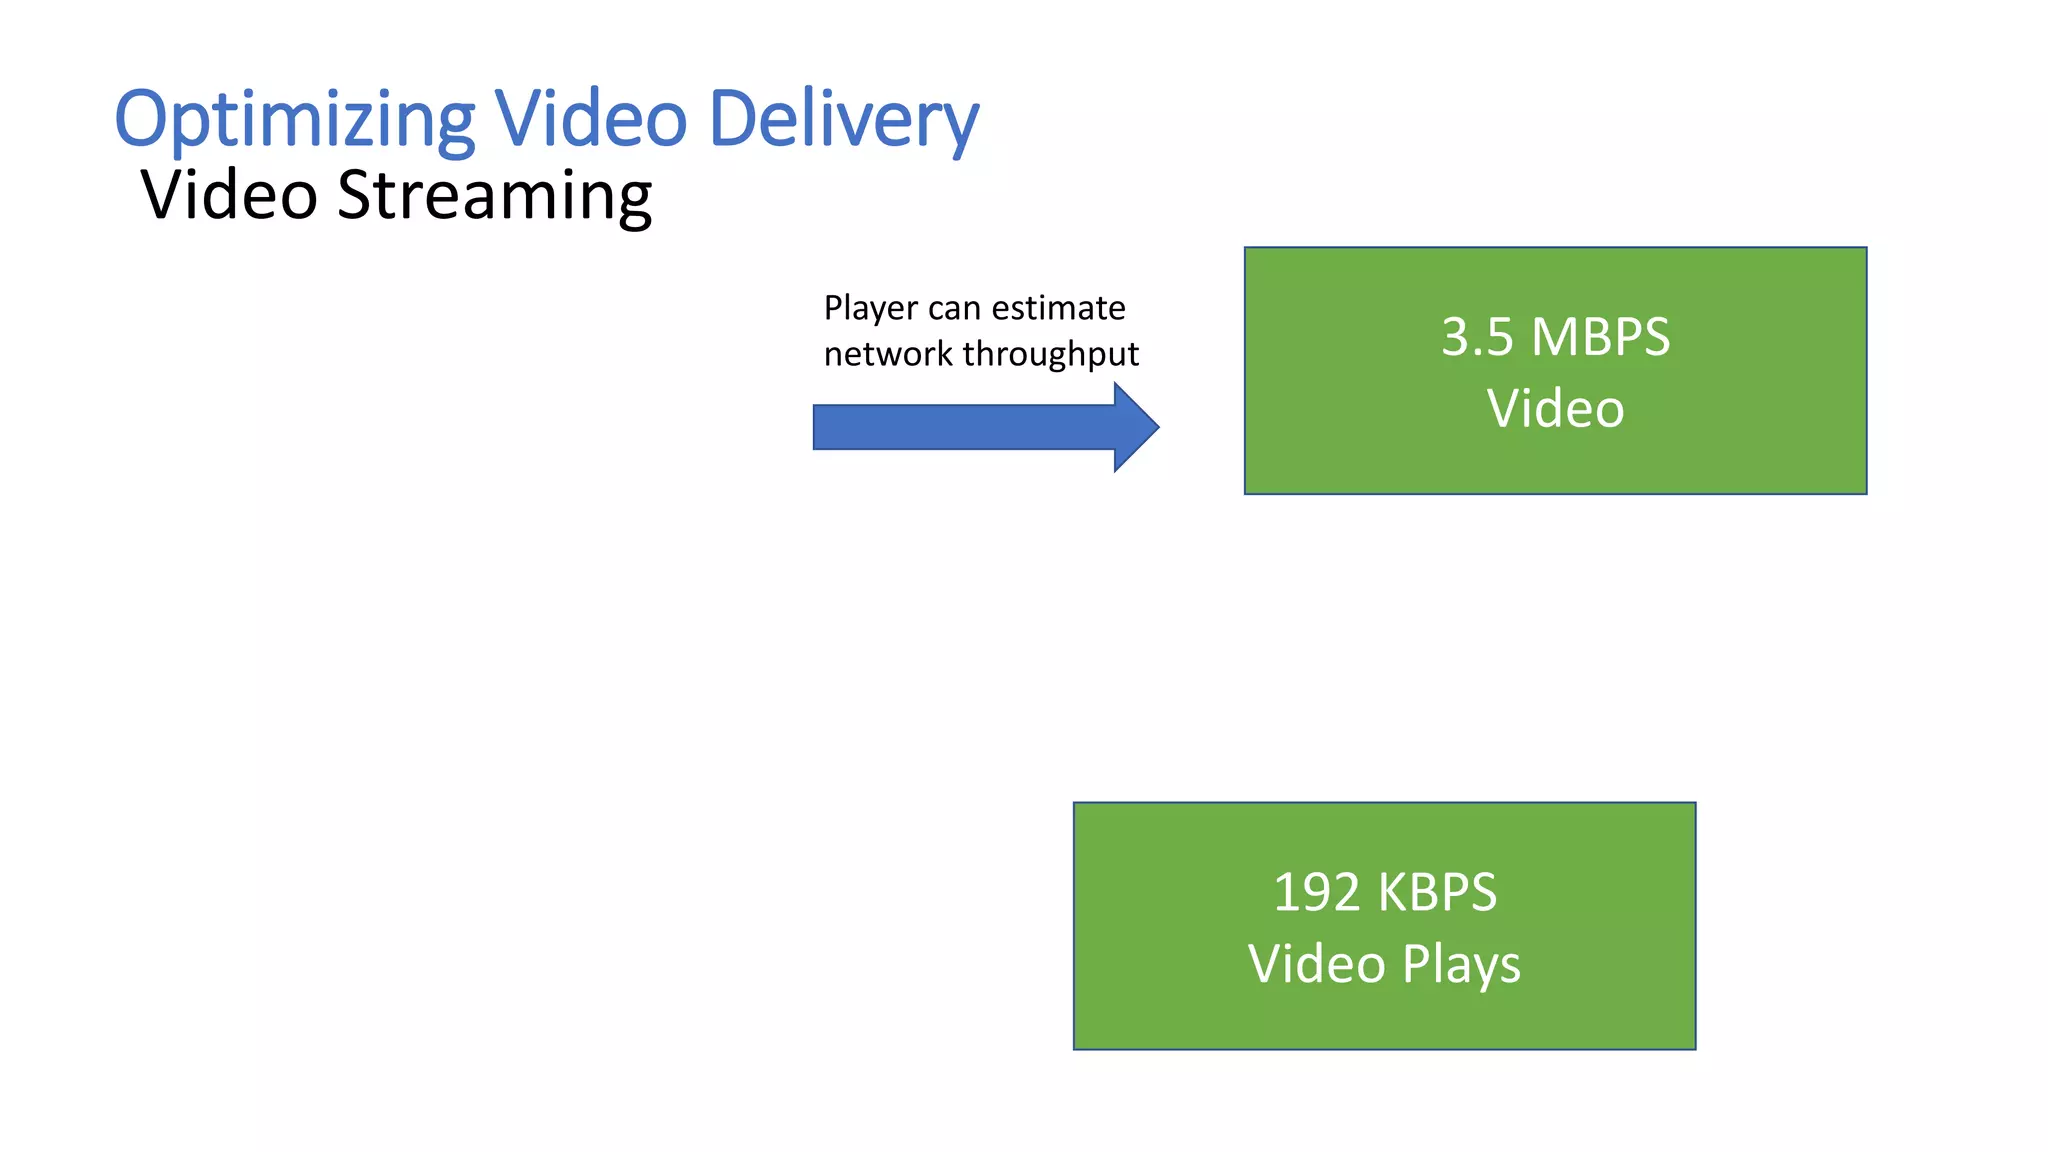
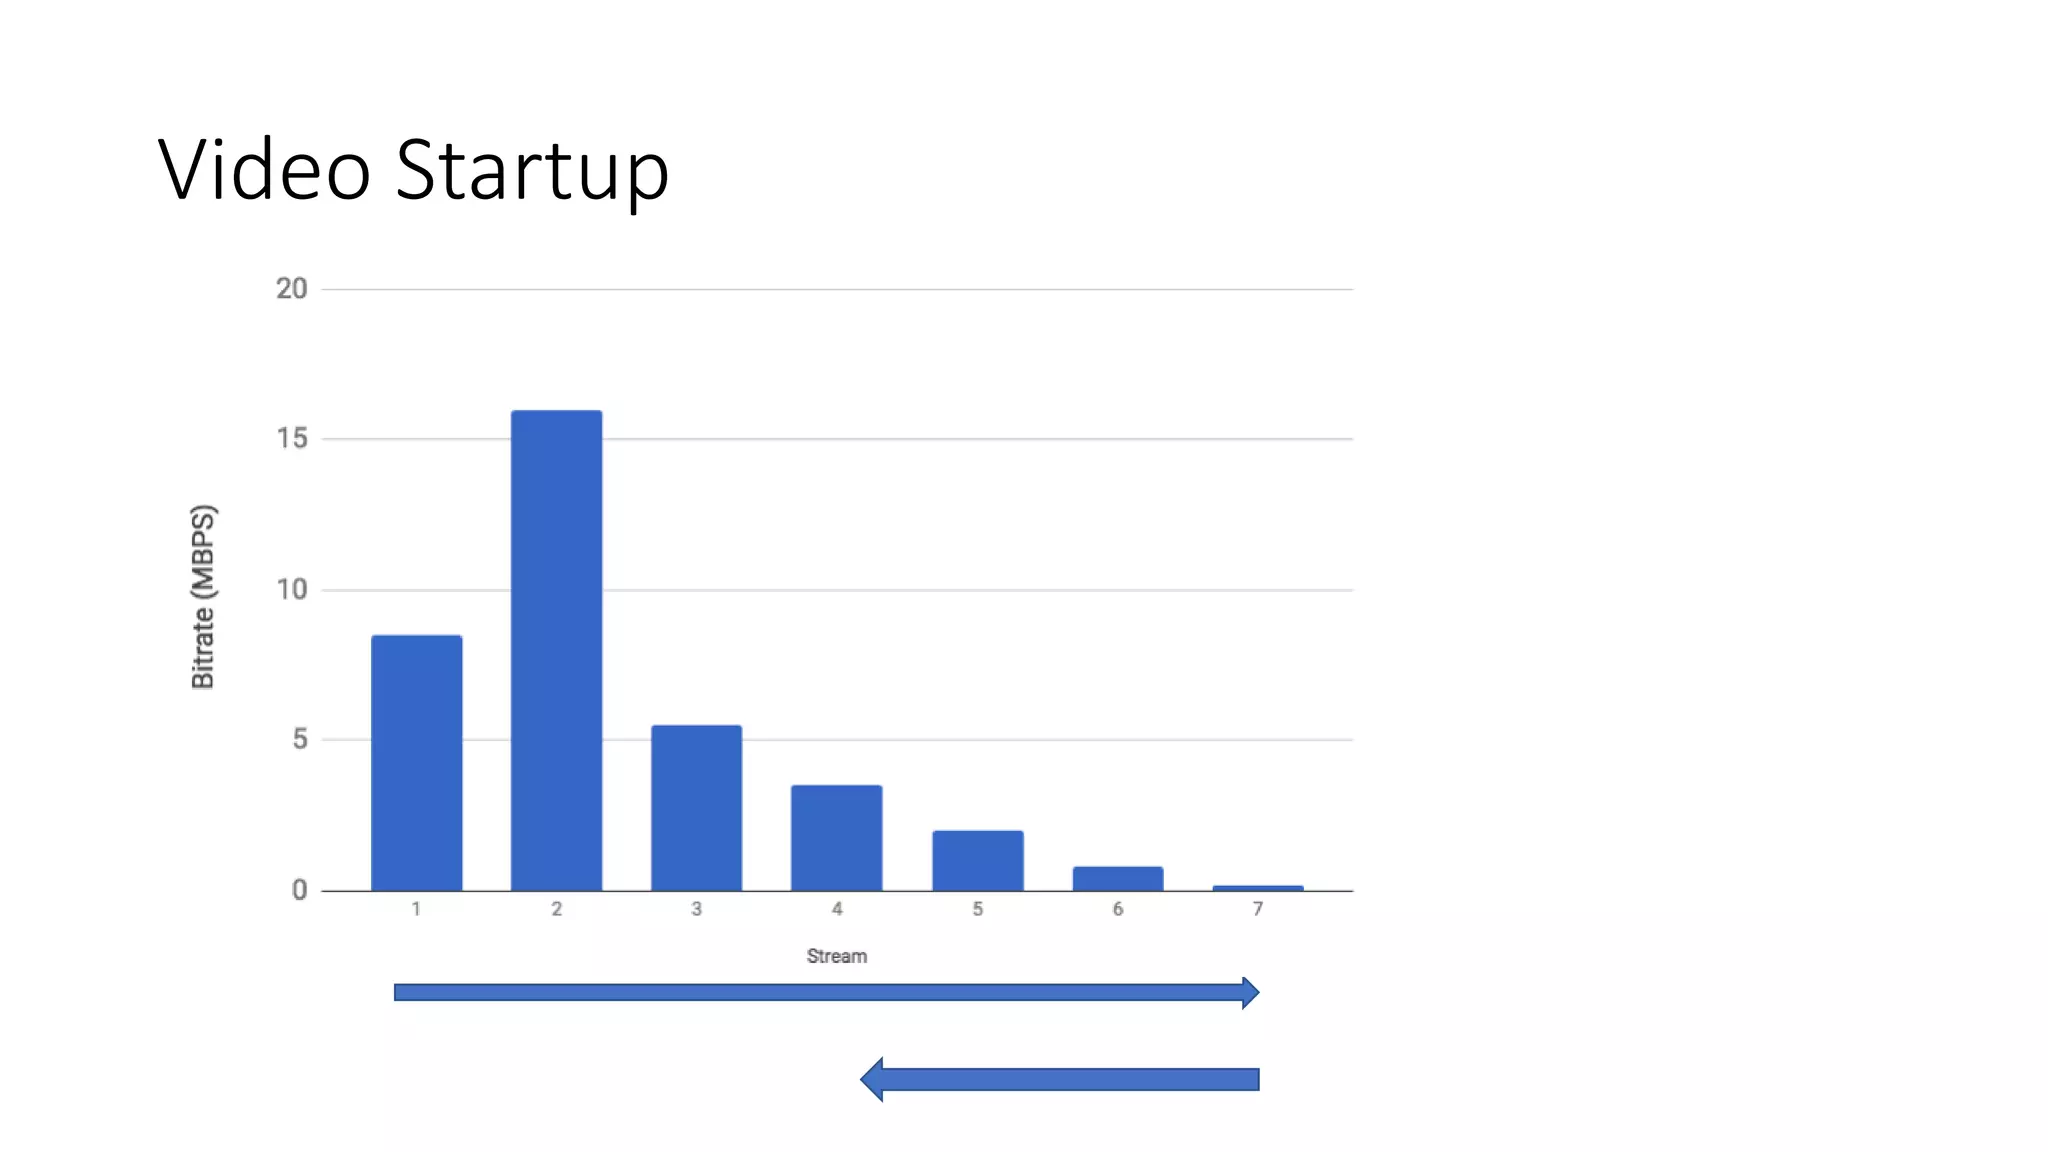
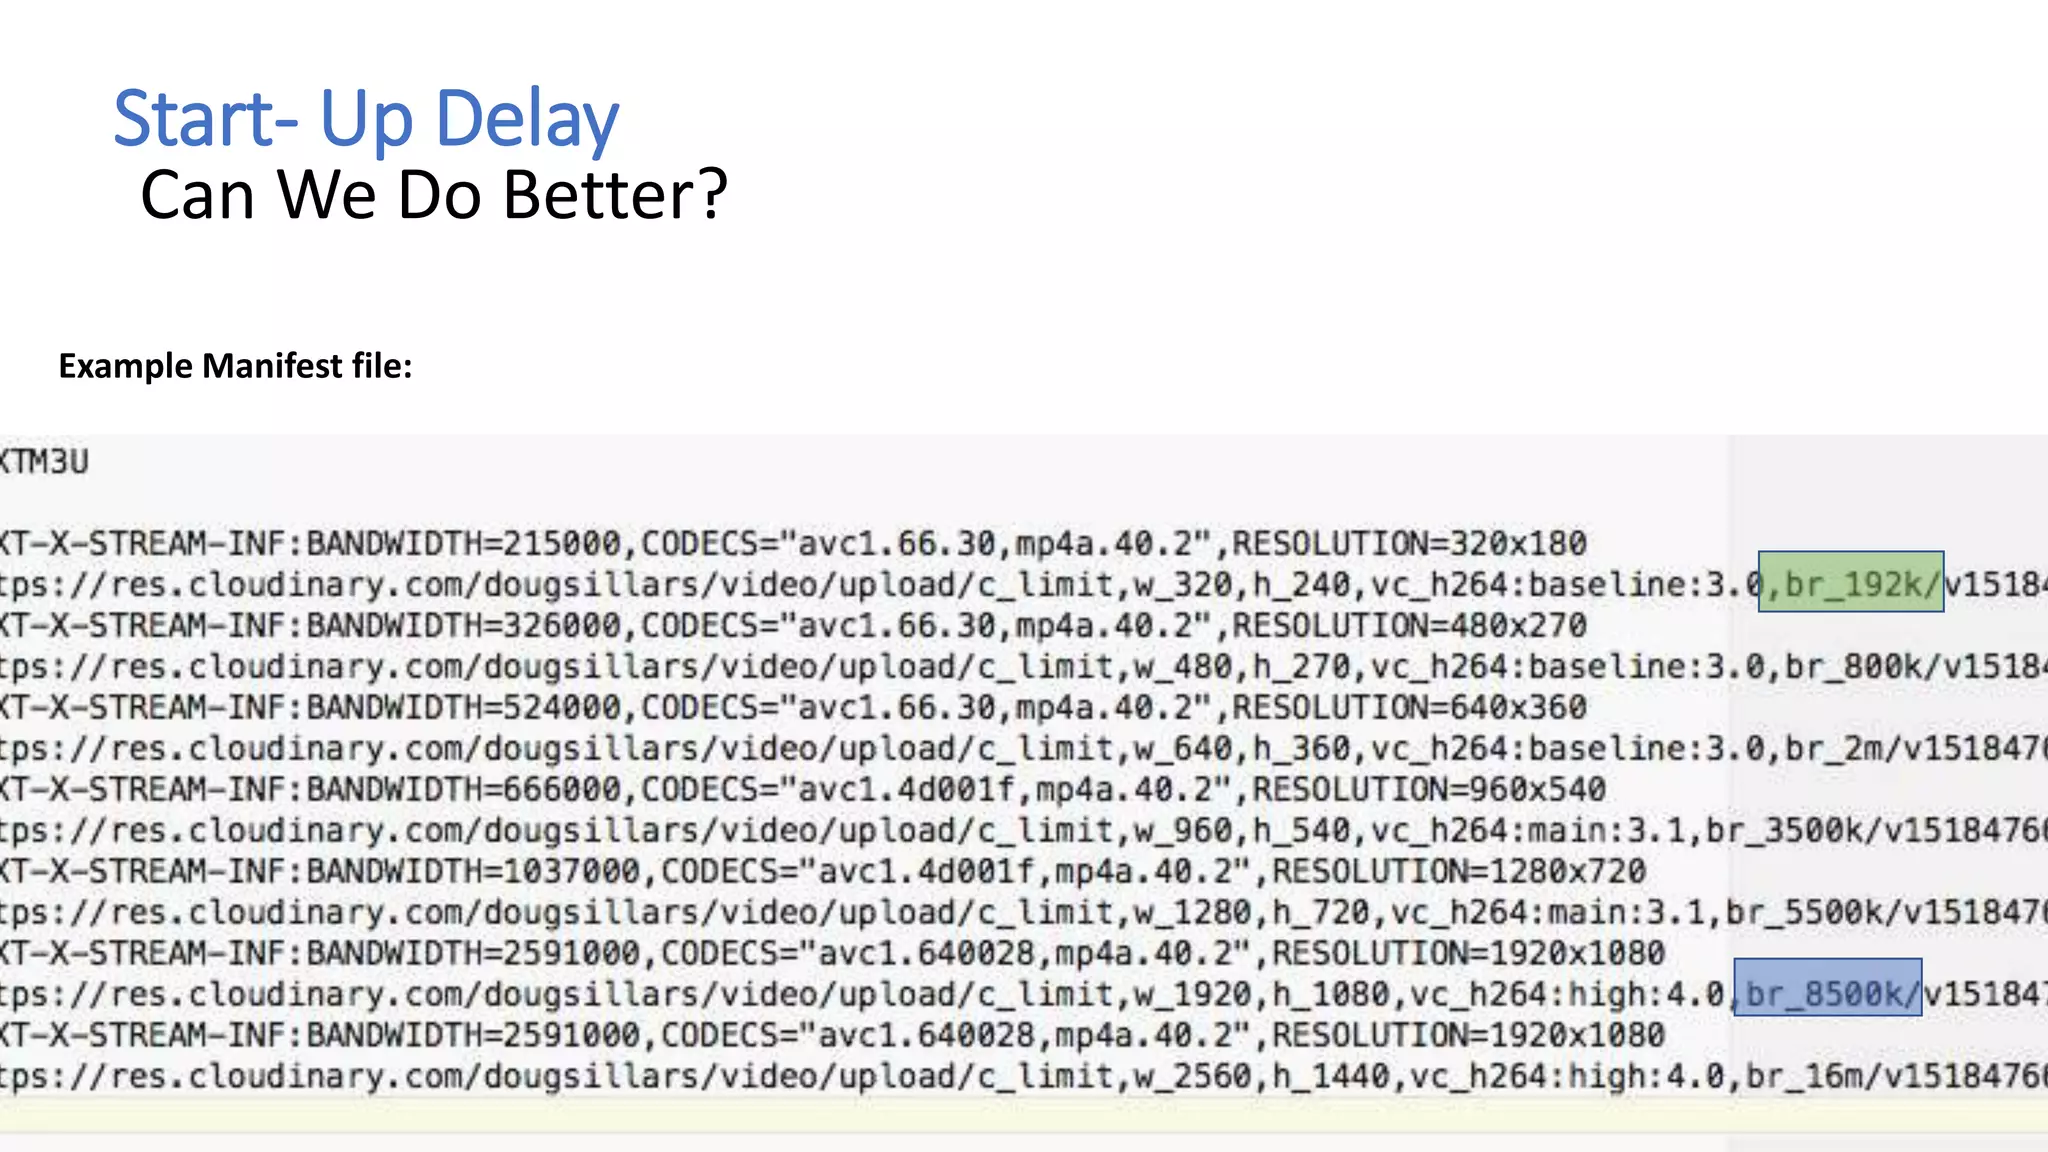
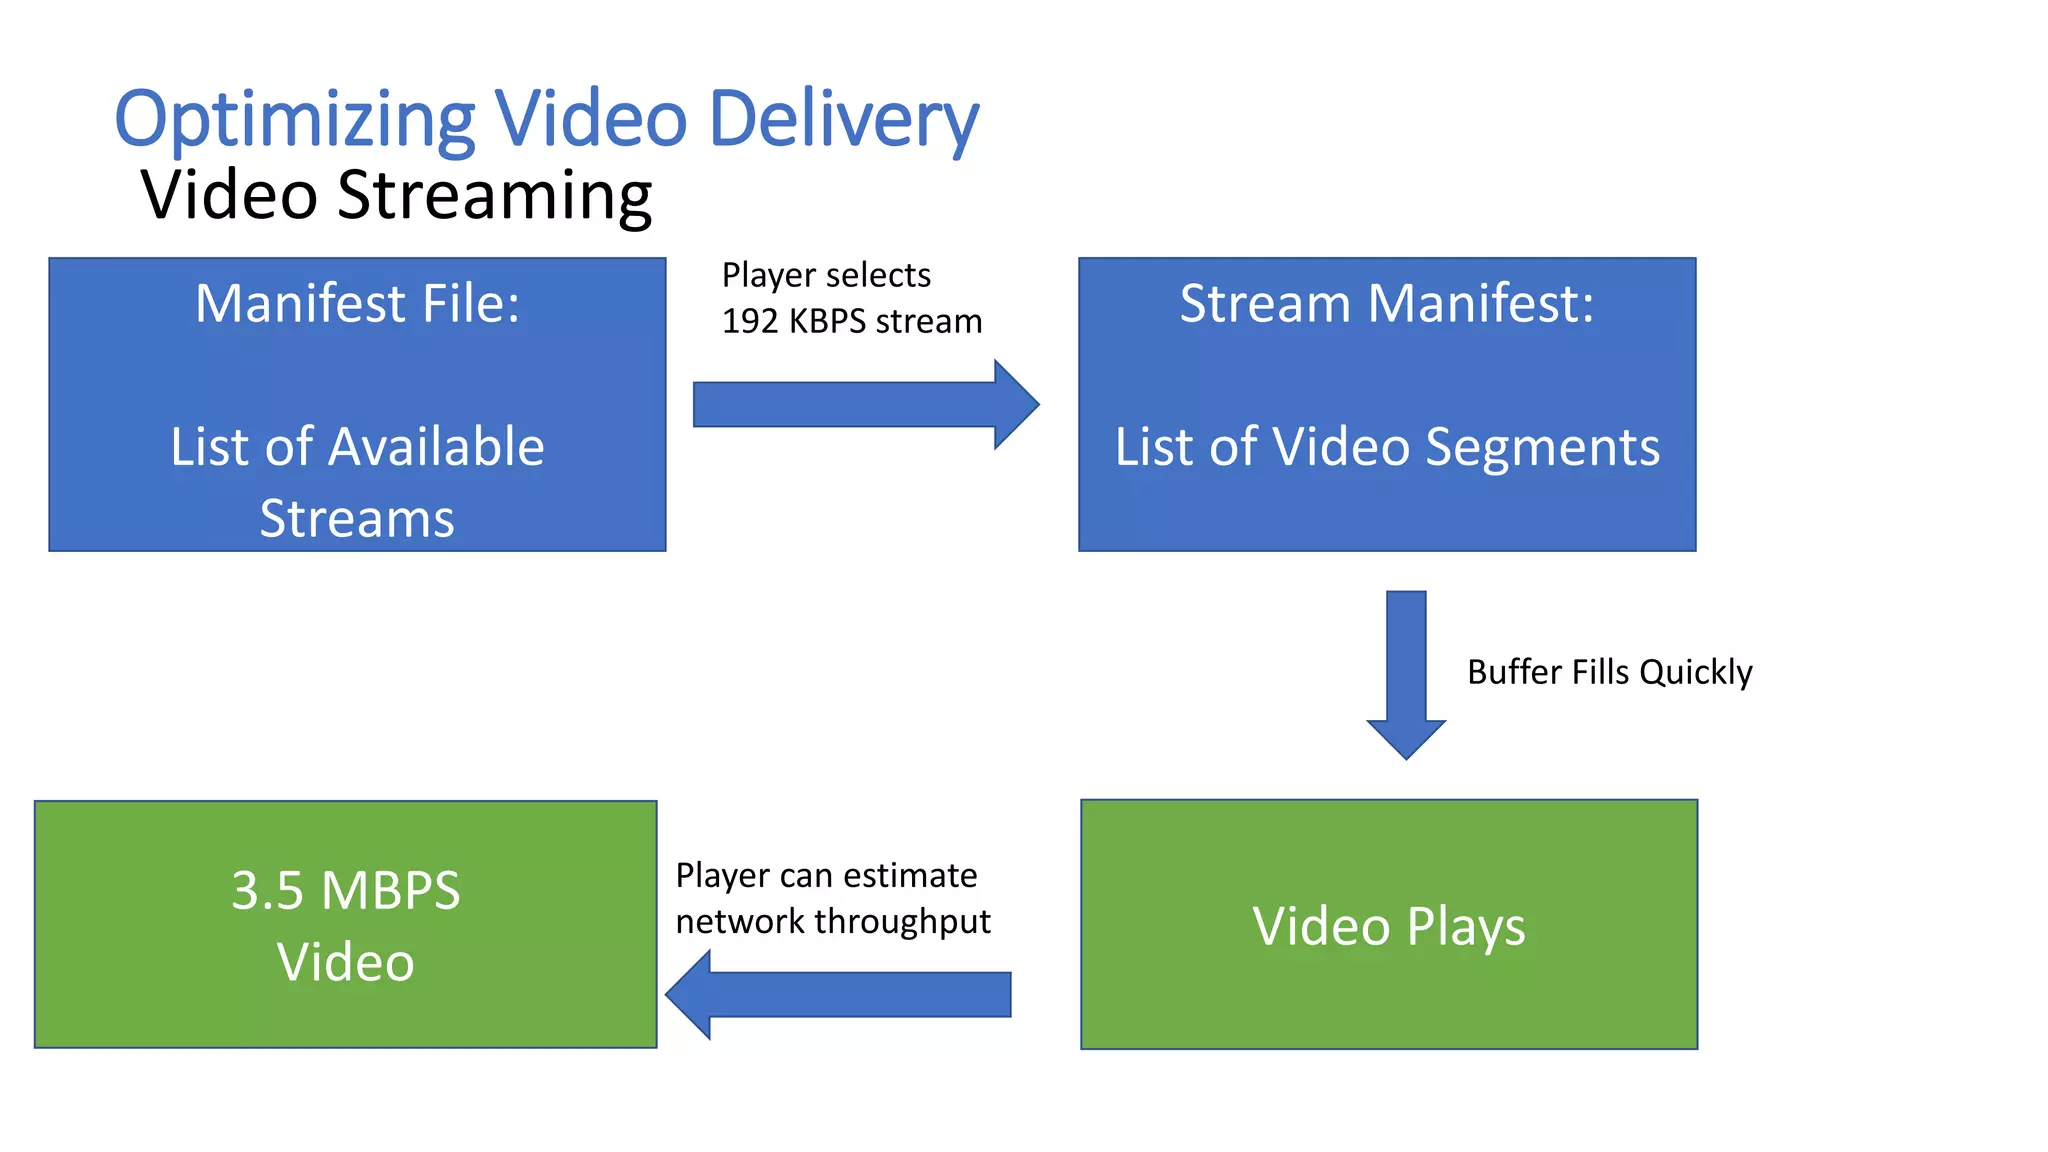


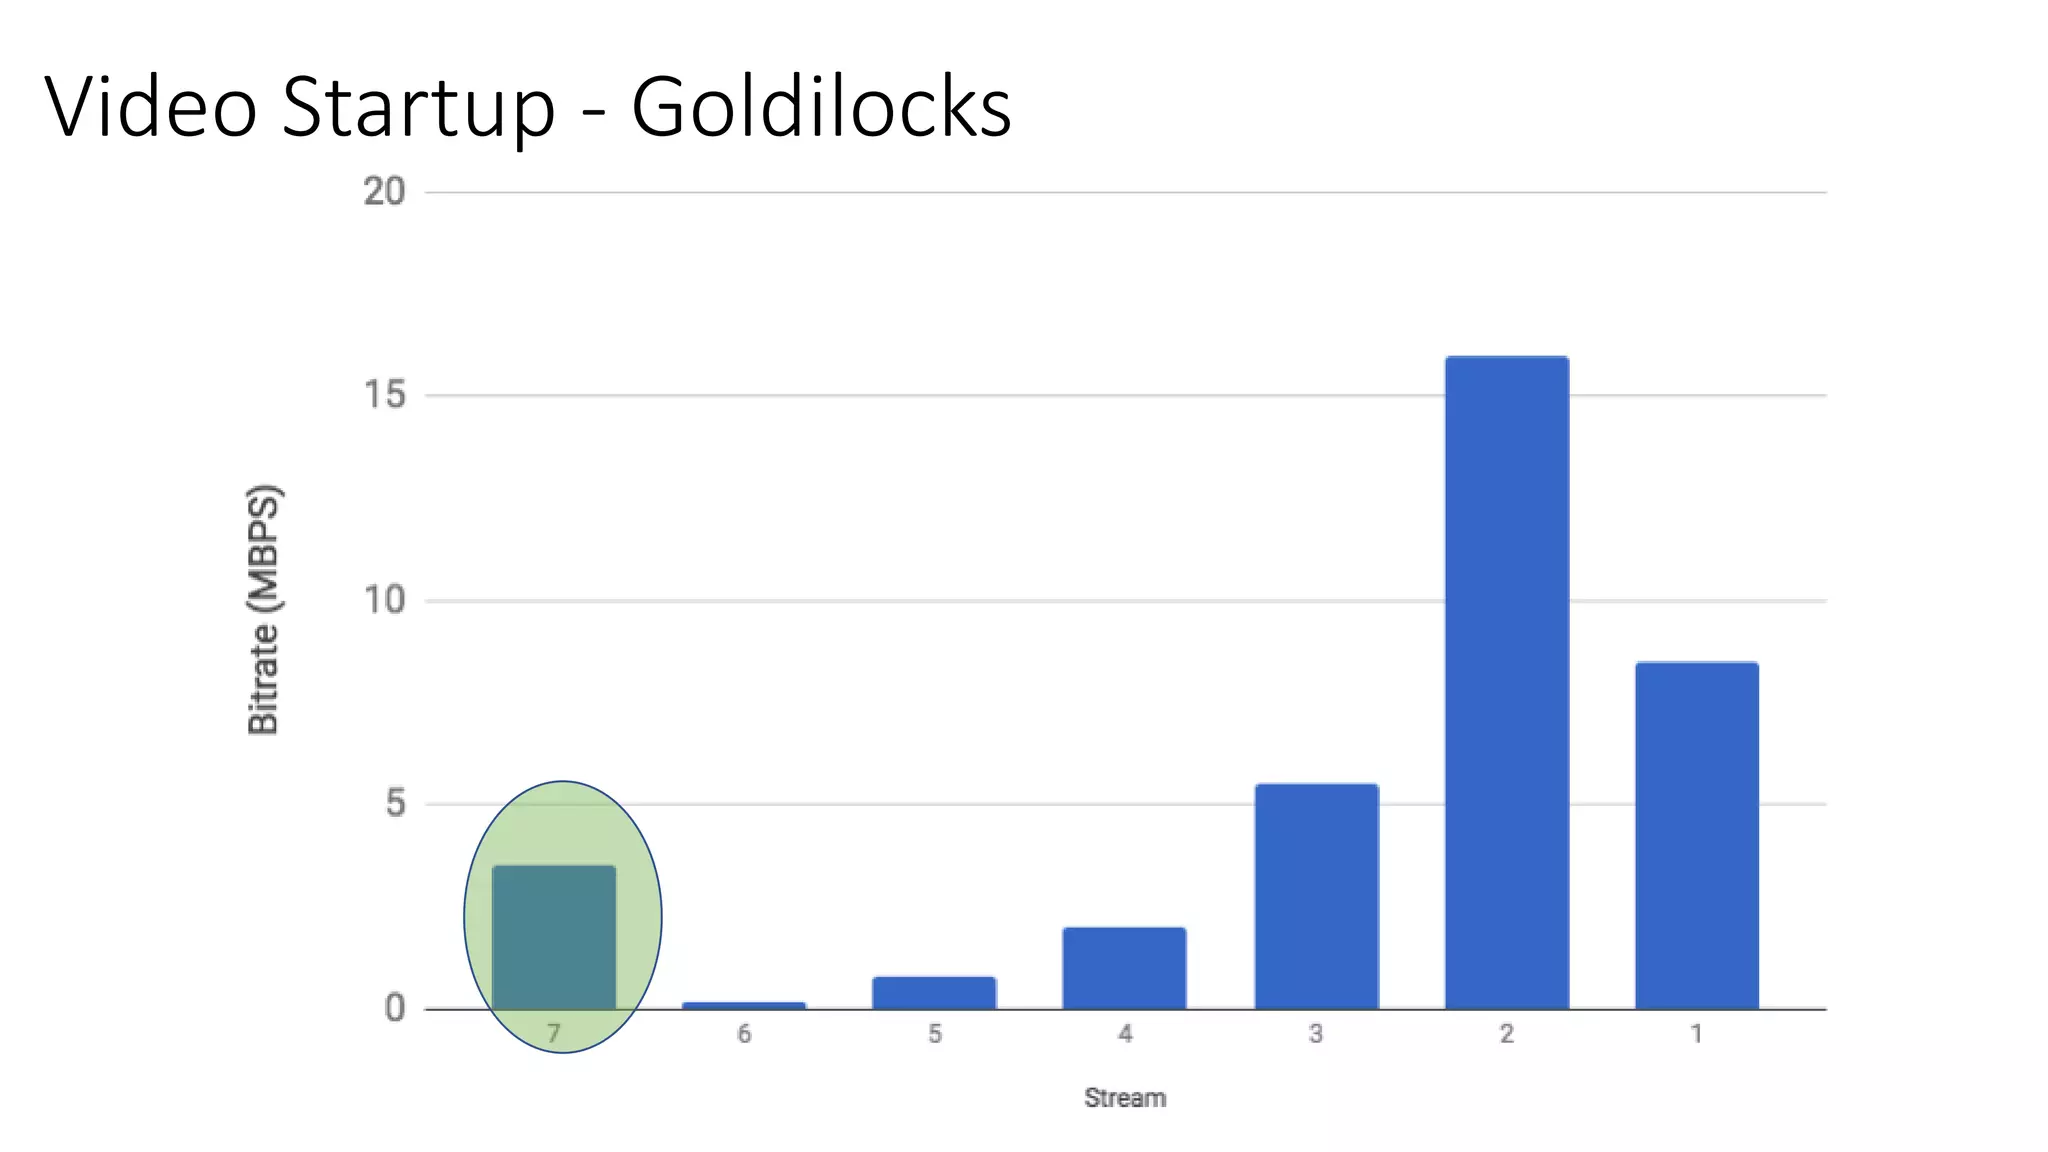

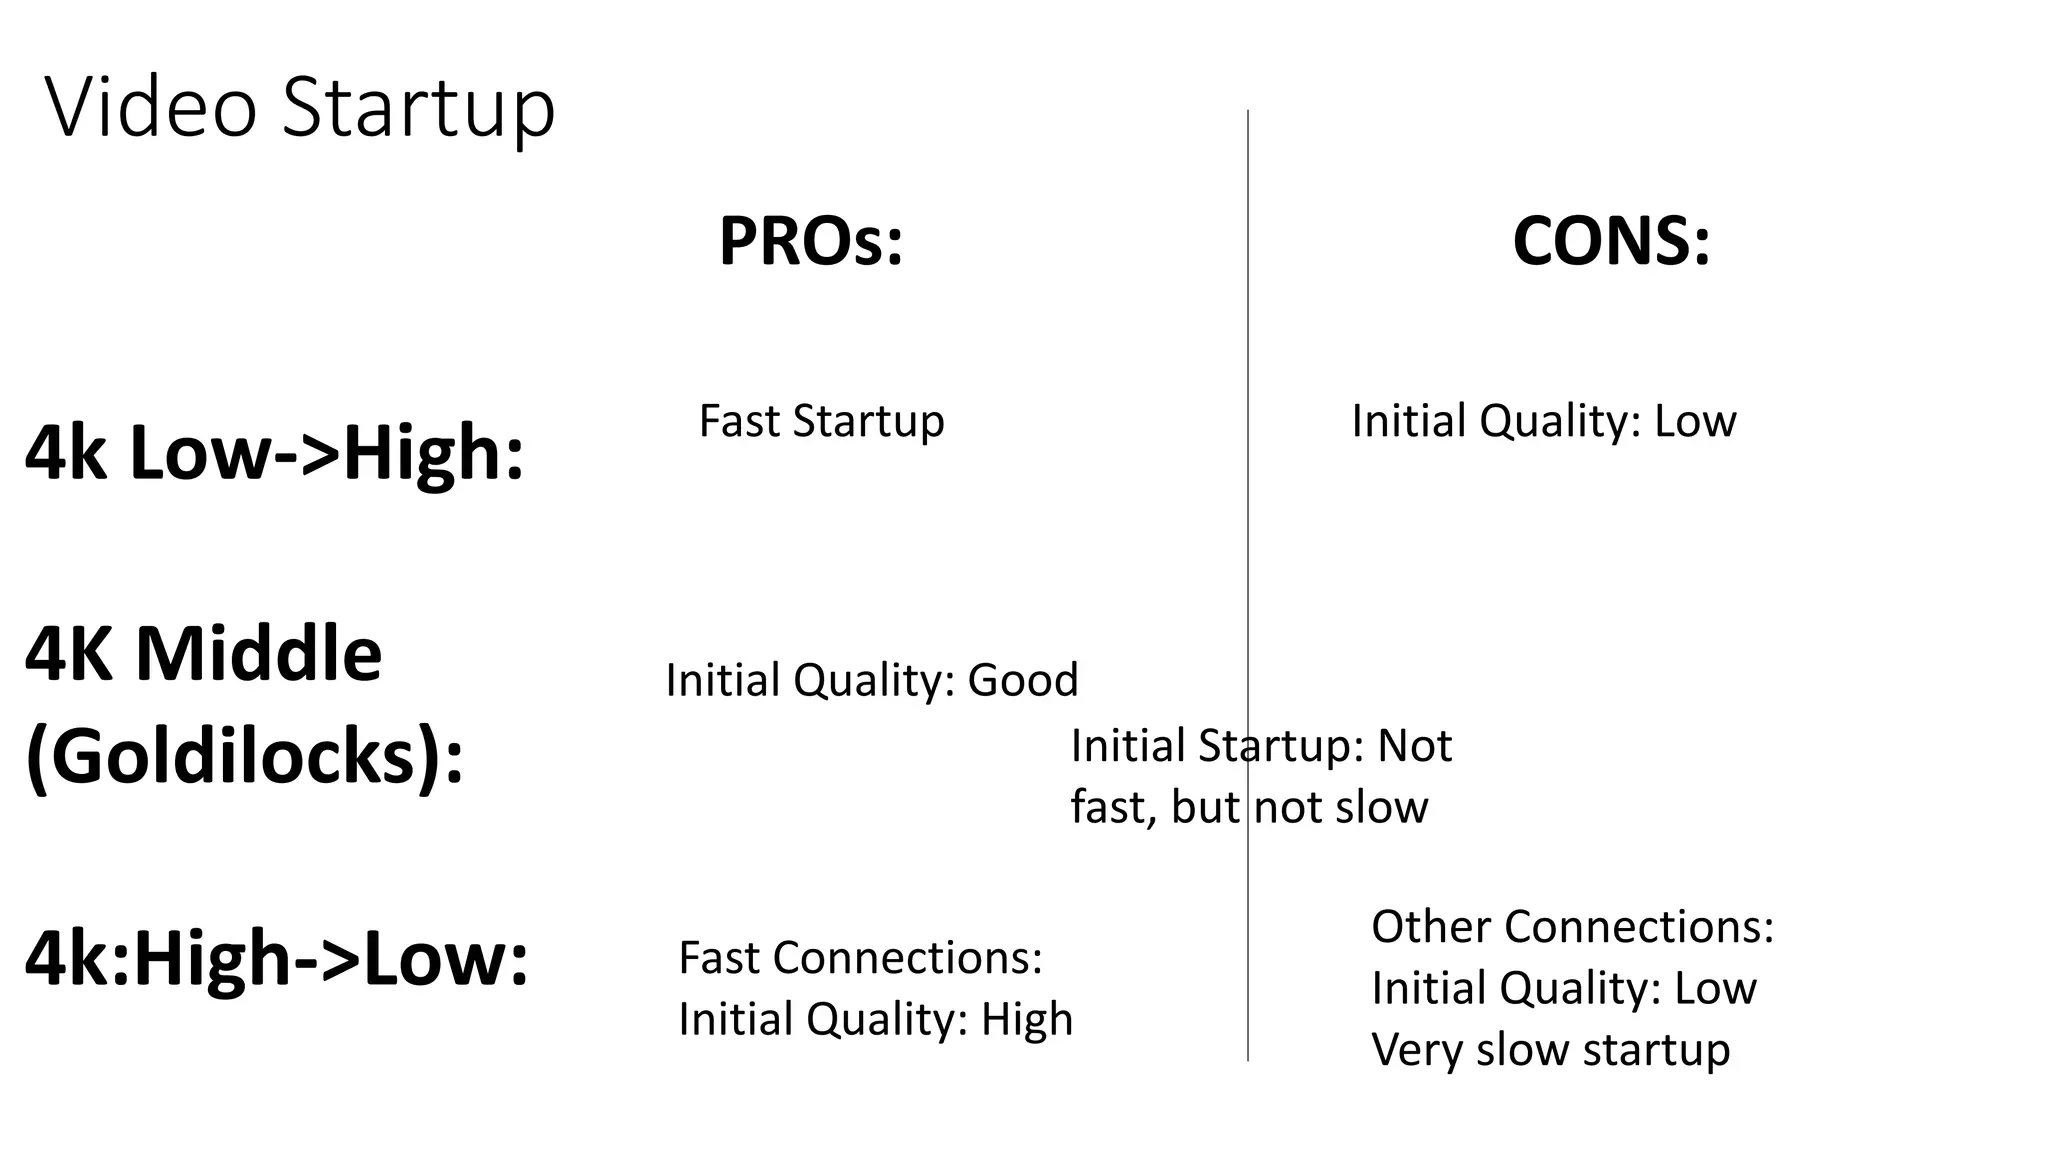

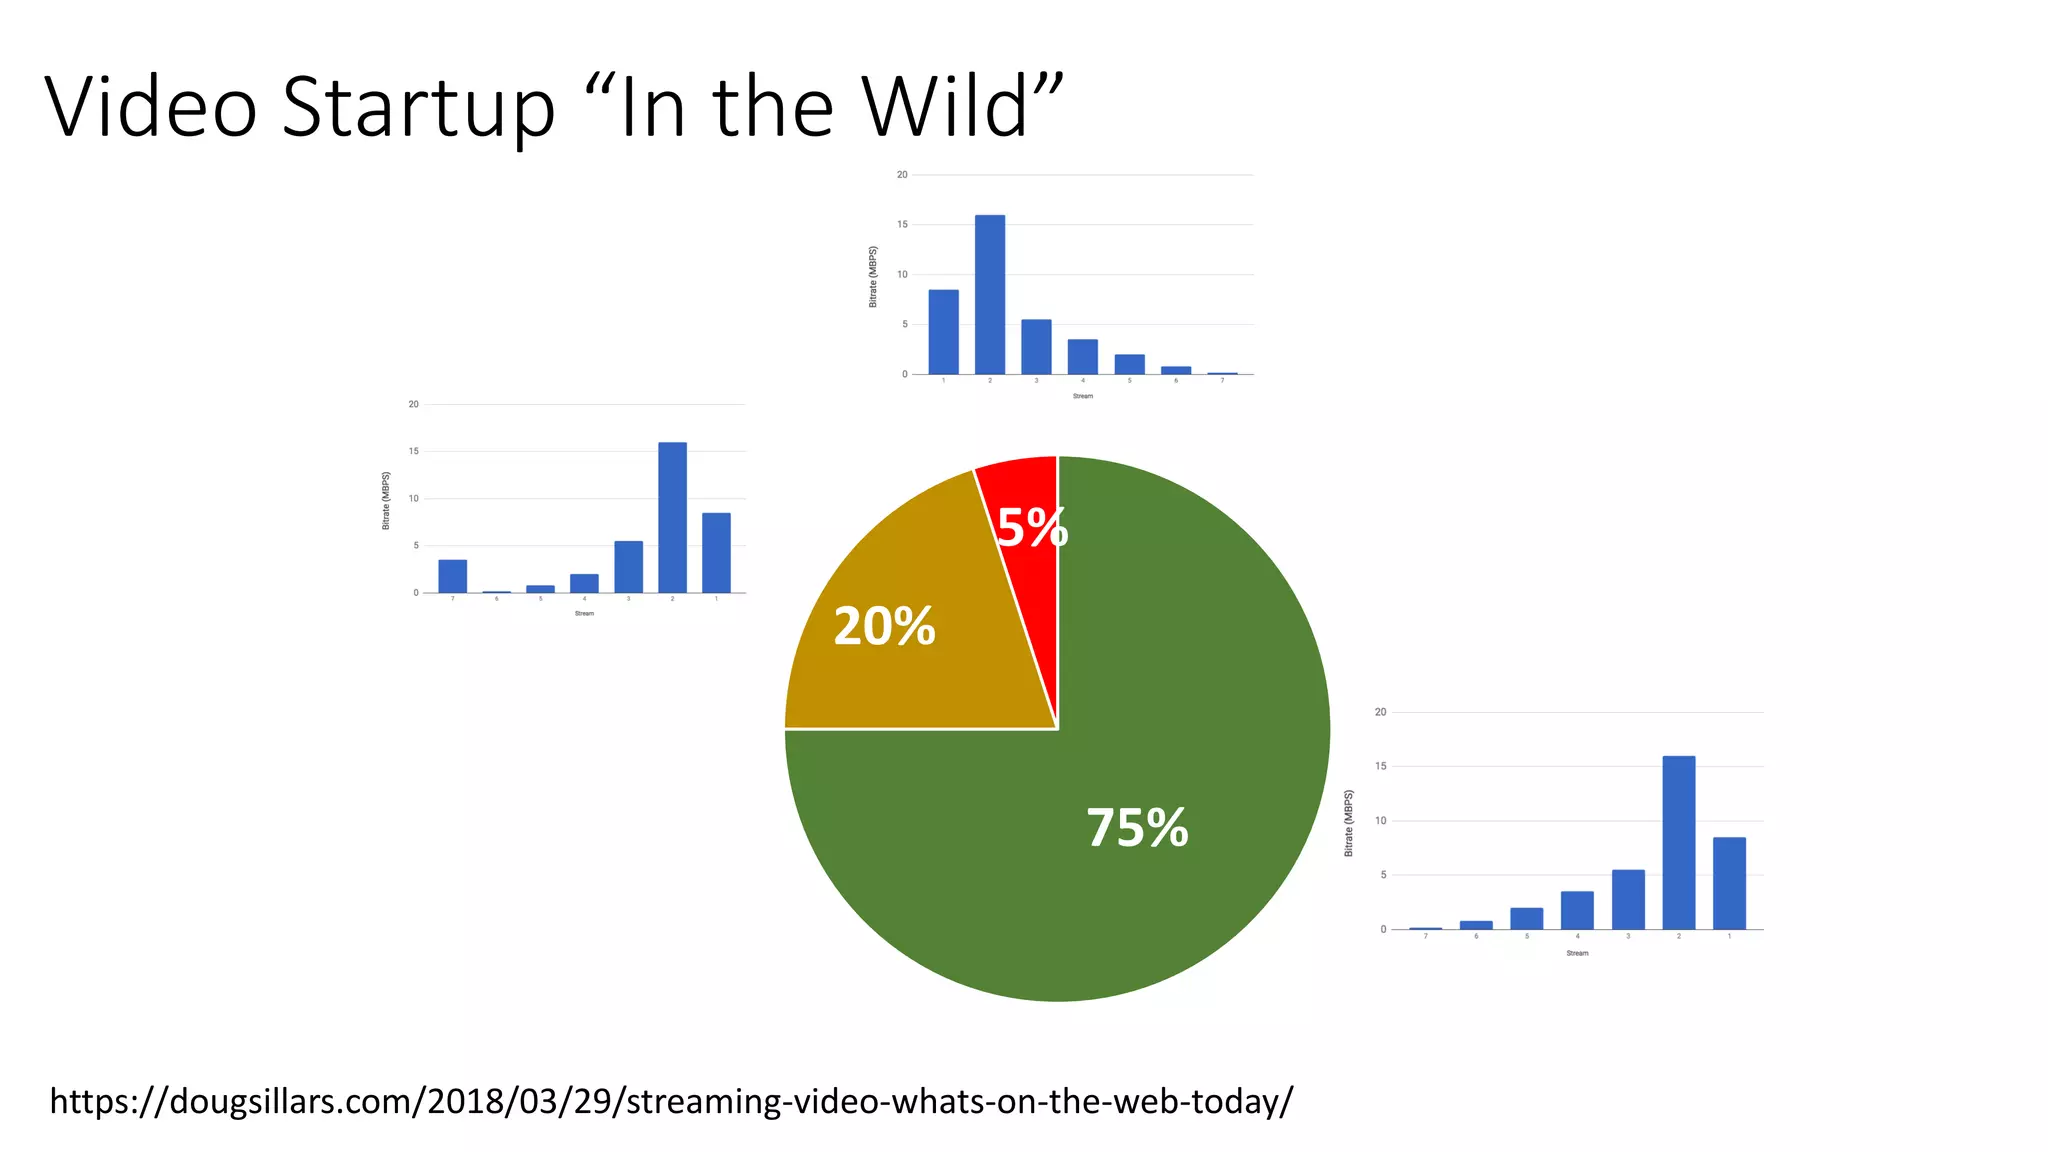


Doug Sillars presented on optimizing mobile performance. He discussed common tools for testing performance like Video Optimizer and WebPageTest. Best practices for optimization included using HTTP/2, image formats like WebP and SVG, responsive images, lazy loading, and video format/quality adjustments. Factors that can impact video startup like manifest files, available bitrates, and 3rd party interference were also covered. The goal was to learn how to test mobile sites and apps, identify issues, and apply optimizations to deliver fast, high quality experiences to users.


![Coded Agents – with UiPath SDK + LangGraph [Virtual Hands-on Workshop]](https://cdn.slidesharecdn.com/ss_thumbnails/codedagentsdeck-251215155422-5497c599-thumbnail.jpg?width=640&height=640&fit=bounds)


