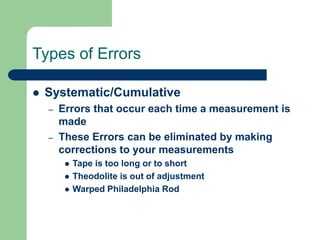
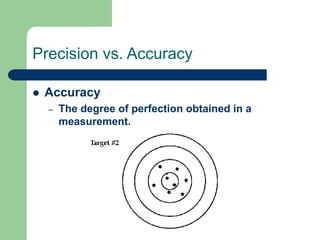
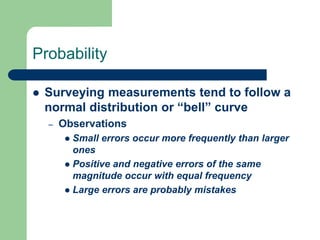
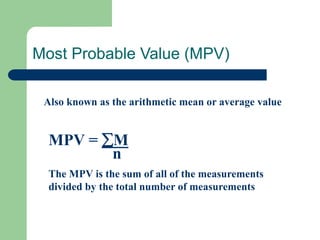
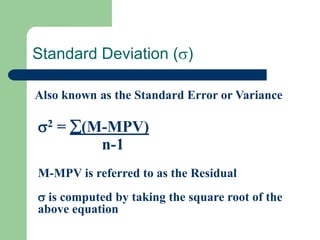
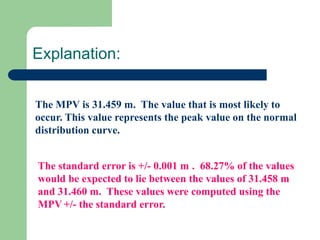
Theory of Errors in
Observations
Errors in Measurement
 No Measurement is Exact
 Every Measurement Contains Errors
 The “True” Value of a Measurement is
Never Known
 The “Exact” Error Present is Always
Unknown
Mistakes or Blunders
 Caused by:
– Carelessness
– Poor Judgement
– Incompetence
Sources of Errors
 Natural
– Environmental conditions: wind, temperature,
humidity etc.
– Tape contracts and expands due to
temperature changes
– Difficult to read Philadelphia Rod with heat
waves coming up from the pavement
Sources of Errors
 Instrumental
– Due to Limitation of Equipment
 Warped Philadelphia Rod
 Theodolite out of adjustment
 Kinked or damaged Tape
Sources of Errors
 Personal
– Limits of Human Performance Factors
 Sight
 Strength
 Judgement
 Communication
Types of Errors
 Systematic/Cumulative
– Errors that occur each time a measurement is
made
– These Errors can be eliminated by making
corrections to your measurements
 Tape is too long or to short
 Theodolite is out of adjustment
 Warped Philadelphia Rod
Precision vs. Accuracy
 Precision
– The “Closeness” of one measurement to
another
Precision vs. Accuracy
 Accuracy
– The degree of perfection obtained in a
measurement.
Precision and Accuracy
 Ultimate Goal of the Surveyor
– Rarely Obtainable
– Surveyor is happy with Precise Measurements
Computing Precision
 Precision:
Probability
 Surveying measurements tend to follow a
normal distribution or “bell” curve
– Observations
 Small errors occur more frequently than larger
ones
 Positive and negative errors of the same
magnitude occur with equal frequency
 Large errors are probably mistakes
Most Probable Value (MPV)
Also known as the arithmetic mean or average value
MPV = M
n
The MPV is the sum of all of the measurements
divided by the total number of measurements
Standard Deviation ()
Also known as the Standard Error or Variance
2 = (M-MPV)
n-1
M-MPV is referred to as the Residual
 is computed by taking the square root of the
above equation
Example:
A distance is measured repeatedly in the field and
the following measurements are recorded: 31.459
m, 31.458 m, 31.460 m, 31.854 m and 31.457 m.
Compute the most probable value (MPV),
standard error and standard error of the mean for
the data. Explain the significance of each
computed value as it relates to statistical theory.
Solution:
Measurement M - Mbar (M-Mbar)2
31.459 0 0
31.458 -0.0010 0.0000010
31.460 0.0010 0.0000010
31.457 -0.0020 0.0000040
Sum = 125.834 0.0000060
MPV or Mbar= 125.834 / 4 = 31.459 m
Solution (continued):
S.E. = +/- ((0.0000060)/(4-1))1/2 = +/- 0.0014 m
Say +/- 0.001 m
Em = 0.001/(4)1/2 = +/- 0.0005 m
Say +/- 0.001 m
Explanation:
The MPV is 31.459 m. The value that is most likely to
occur. This value represents the peak value on the normal
distribution curve.
The standard error is +/- 0.001 m . 68.27% of the values
would be expected to lie between the values of 31.458 m
and 31.460 m. These values were computed using the
MPV+/- the standard error.
Explanation (continued):
The standard error of the mean is +/- 0.001 m . The “true”
length has a 68.27% chance of being within the values of
31.458m and 31.460 m. These values were computed using
the MPV +/- Em.

Measurement Theory.ppt

  • 1.
    Theory of Errorsin Observations
  • 2.
    Errors in Measurement No Measurement is Exact  Every Measurement Contains Errors  The “True” Value of a Measurement is Never Known  The “Exact” Error Present is Always Unknown
  • 3.
    Mistakes or Blunders Caused by: – Carelessness – Poor Judgement – Incompetence
  • 4.
    Sources of Errors Natural – Environmental conditions: wind, temperature, humidity etc. – Tape contracts and expands due to temperature changes – Difficult to read Philadelphia Rod with heat waves coming up from the pavement
  • 5.
    Sources of Errors Instrumental – Due to Limitation of Equipment  Warped Philadelphia Rod  Theodolite out of adjustment  Kinked or damaged Tape
  • 6.
    Sources of Errors Personal – Limits of Human Performance Factors  Sight  Strength  Judgement  Communication
  • 7.
    Types of Errors Systematic/Cumulative – Errors that occur each time a measurement is made – These Errors can be eliminated by making corrections to your measurements  Tape is too long or to short  Theodolite is out of adjustment  Warped Philadelphia Rod
  • 8.
    Precision vs. Accuracy Precision – The “Closeness” of one measurement to another
  • 9.
    Precision vs. Accuracy Accuracy – The degree of perfection obtained in a measurement.
  • 10.
    Precision and Accuracy Ultimate Goal of the Surveyor – Rarely Obtainable – Surveyor is happy with Precise Measurements
  • 11.
  • 12.
    Probability  Surveying measurementstend to follow a normal distribution or “bell” curve – Observations  Small errors occur more frequently than larger ones  Positive and negative errors of the same magnitude occur with equal frequency  Large errors are probably mistakes
  • 13.
    Most Probable Value(MPV) Also known as the arithmetic mean or average value MPV = M n The MPV is the sum of all of the measurements divided by the total number of measurements
  • 14.
    Standard Deviation () Alsoknown as the Standard Error or Variance 2 = (M-MPV) n-1 M-MPV is referred to as the Residual  is computed by taking the square root of the above equation
  • 15.
    Example: A distance ismeasured repeatedly in the field and the following measurements are recorded: 31.459 m, 31.458 m, 31.460 m, 31.854 m and 31.457 m. Compute the most probable value (MPV), standard error and standard error of the mean for the data. Explain the significance of each computed value as it relates to statistical theory.
  • 16.
    Solution: Measurement M -Mbar (M-Mbar)2 31.459 0 0 31.458 -0.0010 0.0000010 31.460 0.0010 0.0000010 31.457 -0.0020 0.0000040 Sum = 125.834 0.0000060 MPV or Mbar= 125.834 / 4 = 31.459 m
  • 17.
    Solution (continued): S.E. =+/- ((0.0000060)/(4-1))1/2 = +/- 0.0014 m Say +/- 0.001 m Em = 0.001/(4)1/2 = +/- 0.0005 m Say +/- 0.001 m
  • 18.
    Explanation: The MPV is31.459 m. The value that is most likely to occur. This value represents the peak value on the normal distribution curve. The standard error is +/- 0.001 m . 68.27% of the values would be expected to lie between the values of 31.458 m and 31.460 m. These values were computed using the MPV+/- the standard error.
  • 19.
    Explanation (continued): The standarderror of the mean is +/- 0.001 m . The “true” length has a 68.27% chance of being within the values of 31.458m and 31.460 m. These values were computed using the MPV +/- Em.