Chinese consumers’ optimism hit a new high in October. More than 80 percent say they are returning to normal routines—and many embrace digital shopping.
These exhibits are based on survey data collected in China from October 15 to 22, 2021. Check back for regular updates on Chinese consumer sentiments, behaviors, income, spending, and expectations.
Boost in optimism and spend intent
Consumer optimism regarding economic conditions after COVID-19 are up by more than 50% since February; strongest growth in spend intent is for out-of-home entertainment, dining out, and travel.
Saudi consumers remain optimistic about economic recovery, however they continue to spend less on discretionary items and more on essential goods.
These exhibits are based on survey data collected in Saudi Arabia from January 25 to February 10, 2021. Check back for regular updates on Saudi consumer sentiments, behaviors, income, spending, and expectations.
As governments and organizations continue to work toward containing COVID-19 and stem the growing humanitarian toll it is exacting, the economic effects are also beginning to be felt. Through a series of regular, global surveys, we are tracking how customers’ expectations, spending, and behaviors are changing throughout the crisis across multiple countries over time. Please check back regularly for updates.
Indian consumers are optimistic about the economy and plan to spend more. They are open to new shopping behaviors as they transition to out-of-home activities.
These exhibits are based on survey data collected in India from October 15 to 22, 2021. Check back for regular updates on Indian consumer sentiments, behaviors, income, spending, and expectations.
After steadily improving, Japanese consumer optimism stabilizes and a majority of consumers remain cautious about returning to out-of-home activities.
These exhibits are based on survey data collected in Japan from October 15 to 22, 2021. Check back for regular updates on Japanese consumer sentiments, behaviors, income, spending, and expectations.
This document is meant to help with a narrower goal: provide facts and insights on the current COVID-19 crisis to help marketers and business decision makers. In addition to the humanitarian challenge, there are implications for the wider economy, businesses, and employment. This document includes consumer insights from third-party data providers between February 2019 and August 2021, as well as longitudinal surveys conducted between March 2020 and August 2021, in the United States. Check back for regular updates on US consumer sentiments, behaviors, income, spending, and expectations.
European consumers are gradually returning to pre-COVID-19 spending and out-of-home activities, including holiday shopping, though some pandemic-related practices will continue.
US consumers exhibited strong optimism and spend in October, driven by consumers across the age and income spectrum.
Check back for regular updates on US consumer sentiments, behaviors, income, spending, and expectations.
Spend not splurge – consumers point to muted sales
Optimism for an economic rebound has peaked, with young consumers the most optimistic
Despite this, spending intent is negative for many categories, though improved from February
These exhibits are based on survey data collected in the United States between February 2019 and June 2021, as well as longitudinal surveys conducted between March 2020 and February 2021. Check back for regular updates on US consumer sentiments, behaviors, income, spending, and expectations.
In Spain, consumer optimism about the economy has doubled since February 2021, reaching 33 percent. Consumers indicated greater intent to spend, and almost half intended to splurge this year. At equal rates of 60 percent, Spanish consumers said they are omnichannel shoppers and have returned to participating in out-of-home activities (way up from 20 percent in February 2021). More than four in ten reported changing brands, mainly for price. Over one-third said more of their holiday shopping would be online in 2021 than in 2020, and about 40 percent said they would start shopping earlier.
To what extent are you committed to success? Don’t miss the most compelling marketing event of the year. Come and hear how three leading marketers have dealt with challenging situations, turning them into outstanding successes. Here is your opportunity to ask questions and workshop issues and ideas. Learn how to focus your marketing energy, recognise what you are good at and charge on!
Despite ongoing lockdowns, European optimism about economic recovery remains steady, except in the United Kingdom, where it is at its highest of the pandemic.
These exhibits are based on survey data collected in the France, Germany, Italy, Spain, and the United Kingdom from February 23–27, 2021. Check back for regular updates on the European consumer sentiments, behaviors, income, spending, and expectations.
In Qatar, the prevailing sentiment is uncertainty about the health of family members and the duration of the COVID-19 crisis. Although consumers are optimistic about the country’s economic recovery after the COVID-19 situation subsides, they are cutting their spending on almost all categories. During the crisis, consumers have both adopted and increased their usage of digital activities such as remote learning, videoconferencing, and contactless delivery and pickup of food and supplies.
These exhibits are based on survey data collected in Qatar from April 24–May 1, 2020. Check back for regular updates on Qatari residents’ consumer sentiments, behaviors, income, spending, and expectations.
US consumers exhibited strong optimism and spend in October, driven by consumers across the age and income spectrum.
Check back for regular updates on US consumer sentiments, behaviors, income, spending, and expectations.
Optimism grows as categories recover
One-third (32%) of French consumers are optimistic for the future —the highest rate seen in our surveys; while net spending intent remains negative, it is trending up across all categories
Despite an ongoing lockdown, German consumers’ expectations for economic recovery are stable, with half believing their routines will return to normal by the end of 2021.
These exhibits are based on survey data collected in Germany from February 23–27, 2021. Check back for regular updates on German consumer sentiments, behaviors, income, spending, and expectations.
Although Japanese consumer optimism about economic recovery is improving steadily, the majority of consumers are still cautious about reengaging in out-of-home activities.
These exhibits are based on survey data collected in Japan from February 24–27, 2021. Check back for regular updates on Japanese consumer sentiments, behaviors, income, spending, and expectations.
Optimism and spend intent returning
Consumer optimism regarding economic conditions after COVID-19 up by more than 50% since February (from 21% to 34%); strongest growth in spend intent for out-of-home entertainment and travel, but most categories are increasing
Spend not splurge – consumers point to muted sales
Optimism for an economic rebound has peaked, with young consumers the most optimistic
Despite this, spending intent is negative for many categories, though improved from February
Filipino consumers generally remained as optimistic in October as they were in April; however, optimism among lower-income groups declined significantly.
As the government’s COVID-19 restrictions ease, Filipino consumers are cautiously resuming spending activity. While overall optimism remained the same from April to October, optimism in the lowest income group dropped significantly, while those in the highest income group increased. Optimism among 20- to 24-year-olds also declined. Additionally, approximately 50 percent of respondents believe their finances will be impacted for at least six more months, up from only about 10 percent last April. Overall decreases in spending are expected to soften after the pandemic, but most categories will likely see spending declines linger for the long term.
These exhibits are based on survey data collected in the Philippines from April 17 to 20, and October 1 to 12, 2020.
Boost in optimism and spend intent
Consumer optimism regarding economic conditions after COVID-19 are up by more than 50% since February; strongest growth in spend intent is for out-of-home entertainment, dining out, and travel
Portuguese consumers are concerned about the health of family members as well as the economy, and are cutting back on spending.
Portuguese consumers continue to feel the economic effects of the crisis, and their concerns about health, safety, and the economy are increasing. Most consumers still believe that the personal and financial impact of COVID-19 will continue to last well beyond two months. They expect to cut their spending across almost all categories. However, the proportion of consumers’ income, spending, and savings affected by the COVID-19 situation has decreased slightly since the last pulse. Portuguese consumers have been leaving home mainly to shop and meet family, and expect to continue doing so in the near future. In addition to lifted restrictions, consumers are waiting for the endorsement of medical authorities prior to engaging in out-of-home activities.
These exhibits are based on survey data collected in Portugal from June 19–21, 2020. Check back for regular updates on Portuguese consumer sentiments, behaviors, income, spending, and expectations.
Chinese consumers have grown less optimistic about the economy, likely due to recent outbreaks of the omicron variant.
In China, overall optimism on economic recovery remains high relative to other countries surveyed. However, the share of optimistic consumers has decreased by more than ten percentage points versus October 2021, likely in reaction to recent omicron outbreaks. Omnichannel shopping behavior and adoption of digital activities continue to prevail, and intent to continue these is high. Meanwhile, intent to spend on out-of-home activities has decreased significantly.
Optimism and spend intent returning
Consumer optimism regarding economic conditions after COVID-19 up by more than 50% since February (from 21% to 34%); strongest growth in spend intent for out-of-home entertainment and travel, but most categories are increasing
Spend not splurge – consumers point to muted sales
Optimism for an economic rebound has peaked, with young consumers the most optimistic
Despite this, spending intent is negative for many categories, though improved from February
These exhibits are based on survey data collected in the United States between February 2019 and June 2021, as well as longitudinal surveys conducted between March 2020 and February 2021. Check back for regular updates on US consumer sentiments, behaviors, income, spending, and expectations.
In Spain, consumer optimism about the economy has doubled since February 2021, reaching 33 percent. Consumers indicated greater intent to spend, and almost half intended to splurge this year. At equal rates of 60 percent, Spanish consumers said they are omnichannel shoppers and have returned to participating in out-of-home activities (way up from 20 percent in February 2021). More than four in ten reported changing brands, mainly for price. Over one-third said more of their holiday shopping would be online in 2021 than in 2020, and about 40 percent said they would start shopping earlier.
To what extent are you committed to success? Don’t miss the most compelling marketing event of the year. Come and hear how three leading marketers have dealt with challenging situations, turning them into outstanding successes. Here is your opportunity to ask questions and workshop issues and ideas. Learn how to focus your marketing energy, recognise what you are good at and charge on!
Despite ongoing lockdowns, European optimism about economic recovery remains steady, except in the United Kingdom, where it is at its highest of the pandemic.
These exhibits are based on survey data collected in the France, Germany, Italy, Spain, and the United Kingdom from February 23–27, 2021. Check back for regular updates on the European consumer sentiments, behaviors, income, spending, and expectations.
In Qatar, the prevailing sentiment is uncertainty about the health of family members and the duration of the COVID-19 crisis. Although consumers are optimistic about the country’s economic recovery after the COVID-19 situation subsides, they are cutting their spending on almost all categories. During the crisis, consumers have both adopted and increased their usage of digital activities such as remote learning, videoconferencing, and contactless delivery and pickup of food and supplies.
These exhibits are based on survey data collected in Qatar from April 24–May 1, 2020. Check back for regular updates on Qatari residents’ consumer sentiments, behaviors, income, spending, and expectations.
US consumers exhibited strong optimism and spend in October, driven by consumers across the age and income spectrum.
Check back for regular updates on US consumer sentiments, behaviors, income, spending, and expectations.
Optimism grows as categories recover
One-third (32%) of French consumers are optimistic for the future —the highest rate seen in our surveys; while net spending intent remains negative, it is trending up across all categories
Despite an ongoing lockdown, German consumers’ expectations for economic recovery are stable, with half believing their routines will return to normal by the end of 2021.
These exhibits are based on survey data collected in Germany from February 23–27, 2021. Check back for regular updates on German consumer sentiments, behaviors, income, spending, and expectations.
Although Japanese consumer optimism about economic recovery is improving steadily, the majority of consumers are still cautious about reengaging in out-of-home activities.
These exhibits are based on survey data collected in Japan from February 24–27, 2021. Check back for regular updates on Japanese consumer sentiments, behaviors, income, spending, and expectations.
Optimism and spend intent returning
Consumer optimism regarding economic conditions after COVID-19 up by more than 50% since February (from 21% to 34%); strongest growth in spend intent for out-of-home entertainment and travel, but most categories are increasing
Spend not splurge – consumers point to muted sales
Optimism for an economic rebound has peaked, with young consumers the most optimistic
Despite this, spending intent is negative for many categories, though improved from February
Filipino consumers generally remained as optimistic in October as they were in April; however, optimism among lower-income groups declined significantly.
As the government’s COVID-19 restrictions ease, Filipino consumers are cautiously resuming spending activity. While overall optimism remained the same from April to October, optimism in the lowest income group dropped significantly, while those in the highest income group increased. Optimism among 20- to 24-year-olds also declined. Additionally, approximately 50 percent of respondents believe their finances will be impacted for at least six more months, up from only about 10 percent last April. Overall decreases in spending are expected to soften after the pandemic, but most categories will likely see spending declines linger for the long term.
These exhibits are based on survey data collected in the Philippines from April 17 to 20, and October 1 to 12, 2020.
Boost in optimism and spend intent
Consumer optimism regarding economic conditions after COVID-19 are up by more than 50% since February; strongest growth in spend intent is for out-of-home entertainment, dining out, and travel
Portuguese consumers are concerned about the health of family members as well as the economy, and are cutting back on spending.
Portuguese consumers continue to feel the economic effects of the crisis, and their concerns about health, safety, and the economy are increasing. Most consumers still believe that the personal and financial impact of COVID-19 will continue to last well beyond two months. They expect to cut their spending across almost all categories. However, the proportion of consumers’ income, spending, and savings affected by the COVID-19 situation has decreased slightly since the last pulse. Portuguese consumers have been leaving home mainly to shop and meet family, and expect to continue doing so in the near future. In addition to lifted restrictions, consumers are waiting for the endorsement of medical authorities prior to engaging in out-of-home activities.
These exhibits are based on survey data collected in Portugal from June 19–21, 2020. Check back for regular updates on Portuguese consumer sentiments, behaviors, income, spending, and expectations.
Chinese consumers have grown less optimistic about the economy, likely due to recent outbreaks of the omicron variant.
In China, overall optimism on economic recovery remains high relative to other countries surveyed. However, the share of optimistic consumers has decreased by more than ten percentage points versus October 2021, likely in reaction to recent omicron outbreaks. Omnichannel shopping behavior and adoption of digital activities continue to prevail, and intent to continue these is high. Meanwhile, intent to spend on out-of-home activities has decreased significantly.
Optimism and spend intent returning
Consumer optimism regarding economic conditions after COVID-19 up by more than 50% since February (from 21% to 34%); strongest growth in spend intent for out-of-home entertainment and travel, but most categories are increasing
In China, almost all consumers have already returned to normal out-of-home activities, and 97 percent of respondents report working outside the home in the two weeks prior to being surveyed.
These exhibits are based on survey data collected in China from Feb. 20 to March 8, 2021. Check back for regular updates on Chinese consumer sentiments, behaviors, income, spending, and expectations.
Australian consumers, in view of the omicron variant, are feeling less optimistic about economic recovery than last year and remain cautious on spending.
In Australia, optimism about economic recovery has declined since the November 2020 pulse survey but remains higher than at the onset of the COVID-19 pandemic. Six in ten consumers predict routines will return to normal only after June 2022; two-thirds do not plan to splurge in 2022. Although Australian households increased their spending in the past month, net intent to spend remains negative. Digital and omnichannel adoption continues in most categories, and intent to use out-of-home services rose. Seventy-five percent of consumers have addressed the rise of omicron by changing how they engage in out-of-home activities. Most consumers have tried a different brand or retailer, especially to switch brands in pursuit of value.
Optimism grows as categories recover
One-third (32%) of French consumers are optimistic for the future —the highest rate seen in our surveys; while net spending intent remains negative, it is trending up across all categories
Spanish consumers’ overall economic pessimism has decreased since November, but caution about engaging in out-of-home activities continues.
These exhibits are based on survey data collected in Spain from February 23–27, 2021. Check back for regular updates on Spanish consumer sentiments, behaviors, income, spending, and expectations.
Indian consumers’ optimism has remained high since October 2021 and has reached the highest levels across other Asian markets since COVID-19 started.
Nearly three-quarters of India’s consumers are optimistic about economic recovery, and net intent to spend is growing and positive across many categories. Omnichannel usage continues across the majority of categories, and social-media influence is high, especially for Gen Z and millennials. More than 90 percent are engaging in social media and entertainment platforms. There is an upward trend for new technology, such as crypto and augmented reality/virtual reality, and consumers intend to continue digital activities as the COVID-19 crisis subsides.
About 40 percent of consumers are engaging in out-of-home activities, especially among the vaccinated segment. Most consumers have tried new shopping behaviors such as new retail outlets and new brands.
Despite an ongoing lockdown, German consumers’ expectations for economic recovery are stable, with half believing their routines will return to normal by the end of 2021.
These exhibits are based on survey data collected in Germany from February 23–27, 2021. Check back for regular updates on German consumer sentiments, behaviors, income, spending, and expectations.
Indian consumers’ optimism has remained high since October 2021 and has reached the highest levels across other Asian markets since COVID-19 started.
Nearly three-quarters of India’s consumers are optimistic about economic recovery, and net intent to spend is growing and positive across many categories. Omnichannel usage continues across the majority of categories, and social-media influence is high, especially for Gen Z and millennials. More than 90 percent are engaging in social media and entertainment platforms. There is an upward trend for new technology, such as crypto and augmented reality/virtual reality, and consumers intend to continue digital activities as the COVID-19 crisis subsides.
About 40 percent of consumers are engaging in out-of-home activities, especially among the vaccinated segment. Most consumers have tried new shopping behaviors such as new retail outlets and new brands.
Chinese optimism has improved to the highest level since March. Most Chinese consumers expect their routines and finances to return to normal within three months.
These exhibits are based on survey data collected in China from September 16–24, 2020. Check back for regular updates on Chinese consumer sentiments, behaviors, income, spending, and expectations.
Indonesian consumers remain optimistic on the economy, expecting higher incomes and spending. Many tried and plan to keep using digital services and omnichannel methods.
In Indonesia, optimism about future economic conditions increased more than 25 percent over September 2020 from an already high base, boosted by planning for the upcoming holiday season. Eight out of ten consumers say they will dine out, shop for gifts, and redecorate. Out-of-home activities are generally rising but remain far below prepandemic levels. Optimism about the economy is tempered by views of household finances; half predict finances won’t return to normal before June. The loyalty shake-up continues, with 60 percent citing value as their primary reason to try a new brand. New digital behaviors are starting to show evidence of stickiness: 60 percent say they intend to use new shopping methods when the pandemic subsides.
Japanese consumers’ behaviors and finances are gradually recovering to normal, though their responses indicate a slight increase in pessimism. The long-lasting impact of COVID-19 is prolonging Japanese consumers’ intent to stay conservative about spending across categories. In a further sign of cautiousness, the trend of shrinking pessimism over the past few years reversed for the first time. Meanwhile, people’s demand for travel is rising, considering the next seasonal vacations.
While American optimism on economic recovery continues to recover, over half of US consumers do not expect their routines to return until the latter half of 2021.
These exhibits are based on survey data collected in US from November 9–13, 2020. Check back for regular updates on American consumer sentiments, behaviors, income, spending, and expectations.
Japanese consumers’ behaviors and finances are gradually recovering to normal, though their responses indicate a slight increase in pessimism. The long-lasting impact of COVID-19 is prolonging Japanese consumers’ intent to stay conservative about spending across categories. In a further sign of cautiousness, the trend of shrinking pessimism over the past few years reversed for the first time. Meanwhile, people’s demand for travel is rising, considering the next seasonal vacations.
Since May 2020, more Canadians are feeling more pessimistic about the economic recovery and believe COVID-19 will have a lasting impact on the economy .
These exhibits are based on survey data collected in Canada from August 14–19, 2020. Check back for regular updates on Canadian consumer sentiments, behaviors, income, spending, and expectations.
Similar to McKinsey Survey: Chinese consumer sentiment during the coronavirus crisis (20)
Spanish consumers are pessimistic about the economy. Rising prices, unemployment, and the invasion of Ukraine are top concerns, and consumers are trading down.
In Spain, consumers are most concerned about rising prices, unemployment, and the invasion of Ukraine. Their views of the current and future state of the economy remain pessimistic, at a level comparable to attitudes in the early months of the COVID-19 pandemic. Spend for groceries and gasoline soared, while consumers reduced money directed to savings and spent less on non-essentials. Of the 80 percent of consumers who have assumed new shopping behaviors in the last three months in search of value for money, more than half tried private labels. Trade-down in retailers visited and brands is evident, with the key drivers of choice being prices and value for money. However, 39 percent of consumers say they plan to splurge in 2022.
UK consumers are pessimistic about the economy. Rising prices and the invasion of Ukraine are top concerns, and consumers are trading down significantly.
In the United Kingdom, consumers are most concerned about rising prices and the invasion of Ukraine. Their views of the current and future state of the economy are extremely pessimistic, worse than throughout the entire COVID-19 pandemic. Spend for groceries and gasoline soared, while consumers reduced spend in non-essential categories. Almost two-thirds of consumers have assumed new shopping behaviors in the last four to six weeks, with more than four out of ten trying private label. Trade-down in retailers visited and brands is evident, with the key drivers of choice being prices and value for money.
COVID-19 is no longer among Italian consumers’ top concerns. Consumers remain pessimistic about economic recovery and inflation; many aim to reduce their spend.
Italian consumers are increasingly worried about the effects of rising prices and the invasion of Ukraine. Unemployment is a number-two concern for respondents in Gen Z, millennials, and the low-income group. Almost six out of ten share a negative view of Italy’s current economic state; hopes for an economic recovery are lower than during the entire COVID-19 pandemic. Consumers observed the highest price increases in groceries and gasoline. To cope with inflation, Italian consumers are changing their purchase behavior, shifting toward discounters and private labels. The leading factors for these choices are prices and value for money.
German consumers are pessimistic about the economy. Rising prices and the invasion of Ukraine are top concerns, and we see a significant down-trade in shopping.
In Germany, consumers’ top concerns are rising prices and the invasion of Ukraine, followed by climate change and COVID-19. Pessimism about the current and future state of the economy has eased but remains at a level comparable to attitudes in the early months of the COVID-19-pandemic. As spend for groceries and gasoline soared, consumers reduced money directed to savings and spent less on non-essentials. Of the 70 percent of consumers who have assumed new shopping behaviors in the last three months, more than four out of ten tried private labels. Trade-down in stores visited and brands is clearly visible, with the key drivers of choice being prices and value for money. However, 46 percent of consumers say they plan to splurge in 2022.
For consumers in France, inflation eclipses other sources of concern. It triggers changes in shopping behaviors as consumers seek better value for money.
French consumers’ optimism regarding the economic recovery is stable at around 14 percent—a level last seen in the depths of COVID-19 lockdowns. Top sources of concern are rising prices (cited by 54 percent), followed by the invasion of Ukraine (13 percent) and climate change (10 percent) and far ahead of COVID-19 (4 percent). Nine out of ten survey respondents perceive high price inflation in the country. These trends have implications for brand and retailer loyalty: of the 73 percent of respondents saying they have tried new shopping behaviors in the last three months, 40 percent say they purchased private labels. Household products remain the category most affected by this trading-down trend.
Most Korean consumers expect that normalcy will return to routines only after June 2022, yet there are signs of pre-COVID-19 routines returning.
Korean customers have been less optimistic than those in other countries about the economic recovery. But optimism in Korea is much higher now than two years ago. Half of consumers indicate a desire to splurge, with intent to do so being the strongest in Gen Z and millennials. One-eighth of consumers say they have returned to out-of-home activities.
As inflation rises, French consumer hopes for economic recovery wane, with optimism sinking back to the lows of lockdown.
Optimism regarding the economic recovery has decreased to 14 percent in France—levels last seen in the depths of COVID-19 lockdown. Top sources of concern are rising prices, the invasion of Ukraine, and political uncertainty. Nine out of ten survey respondents perceive high price inflation in the country, and 60 percent expect prices to rise further over the next year. These trends have implications for loyalty: in the search for higher purchasing power, 69 percent of respondents have tried new shopping behaviors in the last four to six weeks. Household products remain the most impacted category, with 65 percent of consumers switching for cheaper options.
Pessimism about recovery is at an all-time high in the United Kingdom. Rising prices are the top concern, with consumers significantly trading down in stores and products. UK consumers are feeling great economic uncertainty. With energy and transport costs eating away at consumer savings and non-food spend, the top reasons given by survey participants for economic anxiety are the gas supply, supply-chain shortages, and energy issues. Consumers report the highest perceived price increases in groceries and household supplies, with two-thirds becoming more conscious about energy usage. Half of consumers changed their grocery brands in the last four to six weeks, with trading down a clear trend: price and value were the strongest drivers here.
Rising prices and the Ukraine invasion are top concerns for German consumers, fueling a general slide into economic pessimism.
German consumers are experiencing intense unease regarding the state of the economy and its future outlook—with public sentiment sinking lower than at any time during the COVID-19 pandemic. Survey participants felt the greatest concern about rising prices and the invasion of Ukraine. Spend on groceries and gasoline has soared, even as consumers cut spending in non-essential categories. Almost two-thirds have assumed new shopping behaviors in the last four to six weeks, with more than forty percent trying private-label brands. There’s a clear trade-down trend in stores visited and brands chosen, with prices and value for money as key drivers.
Across the continent, the pattern holds: Europeans are anxious about the state of their countries’ economies, and worried about the future. Russia’s invasion of Ukraine and price inflation overshadow other concerns, and consumer anxieties in turn are impacting confidence in household finances and national economies, especially among vulnerable populations.
Worried about spending more on food, transport and fuel, consumers report cutting back on less essential items. Most say they’ve changed their shopping behaviors in recent months, trading down to more affordable brands and retailers. With no relief clearly in sight, 2022 continues to prove a challenging year for the continental consumer.
Spanish consumers are primarily concerned about inflation and the invasion of Ukraine, and are becoming increasingly pessimistic about the economy.
Only 14 percent of Spanish consumers are optimistic about economic recovery, with concerns focused on inflation and the invasion of Ukraine. Four in ten have an increasingly negative sense of the economic outlook—mostly due to petrol and supply-chain shortages, as well as unemployment. Price-increase Perceptions of price increases are particularly high regarding groceries (at 95 percent) and other household products. In these categories, more than half of respondents have reacted to inflation by trying less costly brands. Over the last six weeks, half have tried a private-label brand, 30 percent have switched brands, and a quarter have tried out a different retailer.
Italian consumers are increasingly pessimistic about the economy, with many aiming to reduce spending and modify consumption habits.
Italian consumers are increasingly worried about the effects of rising prices, as well as the invasion of Ukraine. Of Italians surveyed, six in ten expressed a negative view of the current economy; hopes for an economic recovery are lower than they were throughout the entire COVID-19 pandemic. Consumers perceived the highest price increases in groceries and fuel, along with strong increase in spend. These sentiments have translated into reduced consumption. Changed consumer behavior is also apparent, with a shift towards discounters and private-label brands. Price, value for money and availability are the biggest drivers of these choices.
Rising prices and the Ukraine invasion are top concerns for German consumers, fueling a general slide into economic pessimism.
German consumers are experiencing intense unease regarding the state of the economy and its future outlook—with public sentiment sinking lower than at any time during the COVID-19 pandemic. Survey participants felt the greatest concern about rising prices and the invasion of Ukraine. Spend on groceries and gasoline has soared, even as consumers cut spending in non-essential categories. Almost two-thirds have assumed new shopping behaviors in the last four to six weeks, with more than forty percent trying private-label brands. There’s a clear trade-down trend in stores visited and brands chosen, with prices and value for money as key drivers.
As inflation rises, French consumer hopes for economic recovery wane, with optimism sinking back to the lows of lockdown. Optimism regarding the economic recovery has decreased to 14 percent in France—levels last seen in the depths of COVID-19 lockdown. Top sources of concern are rising prices, the invasion of Ukraine, and political uncertainty. Nine out of ten survey respondents perceive high price inflation in the country, and 60 percent expect prices to rise further over the next year. These trends have implications for loyalty: in the search for higher purchasing power, 69 percent of respondents have tried new shopping behaviors in the last four to six weeks. Household products remain the most impacted category, with 65 percent of consumers switching for cheaper options.
Pessimism about recovery is at an all-time high in the United Kingdom. Rising prices are the top concern, with consumers significantly trading down in stores and products. UK consumers are feeling great economic uncertainty. With energy and transport costs eating away at consumer savings and non-food spend, the top reasons given by survey participants for economic anxiety are the gas supply, supply-chain shortages, and energy issues. Consumers report the highest perceived price increases in groceries and household supplies, with two-thirds becoming more conscious about energy usage. Half of consumers changed their grocery brands in the last four to six weeks, with trading down a clear trend: price and value were the strongest drivers here.
Spanish consumers are primarily concerned about inflation and the invasion of Ukraine, and are becoming increasingly pessimistic about the economy.
Only 14 percent of Spanish consumers are optimistic about economic recovery, with concerns focused on inflation and the invasion of Ukraine. Four in ten have an increasingly negative sense of the economic outlook—mostly due to petrol and supply-chain shortages, as well as unemployment. Price-increase Perceptions of price increases are particularly high regarding groceries (at 95 percent) and other household products. In these categories, more than half of respondents have reacted to inflation by trying less costly brands. Over the last six weeks, half have tried a private-label brand, 30 percent have switched brands, and a quarter have tried out a different retailer.
Italian consumers are increasingly pessimistic about the economy, with many aiming to reduce spending and modify consumption habits.
Italian consumers are increasingly worried about the effects of rising prices, as well as the invasion of Ukraine. Of Italians surveyed, six in ten expressed a negative view of the current economy; hopes for an economic recovery are lower than they were throughout the entire COVID-19 pandemic. Consumers perceived the highest price increases in groceries and fuel, along with strong increase in spend. These sentiments have translated into reduced consumption. Changed consumer behavior is also apparent, with a shift towards discounters and private-label brands. Price, value for money and availability are the biggest drivers of these choices.
Across the continent, the pattern holds: Europeans are anxious about the state of their countries’ economies, and pessimistic about the future. Price inflation and the war in Ukraine overshadow other concerns, and these anxieties in turn are causing confidence in household finances and national economies to plummet, especially among low-income households and the elderly. As consumers worry about spending ever more on food, transport and fuel, they cut back on less essential items. Most say they’ve changed their shopping behaviors in recent months, trading down to more affordable brands and retailers. With no relief clearly in sight, 2022 continues to prove an unusually challenging year for the embattled continental consumer.
Most Korean consumers expect that normalcy will return to routines only after June 2022, yet there are signs of pre-COVID-19 routines returning.
Korean customers have been less optimistic than those in other countries about the economic recovery. But optimism in Korea is much higher now than two years ago. Half of consumers indicate a desire to splurge, with intent to do so being the strongest in Gen Z and millennials. One-eighth of consumers say they have returned to out-of-home activities.
Digital Transformation and IT Strategy Toolkit and TemplatesAurelien Domont, MBA
This Digital Transformation and IT Strategy Toolkit was created by ex-McKinsey, Deloitte and BCG Management Consultants, after more than 5,000 hours of work. It is considered the world's best & most comprehensive Digital Transformation and IT Strategy Toolkit. It includes all the Frameworks, Best Practices & Templates required to successfully undertake the Digital Transformation of your organization and define a robust IT Strategy.
Editable Toolkit to help you reuse our content: 700 Powerpoint slides | 35 Excel sheets | 84 minutes of Video training
This PowerPoint presentation is only a small preview of our Toolkits. For more details, visit www.domontconsulting.com
LA HUG - Video Testimonials with Chynna Morgan - June 2024Lital Barkan
Have you ever heard that user-generated content or video testimonials can take your brand to the next level? We will explore how you can effectively use video testimonials to leverage and boost your sales, content strategy, and increase your CRM data.🤯
We will dig deeper into:
1. How to capture video testimonials that convert from your audience 🎥
2. How to leverage your testimonials to boost your sales 💲
3. How you can capture more CRM data to understand your audience better through video testimonials. 📊
Personal Brand Statement:
As an Army veteran dedicated to lifelong learning, I bring a disciplined, strategic mindset to my pursuits. I am constantly expanding my knowledge to innovate and lead effectively. My journey is driven by a commitment to excellence, and to make a meaningful impact in the world.
Anny Serafina Love - Letter of Recommendation by Kellen Harkins, MS.AnnySerafinaLove
This letter, written by Kellen Harkins, Course Director at Full Sail University, commends Anny Love's exemplary performance in the Video Sharing Platforms class. It highlights her dedication, willingness to challenge herself, and exceptional skills in production, editing, and marketing across various video platforms like YouTube, TikTok, and Instagram.
Company Valuation webinar series - Tuesday, 4 June 2024FelixPerez547899
This session provided an update as to the latest valuation data in the UK and then delved into a discussion on the upcoming election and the impacts on valuation. We finished, as always with a Q&A
FIA officials brutally tortured innocent and snatched 200 Bitcoins of worth 4...jamalseoexpert1978
Farman Ayaz Khattak and Ehtesham Matloob are government officials in CTW Counter terrorism wing Islamabad, in Federal Investigation Agency FIA Headquarters. CTW and FIA kidnapped crypto currency owner from Islamabad and snatched 200 Bitcoins those worth of 4 billion rupees in Pakistan currency. There is not Cryptocurrency Regulations in Pakistan & CTW is official dacoit and stealing digital assets from the innocent crypto holders and making fake cases of terrorism to keep them silent.
Navigating the world of forex trading can be challenging, especially for beginners. To help you make an informed decision, we have comprehensively compared the best forex brokers in India for 2024. This article, reviewed by Top Forex Brokers Review, will cover featured award winners, the best forex brokers, featured offers, the best copy trading platforms, the best forex brokers for beginners, the best MetaTrader brokers, and recently updated reviews. We will focus on FP Markets, Black Bull, EightCap, IC Markets, and Octa.
At Techbox Square, in Singapore, we're not just creative web designers and developers, we're the driving force behind your brand identity. Contact us today.
Discover the innovative and creative projects that highlight my journey throu...dylandmeas
Discover the innovative and creative projects that highlight my journey through Full Sail University. Below, you’ll find a collection of my work showcasing my skills and expertise in digital marketing, event planning, and media production.
In the Adani-Hindenburg case, what is SEBI investigating.pptxAdani case
Adani SEBI investigation revealed that the latter had sought information from five foreign jurisdictions concerning the holdings of the firm’s foreign portfolio investors (FPIs) in relation to the alleged violations of the MPS Regulations. Nevertheless, the economic interest of the twelve FPIs based in tax haven jurisdictions still needs to be determined. The Adani Group firms classed these FPIs as public shareholders. According to Hindenburg, FPIs were used to get around regulatory standards.
Understanding User Needs and Satisfying ThemAggregage
https://www.productmanagementtoday.com/frs/26903918/understanding-user-needs-and-satisfying-them
We know we want to create products which our customers find to be valuable. Whether we label it as customer-centric or product-led depends on how long we've been doing product management. There are three challenges we face when doing this. The obvious challenge is figuring out what our users need; the non-obvious challenges are in creating a shared understanding of those needs and in sensing if what we're doing is meeting those needs.
In this webinar, we won't focus on the research methods for discovering user-needs. We will focus on synthesis of the needs we discover, communication and alignment tools, and how we operationalize addressing those needs.
Industry expert Scott Sehlhorst will:
• Introduce a taxonomy for user goals with real world examples
• Present the Onion Diagram, a tool for contextualizing task-level goals
• Illustrate how customer journey maps capture activity-level and task-level goals
• Demonstrate the best approach to selection and prioritization of user-goals to address
• Highlight the crucial benchmarks, observable changes, in ensuring fulfillment of customer needs
An introduction to the cryptocurrency investment platform Binance Savings.Any kyc Account
Learn how to use Binance Savings to expand your bitcoin holdings. Discover how to maximize your earnings on one of the most reliable cryptocurrency exchange platforms, as well as how to earn interest on your cryptocurrency holdings and the various savings choices available.
Building Your Employer Brand with Social MediaLuanWise
Presented at The Global HR Summit, 6th June 2024
In this keynote, Luan Wise will provide invaluable insights to elevate your employer brand on social media platforms including LinkedIn, Facebook, Instagram, X (formerly Twitter) and TikTok. You'll learn how compelling content can authentically showcase your company culture, values, and employee experiences to support your talent acquisition and retention objectives. Additionally, you'll understand the power of employee advocacy to amplify reach and engagement – helping to position your organization as an employer of choice in today's competitive talent landscape.
Auditing study material for b.com final year students
McKinsey Survey: Chinese consumer sentiment during the coronavirus crisis
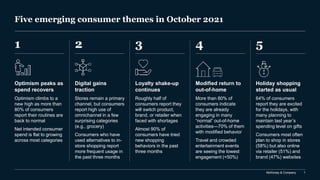
1. McKinsey & Company 1
Five emerging consumer themes in October 2021
1 2 5
4
3
Optimism peaks as
spend recovers
Optimism climbs to a
new high as more than
80% of consumers
report their routines are
back to normal
Net intended consumer
spend is flat to growing
across most categories
Digital gains
traction
Stores remain a primary
channel, but consumers
report high use of
omnichannel in a few
surprising categories
(e.g., grocery)
Consumers who have
used alternatives to in-
store shopping report
more frequent usage in
the past three months
Holiday shopping
started as usual
64% of consumers
report they are excited
for the holidays, with
many planning to
maintain last year’s
spending level on gifts
Consumers most often
plan to shop in stores
(58%) but also online
via retailer (51%) and
brand (47%) websites
Modified return to
out-of-home
More than 80% of
consumers indicate
they are already
engaging in many
“normal” out-of-home
activities—70% of them
with modified behavior
Travel and crowded
entertainment events
are seeing the lowest
engagement (<50%)
Loyalty shake-up
continues
Roughly half of
consumers report they
will switch product,
brand, or retailer when
faced with shortages
Almost 90% of
consumers have tried
new shopping
behaviors in the past
three months
2. McKinsey & Company 2
Confidence in own country’s economic recovery after COVID-191
% of respondents
15 14 13 17 17 22 21
32 22
41
49 52
50 50
46
65
67
74
44
37 35 33 33 32
14
1 5
Mixed The economy will be
impacted for 6–12 months or
longer and will stagnate or show
slow growth thereafter
Pessimistic: COVID-19 will
have lasting impact on the
economy and show regression
or fall into lengthy recession
Optimistic: The economy will
rebound within 2–3 months and
grow just as strong as or
stronger than before COVID-19
Consumers in China report high levels of optimism about their
country’s economic recovery
1. Q: What is your overall confidence level surrounding economic conditions after the coronavirus (COVID-19) crisis subsides (ie, once there is herd immunity)? Rated from 1 “very optimistic” to 6 “very pessimistic.” Bars may not sum to
100% due to rounding.
Optimism peaks as spend recovers | Current as of October 2021
US Germany
10/15–22
UK
10/15–22
10/9–15
Italy
10/15–22
France
10/15–22
Change in % optimistic vs
Feb survey, percentage points
3 3
13 14
18
Spain
10/15–22
16
India
10/18–25
3
Source: McKinsey & Company COVID-19 Consumer Pulse Survey
China
10/17–22
6 2
Japan
10/18–20
3. McKinsey & Company 3
Source: McKinsey & Company COVID-19 China Consumer Pulse Survey, 10/15–10/22/2021, n = 1187; 2/20–3/8/2021, n = 1,128; 12/11–12/15/2020, n = 1,199; 9/16–9/24/2020, n = 1,123; 6/15–6/21/2020, n =
1,249; 5/19–5/25/2020, n = 1,285; 5/5–5/11/2020, n = 1,257; 4/15–4/19/2020, n = 1,220; 4/8–4/13/2020, n = 1,216; 4/1–4/6/2020, n = 1,896; 3/25–3/30/2020, n = 1,048; 3/20–2/23/2020, n = 1,225; 2/21–
2/24/2020, n = 1,249, including Hubei province, sampled and weighted to match China’s general population 18–65 years old
5% 3% 5% 5% 4%
56 47
43 40 43
38 36 37
32
43
48
54 55 52
58 61 61
67
Apr 20202
Mar 20202
Feb 2020
1%
Sept 2020 Oct 2021
Feb 2021
Dec 2020
June 2020
May 20202
2% 1%
3%
Mixed: The economy will
be impacted for 6–12
months or longer and will
stagnate or show slow
growth thereafter
Pessimistic: COVID-19
will have lasting impact
on the economy and
show regression/fall into
lengthy recession
Optimistic: The economy
will rebound within 2–3
months and grow just as
strong as or stronger than
before COVID-19
Nearly seven in ten consumers in China report an optimistic view of
recovery—the highest level since the start of COVID-19
Confidence in own country’s economic recovery after COVID-19,1 % of respondents
1. Q: What is your overall confidence level surrounding economic conditions after the coronavirus (COVID-19) crisis subsides (ie, once there is herd immunity)? Rated from 1 “very optimistic” to 6 “very pessimistic.” Figures may not sum to
100% because of rounding.
2. Average of weekly pulse surveys shown for Mar–May 2020.
Optimism peaks as spend recovers | Current as of October 2021
4. McKinsey & Company 4
Medium- and high-income consumers report greater optimism
since February 2021
39
64
57
55
59
55
63 70
58
61
83
70
20
0
10
50
30
40
60
80
90
Sept 2020 Dec 2020 Feb 2021 Oct 2021
58
Low (<14k renminbi) Medium (14k–30k renminbi) High (>30k renminbi)
52
43 45
40
44
28
37
16
60
30
90
10
0
70
20
50
40
80
Sept 2020
35
40
36
Dec 2020
38
Feb 2021 Oct 2021
1. Q: What is your overall confidence level surrounding economic conditions after the coronavirus (COVID-19) crisis subsides (ie, once there is herd immunity)? Rated from 1 “very optimistic” to 6 “very pessimistic.”
Optimism by income Pessimism by income
Confidence in own country’s economic recovery after
COVID-19 by income level,1 % of respondents
Source: McKinsey & Company COVID-19 China Consumer Pulse Survey, 10/15–10/22/2021, n = 1,187; 2/20–3/8/2021, n = 1,128; 12/11–12/15/2020, n= 1,199; 9/16–9/24/2020, n = 1,123; 6/15–6/21/2020,
n = 1,249; 5/19–5/25/2020, including Hubei province, sampled and weighted to match China’s general population 18–65 years old
Optimism peaks as spend recovers | Current as of October 2021
5. McKinsey & Company 5
Relatively stable levels of optimism seen across age groups;
vaccinated consumers indicate more optimism than unvaccinated
Confidence in own country’s economic recovery after COVID-191
% of respondents
50
31
50
68
1
Vaccinated
0
Unvaccinated
1. Q: What is your overall confidence level surrounding economic conditions after the coronavirus (COVID-19) crisis subsides (ie, once there is herd immunity)? Rated from 1 “very optimistic” to 6 “very pessimistic.”
2. Baby boomers includes silent generation.
36
28
33
70
63
71
65
Gen X
29
1
Gen Z Millennials Baby boomers2
2
1 1
Optimistic Mixed Pessimistic
By generation By vaccination status
Source: McKinsey & Company COVID-19 China Consumer Pulse Survey, 10/15–10/22/2021, n = 1,187, including Hubei province, sampled and weighted to match China’s general population 18–65 years old
Optimism peaks as spend recovers | Current as of October 2021
6. McKinsey & Company 6
81
87 87
68
9
10 9
7
10
3 4
25
Millennials Gen X
Gen Z Baby boomers3
83 81
9
8
8 11
Vaccinated Unvaccinated
83
9
8
Overall
1. Q: When do you expect your routines will return to normal? Figures may not sum to 100% because of rounding.
2. Q: Which best describes your vaccination status?
3. Baby boomers includes silent generation.
In or after 2022 In 2021 Not affected/already returned
By generation By vaccination status2
Vaccinated and
unvaccinated
consumers
report similar
expectations for
when routines
will return to
normal
Overall, more than 90 percent of consumers indicate their routines
will be back to normal in 2021; older consumers are at 75 percent
Expectations for routines returning to normal,1 % of respondents
Source: McKinsey & Company COVID-19 China Consumer Pulse Survey, 10/15–10/22/2021, n = 1,187, including Hubei province, sampled and weighted to match China’s general population 18–65 years old
Optimism peaks as spend recovers | Current as of October 2021
7. McKinsey & Company 7
The impact of COVID-19 on household finances appears to be
stabilizing since February 2021
Reduced slightly/a lot About the same Increased slightly/a lot
Past 2 weeks
69
11
60
19
11
28
Past 2 weeks
26
63
11
Past 2 weeks
9
62
19
21
29
61
Past 2 weeks Past 2 weeks
26
66
8
Past 2 weeks
59
27
10
Past 2 weeks
63
Past 2 weeks
18
23 22
19
59
Past 2 weeks
1. Q: How has the coronavirus (COVID-19) crisis affected the following over the past 2 weeks? Figures may not sum to 100% because of rounding.
Household income Household spending Household savings
Dec 2020 Feb 2021 Oct 2021
COVID-19 impact on household finances,1 % of respondents
Source: McKinsey & Company COVID-19 China Consumer Pulse Survey, 10/15–10/22/2021, n = 1,187; 2/20–3/8/2021, n = 1,128; 12/11–12/15/2020, n = 1,199, including Hubei province, sampled and
weighted to match China’s general population 18–65 years old
Optimism peaks as spend recovers | Current as of October 2021
8. McKinsey & Company 8
Overall, 81 percent of consumers in China report their finances are
back to normal or were not affected
82 83 81
76
8 6 8
5
10 11 11
19
Baby boomers3
Gen Z Millennials Gen X
82
69
7
7
11
24
Vaccinated Unvaccinated
In or after 2022 In 2021 Not affected/already returned
81
7
12
Overall
1. Q: When do you expect your personal/household finances will return to normal? Figures may not sum to 100% because of rounding.
2. Q: Which best describes your vaccination status?
3. Baby boomers includes silent generation.
By generation By vaccination status2
Baby boomers and
the unvaccinated
are slightly more
likely than others
to be pessimistic:
19% and 24%,
respectively,
predict their
finances will return
to normal in 2022
or later
Expectations for personal/household finances
returning to normal,1 % of respondents
Source: McKinsey & Company COVID-19 China Consumer Pulse Survey, 10/15–10/22/2021, n = 1,187, including Hubei province, sampled and weighted to match China’s general population 18–65 years old
Optimism peaks as spend recovers | Current as of October 2021
9. McKinsey & Company 9
Consumers’ plans to splurge remain consistent with early 2021,
with about 50 percent reporting they plan to treat themselves
1. Q: With regard to products and services you will spend money on, do you plan to splurge/treat yourself in 2021? For example, are there categories of products or services you have spent less on over the last year and a half which you feel
you will spend more on now?
2. Baby boomers includes silent generation.
3. Small sample size (n < 25).
Plan on
splurging
49
48
Do not plan
on splurging
Oct 2021
52
Feb 2021
51
Millennials
Gen X
Baby boomers2
47%
N/A
60%
15
Gen Z 100%3
N/A
56%
N/A
51%
11
35%
−23
45%
N/A
62%
19
50%
0
42%
N/A
42%
12
41%
11
Generation
Respondents who plan/do not plan to
splurge/treat themselves in 20211
% of respondents
Low (<14k
renminbi)
Medium (14k–30k
renminbi)
High
(>30k renminbi)
>70%
<30% 50–70%
30–50% p.p. change from Feb 21
XX
Respondents who plan to splurge, by household income, %
Change < −10 pp
.
Source: McKinsey & Company COVID-19 China Consumer Pulse Survey, 10/15–10/22/2021, n = 1,187; 2/20–3/8/2021, n = 1,128, including Hubei province, sampled and weighted to match China’s general
population 18–65 years old
Optimism peaks as spend recovers | Current as of October 2021
10. McKinsey & Company 10
Among consumers intending to splurge, top spend categories are
fashion and out-of-home activities, such as travel and restaurants
Categories where consumers intend to treat themselves1
% of all respondents with intent to splurge
1. Q: You mentioned that you plan to splurge/treat yourself in next 6 months. Which categories do you intend to treat yourself to? Please select all that apply.
2. Baby boomers includes silent generation.
37
35
31
29
28
27
24
24
23
20
20
19
19
Electronics
Restaurants, dining out, bars
Apparel, shoes, accessories
Out-of-home entertainment
Travel, lodging, and vacation
Fitness, sports, and outdoors
Personal services
Household essentials
Items for your home
Pets
Makeup, skin-care products
Sports apparel and equipment
Outdoor living
Millennials Gen X
Gen Z
Baby
boomers2
41 41 35 28
26 37 38 35
23 33 38 26
24 33 31 23
24 30 23 33
27 31 25 19
16 29 28 19
32 19 24 25
20 24 24 25
Generational cut
20 19 24 20
28 17 22 16
22 17 19 20
26 12 17 29
Change from
Feb 2021,
percentage points
Between −3 and 3
< −3 >3
−3
−1
−1
−1
0
−2
−1
−15
1
N/A
N/A
N/A
N/A
Categories
Difference from all respondents,
percentage points
Source: McKinsey & Company COVID-19 China Consumer Pulse Survey, 10/15–10/22/2021, n = 1,187; 2/20–3/8/2021, n = 1,128, including Hubei province, sampled and weighted to match China’s general
population 18–65 years old
Optimism peaks as spend recovers | Current as of October 2021
11. McKinsey & Company 11
Consumers report mixed spending intentions across categories—
strongest for fashion, beauty, and at-home entertainment
Net intent > 1
Net intent −15 to 0
Net intent < −15
12
6
19
15
16
19
8
7
18
6
12
16
11
12
16
16
19
16
14
20
13
9
15
13
13
9
8
3
4
Footwear
Apparel
Restaurant
Sports and outdoors
Groceries
Food takeout and delivery
2
Tobacco products
Household supplies
Alcohol
3
Quick-service restaurant
Jewelry
10
Accessories
Toys and baby
5
4
Personal-care products
Skin care and makeup
3
5
Home and furniture
Home improvement, garden
Kitchen and dining
Decrease Stay the same Increase
11
7
9
12
8
7
6
11
16
12
16
21
25
28
15
17
9
24
19
13
12
16
8
15
7
13
11
9
Consumer electronics
10
3
Entertainment at home
Pet food and supplies
Pet-care services
5
Vehicles
Vitamins and OTC medicine
Books/magazines/newspapers
International flights
Out-of-home entertainment
Fitness and wellness
Personal-care services
Gasoline
5
3
Short-term home rentals
Travel by car
1
Cruises
Adventures and tours
4
Hotel/resort stays
10
Domestic flights
Net
intent2
3
15
7
5
5
10
−3
−1
−9
−3
−20
−14
−24
−6
−2
2
1. Q: Over the next 2–3 months, do you expect that you will spend more, about the same, or less money on these categories than usual? Figures may not sum to 100% because of rounding.
2. Net intent is calculated by subtracting the % of respondents stating they expect to decrease spending from the % of respondents stating they expect to increase spending.
Expected spending per category over the next 2–3 months vs. usual1
% of respondents who bought these categories at least once since 2019
−2
0
−1
−6
−3
−5
7
−2
−1
−3
−2
−3
−1
−2
0
−3
5
1
Change since
Feb 2021
Change since
Feb 2021
−2 −1
−3
−3
−2
−4
−3
−2
−4
0
−3
0
5
0
6
−1
7
−1
−38 20
Net
intent2
2
−1
5
9
−7
−4
−7
1
0
0
8
7
3
9
10
4
0
−8
Source: McKinsey & Company COVID-19 China Consumer Pulse Survey, 10/15–10/22/2021, n = 1,187, including Hubei province, sampled and weighted to match China’s general population 18–65 years old
Optimism peaks as spend recovers | Current as of October 2021
12. McKinsey & Company 12
−10
10
−20
0
20
30
Mar
2020
Apr
2020
Sept
2020
May
2020
June
2020
Dec
2020
Feb
2021
Oct
2021
Expected spending per category over the next 2–3 months vs usual1
Net intent2
Source: McKinsey & Company COVID-19 China Consumer Pulse Survey, 10/15–10/22/2021, n = 1,187; 2/20–3/8/2021, n = 1,128; 12/11–12/15/2020, n = 1,199; 9/16–9/24/2020, n = 1,123; 6/15–6/21/2020, n =
1,249; 5/19–5/25/2020, n = 1,285; 5/5–5/11/2020, n = 1,257; 4/15–4/19/2020, n = 1,220; 4/8–4/13/2020, n = 1,216; 4/1–4/6/2020, n = 1,896; 3/25–3/30/2020, n = 1,048; 3/20–2/23/2020, n = 1,225; 2/21–
2/24/2020, n = 1,249, including Hubei province, sampled and weighted to match China’s general population 18–65 years old
Spending net intent across categories is slightly below levels seen in
February 2021
Groceries
Household supplies
Fitness and wellness
Personal-care products
Skin care and makeup
Consumer electronics
Apparel
1. Q: Over the next 2–3 months, do you expect that you will spend more, about the same, or less money on these categories than usual? Figures may not sum to 100% because of rounding.
2. Net intent is calculated by subtracting the % of respondents stating they expect to decrease spending from the % of respondents stating they expect to increase spending.
Optimism peaks as spend recovers | Current as of October 2021
13. McKinsey & Company 13
1. Q: Which best described how you have researched the following categories over the last 3 months?
2. Q: Which best describes how you have purchased the following categories over the last 3 months?
82
69
58
55
48
42
42
38
37
32
29
24
23
20
15
15
20
17
34
35
45
49
46
55
36
40
28
56
55
75
3
11
25
11
17
13
9
16
8
32
31
48
21
25
10
Fitness and wellness services
Home decoration and furniture
Sports and outdoors equipment, supplies
Vitamins, supplements, OTC medicine
Kitchen and dining
Footwear
Jewelry
Apparel
Groceries
Personal-care products
Household supplies
Pet food and supplies
Skin care and makeup
Consumer electronics
Accessories
Research and purchase only in stores Omnichannel Research and purchase only online
Stores appear to be a predominant channel for several categories
but omnichannel shopping is well established in a few others
Digital gains traction | Current as of October 2021
Product searches1 and purchases2 by channel
% of respondents who purchased and searched in these categories in the last 3 months
Source: McKinsey & Company COVID-19 China Consumer Pulse Survey, 10/15–10/22/2021, n = 1,187; including Hubei province, sampled and weighted to match China’s general population 18–65 years old
14. McKinsey & Company 14
Consumers report social-media influence across categories,
including some reach into older generations
Digital gains traction | Current as of October 2021
1. Q: Think about the purchases you have made in the following categories over the past 3 months. Were you influenced towards a certain brand by a post on social media in the following categories?
2. Baby boomers includes silent generation.
3. Received no responses
36
33
32
32
31
30
27
26
25
25
20
18
16
14
13
11
Accessories
Food takeout or delivery
Kitchen and dining
Consumer electronics
Alcoholic beverages
Skin care and makeup
Groceries/food for home
Apparel
Personal-care products
Footwear
Household supplies
Vitamins, supplements, and OTC medicine
Books, magazines, newspapers
Tobacco products and smoking supplies
Toys and baby supplies
Pet food and supplies
Millennials Gen X
Gen Z
Baby
boomers2
55 22 21
38 36 34 03
43 37 24 23
42 39 20 18
29 30 36 28
32 35 27 22
36 30 15 15
42 29 20 11
37 27 19 16
Generational cut
55 18 18 17
24 27 15 9
24 23 18 7
35 19 8 7
Source: McKinsey & Company COVID-19 China Consumer Pulse Survey, 10/15–10/22/2021, n = 1,187, including Hubei province, sampled and weighted to match China’s general population 18–65 years old
Between −3 and 3
< −3 >3
Categories
Categories where respondents were influenced by social media1
% of all respondents who purchased in these categories in the last 3 months
16
35
43
20
13
9
6
15
4
13
13
18
11
Difference from all respondents,
percentage points
15. McKinsey & Company 15
23
83
75
3
77
9
61
13
60
20
15
65
13
53
70
10
9
22
17
70
27
9
70
12
22
69
19
13
22
7
69
27
24
22
8
67
67
11
14
18
12
21
Among consumers saying they have used alternatives to their
normal in-store shopping, most report continued or increased use
Digital gains traction | Current as of October 2021
Using less Using same Using more
Used a food delivery provider
Self-checkout or scan-and-go at a physical store
Buy online, pick up in store
Curbside delivery at a store
Purchased secondhand products online
Downloaded/used deal-finding plug-ins
Downloaded/used a new store/restaurant app
Purchased directly from social media
Used an app/website for same-day delivery
Used an app/website for delivery within 2 hours
Shopped at a store I had not shopped at before for groceries
Changed my primary grocery store
Cooked regularly for myself/my family
Personal care/grooming at home
64
15
21
19
11
16
16
20
13
11
10
21
32
25
Used or did in last 3 months
% of total respondents
1. Q: And have you used or done any of the following in the last 3 months? If yes, Q: Which best describes when you have done or used each of these items?
Source: McKinsey & Company COVID-19 China Consumer Pulse Survey, 10/15–10/22/2021, n = 1,187, including Hubei province, sampled and weighted to
match China’s general population 18–65 years old
Frequency of participating1
% of consumers who report participating in the activity in the last 3 months
16. McKinsey & Company 16
Across digital activities, more than four in ten consumers report
increased use, especially for socializing and children’s learning
Source: McKinsey & Company COVID-19 China Consumer Pulse Survey, 10/15–10/22/2021, n = 1,187, including Hubei province, sampled and weighted to match China’s general population 18–65 years old
Digital gains traction | Current as of October 2021
7
11
11
53
29
45
6 41
7
45
4
46
48
7
49
5
33 60
48
59
8
30
42
44
50
8
57
35
49
68
27
46
5
50
6
45
43
8
6
7 52
41
48
4
64
68
71
21
7
51
25
Frequency of participating1
% of respondents who say they have participated in the activity in the last 3 months
Wellness app
Digital workout bike or machine
Online personal training/fitness
Grocery delivery
Restaurant food delivery
Meal kit delivery
Online streaming
Video conferencing for professional use
Virtual hangouts and video chats for personal use
Telemedicine for physical health care
Telemedicine for mental health care
Playing online games
Watching online games
Remote learning for myself
Remote learning for my kids
Used social media
Used TikTok
18
13
16
74
56
16
70
28
85
6
18
27
8
24
21
86
41
Used or did in last 3 months
% of total respondents
Using less Using same Using more
1. Q: And have you used or done any of the following in the last 3 months? If yes, Q: Which best describes when you have done or used each of these items?
17. McKinsey & Company 17
When faced with stockouts, about one-third of consumers
substituted product, brand, or retailer to make a purchase
Loyalty shake-up continues | Current as of October 2021
1. Q: Over the last 3 months, have you wanted to buy something and not been able to purchase it because it was out of stock or otherwise not available?
2. Q: The most recent time this happened (when you wanted to buy something and it was not available), what did you do?
Source: McKinsey & Company COVID-19 China Consumer Pulse Survey 10/15–10/22/2021, n = 1,187, including Hubei province, sampled and weighted to match China’s general population 18–65 years old
39
61
Oct 2021
Could not purchase
at least 1 item
Able to purchase
all items
Respondents who planned to purchase
something but could not, due to unavailability1
% of respondents
19
21
11
14
35
Bought the product
at a different retailer
Bought a different brand or similar
product at a different retailer
Waited until product was available
at the same retailer
Bought a different product
at the same retailer
Did not buy anything
Consumer responses to stockouts2
% of respondents who could not make a planned purchase
18. McKinsey & Company 18
87
36
35
26
26
25
Different brand
Different retailer/store/website
Any new shopping behavior
New shopping method
New digital shopping method
New shopping method3
Loyalty shake-up continues | Current as of October 2021
Source: McKinsey & Company COVID-19 China Consumer Pulse Survey, 10/15–10/22/2021, n = 1,187, including Hubei province, sampled and weighted to match China’s general population 18–65
years old
Gen Z Millennials
86 88
32 39
29 38
27 27
19 28
25 26
Generational cut
All consumers
Between −3 and 3
< −3 >3
1. Q: Over the past 3 months, which of the following have you done? 34% replied “None of these.”
2. Baby boomers includes silent generation.
3. “New shopping method” includes curbside pickup and delivery apps.
Behaviors in past 3 months1
% of respondents
Almost 90 percent of consumers say they have tried out a new
shopping behavior in the past three months
Difference from all respondents,
percentage points
Gen X Baby boomers2
82 96
33 39
30 41
26 23
25 29
21 32
19. McKinsey & Company 19
Reason for trying a new brand since COVID-19 began1
% of respondents who tried a new brand since COVID-19 began
Loyalty shake-up continues | Current as of October 2021
1. Q: You mentioned you tried a new/different brand than what you normally buy. What were the main reasons that drove this decision? Select up to 3 relevant reasons. “Brand” includes different brand, new
private label/store brand. Overarching reason based on % of individual respondents responding to at least 1 reason in the group.
2. Baby boomers includes silent generation.
Source: McKinsey & Company COVID-19 China Consumer Pulse Survey, 10/15–10/22/2021, n = 1,187, including Hubei province, sampled and weighted to
match China’s general population 18–65 years old
Better prices, promotions
Better value
Supporting local businesses
Is more sustainable/better for the environment
11
Better shipping/delivery cost
Larger package sizes
The company treats its employees well
2
Shares my values
5
6
Wanted variety/a change from my normal routine
Wanted to treat myself
Better quality
2
Is natural/organic
Cleaner/has better hygiene measures
15
Products are in stock
Wanted to try a new product
Wanted to try a new brand I found
Is available where I’m shopping
27
23
17
25
23
9
29
21
23
24
17
Health/hygiene
Availability
Personal choice
Quality/organic
Novelty
Convenience
Purpose-driven 49
Value 51
43
39
24
8
5
17
Baby
boomers2
Gen Z and
millennials Gen X
28 31
24
26 16
23
18 15
15
3 2
1
26 18
27
14 15
15
12 11
9
8 16
4
32 20
29
22 15
25
23 21
23
23 21
23
28 26
15
18 7
23
4 13
5
3 3
1
3 10
6
All consumers
Between −3 and 3
< −3 >3
Consumers in China point to value and purpose-driven
considerations as primary drivers of brand switching
x Net % of respondents per category
Difference from all respondents,
percentage points
20. McKinsey & Company 20
Modified return to out-of-home | Current as of October 2021
84
66
85
81
41
Feb 2021
Oct 2021
Dec 2020
Sept 2020
June 2021
Overall
84
Vaccinated Unvaccinated
77
87
83
Gen Z Millennials Gen X Baby boomers3
80
88
High (>30k
renminbi)
Low (<14k
renminbi)
83
83
Medium (14k–
30k renminbi)
94
1. Q: Which best describes when you will regularly return to stores, restaurants, and other out-of-home activities? Chart shows those already participating in these activities.
2. Gen Z are people under 25 years old, millennials are 25–44 years old, Gen X are 45–54 years old, and baby boomers are 55 years old and above.
3. Baby boomers includes silent generation.
Source: McKinsey & Company COVID-19 China Consumer Pulse Survey, 10/15–10/22/2021, n = 1,187; 2/20–3/8/2021, n = 1,128; 12/11–12/15/2020, n = 1,199; 9/16–9/24/2020, n = 1,123; 6/15–6/21/2020,
n = 1,249, including Hubei province, sampled and weighted to match China’s general population 18–65 years old
By
generation2
By
vaccination
adoption
By income
88%
of baby boomers are
doing out-of-home
activities
94%
of higher-income
households are doing
out-of-home activities
84%
of people who are
unvaccinated are doing
out-of-home activities
Consumers engaging in ‘normal’ out-of-home activities,1 % of respondents
Over 80 percent of consumers are engaging in ‘normal’ out-of-home
activities, including 94 percent of higher-income households
21. McKinsey & Company 21
Out-of-home activities done in the past 2 weeks1
% of respondents who engaged in the activity at least once prior to COVID-19
Modified return to out-of-home | Current as of October 2021
Source: McKinsey & Company COVID-19 China Consumer Pulse Survey, 10/15–10/22/2021, n = 1,187, including Hubei province, sampled and weighted to
match China’s general population 18–65 years old
1. Q: Did you leave your house for the following activities over the past 2 weeks?
Social
Personal
care
Entertain-
ment 73
70
55
33
46
51
41
70
74
Visit a crowded outdoor public place
Go to a hair or nail salon
Go to the gym or fitness studio
Attend an indoor cultural event
Dine indoors at a restaurant or bar
Go out for family entertainment
Attend an outdoor event
Get together with family
Get together with friends
99
96
87
74
38
95
87
28
25
26
24
Travel more than 2 hours by car
Rent a short-term home
Work outside my home
Shop for groceries/necessities
Use a ride-sharing service
Shop for non-necessities
Travel by train
Travel by airplane
Go to a shopping mall
Use public transportation
Stay in a hotel
Work
Shopping
Transport/
travel
≥50%
<50%
Most consumers are returning to work, grocery shopping, and
public transport; majorities are trying other out-of-home activities
22. McKinsey & Company 22
1. Q: With the rise of the Delta variant of COVID-19, how, if at all, has your out-of-home behavior changed?
Source: McKinsey & Company COVID-19 China Consumer Pulse Survey, 10/15–10/22/2021, n = 1,187, including Hubei province, sampled and weighted to
match China’s general population 18–65 years old
14
22
35
61
61
57
24
16
7
1
Low (<14k
renminbi)
Medium (14k–
30k renminbi)
1
High (>30k
renminbi)
1
Modified return to out-of-home | Current as of October 2021
20
28
61
58
18
11
1
Vaccinated
3
Unvaccinated
20
61
18
1
Overall
Engage with
adjusted behavior
Engage less
Engage same as
before Delta
Engage more
By income By vaccination status
High-income
consumers are
likelier than other
segments to
report engaging in
out-of-home
activities the
same as or more
than before the
spread of the
Delta variant
Adjustments to out-of-home behavior due to prevalence of Delta variant,1 % of respondents
Roughly 80 percent of consumers have changed the way they
engage in out-of-home activities because of the Delta variant
23. McKinsey & Company 23
Modified return to out-of-home | Current as of October 2021
Source: McKinsey & Company COVID-19 China Consumer Pulse Survey, 10/15–10/22/2021, n = 1,187, including Hubei province, sampled and weighted to match China’s general population 18–65 years old
1. Q: Which best describes how you are engaging in each of these activities? Possible answers: “Not doing this at all”; “Doing this in the same way as pre-COVID-19, but less often”; “Doing this in a modified way vs. pre-COVID-19”;
“Doing this just as much and in the same way as I did pre-COVID-19.”
Work
Shopping
Transport/
travel
Social
Personal
care
Entertain-
ment
84
78
16
Visit a crowded outdoor public place
22
20
Dine indoors at a restaurant or bar
83
22
Go out for family entertainment
Attend an indoor cultural event 80
21
79
Attend an outdoor event
78
22
78
Go to a hair or nail salon
17
Go to the gym or fitness studio
25
75
Get together with family
20
80
Get together with friends
79
Use a ride-sharing service
Travel by airplane
18
Shop for non-necessities
84
Stay in a hotel
16
26
Work outside my home
21
Shop for groceries/necessities
74
14
86
78
Go to a shopping mall
20
80
Travel more than 2 hours by car
82
Use public transportation
78
19
81
22
82
20
80
Travel by train
22
18
Rent a short-term home
Doing less, doing in a modified way
Doing as much as and in the same way as pre-COVID-19
The share of consumers who have modified their out-of-home
behavior ranges from 74 to 86 percent, depending on the activity
Engagement in out-of-home activities,1 % of respondents
24. McKinsey & Company 24
Main life events done in the last 12 months as a result of COVID,1 % of respondents
Modified return to out-of-home | Current as of October 2021
Source: McKinsey & Company COVID-19 China Consumer Pulse Survey, 10/15–10/22/2021, n = 1,187; 2/20–3/8/2021, n = 1,128, including Hubei province, sampled and weighted to match China’s general
population 18–65 years old
Change >3 pp
49
11
17
12
9
15
5
5
5
4
Got a new pet at home (eg, dog, cat)
Worked more from home
Set up a specific work-from-home space
Decided to change jobs
Started homeschooling children3
Set up a gym at home
Renovated/remodeled my home
Moved into a bigger home
Sold a property
Moved into a smaller home
Bought a property
0
Work/study
change
Oct 2021
Pet adoption
House move
Home
renovation
Investments/
divestments
Total2
Change from
Feb 2021,
percentage points
0
2
4
0
1
3
2
1
−8
2
0
15
56
10
31
9
1. Q: Which of the following have you done in the last 12 months as a result of the COVID-19 crisis?
2. Total percentage of people who choose option(s) in the category.
3. Received 0 answers.
Though less consumers report working from home since February,
investing in home environments continues during COVID-19
25. McKinsey & Company 25
Two-thirds of consumers are excited about the 2021 holiday
shopping season; higher-income consumers are excited most often
Holiday shopping started as usual | Current as of October 2021
18 22 22 21
13
15 16 13
68 63 62 65
Baby
boomers2
Gen X
Gen Z Millennials
Source: McKinsey & Company COVID-19 China Consumer Pulse Survey, 10/15–10/22/2021, n = 1,187, including Hubei province, sampled and weighted to match China’s general population 18–65 years old
1. Q: Which best describes your general attitude toward the holiday shopping season? Selected from "Anxious," "Stressed," "Neutral," "Eager,“ "Excited," and "Other."
2. Baby boomers includes silent generation.
21
15
64
Overall
Excited/
eager
Neutral
Stressed/
anxious
Consumer attitudes toward the 2021 holiday shopping season1
% of respondents
By annual income By generation
30
19
13
16
14
12
54
67
75
Low (<14k
renminbi)
Medium (14k–
30k renminbi)
High (>30k
renminbi)
26. McKinsey & Company 26
Many consumers are planning to spend more on travel this year
than in 2020
Holiday shopping started as usual | Current as of October 2021
Gifts (for myself
and others)
35
26
45
Redecorate my
home, put out
seasonal items
20
5
38
Personal travel Out-of-
home eating
44
18
Family travel
17
70
79
4
24
6
66
8
45
Large household
appliances
50
1. Q: If you compare the upcoming holidays [2021] with the ones last year, how much do you plan to change your spending level in the following categories?
Will spend more Will spend about the same Will spend less
2021 holiday spending plans vs spending in 20201
% of respondents who spent on the category during the holidays in 2020
While travel dominates
spending intentions,
26% say they intend to
spend more on
decorating than last
year, and 24% intend to
spend more on gifts
Source: McKinsey & Company COVID-19 China Consumer Pulse Survey, 10/15–10/22/2021, n = 1,187, including Hubei province, sampled and weighted to match China’s general population 18–65 years old
27. McKinsey & Company 27
Across ages, consumers intend to combine store and online
browsing for holiday purchases
Holiday shopping started as usual | Current as of October 2021
58
51
47
46
42
27
25
11
4
Browsing in pop-up stores
Browsing in stores
Brand websites
Advertisements on TV or streaming media
Retailer websites
Offline advertisements2
Browsing through holiday markets
Social media
Emails from relevant retailers
Generational cut
Gen Z
59
39
Millennials
69
38
Gen X
51
46
Baby
boomers3
42
2 3 8 3
30 23 26 23
19 26 32
59 50 50 46
32
48
45 42 51 56
10 7 13 17
46 52 43 34
Research channels
Between −3 and 3
< −3 >3
Difference from all respondents, percentage points
1. Q: Which channels are you planning to use to get new ideas and do research for your holiday shopping? Please select top 3.
2. Offline advertisements include catalogs, fliers, magazines, and newspaper advertisements.
3. Baby boomers includes silent generation.
Consumer research plans by channel for holiday 20211
% of all respondents
Source: McKinsey & Company COVID-19 China Consumer Pulse Survey, 10/15–10/22/2021, n = 1,187, including Hubei province, sampled and weighted to match China’s general population 18–65 years old
28. McKinsey & Company 28
Consumers expect social media to have a strong influence on holiday
purchase decisions
Holiday shopping started as usual | Current as of October 2021
1. Q: How much influence do you expect social media to have on your holiday purchase decisions this season? Selected from "Significant influence," "Some influence," and "Will not influence."
2. Q: Which channels do you think will influence your holiday purchase decisions? Asked of respondents indicating social media will influence their 2021 holiday purchases.
3. Baby boomers includes silent generation.
Expected influence of social media on 2021 holiday
purchases,1 % of respondents
18
18
15
16
33
82
82
85
84
67
Overall
Gen Z
Millennials
Gen X
Baby boomers3
Will influence
Will not influence
Most influential social-media channels2
% of respondents who expect social-media influence
54
58
62
56
58
Facebook
39
37
30
24
34
YouTube
34
27
27
30
38
Instagram
60
55
31
56
44
TikTok
Top platforms by %
Source: McKinsey & Company COVID-19 China Consumer Pulse Survey, 10/15–10/22/2021, n = 1,187, including Hubei province, sampled and weighted to match China’s general population 18–65 years old
29. McKinsey & Company 29
Consumers plan to increase travel for the holidays in 2021
Holiday shopping started as usual | Current as of October 2021
1. Q: What best describes what you expect to do for the holidays this year [2021]? Figures may not sum to 100% because of rounding.
2. Q: What best describes your holiday get-togethers last year [2020]? Figures may not sum to 100% because of rounding.
3. Baby boomers includes silent generation.
11
33
39
17
Will travel to and attend a large get-
together with family and friends
Do not plan to travel and will limit
getting together to immediate family only
Will travel to a limited family get-together
Will not travel but will have a family/friends
get-together outside my immediate family
Split by annual income Split by generation
15 9 10
5 14 9 21 10
27 35 37 25 30 38
13 42
37 41 29 34 43 38
−17 39
22 15 13 26 18 14
−1 9
Medium
(14k–30k
renminbi)
Low
(<14k
renminbi)
High
(>30k
renminbi) Millennials Gen X
Gen Z
Baby
boomers3
Change
from 2020,2
percentage
points
Holiday plans in 20211
% of respondents
< −3 Between −3 and 3 >3
Difference from all respondents, percentage points
Source: McKinsey & Company COVID-19 China Consumer Pulse Survey, 10/15–10/22/2021, n = 1,187, including Hubei province, sampled and weighted to
match China’s general population 18–65 years old
30. McKinsey & Company 30
Consumers indicate they expect to attend the same number of
holiday events as they did pre-COVID-19
Holiday shopping started as usual | Current as of October 2021
1. Q: About how many in-person holiday-related events do you attend in a typical year without COVID-19?
2. Q: Compared with the number of in-person events you attended pre-COVID-19, about how many in-person events do you expect to attend over the holidays this coming year [2021]?
3. Baby boomers includes silent generation.
8.7
10.8
4.9
Family gatherings
Parties with friends
Work-related gatherings
Event type
Between −1 and 1
< −1 >1
Millennials Gen X
Gen Z
Baby
boomers3
Generational cut
8.8 8.7 8.6 8.8
10.8 10.7 11.1 10.6
4.7 4.8 5.2 4.8
Difference in
number vs
pre-COVID-19
0
0
0
Holiday-related events consumers attended1 or expect to attend2 in 2021
Average number of events
Difference from all respondents, percentage points
Source: McKinsey & Company COVID-19 China Consumer Pulse Survey, 10/15–10/22/2021, n = 1,187, including Hubei province, sampled and weighted to
match China’s general population 18–65 years old
31. McKinsey & Company 31
1. Q: Do you plan to shop for the holidays earlier or later in 2021 compared with last year’s holiday season [2020]? Possible answers: “significantly earlier”; “slightly
earlier”; “starting at about the same time”; “slightly later”; “significantly later”; “I am not planning to do any holiday season shopping”; 1% of Chinese consumers
surveyed indicated they do not plan to shop for the holidays this year. Figures may not sum to 100% because of rounding.
2. Income brackets: low, <14,000 renminbi; medium, 14,000–30,000 renminbi; and high, >30,000 renminbi.
3. Baby boomers includes silent generation.
4. Q: What are the primary reasons you plan to shop earlier for the holidays in 2021?
13
77
11
10
82
Medium
Low
7
20
63
17
High
Overall
10
76
14
Earlier
About the
same time
Later
Source: McKinsey & Company COVID-19 China Consumer Pulse Survey, 10/15–10/22/2021, n = 1,187, including Hubei province, sampled and weighted to match China’s general population 18–65 years old
Overall By income2 By generation
9
Gen Z
11
18
Gen X
77
5
16
74
Millennials
8
10
77
13
81
Baby
boomers3
Over 70 percent of consumers will start holiday shopping at about
the same time as in 2020
Holiday shopping started as usual | Current as of October 2021
Main reasons for consumers
to start shopping earlier4
% of respondents who plan to shop
earlier in 2021
34%
33%
5%
48%
Holiday shopping start vs last year1
% of respondents
of Chinese consumers
are concerned about
availability
are concerned about
shipping lead time
want to do something
fun right now
are concerned about
unexpected challenges
due to COVID-19
32. McKinsey & Company 32
Of the four in ten consumers who say they started shopping before
November, none report completing more than half.
Holiday shopping started as usual | Current as of October 2021
Source: McKinsey & Company COVID-19 China Consumer Pulse Survey, 10/15–10/22/2021, n = 1,187, including Hubei province, sampled and weighted to
match China’s general population 18–65 years old
39
34
23
4
In November
I already started
In December
In January
0
49
51
50–100% of my shopping
25–50% of my shopping
1–24% of my shopping
1. Q: When do you plan to start your shopping for the seasonal holidays this year? Excludes 1% of Chinese consumers who indicated they do not plan to shop for the holidays this year; Figures may not sum to 100% because of rounding.
2. Q: How much of your holiday shopping have you done so far? Asked of respondents who indicated they had already started.
Timing of holiday shopping, 20211
% of respondents
Status of holiday shopping, 20212
% of respondents who already started
33. McKinsey & Company 33
Almost 70 percent of consumers plan to shop at different retailers
this year, with most seeking better value
Holiday shopping started as usual | Current as of October 2021
Source: McKinsey & Company COVID-19 China Consumer Pulse Survey, 10/15–10/22/2021, n = 1,187, including Hubei province, sampled and weighted to
match China’s general population 18–65 years old
39
29
13
Check more things
off my list at once
More value for money
Safety
88
69
29
15
10
2
Shop more online
Shop earlier
Any change of shopping behavior
Shop at a different place
Shop more in person
Shop more at local/independent stores
1. Q: Please select all the ways you anticipate your holiday shopping might be different from last year. Figures may not sum to 100% because of rounding.
Anticipated different holiday shopping behaviors1
% of respondents who say they will shop differently than last year
Reasons to change place to shop during holiday
season
% of respondents who say they will do holiday shopping this year
34. McKinsey & Company 34
Consumers plan to shop more in person this year
Holiday shopping started as usual | Current as of October 2021
29
10
2
Shop more in person
Shop more online
Shop earlier
Income cut
Gen Z Millennials Gen X
Baby
boomers2
Shopping behaviors
Between −3 and 3
< −3 >3
Difference from all respondents, percentage points
1. Q: Please select all the ways you anticipate your holiday shopping might be different compared with last year. Figures may not sum to 100% because of rounding.
2. Baby boomers includes silent generation.
Anticipated change in shopping behavior for holiday
2021,1 % of respondents Generational cut
31 33
18 30
20 9 8 3
3 2 2 2
25 30 30
17 7 5
2 2 4
Medium
(14k–30k
renminbi)
Low
(<14k
renminbi)
High
(>30k
renminbi)
Source: McKinsey & Company COVID-19 China Consumer Pulse Survey, 10/15–10/22/2021, n = 1,187, including Hubei province, sampled and weighted to match China’s
general population 18–65 years old
35. McKinsey & Company 35
Availability and convenience are the top drivers of consumer
decisions about where to shop for the holidays
Holiday shopping started as usual | Current as of October 2021
Source: McKinsey & Company COVID-19 China Consumer Pulse Survey, 10/15–10/22/2021, n = 1,187, including Hubei province, sampled and weighted to
match China’s general population 18–65 years old
18
29
20
36
20
29
24
43
21
15
4
8
Supporting local businesses
Better prices, promotions
Ability to see products in person
Product availability
Ability to purchase most gifts from 1 place
Convenience
Better quality
Easy to shop across store and online
Better shipping, delivery costs
Unique items offered
Company treating its employees well
Cleaner, better hygiene measures
Generational cut
Gen Z Millennials Gen X
28
22 21 26
26
14 20 23
18
19 16 19
24
39 28 26
22
23 25 24
8
5 3 3
9
7 7 9
20
16 22 23
40
48 44 40
17
12 16 16
Baby
boomers2
10
23 24 20
40 36 33 37
1. Q: Please tell us what your primary considerations will be when deciding where to shop. Please select up to 3.
2. Baby boomers includes traditional or silent generation.
Between −3 and 3
< −3 >3
Primary considerations when deciding where to shop1
% of respondents
Availability
Value
Convenience
Quality
Purpose-driven
Health/hygiene
Uniqueness
50
45
x Net % of respondents per category
52
43
21
20
8
Difference from all respondents, percentage points