McKinsey Survey: Spanish consumer sentiment during the coronavirus crisis
•
2 likes•2,806 views

Spanish consumers’ overall economic pessimism has decreased since November, but caution about engaging in out-of-home activities continues. These exhibits are based on survey data collected in Spain from February 23–27, 2021. Check back for regular updates on Spanish consumer sentiments, behaviors, income, spending, and expectations.

Recommended
Recommended
More Related Content
What's hot
What's hot (20)
Similar to McKinsey Survey: Spanish consumer sentiment during the coronavirus crisis
Similar to McKinsey Survey: Spanish consumer sentiment during the coronavirus crisis (19)
More from McKinsey on Marketing & Sales
More from McKinsey on Marketing & Sales (20)
Recently uploaded
Recently uploaded (20)
McKinsey Survey: Spanish consumer sentiment during the coronavirus crisis
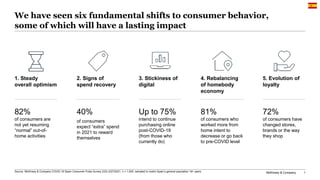
- 1. McKinsey & Company 1 We have seen six fundamental shifts to consumer behavior, some of which will have a lasting impact Source: McKinsey & Company COVID-19 Spain Consumer Pulse Survey 2/23–2/27/2021, n = 1,005, sampled to match Spain’s general population 18+ years 82% of consumers are not yet resuming “normal” out-of- home activities 1. Steady overall optimism 2. Signs of spend recovery 40% of consumers expect “extra” spend in 2021 to reward themselves Up to 75% intend to continue purchasing online post-COVID-19 (from those who currently do) 3. Stickiness of digital 81% of consumers who worked more from home intent to decrease or go back to pre-COVID level 4. Rebalancing of homebody economy 72% of consumers have changed stores, brands or the way they shop 5. Evolution of loyalty
- 2. McKinsey & Company 2 Spain is among the most pessimistic countries in terms of consumer confidence in the country’s economic recovery Steady overall optimism Confidence in own country’s economic recovery after COVID-191 % of respondents Source: McKinsey & Company COVID-19 Consumer Pulse Survey 1. Q: What is your overall confidence level surrounding economic conditions after the coronavirus (COVID-19) crisis subsides (i.e., once there is herd immunity)? Rated from 1 “very optimistic” to 6 “very pessimistic.” Bars may not sum to 100% due to rounding. 10 14 14 18 17 32 21 20 25 37 43 45 46 53 59 50 62 67 71 61 47 41 39 30 24 18 17 12 4 2 31 52 17 ‘Optimistic’ change vs November survey, percentage point 0 +9 +3 +6 +13 +3 +9 +7 +4 +5 +1 Mixed The economy will be impacted for 6–12 months or longer and will stagnate or show slow growth thereafter Pessimistic: COVID-19 will have lasting impact on the economy and show regression/ fall into lengthy recession Optimistic: The economy will rebound within 2–3 months and grow just as strong as or stronger than before COVID-19 Italy 2/23–27 France 2/23–27 Japan 2/24–27 US 2/18–22 India 2/20–3/3 China 2/20–3/8 Mexico 2/20–3/2 Brazil 2/20–3/1 Germany 2/23–27 UK 2/23–27 Spain 2/23–27
- 3. McKinsey & Company 3 Confidence in own country’s economic recovery after COVID-191 % of respondents Source: McKinsey & Company COVID-19 Spain Consumer Pulse Survey 2/23–2/27/2021, n = 1,005; 11/9–11/16/2020, n = 1,014; 9/24–9/27/2020, n = 1,054; 6/18–6/21/2020, n = 1,007; 5/21–5/24/2020, n = 1,010; 4/30–5/3/2020, n = 1,004; 4/16–4/19/2020, n = 1,006; 4/2–4/5/2020, n = 1,006; 3/26–3/29/2020, n = 1,003; 3/20–3/22/2020, n = 1,002, sampled to match Spain’s general population 18+ years Mixed: The economy will be impacted for 6–12 months or longer and will stagnate or show slow growth thereafter Pessimistic: COVID-19 will have lasting impact on the economy and show regression / fall into lengthy recession Optimistic: The economy will rebound within 2–3 months and grow just as strong as or stronger than before COVID-19 However, overall pessimism has decreased as compared to earlier in the pandemic, and is at its lowest level since March 2020 1. Q: What is your overall confidence level surrounding economic conditions after the coronavirus (COVID-19) crisis subsides (i.e., once there is herd immunity)? Rated from 1 “very optimistic” to 6 “very pessimistic.” Figures may not sum to 100% because of rounding. Steady overall optimism 36% 40% 40% 41% 42% 39% 39% 42% 40% 31% 45% 46% 45% 47% 43% 47% 48% 47% 47% 52% 19% 14% 15% 12% 15% 13% 13% 11% 14% 17% Feb 24-26 Mar 20-22 Mar 26-29 Apr 2-5 Apr 30-May 3 Apr 16-19 Sep 24-27 Jun 18-21 May 21-24 Nov 9-16 Spain 2020 2021
- 4. McKinsey & Company 4 Household income1 % of respondents Household spending1 % of respondents Household savings1 % of respondents Fewer households are experiencing reduced income, spending, and savings now than earlier in the pandemic Source: McKinsey & Company COVID-19 Spain Consumer Pulse Survey 2/23–2/27/2021, n = 1,005; 11/9–11/16/2020, n = 1,014; 9/24–9/27/2020, n = 1,054, sampled to match the Spain’s general population 18+ years 1. Q: How has the coronavirus (COVID-19) crisis affected your (household) income, overall household spending, and amount of income put away as savings over the past two weeks? Figures may not sum to 100% because of rounding. Steady overall optimism Reduce slightly / reduce a lot About the same Increase slightly / increase a lot Past 2 weeks 3% 58% 58% 3% Past 2 weeks 39% 39% 3% 62% 35% Past 2 weeks 8% 12% 42% 9% 50% Past 2 weeks 41% 47% Past 2 weeks 55% 36% Past 2 weeks Past 2 weeks 49% 24% 49% 21% 27% Past 2 weeks 30% 22% 50% 28% Past 2 weeks Sept 18–24 Nov 9–16 Feb 23–27 Sept 18–24 Nov 9–16 Sept 18–24 Nov 9–16 Feb 23–27 Feb 23–27
- 5. McKinsey & Company 5 Consumers engaging in “normal” out-of-home activities1 % of respondents Spanish consumers’ engagement in ‘normal’ out-of-home activities is stable since November 18 18 28 20 11 May 24 Feb 23 Nov 9 Sep 24 Jun 21 Overall Vaccinated3 Interested 25% Cautious Unlikely 25% 15% 21% 20% 16% Gen Z Millennials Gen X 16% Baby boomers 22% 17% Low (<€25,000) Medium (€25K–€49K) High (>€50,000) 17% 18% 1. Q: Which best describes when you will regularly return to stores, restaurants, and other out-of-home activities? Chart shows those already participating in these activities. 2. Members of Gen Z were born from 1997–2012, millennials from 1981–1996, Gen X from 1965–1980, and baby boomers from 1946–1964. The traditionalist/silent generation is not included due to a low sample size. Steady overall optimism ~25% of vaccinated people are doing out-of- home activities ~22% of Gen Z consumers are doing out-of- home activities By generation2 By vaccination adoption By income ~17% of households are doing out-of-home activities no matter their income Source: McKinsey & Company COVID-19 Spain Consumer Pulse Survey 2/23–2/27/2021, n = 1,005; 11/9–11/16/2020, n = 1,014; 9/24–9/27/2020, n = 1,054; 6/18–6/21/2020, n = 1,007; 5/21–5/24/2020, n = 1,010, sampled to match Spain’s general population 18+ years.
- 6. McKinsey & Company 6 Consumers will return to out-of-home activities once1 … % of respondents awaiting each milestone before engaging Most Spanish are waiting for high vaccination coverage and the lifting of restrictions before reengaging with out-of-home activities 28 27 26 18 Government lifts restrictions Government lifts restrictions + other requirements COVID-19 no longer spreading Vaccination coverage 82% of people are not currently engaging in “normal” out-of- home activities Source: McKinsey & Company COVID-19 US Consumer Pulse Survey 2/23–2/27/2021, n = 1,005, sampled to match the Spain’s general population 18+ years Vaccination coverage Government lifts restrictions and… 1. Q: Which best describes when you will regularly return to stores, restaurants, and other out-of-home activities? Chart rebased to exclude those already participating in these activities and those who do not deem any of these items important. Figures may not sum to 100% because of rounding. Steady overall optimism 8% Stores, restaurants, and other indoor places start taking safety measures 15% Medical authorities deem safe 4% I see other people returning 14% Vaccine is widely distributed 9% I have been vaccinated 3% Family member(s) vaccinated
- 7. McKinsey & Company 7 As COVID-19 drags on, Spanish consumers are increasingly eager to return to their routines, and doing more out-of-home activities Source: McKinsey & Company COVID-19 Spain Consumer Pulse Survey 2/23–2/27/2021, n = 1,005; 11/9–11/16/2020, n = 1,014,sampled to match the Spain’s general population 18+ years 28% 50% 53% Get together with family Go to a shopping mall Travel more than 2 hrs by car Get together with friends Dine at a restaurant or bar 17% 19% Travel by airplane 17% Stay in a hotel Attend an outdoor event 15% 14% Visit a crowded outdoor public place 13% Attend an indoor cultural event 10% 1 Change since November (percentage point) 1 -7 -3 -84 N/A3 N/A3 -8 N/A3 Top activities eager to get back to2 % of respondents for whom the activity is in their top 3 choices 0 61% shop in-person for groceries, necessities 33% go to a shopping mall Most prevalent activities consumers are engaging in1 % of respondents who did activity within last 2 weeks 1. Q: Did you leave your house for the following activities over the past two weeks? Top 2 most often-selected activities. 2. 2. Q: Which of the following activities are you most eager to get back to on a regular basis? Please select the top 3 activities you miss the most. 3. Data not available or insufficient sample (n = < 50) in November 2020 survey. 4. Option from November survey was “Attend a concert, sporting event, movies, etc.” Steady overall optimism
- 8. McKinsey & Company 8 Spanish consumers say they will prioritize relatives, shopping, and restaurants once COVID-19 subsides Out-of-home activities done in the past two weeks1 % of respondents 21% 3% 7% 4% 25% 21% 29% 31% 22% Visit a crowded outdoor public place Attend an outdoor event Go to the gym or fitness studio Attend an indoor cultural event Dine at a restaurant or bar Go out for family entertainment Go to a hair or nail salon Get together with family Get together with friends 53% 89% 56% 41% 9% 41% 11% 3% 12% 3% 3% Travel by airplane Work outside my home Shop for groceries/necessities Use public transportation Shop for non-necessities Go to a shopping mall Use a ride-sharing service Travel more than 2 hrs by car Travel by train Stay in a hotel Rent a short-term home +28 +37 +57 +52 +32 +6 +31 +27 +40 +44 +23 +24 +36 +33 +54 +51 +42 +17 +66 +57 Steady overall optimism Source: McKinsey & Company COVID-19 Spain Consumer Pulse Survey 2/23–2/27/2021, n = 1,005, sampled to match the Spain’s general population 18+ years 1. Q: Did you leave your house for the following activities over the past two weeks? The responder base is comprised only those who have answered as having done the activity at least once per year prior to COVID-19. 2. Q: Once the coronavirus (COVID-19) crisis subsides (i.e., once there is herd immunity), how do you think the amount of time you spend doing the following activities will change relative to how often you did them before COVID-19 began? Possible answers: “I will not do this at all”; “I will do this less often than I did before COVID-19 started”; “I will do this about the same as I did before COVID-19”; “I will do this more than I did before COVID-19.” Net intent is calculated from adding % of respondents stating they will do more or about the same, and subtracting % of respondents stating they will do less or not at all. Below 0 21 to 50 Net intent2 Above 50 0 to 20 Net intent2 post- COVID-192 Net intent post- COVID-192 Work Shopping Transport/ Travel Social Personal care Entertain -ment
- 9. McKinsey & Company 9 Consumers report negative net spending intent overall, but discretionary categories have increased since November Net intent: Above +1 Net intent: -15 to 0 Net intent: Below -15 Source: McKinsey & Company COVID-19 Spain Consumer Pulse Survey 2/23–2/27/2021, n = 1,005; 11/9–11/16/2020, n = 1,014, sampled to match the Spain’s general population 18+ years -5 0 +4 +3 +15 +27 +3 +7 +8 -30 -3 0 +5 +5 -26 N/A3 N/A3 N/A3 N/A3 +7 -4 +3 -4 +18 -5 +8 +16 +12 N/A3 +19 +16 +18 +22 +6 +14 +10 -54 7 -41 -2 -47 -11 -15 -27 -36 -43 -46 -41 -52 -2 -25 -36 -31 -17 28 12 30 46 63 31 42 33 38 49 64 47 68 60 79 72 73 8 12 8 9 9 15 Travel by car 12 7 10 Pet food & supplies Vitamins & OTC medicine 7 Books/magazines/newspapers Entertainment at home 7 Hotel/resort stays Consumer electronics Cruises4 Out-of-home entertainment 5 4 Pet-care services Fitness & wellness 6 Personal-care services Gasoline 7 4 Vehicles Short-term home rentals Adventures & tours 3 International flights 5 Domestic flights 6 -5 0 -22 -39 -56 -28 -30 -27 -29 -58 -39 -53 -53 -76 -67 -69 -20 -42 1. Q: Over the next two weeks, do you expect that you will spend more, about the same, or less money on these categories than usual? Figures may not sum to 100% because of rounding. 2. Net intent is calculated by subtracting the % of respondents stating they expect to decrease spending from the % of respondents stating they expect to increase spending. 3. Data not available or insufficient sample (n = < 50) in November 2020 survey. 18 30 35 45 53 50 47 59 56 48 9 31 54 46 41 24 9 15 7 5 Alcoholic beverages Groceries Footwear 13 Tobacco products Food takeout & delivery 5 8 Toys & baby 8 Quick-service restaurant 6 11 Restaurant 5 11 Apparel 4 Personal-care products Jewelry 4 Accessories 7 Household supplies 6 7 Skin care & makeup Home & furniture 10 Sports & outdoors 10 Home improvement & garden 7 Kitchen & dining Stay the same Decrease Increase Expected spending per category over the next two weeks compared to usual1 % of respondents Net intent2 Net intent2 Change since Nov 2020 Change since Nov 2020 Signs of spend recovery
- 10. McKinsey & Company 10 Expected spending per category over the next two weeks compared to usual1 Net intent2 Source: McKinsey & Company COVID-19 Spain Consumer Pulse Survey 2/23–2/27/2021, n = 1,005; 11/9–11/16/2020, n = 1,014; 9/24–9/27/2020, n = 1,054; 6/18–6/21/2020, n = 1,007; 5/21–5/24/2020, n = 1,010; 4/30–5/3/2020, n = 1,004; 4/16–4/19/2020, n = 1,006; 4/2–4/5/2020, n = 1,006; 3/26–3/29/2020, n = 1,003; 3/20–3/22/2020, n = 1,002, sampled to match Spain’s general population 18+ years Net spending intent in discretionary categories is increasing again after last fall’s slump, especially for travel and restaurants 1. Q: Over the next two weeks, do you expect that you will spend more, about the same, or less money on these categories than usual? Figures may not sum to 100% because of rounding. 2. Net intent is calculated by subtracting the % of respondents stating they expect to decrease spending from the % of respondents stating they expect to increase spending. -40 -50 -90 -70 -80 -20 -60 0 -30 -10 10 20 Nov 16 Feb 27 May 24 May 3 Apr 19 Mar 22 Mar 29 Apr 5 Jun 21 Sept 27 Groceries Personal-care products Fitness & wellness Skin care & makeup Consumer electronics Apparel Meal at restaurant Out-of-home entertainment Domestic flights Signs of spend recovery
- 11. McKinsey & Company 11 Consumers say they intend to splurge on themselves soon, with high-income Gen Z and millennials intending to spend the most Expected leisure spend in 20211 % of respondents who plan to splurge or treat themselves ~40% Plan to splurge or treat themselves >59% <30% 50–59% 30–49% Gen Z Millennials Gen X Generation2 Mid (€25K–€50K/year) 49% 57% 27% 36% 45% 50% 46% 52% 60% Low (<€25K/year) High (>€50K/year) Baby boomers Household income 31% 29% 46% 1. Q: With regard to products and services you will spend money on, do you plan to splurge/treat yourself in 2021? Figures may not sum to 100% because of rounding. 2. Members of Gen Z were born from 1997–2012, millennials from 1981–1996, Gen X from 1965–1980, and baby boomers from 1946–1964. The traditionalist/silent generation is not included due to a low sample size. Source: McKinsey & Company COVID-19 Spain Consumer Pulse Survey 2/23–2/27/2021, n = 1,005, sampled to match Spain’s general population 18+ years Signs of spend recovery
- 12. McKinsey & Company 12 A spike in consumer spending on travel, restaurants, and apparel is expected, but will be spread out over time 65 45 35 26 25 25 15 14 11 Items for your home Travel, lodging, & vacation Apparel, shoes & accessories Restaurants, dining out, bars Beauty & personal care Household essentials Electronics Out-of-home entertainment Fitness, sports, & outdoors 7 19 41 37 43 11 45 25 31 21 13 13 16 12 10 15 12 10 7 8 5 8 8 7 7 16 7 66 60 41 39 37 72 33 47 52 Anytime Govt restrictions lifted/COVID-19 stops spreading I am vaccinated Family is vaccinated Signs of spend recovery Source: McKinsey & Company COVID-19 Spain Consumer Pulse Survey 2/23–2/27/2021, n = 1,005, sampled to match Spain’s general population 18+ years Expected leisure categories on which people plan to splurge or treat themselves in 20211 % of respondents who plan to splurge or treat themselves Trigger for when people plan to splurge or treat themselves2 % of respondents who plan to splurge or treat themselves on that category 1. Q: You mentioned that you plan to splurge/treat yourself in 2021. which categories do you intent to treat yourself to? Please select all that apply. 2. Q: Which best describes when you will most likely splurge/treat yourself? Figures may not sum to 100% because of rounding.
- 13. McKinsey & Company 13 More than 60 percent of splurge spend will come from money that consumers have on hand, especially in older generations 61% 62% 61% 78% 65% 43% 35% 16% 22% 28% 47% 44% 43% 31% 41% 13% 11% 5% 11% 10% Signs of spend recovery Source: McKinsey & Company COVID-19 Spain Consumer Pulse Survey 2/23–2/27/2021, n = 1,005, sampled to match Spain’s general population 18+ years 1. Q: For your future splurge on previously selected items, how do you intend to pay? Please select the answer that best represents your situation. Figures may not sum to 100% because of rounding and because respondents who answered “other” are not displayed here. 2. Members of Gen Z were born from 1997–2012, millennials from 1981–1996, Gen X from 1965–1980, and baby boomers from 1946–1964. The traditionalist/silent generation is not included due to a low sample size. Financing source of splurge spend1 % average of respondents who plan to spend, by generation >50% <20% 36–50% 21–35% Gen Z Millennials Gen X Baby boomers From available budget By reducing spend elsewhere From savings By using credit or a buy now, pay later option Avg. by financing source Generation2
- 14. McKinsey & Company 14 Consumers’ intent to spend more across categories after COVID-19 subsides is especially high on discretionary categories like travel Signs of spend recovery 1. Q: Over the next two weeks, do you expect that you will spend more, about the same, or less money on these categories than usual? Figures may not sum to 100% because of rounding. 2. Q: Once the COVID-19 crisis subsides (i.e., once there is herd immunity), do you expect that you will spend more, about the same, or less money on these categories than during the COVID-19 pandemic? Figures may not sum to 100% because of rounding. 3. Net intent is calculated by subtracting the % of respondents stating they expect to decrease spending from the % of respondents stating they expect to increase spending. Source: McKinsey & Company COVID-19 Spain Consumer Pulse Survey 2/23–2/27/2021, n = 1,005, sampled to match Spain’s general population 18+ years -8 -31 -15 to 0 Below -15 Above +1 Below 0 Above +25 +15 to +25 0 to +15 Net Intent3 Next 2 weeks Post COVID Evolution Pet food & supplies -5 -1 Vitamins & OTC medicine -20 -10 Domestic flights -69 28 Hotel/resort stays -67 32 Adventures & tours -53 38 Out-of-home entertainment -56 34 Petcare services -28 -9 Fitness & wellness -30 13 Personal care services -27 4 Gasoline -29 21 Short-term home rentals -58 31 Cruises -53 -3 Travel by car -39 28 International flights -76 23 Books/magazines/newspapers -22 -7 Consumer electronics -39 -9 Entertainment at home 0 -7 Vehicles -42 Expected spending per category over the next two weeks1 compared to post COVID-192 % of respondents Net Intent3 Post COVID Next 2 weeks Evolution Groceries 2 7 Toys & baby -8 -41 Tobacco products -10 -11 Food takeout & delivery -23 -15 Alcoholic beverages -6 -27 Accessories -6 -52 Household supplies -3 -2 Apparel 4 -41 Quick-service restaurant -1 -36 Footwear -2 -46 Home improvement & gardening -12 Restaurant 23 -43 Personal-care products 3 -2 Skin care & makeup 3 -25 Sports & outdoors -1 -36 Home & furniture -14 -47 Jewelry -19 -54 Kitchen & dining -2 -17
- 15. McKinsey & Company 15 Three digital trends consumers picked up during the pandemic are more likely to stick than others Stickiness of digital 3. In-home entertainment and wellness digital activities to stay 2. Retail pick-up and delivery services habits to stay, less so for food take-way and delivery 1. Online buying permanently replacing in-store purchase 31 out of 36 of categories have a net intent above 20 for online purchase post-COVID-19 65% of consumers currently using a wellness app intend to continue post-COVID-19 55% of consumers currently buying online for in- store pick-up intend to continue post-COVID-19 32% of consumers using restaurant curbside pick-up services 67% of consumers currently streaming online intend to continue post-COVID-19
- 16. McKinsey & Company 16 Most consumers intend to continue online purchasing across categories in the future 54 52 70 45 59 75 39 39 84 55 30 55 28 Groceries/food for home Personal-care products Apparel Household supplies Footwear Food takeout & delivery Entertainment at home Meal at restaurant Alcoholic beverages Meal at quick-service restaurant Personal-care services Skin care & makeup Travel by car 22 37 19 29 33 23 25 39 16 20 75 61 65 61 33 39 35 67 39 62 38 70 31 58 42 60 40 88 12 69 32 60 40 69 31 64 36 38 28 95% currently purchasing online4 93% intend to continue purchasing online post-COVID-194 Source: McKinsey & Company COVID-19 Spain Consumer Pulse Survey 2/23–2/27/2021, n = 1,005, sampled to match Spain’s general population 18+ years 1. Q: Before the coronavirus (COVID-19) situation started, what proportion of your purchases in this category were online vs from a physical store/in person? Includes respondents who chose “some online,” “most online,” and “all online.” 2. Q: Have you purchased the following categories online since the coronavirus (COVID-19) began? Please select “yes” or “no” for each category. Includes respondents who selected “Yes” for the category. 3. Q: Will you continue to purchase these categories online after the coronavirus (COVID-19) situation subsides (i.e., once there is herd immunity)? “No, I will stop purchasing online altogether”; “buy less online”; “buy about the same amount online;” and “buy more online.” 4. Number indicates respondents who chose at least one category that they purchase online. 5. Net intent is calculated by subtracting the % of respondents stating they expect to decrease or stop use from the % of respondents stating they expect to increase or maintain use. Purchase online after COVID-19 Net intent5 after COVID-19 % of online purchase during COVID-19 for most purchased categories 0 to 20 Above 50 21 to 50 Below 0 Net intent5 Since start of COVID-19 Decrease or stop Increase or stay the same Consumers’ use of online channel during, and after COVID-191,2,3 % of respondents Stickiness of digital
- 17. McKinsey & Company 17 Consumers show a positive net intent to continue their level of shopping online post COVID-19 1. Q: Have you purchased the following categories online since the coronavirus (COVID-19) began? Please select yes or no for each category. Includes % respondents who selected “yes” for the category and currently buying the category. 2. Q: Will you continue to purchase these categories online after the coronavirus (COVID-19) situation subsides (i.e., once there is herd immunity)? Possible answers: “no I will stop purchasing online altogether”; “buy less online”; “buy about the same amount online”; “buy more online.” 3. Net intent is calculated among respondents currently buying online by subtracting the % of respondents stating they expect to decrease or stop use from the % of respondents stating they expect to increase or maintain use. 4. Sample size <50. 54 34 75 39 55 39 59 70 48 50 61 45 52 55 46 61 51 44 Apparel Tobacco products Groceries Food takeout & delivery Alcoholic Quick-service restaurant Footwear Restaurant Jewelry Accessories Toys & baby Household supplies Personal-care products Skin care & makeup Home & furniture Sports & outdoors Home improvement & gardening Kitchen & dining 60 47 84 60 73 30 35 39 30 46 35 23 40 35 21 Pet food & supplies Pet-care services 274 Entertainment at home Consumer electronics Vitamins & OTC medicine Books/magazines/newspaperss Entertainment out of home Fitness & wellness Personal-care services Short-term home rentals Cruises Adventures & tours International flights Hotel/resort stays Domestic flights Vehicles Net intent3 post-COVID-19 27 54 42 40 41 51 75 55 27 26 19 N/A4 68 69 76 80 Since COVID-19 began Net intent3 post-COVID-19 23 26 21 39 20 37 22 16 33 25 25 39 29 38 44 34 32 28 Source: McKinsey & Company COVID-19 Spain Consumer Pulse Survey 2/23–2/27/2021, n = 1,005, sampled to match Spain’s general population 18+ years Consumers’ use of online channel during1 and after2 COVID-19 % of respondents buying this category Above 50 0 to 20 Below 0 21 to 50 Net intent3 Stickiness of digital
- 18. McKinsey & Company 18 46 23 50 19 22 51 20 44 21 37 24 55 30 26 35 25 65 53 45 54 27 28 29 80 30 31 32 33 34 70 35 36 38 50 39 75 40 41 47 42 43 45 55 48 49 52 Skincare Pet-care services Toys & baby supplies Sports & outdoors equipment Personal-care services Food takeout Tobacco products Vitamins & OTC medicine Kitchen Apparel Home decoration Groceries Home improvement Entertainment away from home Alcoholic beverages Household supplies Pet supplies Fitness & wellness services Accessories Jewelry Footwear Consumer electronics Adventures & tours Books Personal-care products Intent to continue to purchase online after COVID-191 Percent of users who intend to keep doing activity after COVID-19 at same or higher level 1. Q: Will you continue to purchase these categories online after the COVID-19 situation subsides (i.e., once there is herd immunity)? Possible answers: “no, I will stop purchasing online altogether”; “buy less online”; “buy about the same amount online”; and “buy more online.” Number indicates intent, calculated by subtracting % of respondents stating they expect to decrease or stop use from % of respondents stating they expect to increase or maintain use. 2. Q: Have you purchased the following categories online since the coronavirus (COVID-19) began? Please select yes or no for each category. Includes % respondents who selected “Yes” for the category. Note: Thresholds of categories are defined by the terciles. The 1st tercile of Intent occurs at 26%, and the 2nd occurs at 39%. Online grocery buying will recede from its pandemic highs, while electronics will continue to be purchased online Penetration since COVID-19 2 Source: McKinsey & Company COVID-19 Spain Consumer Pulse Survey 2/23–2/27/2021, n = 1,005, sampled to match Spain’s general population 18+ years Sustained shift to online Greater online presence Less accelerated online shift Stickiness of digital
- 19. McKinsey & Company 19 1. Q: Have you used or done any of the following since the coronavirus (COVID-19) crisis started? If yes, Q: Which best describes when you have done or used each of these items? Possible answers: “just started using since COVID-19 started”; “using more since COVID-19 started”; “using about the same since COVID-19 started”; “using less since COVID-19 started.” 2. Q: Compared to now, will you do or use the following more, less, or not at all, once the coronavirus (COVID-19) ) crisis subsides (i.e., once there is herd immunity)? Possible answers: “will stop this”; ”will reduce this”; “will keep doing what I am doing now”; “will increase this.” Number indicates respondents who chose “will keep doing what I am doing now” and “will increase this” among new or increased users. 3. Data not available. 13% 9% 2% 2% 2% 5% 3% 2% 7% 5% 11% 4% 19% 21% 4% 6% 7% 5% 3% 14% 3% 15% 11% 5% 4% 8% 2% 3% 2% 2% 5% 7% 4% 8% 2% 2% Restaurant delivery Pay more for one-hour delivery Restaurant curbside pickup Grocery delivery 1% 2% Pay more for same-day delivery Meal-kit delivery 1% Quick-serve restaurant drive-thru In-store self-checkout Buy online for in-store pickup Store curbside pickup Used a new store/restaurant app Purchased pre-owned products Purchased directly from social media Used deal-finding plug-ins Just started using Using same/less Using more Intent to continue,2 % 53% 51% 45% 52% 88% 31% 62% 21% 61% 74% 65% N/A3 49% 50% Spanish consumers continue to try pickup and delivery services for the first time, and to intensify their usage of them N/A3 Source: McKinsey & Company COVID-19 Spain Consumer Pulse Survey 2/23–2/27/2021, n = 1,005, sampled to match Spain’s general population 18+ years Have you used or done any of the following since COVID-19 started1 % of respondents currently using/doing Stickiness of digital
- 20. McKinsey & Company 20 New behaviors spurred by COVID-19 66 24 18 32 30 76 20 22 28 35 0 26 5 54 30 64 34 36 38 40 42 40 44 52 46 48 50 56 58 60 62 68 74 70 72 25 88 78 80 82 84 86 10 15 20 Restaurant curbside pickup Purchased from social media In-store self-checkout Meal-kit delivery Restaurant delivery Grocery delivery Quick-serve restaurant drive-thru Buy online for in-store pickup Store curbside pickup Purchased pre-owned products online New store/restaurant app Intent to use after COVID-19,1 Percent of new or increased users who intend to keep doing activity after COVID-19 1. Q: Compared to now, will you do or use the following more, less, or not at all, once the coronavirus (COVID-19) ) crisis subsides (i.e., once there is herd immunity)? Possible answers: “will stop this”; ”will reduce this”; “will keep doing what I am doing now”; “will increase this.” Number indicates respondents who chose “will keep doing what I am doing now” and “will increase this” among new or increased users. 2. Q: Which best describes when you have done or used each of these items? Possible answers included: “just started using since coronavirus started”; “using more since coronavirus started”; “using less since coronavirus started”; “using about the same since coronavirus started.” Possible answers not included: “not using.” 3. User growth is calculated as % of respondents who replied that they are new users over % of respondents who replied that they were using the product/service pre-COVID-19 (using more, using the same, or using less). 3. Thresholds of categories are set at the median value. Penetration median = 13%, Intent to use median = 53%. Use of restaurant apps and in-store self-checkouts are consumers’ key accelerated shifts Digital is here to stay Penetration since COVID-19 2 Source: McKinsey & Company COVID-19 Spain Consumer Pulse Survey 2/23–2/27/2021, n = 1,005, sampled and weighted to match Spain’s general population 18+ years User Growth3: 0-19% User Growth: 20-39% User Growth: 40-59% User Growth: 60%+ Niche behaviors but growing fast with very loyal consumers who want to continue using it post- COVID Big surge during COVID, but not enough penetration or intent to fully stick Niche and loyal Popular & enduring No real shift since COVID
- 21. McKinsey & Company 21 Spanish consumers have acquired at-home alternatives to out-of-home activities, such as online streaming or online learning Digital is here to stay 1. Q: Have you used or done any of the following since the coronavirus (COVID-19) crisis started? If yes, Q: Which best describes when you have done or used each of these items? Possible answers: “just started using since COVID-19 started”; “using more since COVID-19 started”; “using about the same since COVID-19 started”; “using less since COVID-19 started.” 2. Q: Compared to now, will you do or use the following more, less, or not at all, once the coronavirus (COVID-19) crisis subsides (i.e., once there is herd immunity)? Possible answers: “will stop this”; ”will reduce this”; “will keep doing what I am doing now”; “will increase this.” Number indicates respondents who chose “will keep doing what I am doing now” and “will increase this” among new or increased users. Source: McKinsey & Company COVID-19 Spain Consumer Pulse Survey 2/23–2/27/2021, n = 1,005, sampled to match Spain’s general population 18+ years 20% 3% 7% 5% 3% 2% 3% 2% 10% 4% 7% 24% 12% 13% 12% 6% 4% 6% 5% 2% 17% 10% 11% 14% 5% 10% 4% 11% 8% 5% 2% 2% 10% 3% 5% Video chat: personal 41% Videoconferencing: professional 19% Online streaming 32% 15% Remote learning: myself Social Media 1% Cooked regularly for myself/my family Wellness app Social media Watching e-sports Telemedicine: mental 6% 3% 34% Online fitness 34% Telemedicine: physical 40% TikTok Remote learning: my children Personal care/grooming at home Using more Using same/less Just started using Intent to continue2 % 75% 46% 43% 60% 55% 39% 50% 63% 49% 47% 53% 52% 66% 57% 76% Have you used or done any of the following since COVID-19 started1 % of respondents currently using/doing
- 22. McKinsey & Company 22 1. Q: Compared to now, will you do or use the following more, less, or not at all, once the coronavirus (COVID-19) ) crisis subsides (i.e., once there is herd immunity)? Possible answers: “will stop this”; ”will reduce this”; “will keep doing what I am doing now”; “will increase this.” Number indicates respondents who chose “will keep doing what I am doing now” and “will increase this” among new or increased users. 2. Q: Which best describes when you have done or used each of these items? Possible answers included: “just started using since coronavirus started”; “using more since coronavirus started”, “using less since coronavirus started”; “using about the same since coronavirus started." Possible answers not included: “not using.” 3. User growth is calculated as % of respondents who replied that they are new users over % of respondents who replied that they were using the product/service pre-COVID-19 (using more, using the same, or using less). 3. Thresholds of categories are set at the median value. Penetration median = 26%, Intent to use median = 53%. 66 60 36 53 25 35 33 75 34 35 37 20 39 38 40 45 67 41 42 62 30 43 44 69 46 65 47 5 73 48 59 49 50 51 80 74 52 68 54 56 55 57 58 60 61 64 63 65 70 71 72 75 77 0 10 15 40 45 50 55 70 Telemedicine: mental Online streaming Video chat: personal Remote learning: myself Remote learning: my children Videoconferencing: professional Online fitness Wellness app Social media Playing online games TikTok Watching e-sports Cooking Personal care / grooming at home Telemedicine: physical Remote learning habits adopted during the crisis are likely to remain for the medium to long term Source: McKinsey & Company COVID-19 Spain Consumer Pulse Survey 2/23–2/27/2021, n = 1,005, sampled and weighted to match Spain’s general population 18+ years User growth3: 0-19% User growth: 20-39% User growth: 40-59% User growth: 60%+ Intent to use after COVID-19,1 Percent of new or increased users who intend to keep doing activity after COVID-19 Niche behaviors but growing fast with very loyal consumers who want to continue using it post-COVID-19 Niche and loyal Big surge during COVID-19, but not enough penetration or intent to fully stick No real shift since COVID-19 New behaviors spurred by COVID-19 Universally popular Penetration since COVID-19 2 Digital is here to stay
- 23. McKinsey & Company 23 COVID-19 has spurred Spanish consumers into major life changes, especially around work and study change, and home renovation Rebalancing of homebody economy 1. Q: Which of the following have you done in the last 12 months as a result of the COVID-19 crisis? 39% answered “None of these.” 2. 33% of the survey respondents in Spain are millennials; 15% of the survey respondents in Spain have a high income (>€50K/year). Details next Went back to school Permanently moved to the countryside Moved into a smaller home 3% Decided to change jobs 12% Permanently moved to a new city Set-up a gym at home Permanently moved in with family Moved into a bigger home Permanently moved the suburbs 11% Set-up a specific work from home space Sold a property Renovated/remodeled my home Reassessed my investment portfolio Worked more from home Bought a property Got a new pet at home (e.g., dog, cat) 31% 5% 6% 4% 3% 3% 2% 1% 14% 14% 5% 2% 2% 9% Bought a car Pet adoption 9% Work/study change 40% House move 12% Home renovation 31% Investments/ Divestments 14% of which 50% have made home renovations 45% are millennials (vs 33% of total sample2) 23% Have a high income (vs 15% of total sample2) Source: McKinsey & Company COVID-19 Spain Consumer Pulse Survey 2/23–2/27/2021, n = 1,005, sampled to match Spain’s general population 18+ years x% Main life events done in the last 12 months as a result of COVID-191 % of respondents Net % of respondents per category
- 24. McKinsey & Company 24 18% 58% 23% 1% Only 1 in 5 consumers expects to continue working from home after COVID-19, signaling limited shifts toward online daily activities Rebalancing of homebody economy 19% will either work only from home or do so more than before COVID-19 Use of digital services2 % respondents who worked more from home during the crisis Work from home after COVID-19 as compared to before COVID-19,1% respondents Work only from home Work from home more Work from home the same Work outside home more -34 -12 3 4 -31 -2 -1 4 6 5 -7 1 -28 -24 -5 Diff. with those who did not,3 percentage point 1. Q: Once the COVID-19 crisis subsides (i.e., once there is herd immunity), how do you think the amount of time you spend doing the following activities will change relative to how often you did them before COVID-19 began? Asked of respondents who selected “Work more from home" in the Q: Which of the following have you done in the last 12 months as a result of the COVID-19 crisis? Possible answers: "I will not do this at all“; "I will do this less often“; “I will do this about the same“; “I will do this more.“ 2. Q: Which of the following have you done in the last 12 months as a result of the COVID-19 crisis? Respondents who selected “Worked more from home.“ Q: Compared to now, will you do or use the following more, less or not at all, once the coronavirus (COVID-19) crisis subsides (i.e., once there is herd immunity)? Respondents who selected: “I will keep doing what I am doing now“ or “I will increase this.“ 3. Difference between respondents who selected “Worked more from home“ and those that didn’t. Source: McKinsey & Company COVID-19 Spain Consumer Pulse Survey 2/23–2/27/2021, n = 1,005, sampled to match Spain’s general population 18+ years 47% 59% 50% 48% 40% 44% 76% 66% 73% 51% 53% 44% 55% 42% 51% Videoconferencing: professional TikTok Cooked regularly for myself/my family Social media Telemedicine: mental Playing online games Telemedicine: physical Video chat: personal Watching e-sports Online streaming Remote learning: my children Online fitness Wellness app Personal care/grooming at home Remote learning: myself Plan to continue or increase usage Diff. Above +9 Diff.: 5 to 9 Diff.: Below 0 Diff.: 0 to 4
- 25. McKinsey & Company 25 Almost 3 of 4 Spanish consumers reports trying a new shopping behavior which they now do regularly Evolution of loyalty 2% 3% 22% 22% 23% 33% 35% 4% 4% 5% 3% 4% New digital shopping method New shopping method3 Different retailer/store/website 1% 1% Private label/store brand 2% 30% 27% Different brand 42% 28% 37% 72% of consumers have tried a new shopping behavior Just once Sometimes Regularly 87% of Gen Z have tried a new shopping behavior 1. Q: Since the coronavirus (COVID-19) crisis started, which of the following have you done? 28% consumers selected “none of these.” 2. Q: Which best describes whether or not you plan to continue with these shopping changes once the coronavirus (COVID-19) crisis has subsided (i.e., once there is herd immunity)? Possible answers: “will go back to what I did before coronavirus”; ”will keep doing both this and what I did before coronavirus”; ”will keep doing this and NOT go back to what I did before coronavirus.” 3. “New shopping method” includes curbside pickup and delivery apps. 4. Intent to continue includes respondents who selected “will keep doing both this and what I did before coronavirus” and “will keep doing this and NOT go back to what I did before coronavirus.” Source: McKinsey & Company COVID-19 Spain Consumer Pulse Survey 2/23–2/27/2021, n = 1,005, sampled to match Spain’s general population 18+ years Have you done any of the following since COVID-19 started and how often1,2 % of respondents 87% 87% 88% 80% 88% Intent to continue4
- 26. McKinsey & Company 26 More than a half of consumers cite value and convenience as top drivers for trying new places to shop, while purpose is also relevant Evolution of loyalty 31% 26% 21% 19% 19% 18% 7% 26% 8% 7% 6% 11% 9% 16% 10% 6% 5% Cleaner / has better hygiene measures Supporting local businesses Better shipping/delivery costs Better prices/promotions Better value More easily accessible from my home Less crowded / has shorter lines Can get all the items I need from one place Offers good delivery/pickup options Has more sustainable / environmentally friendly options Shares my values The company treats its employees well Wanted variety/change from my normal routine Wanted to treat myself Products are in stock Better quality Offers natural/organic options Reason for shopping at a new retailer/store/website since COVID-19 began1 % of respondents selecting reason in top three 1. Q: You mentioned you shopped from a new retailer/store/website since the coronavirus (COVID-19) crisis started. What were the main reasons you decided to try this new retailer/store/website? Select up to three. 2. 33% of the survey respondents in Spain are millennials; 15% of the survey respondents in Spain have a high income (>€50K/year). Source: McKinsey & Company COVID-19 Spain Consumer Pulse Survey 2/23–2/27/2021, n = 1,005, sampled to match Spain’s general population 18+ years Net % of respondents per category X% Value 57% Personal choice 20% Convenience 53% Purpose-driven 39% Availability 16% Health/hygiene 5% Quality/organic 15% of which 45% are millennials (vs 33% of total sample2) 44% have a high income (vs 15% of total sample2)
- 27. McKinsey & Company 27 More than 65 percent of consumers who tried a new brand cite value as a key driver Evolution of loyalty 40% Better value Better shipping/delivery costs 19% 37% Larger package sizes Wanted to try a new brand I found Better prices/promotions 7% 30% 25% The company treats its employees well 23% Wanted to try a type of product I’ve never tried before Supporting local businesses Is more sustainable / better for the environment 13% Shares my values 8% 25% Wanted to treat myself 19% 28% Wanted variety/change from my normal routine Better quality 16% Is natural/organic 18% Is available where I’m shopping 12% Products are in stock 10% Cleaner / has better hygiene measures 10% Reason for trying a new brand since COVID-19 began1 % of respondents selecting reason in top three 1. Q: You mentioned you tried a new/different brand than what you normally buy. What were the main reasons that drove this decision? Select all that apply. “Brand” includes different brand, new private label/store brand. 2. 12% of the survey respondents in Spain are Gen Z. Source: McKinsey & Company COVID-19 Spain Consumer Pulse Survey 2/23–2/27/2021, n = 1,005, sampled to match Spain’s general population 18+ years Net % of respondents per category X% Value 65% Personal choice 39% Novelty 42% Availability 12% Purpose-driven 39% Quality/organic 35% Health/hygiene 10% Convenience 18% of which 19% are Gen Z (vs 12% of total sample2) 25% are Gen Z (vs 12% of total sample2)
- 28. McKinsey & Company 28 Disclaimer McKinsey does not provide legal, medical, or other regulated advice or guarantee results. These materials reflect general insight and best practice based on information currently available and do not contain all of the information needed to determine a future course of action. Such information has not been generated or independently verified by McKinsey and is inherently uncertain and subject to change. McKinsey has no obligation to update these materials and makes no representation or warranty and expressly disclaims any liability with respect thereto.