This document contains details of the Fall 2012 semester 1 Master of Business Administration program, including:
1) Details of the Statistics for Management course, including its credits and textbook.
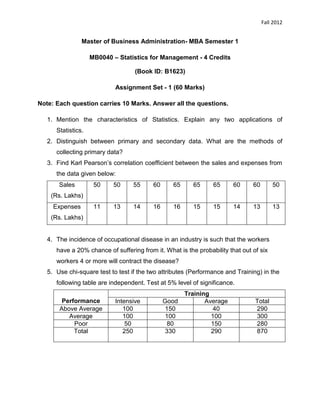
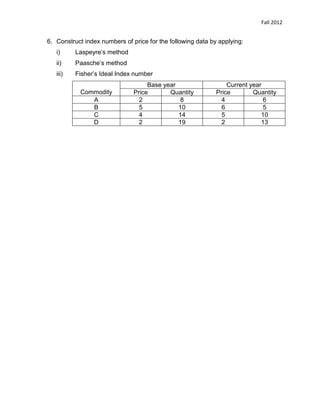
2) An assignment set with 6 questions covering topics like characteristics of statistics, primary and secondary data collection, correlation coefficient, probability, chi-square test, index numbers, and analysis of variance.
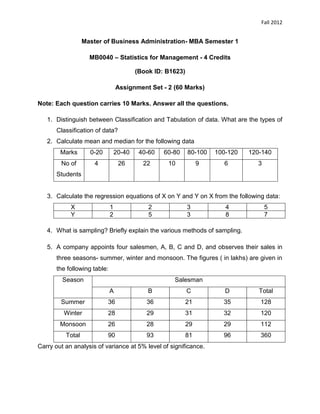
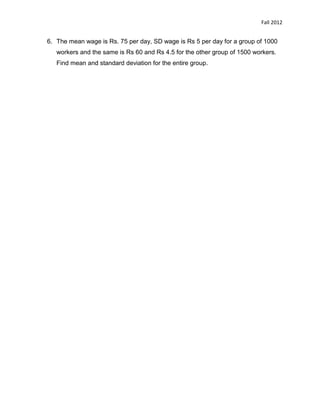
3) A second assignment set with 6 similar questions analyzing data using measures like mean, median, regression analysis, sampling methods, and calculating mean and standard deviation for combined data sets.