Download to read offline
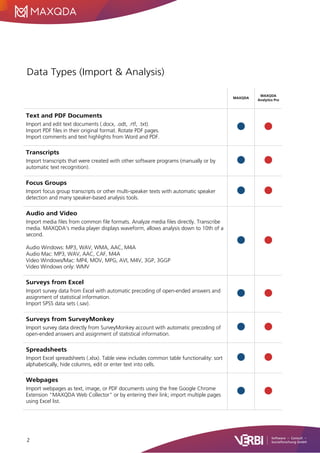
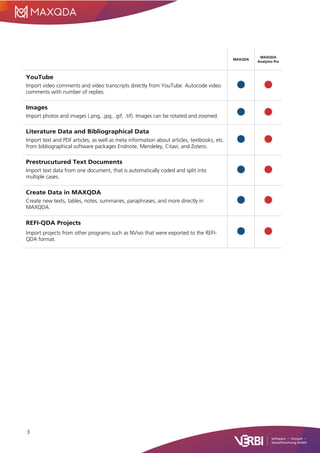
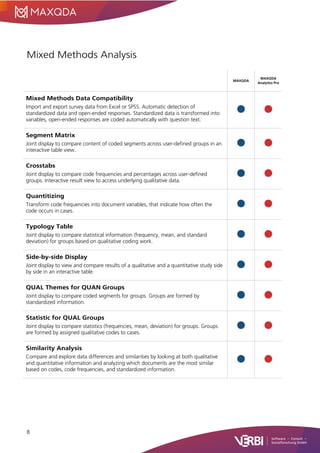
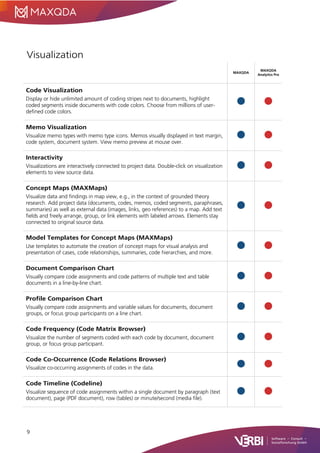
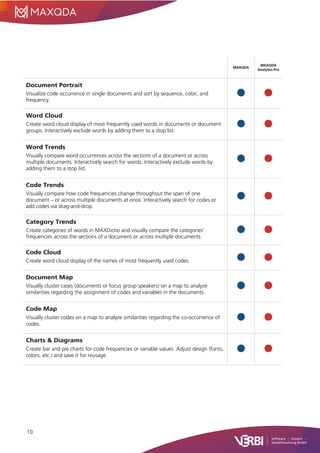
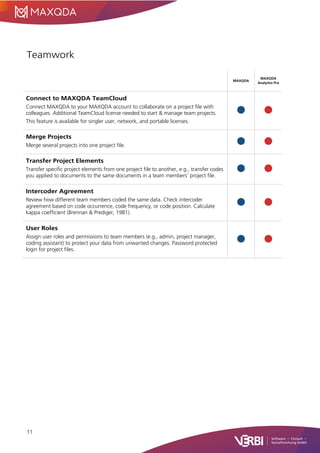


The document provides a comprehensive overview of MAXQDA 24, detailing its features for data import, management, qualitative and quantitative analysis, visualization, teamwork, reporting, and support. It highlights various data types supported, including text, audio, video, and statistical data, along with the software's capabilities for transcribing, coding, and analyzing qualitative data. Additionally, it discusses user community support and interface customization options available in multiple languages.