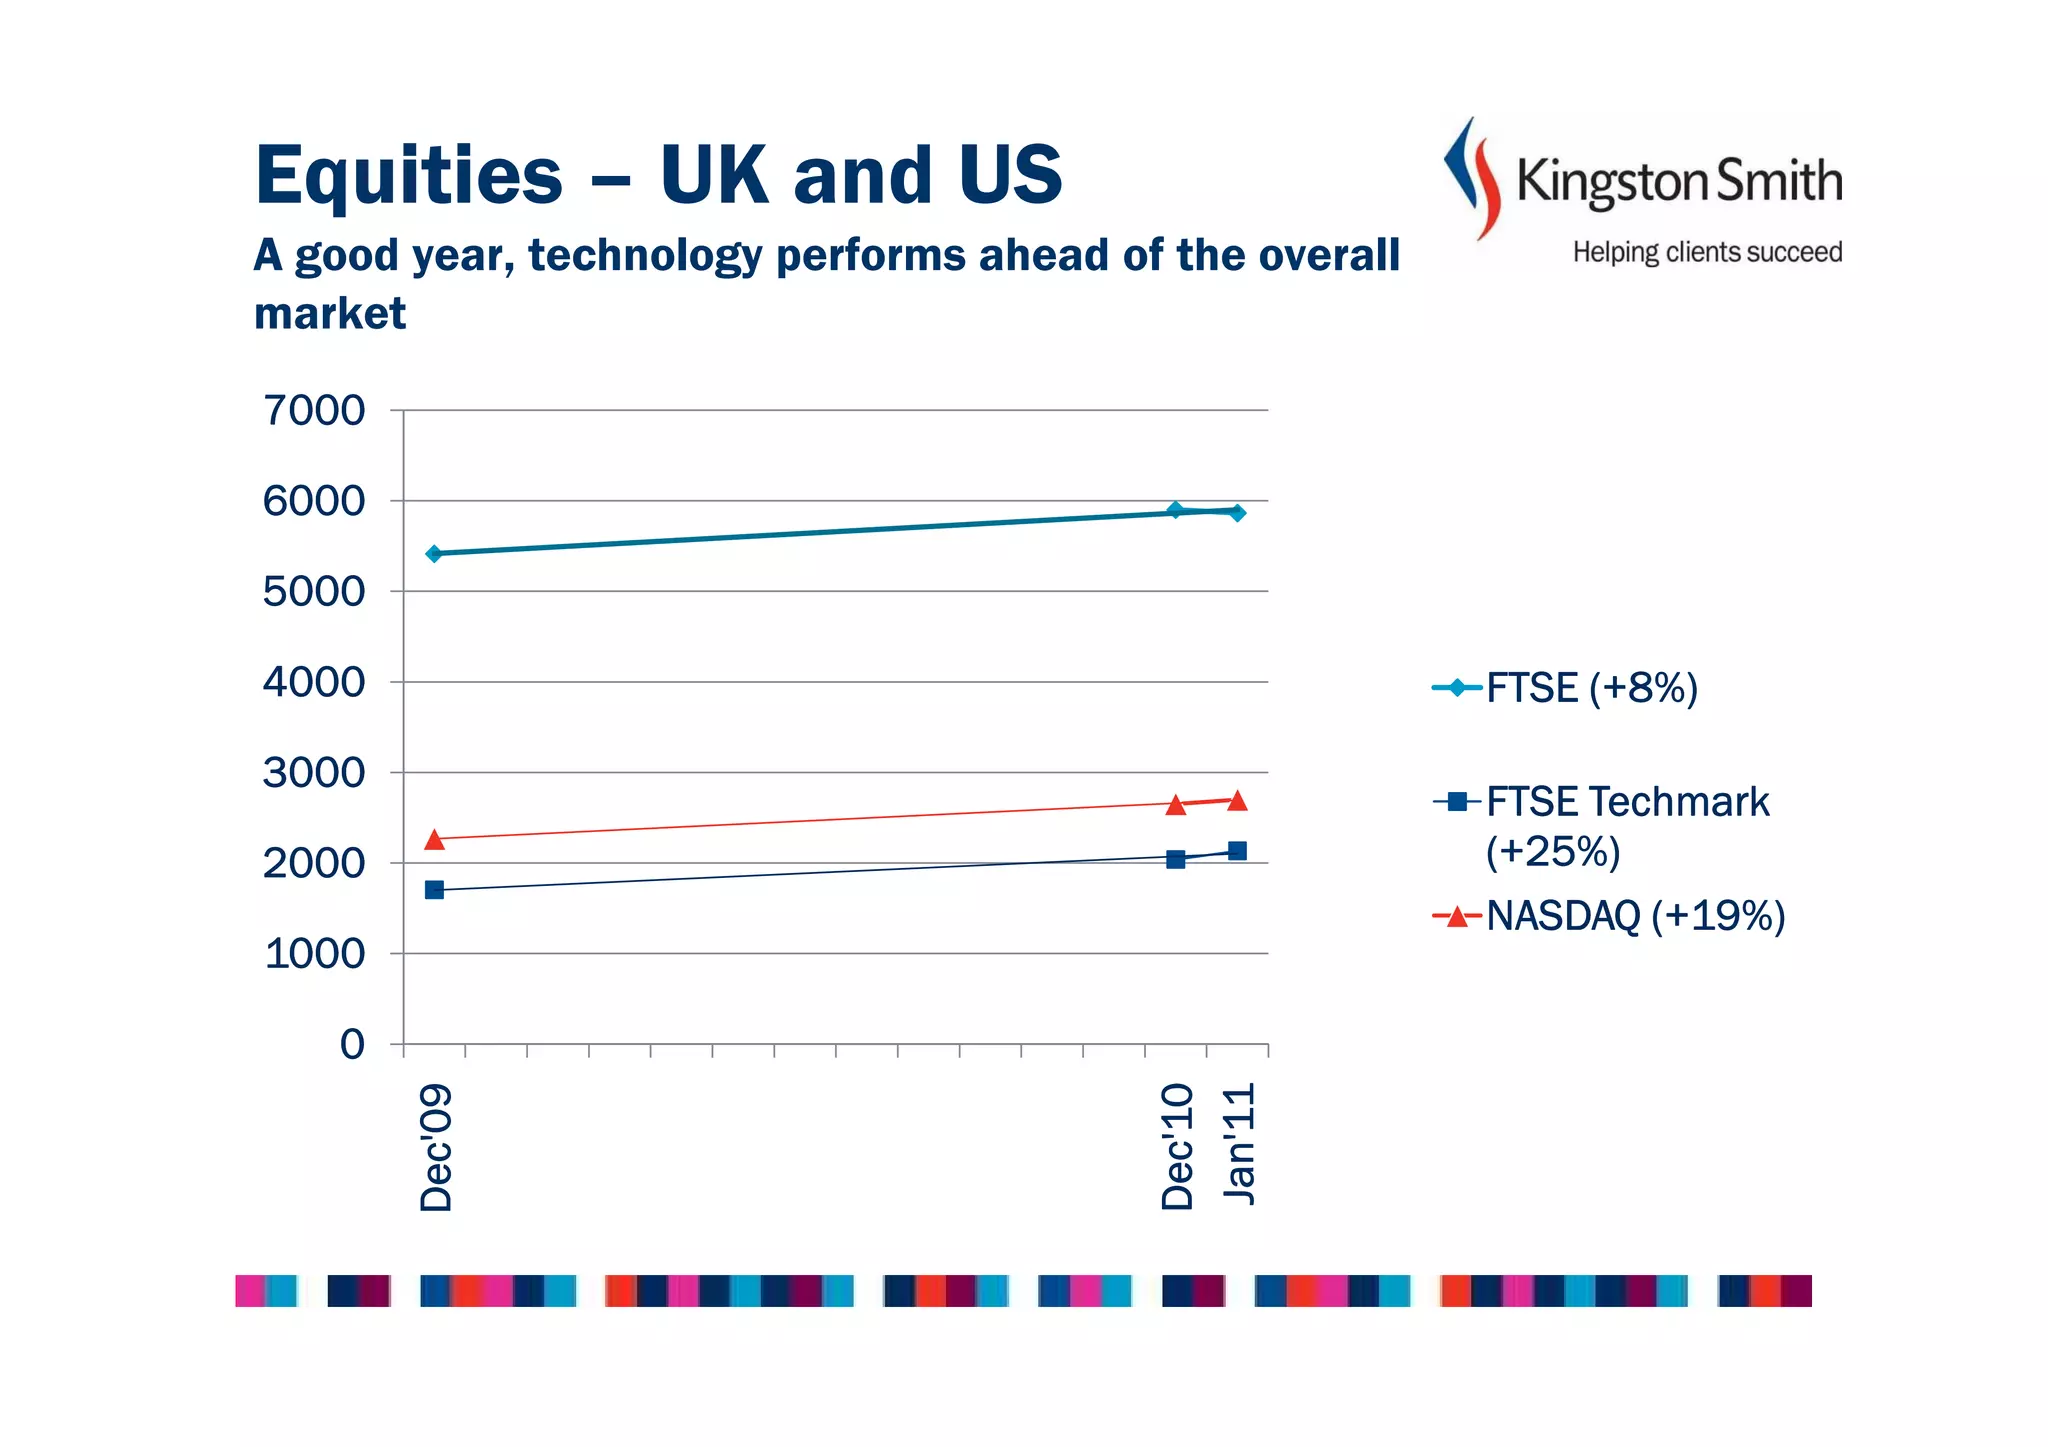
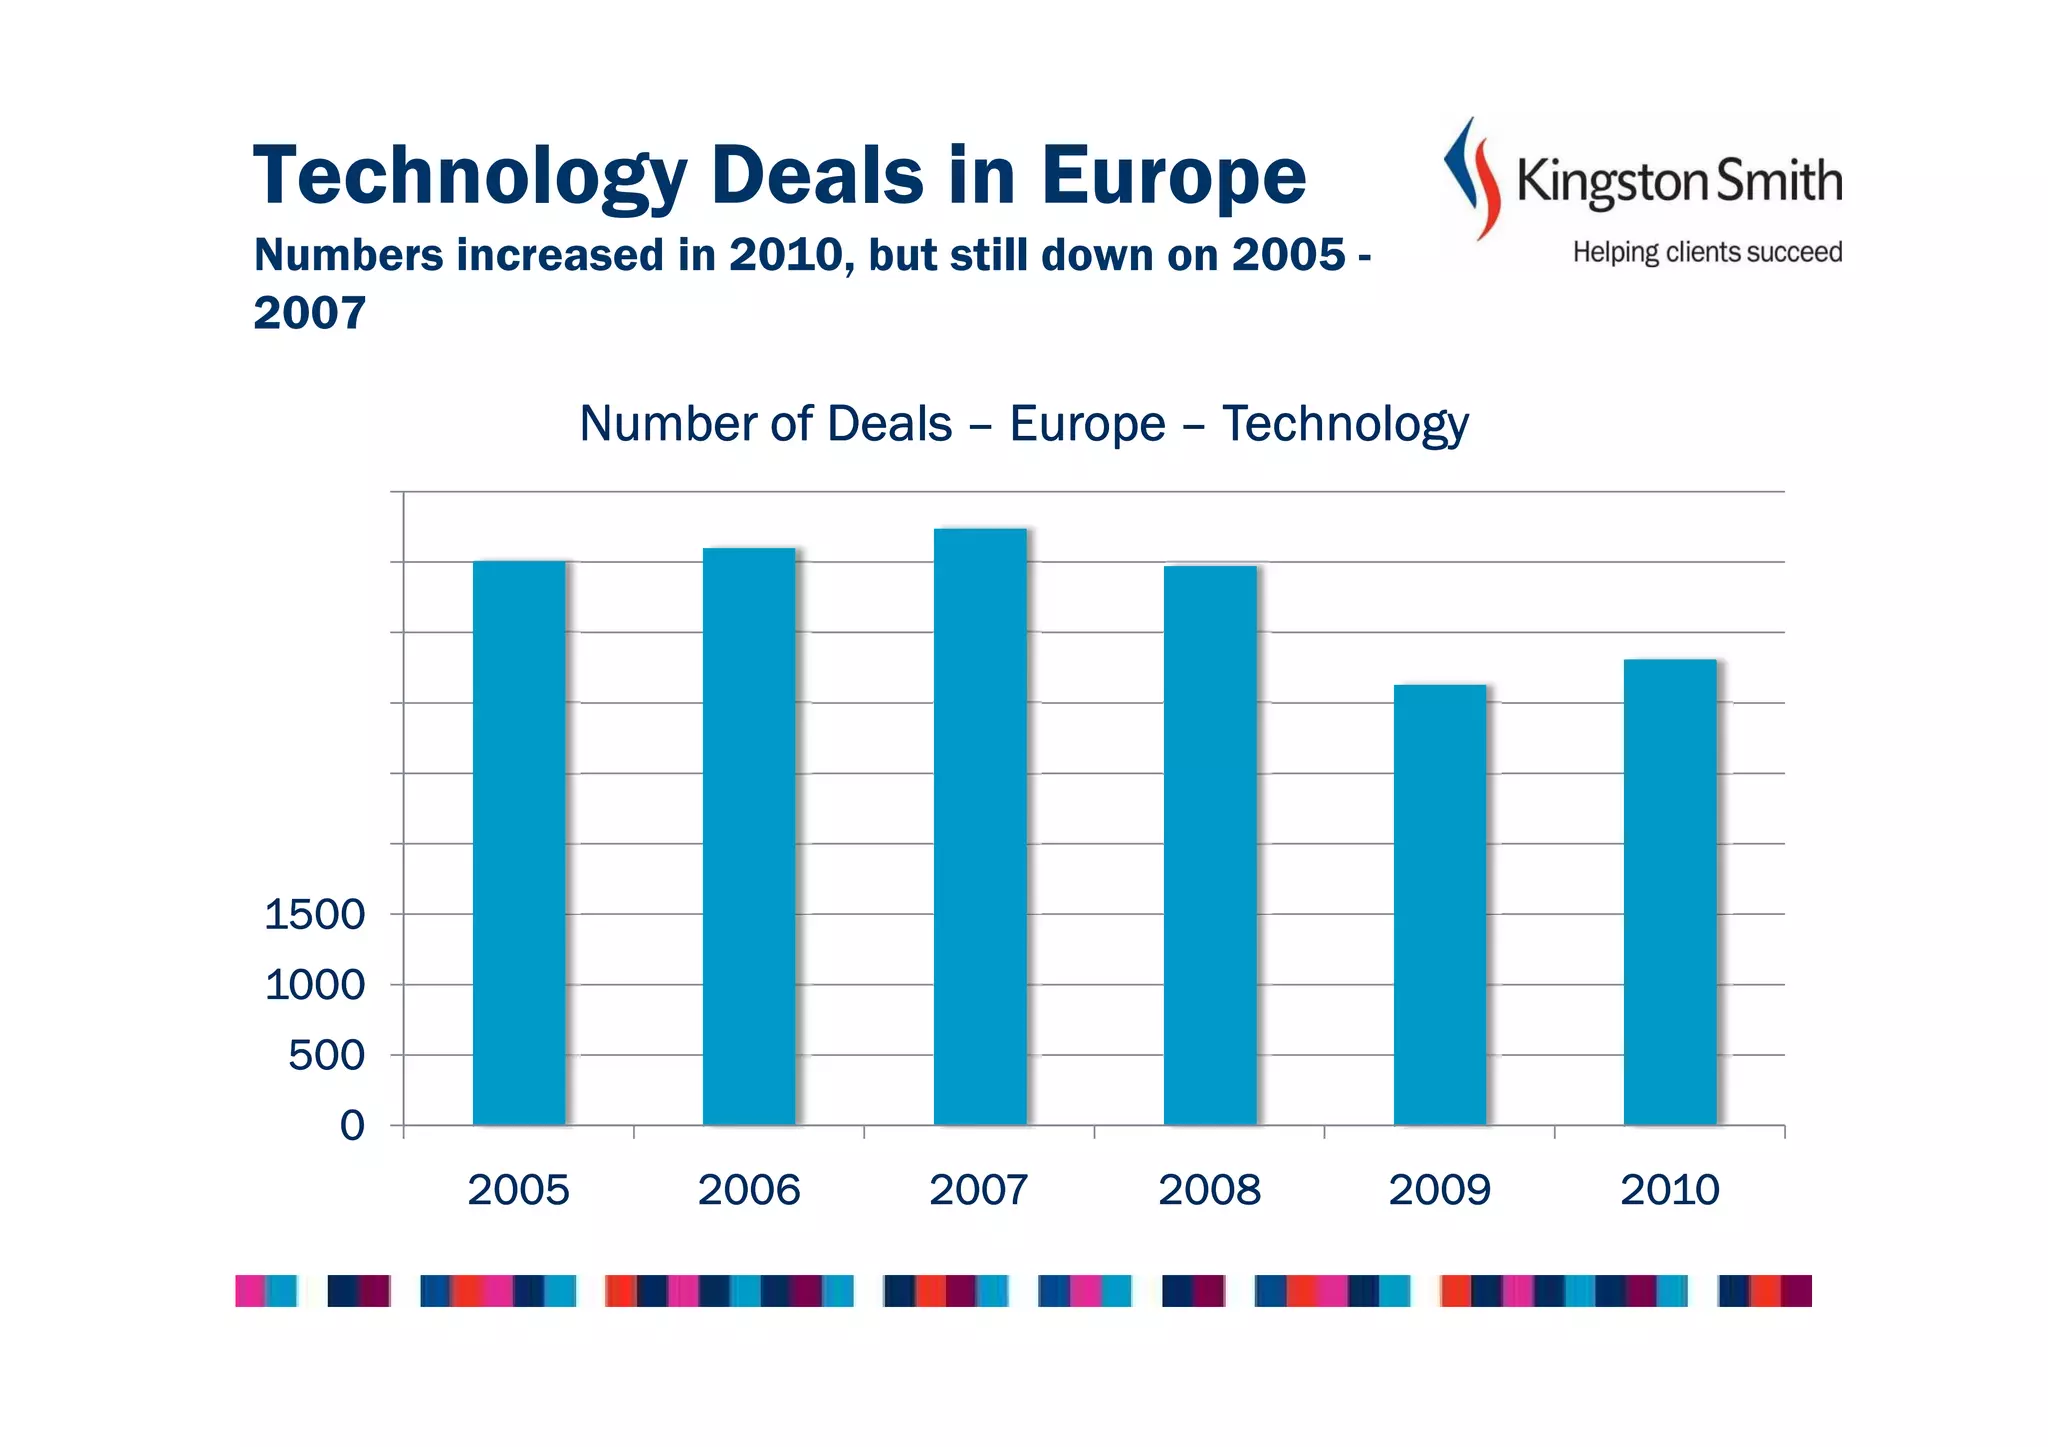
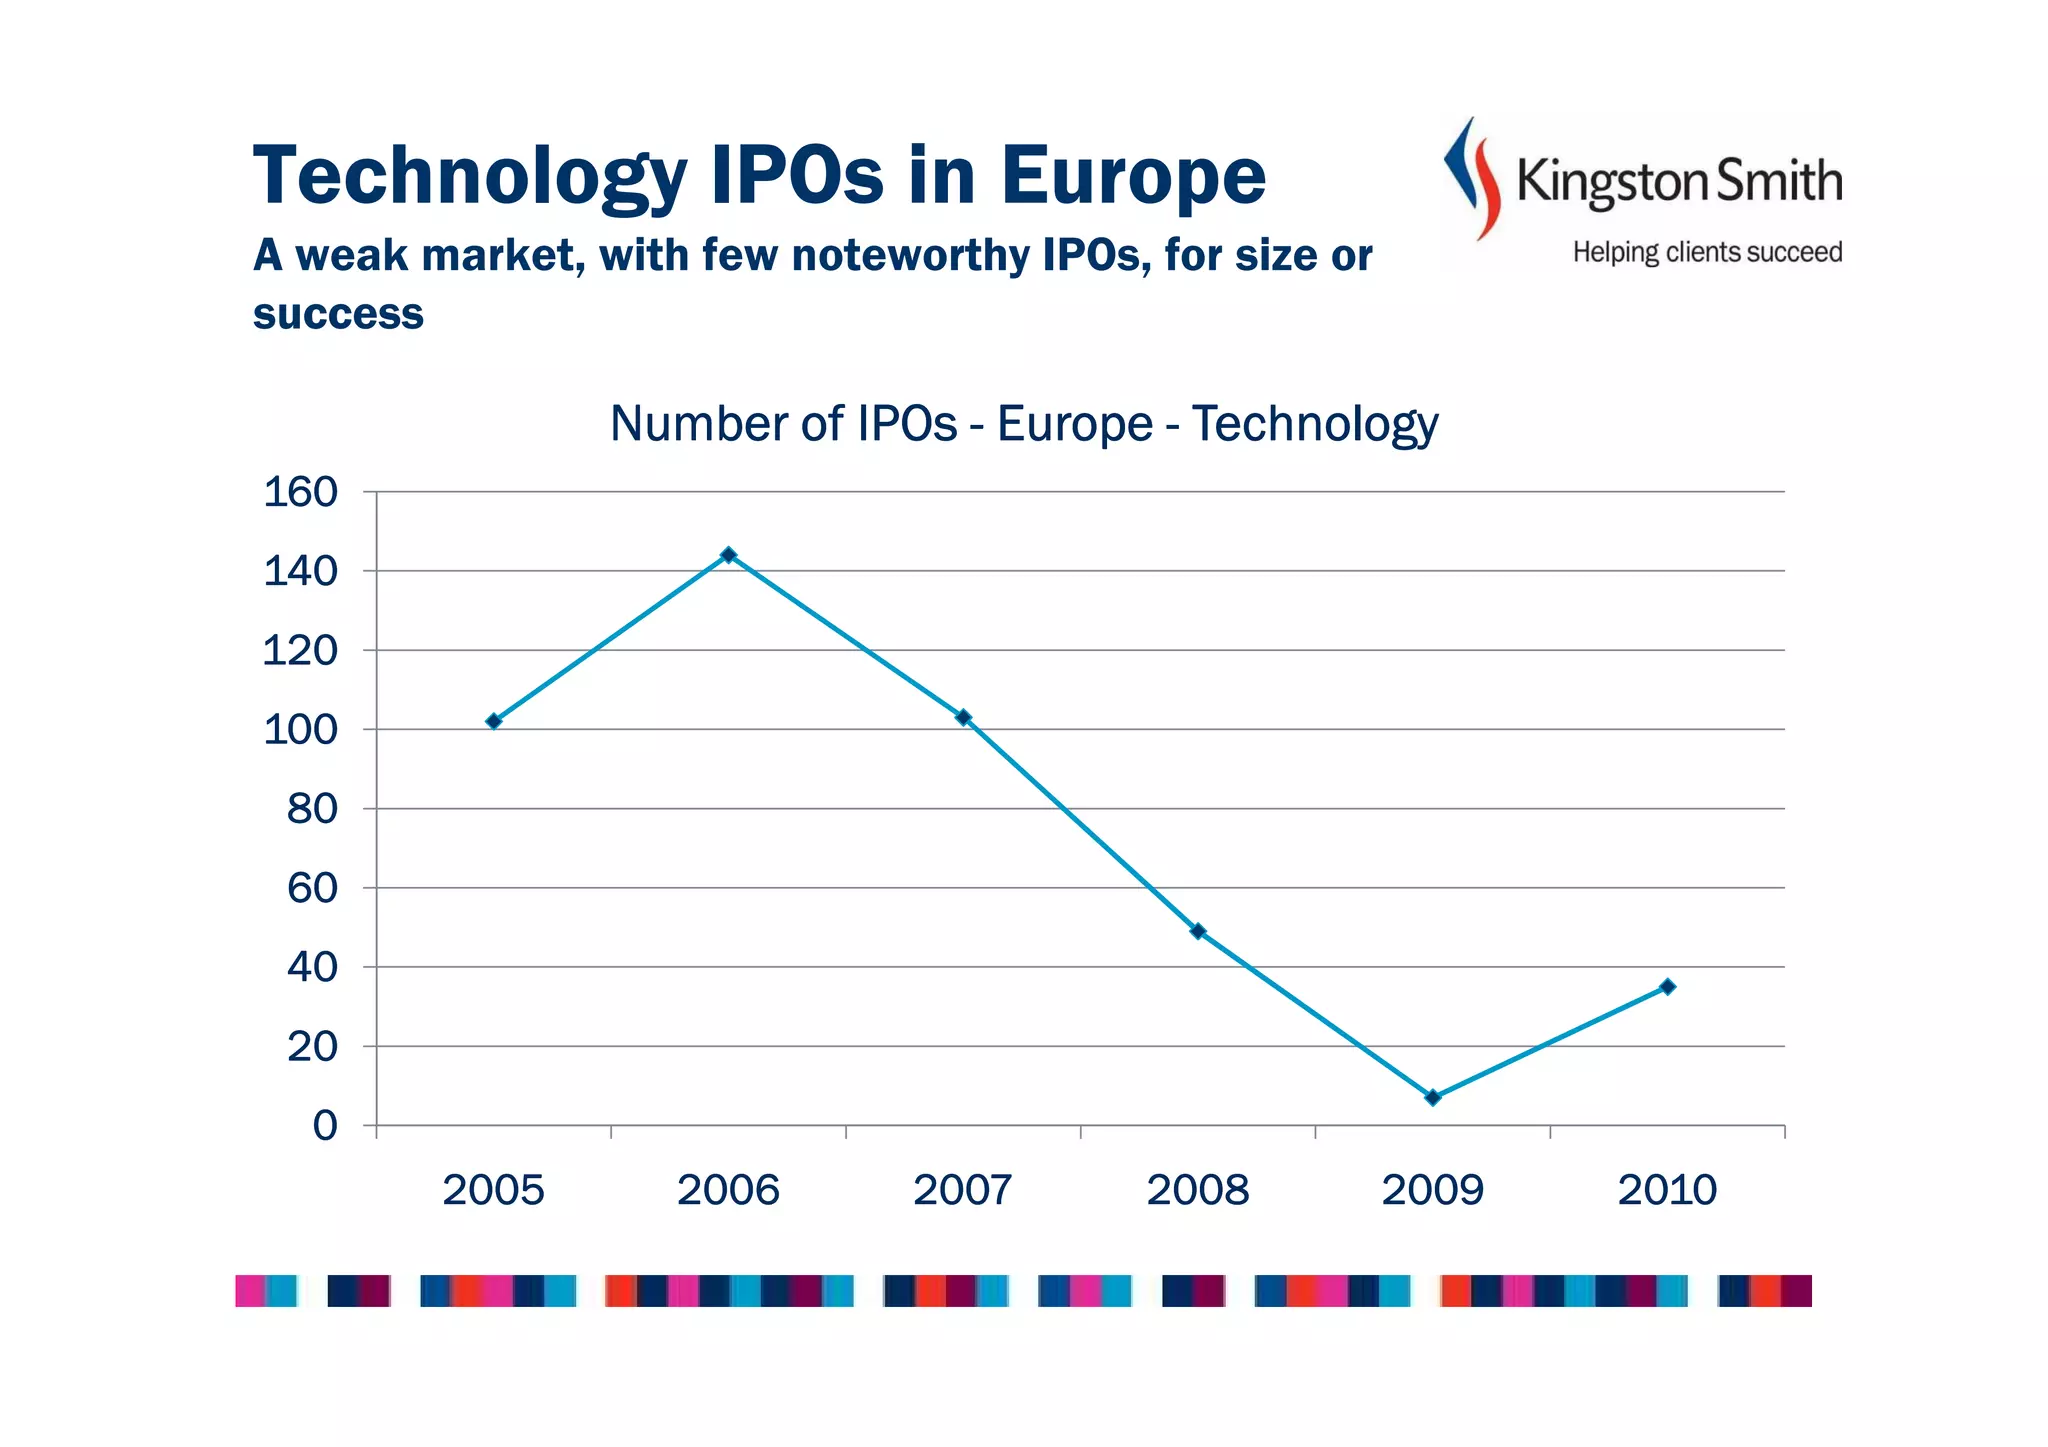
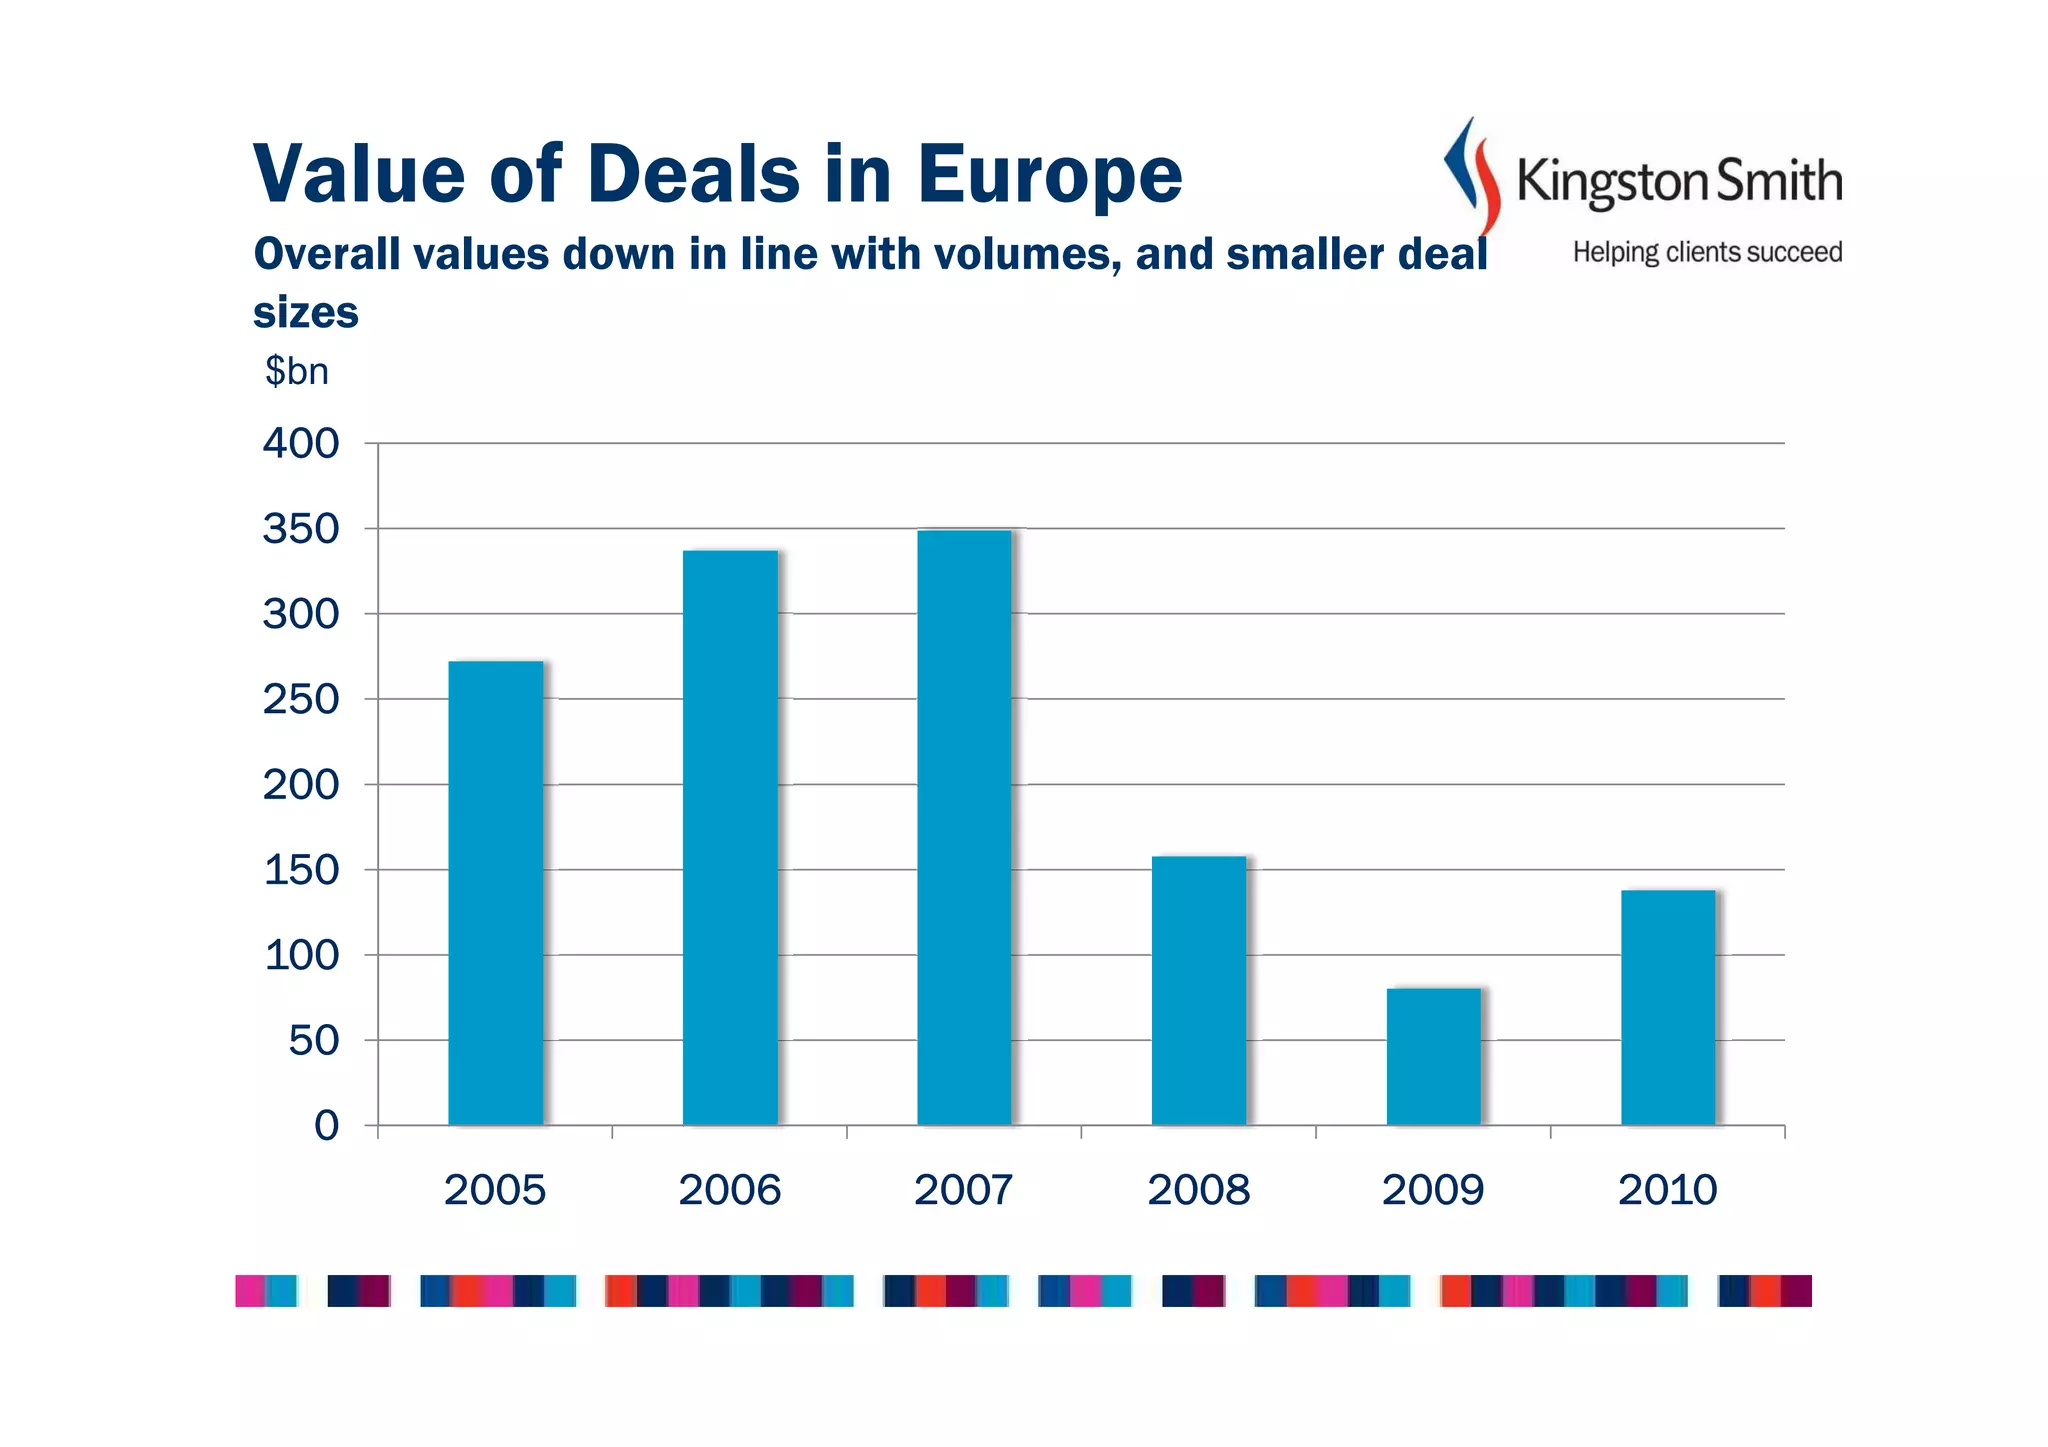
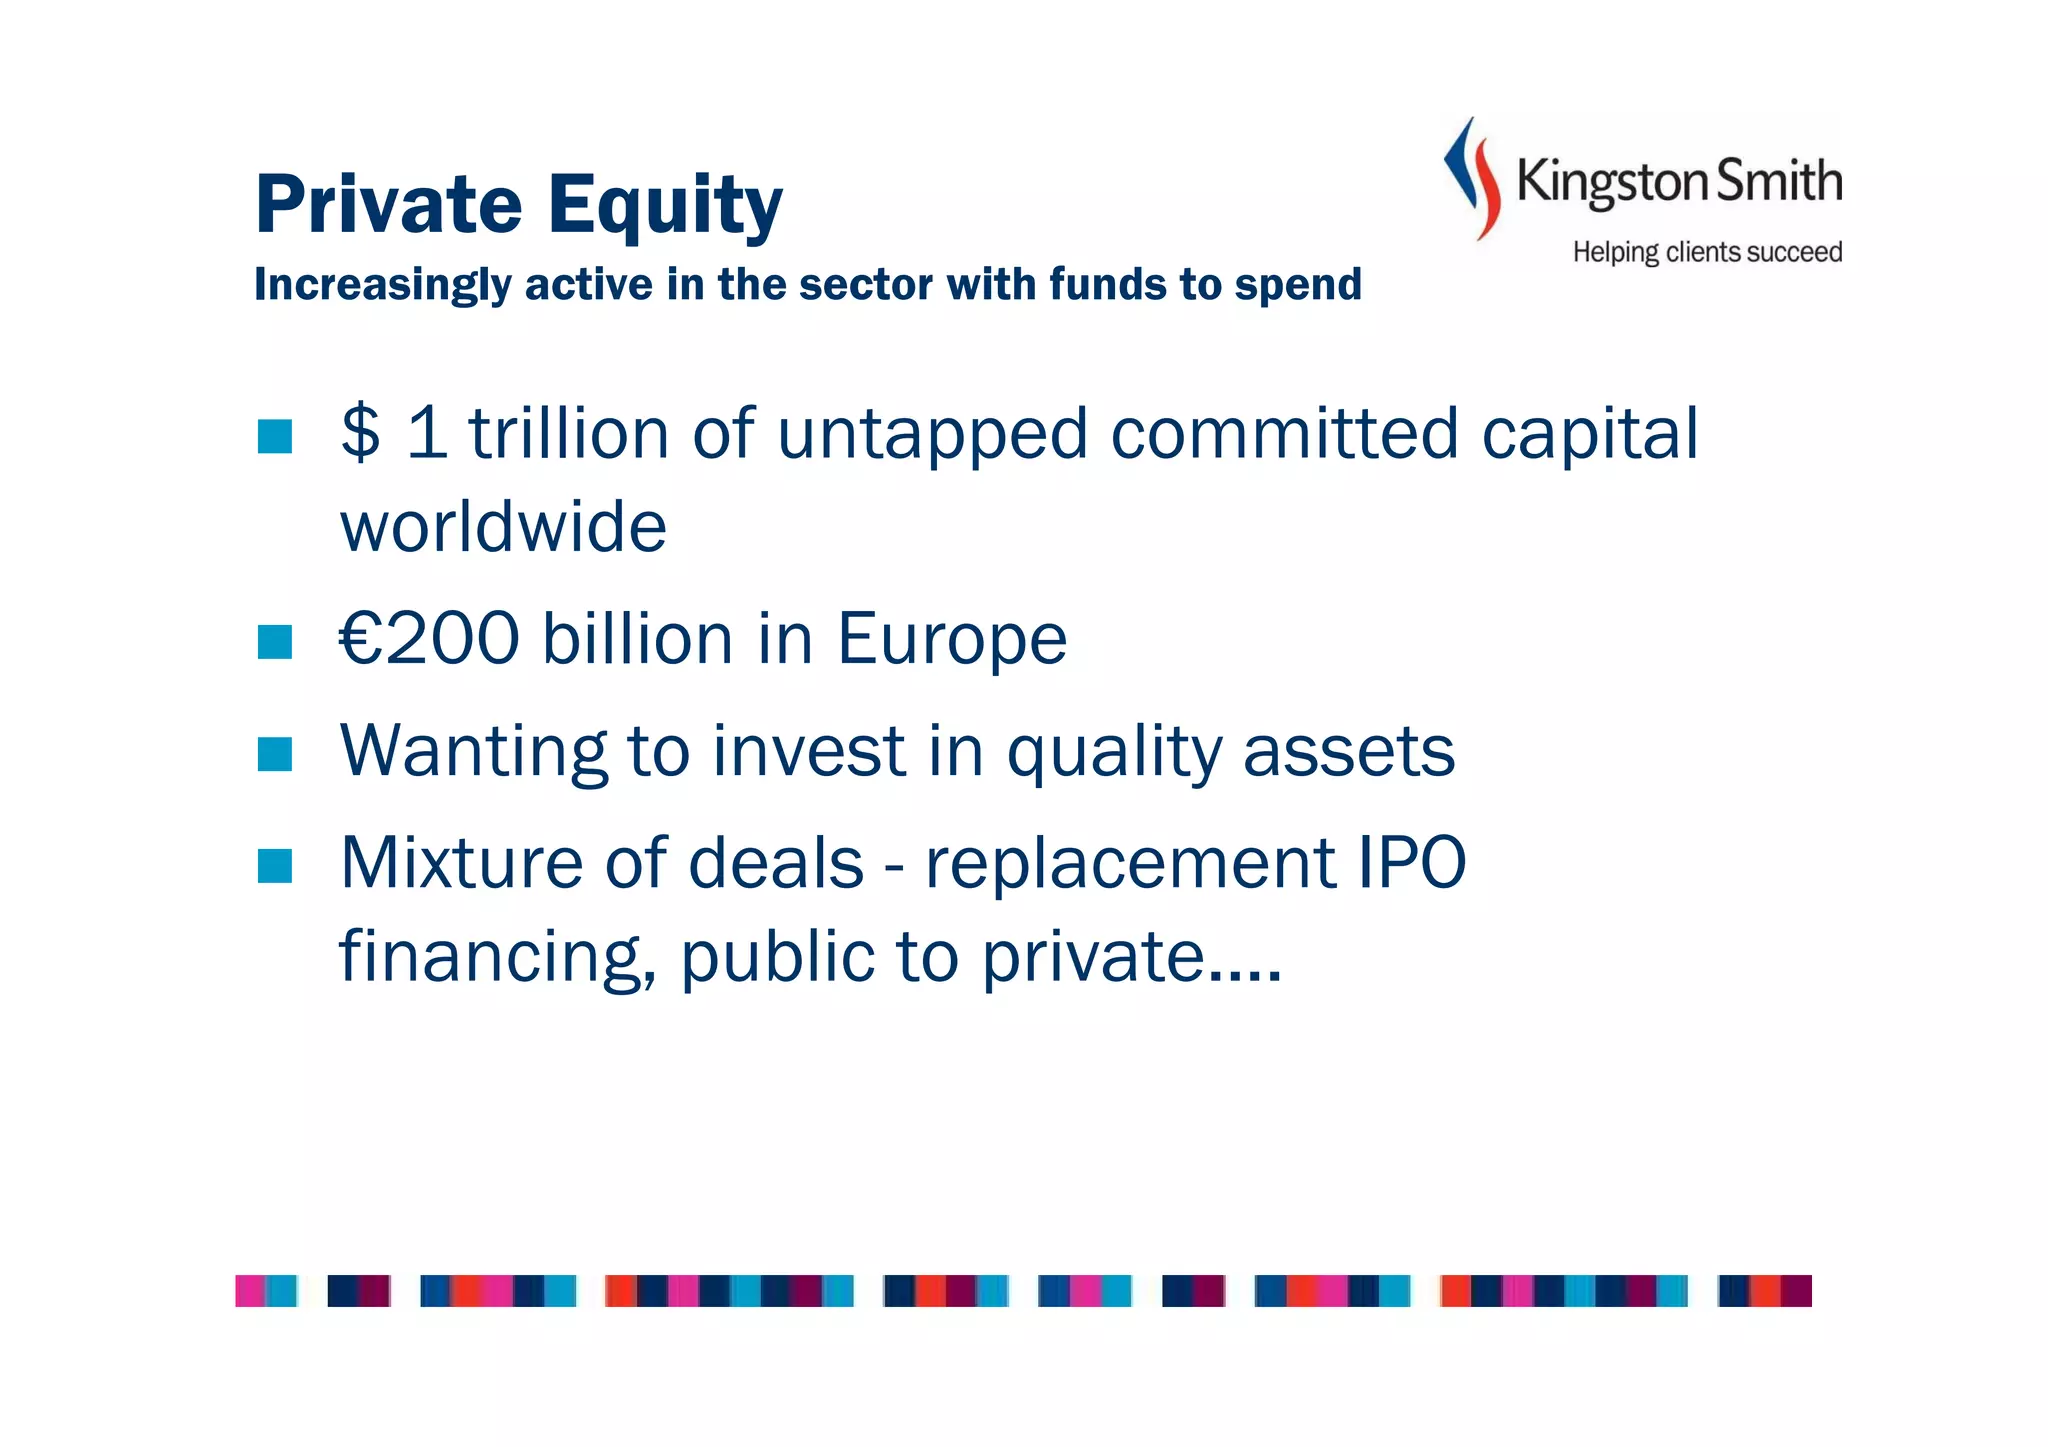
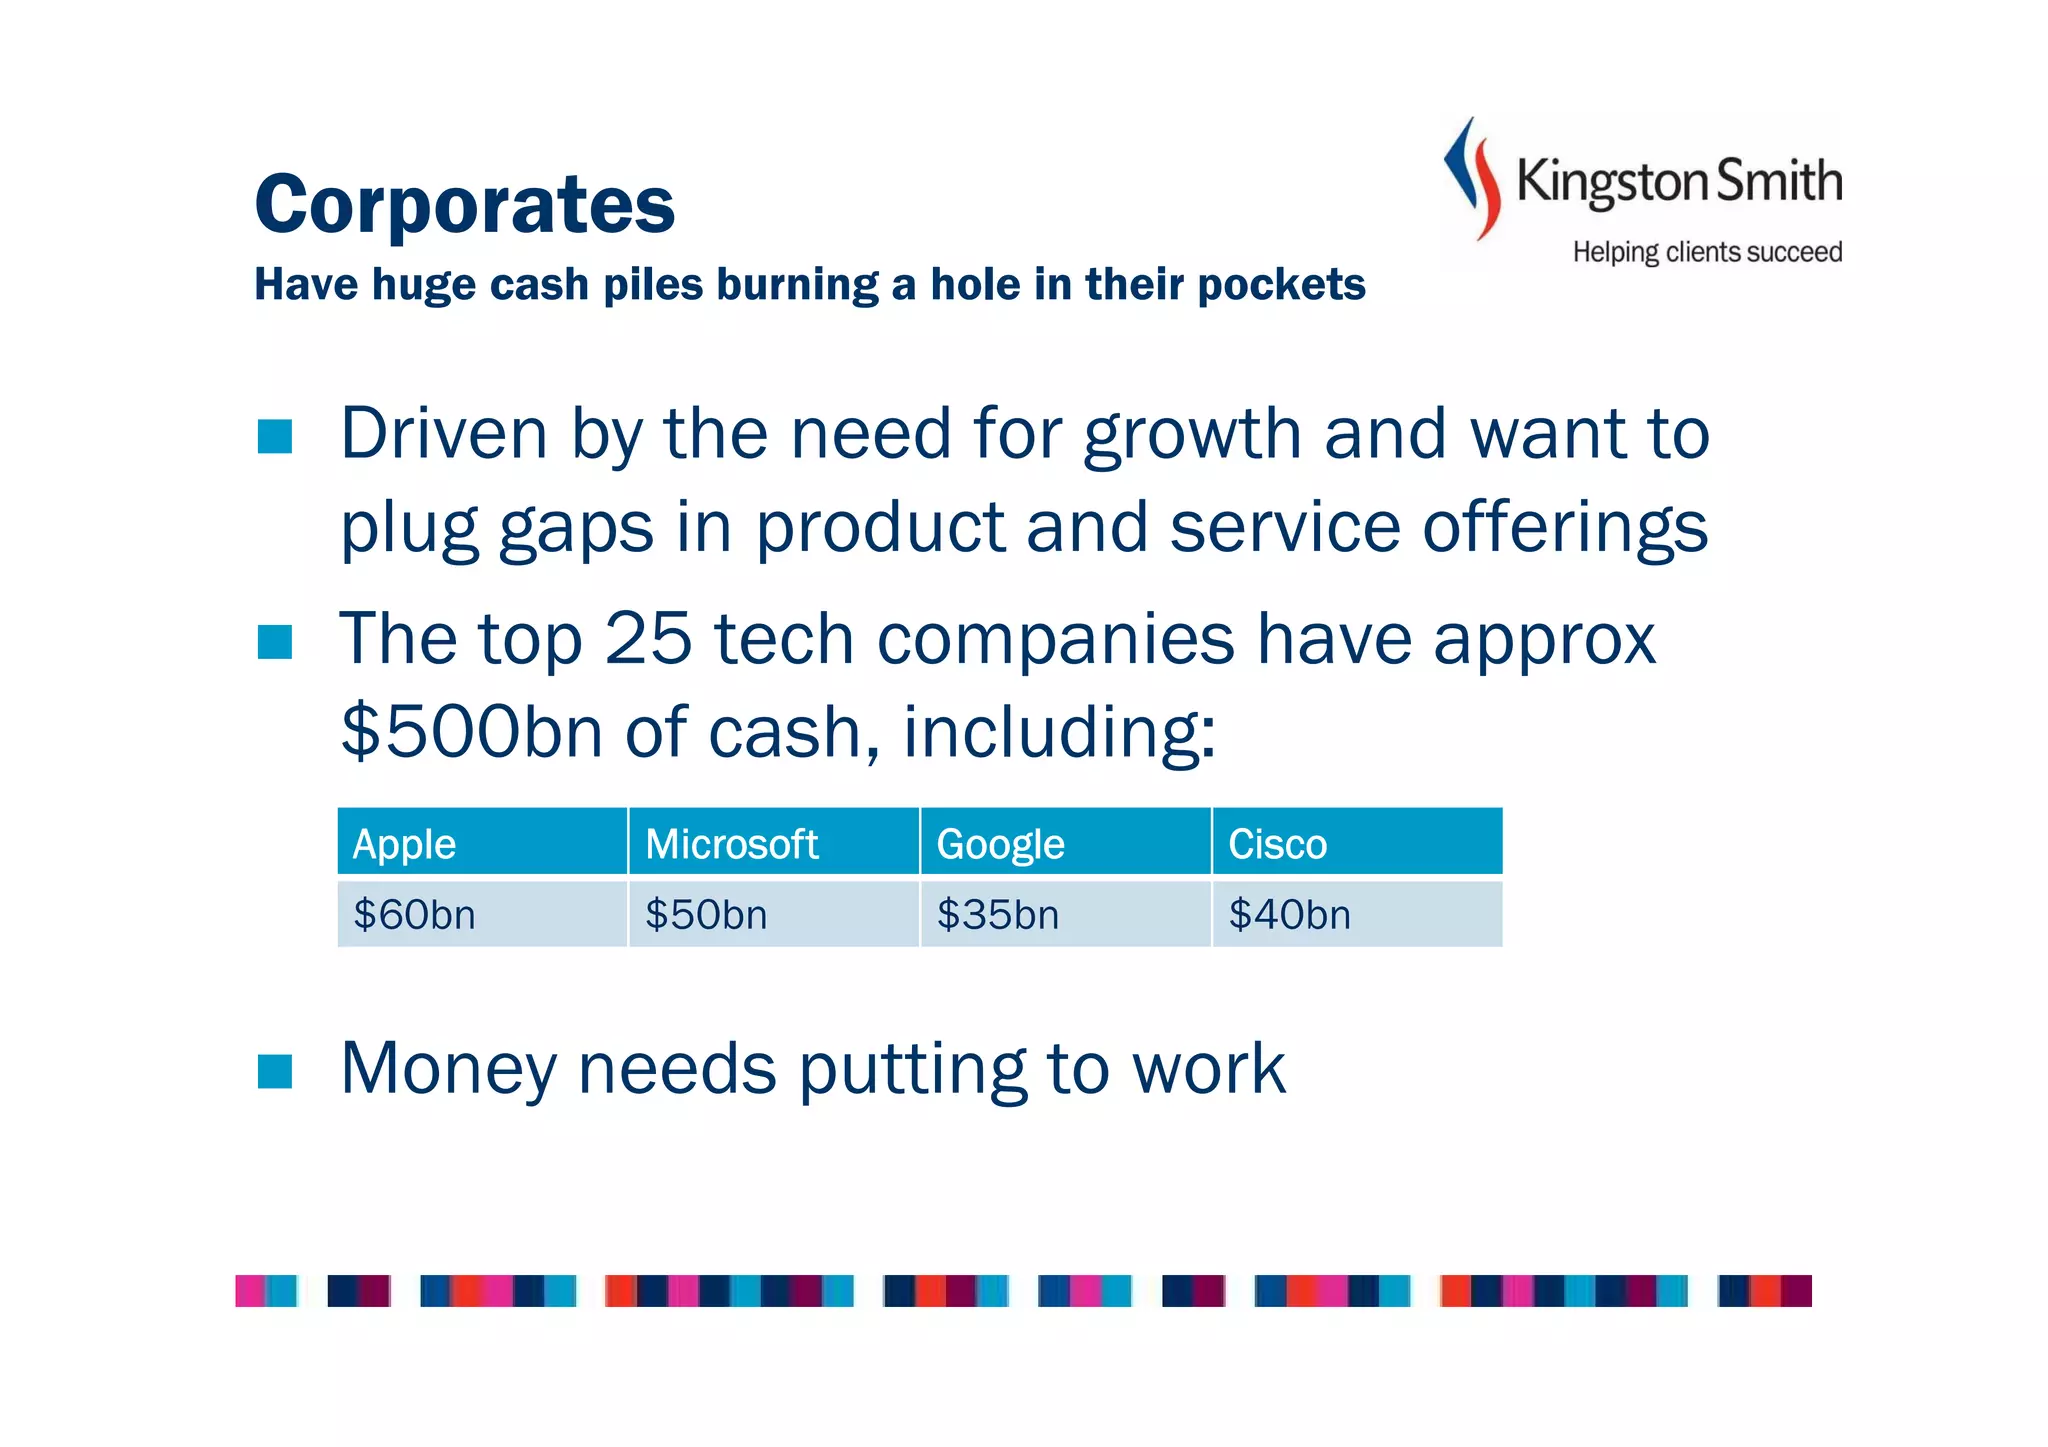
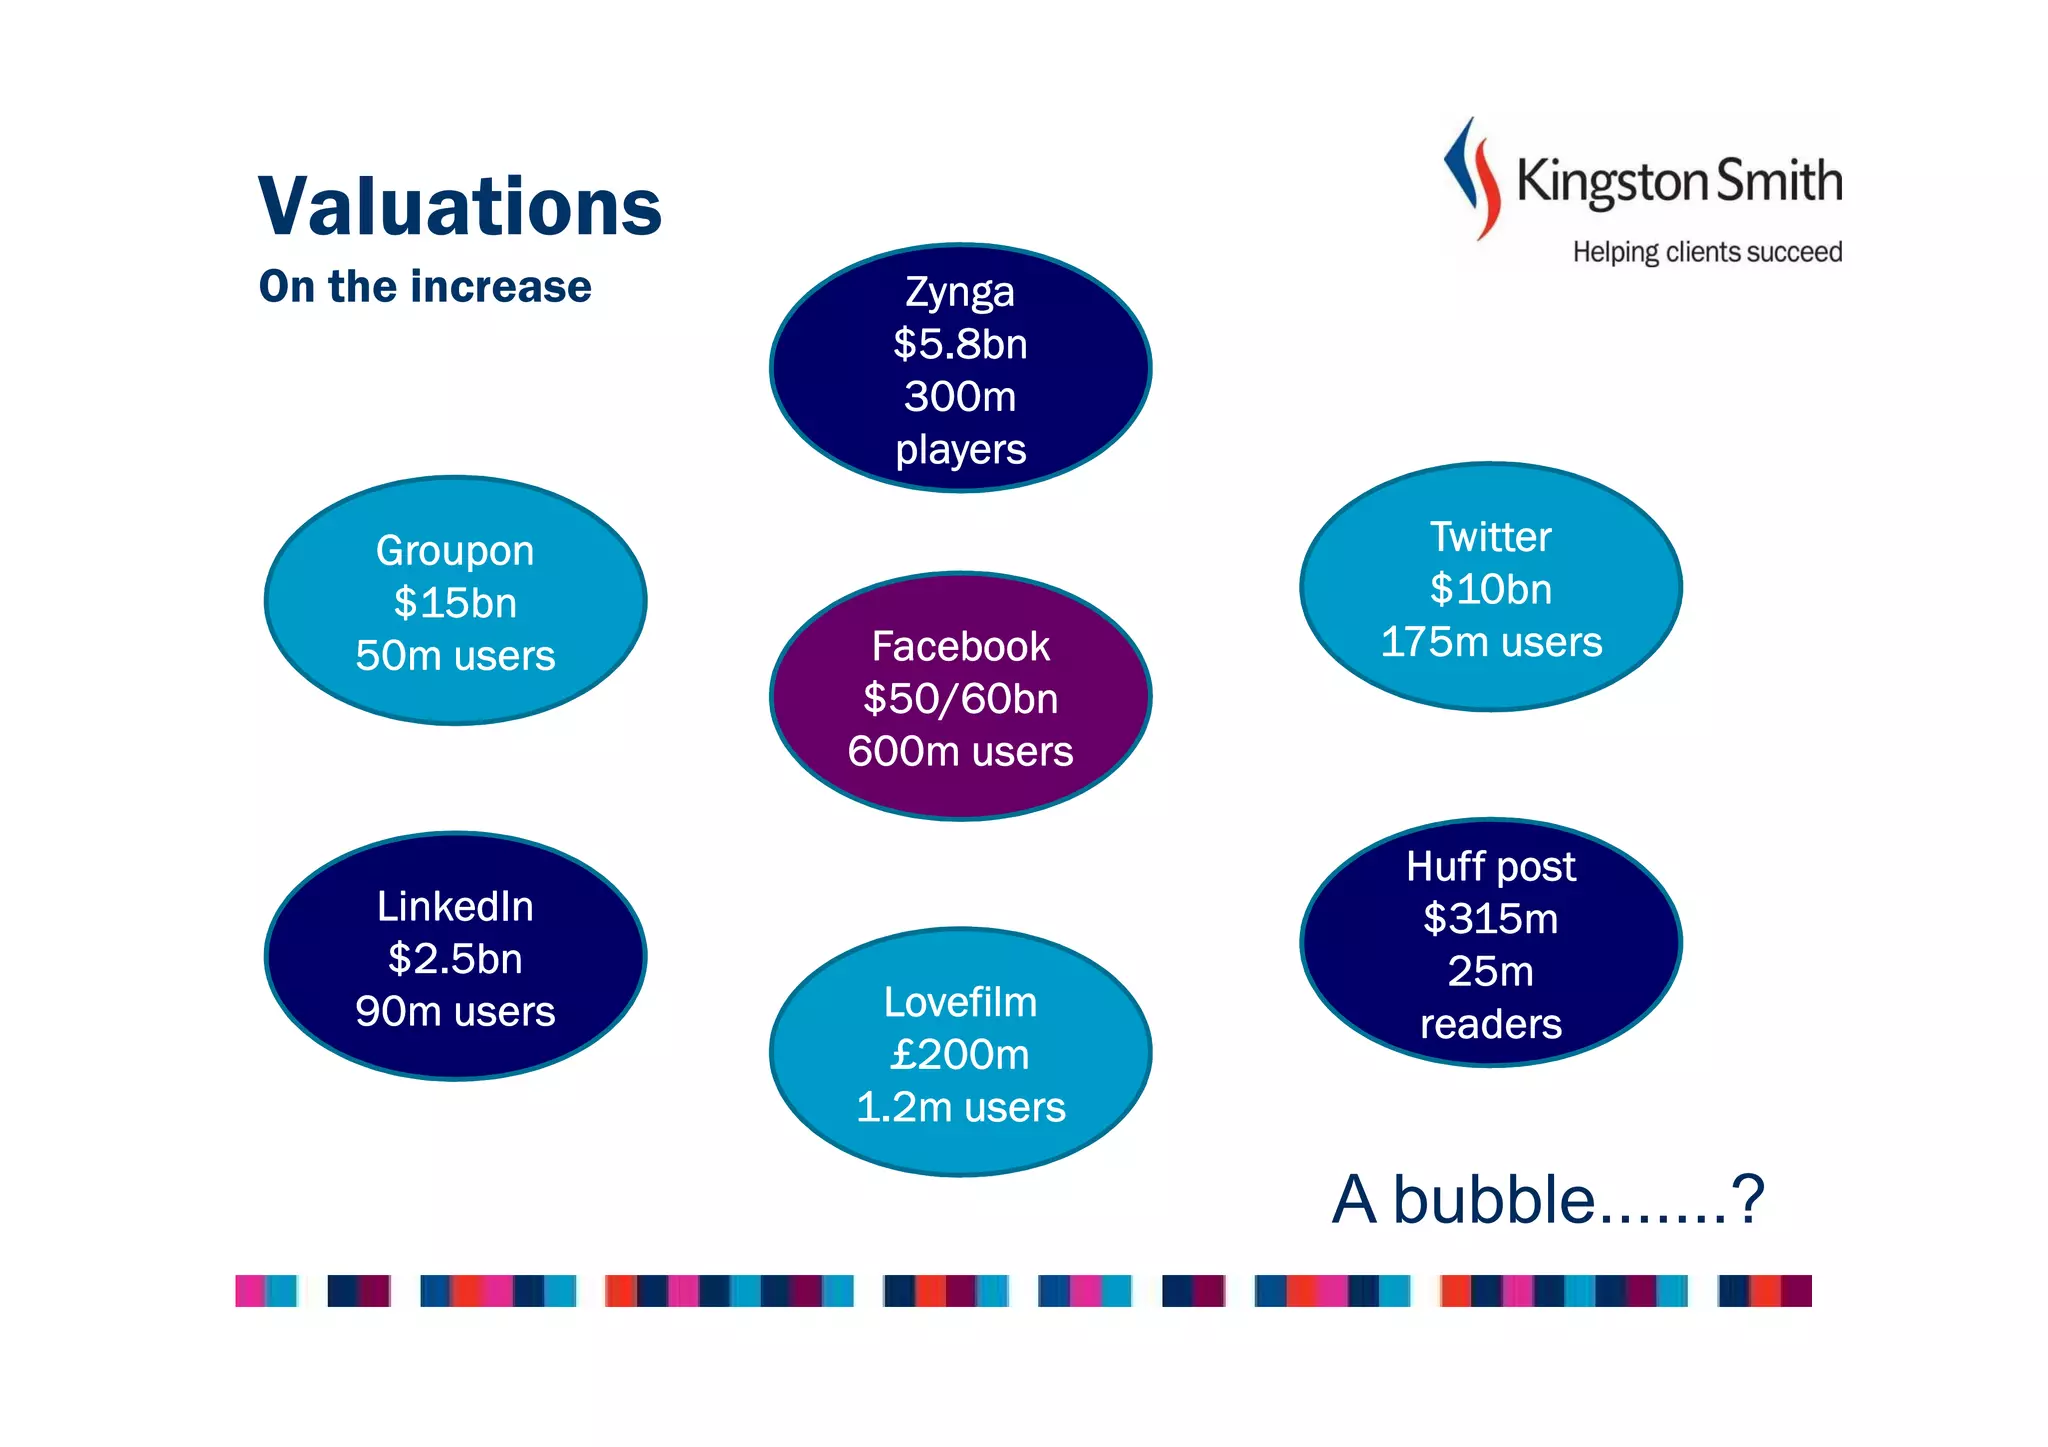
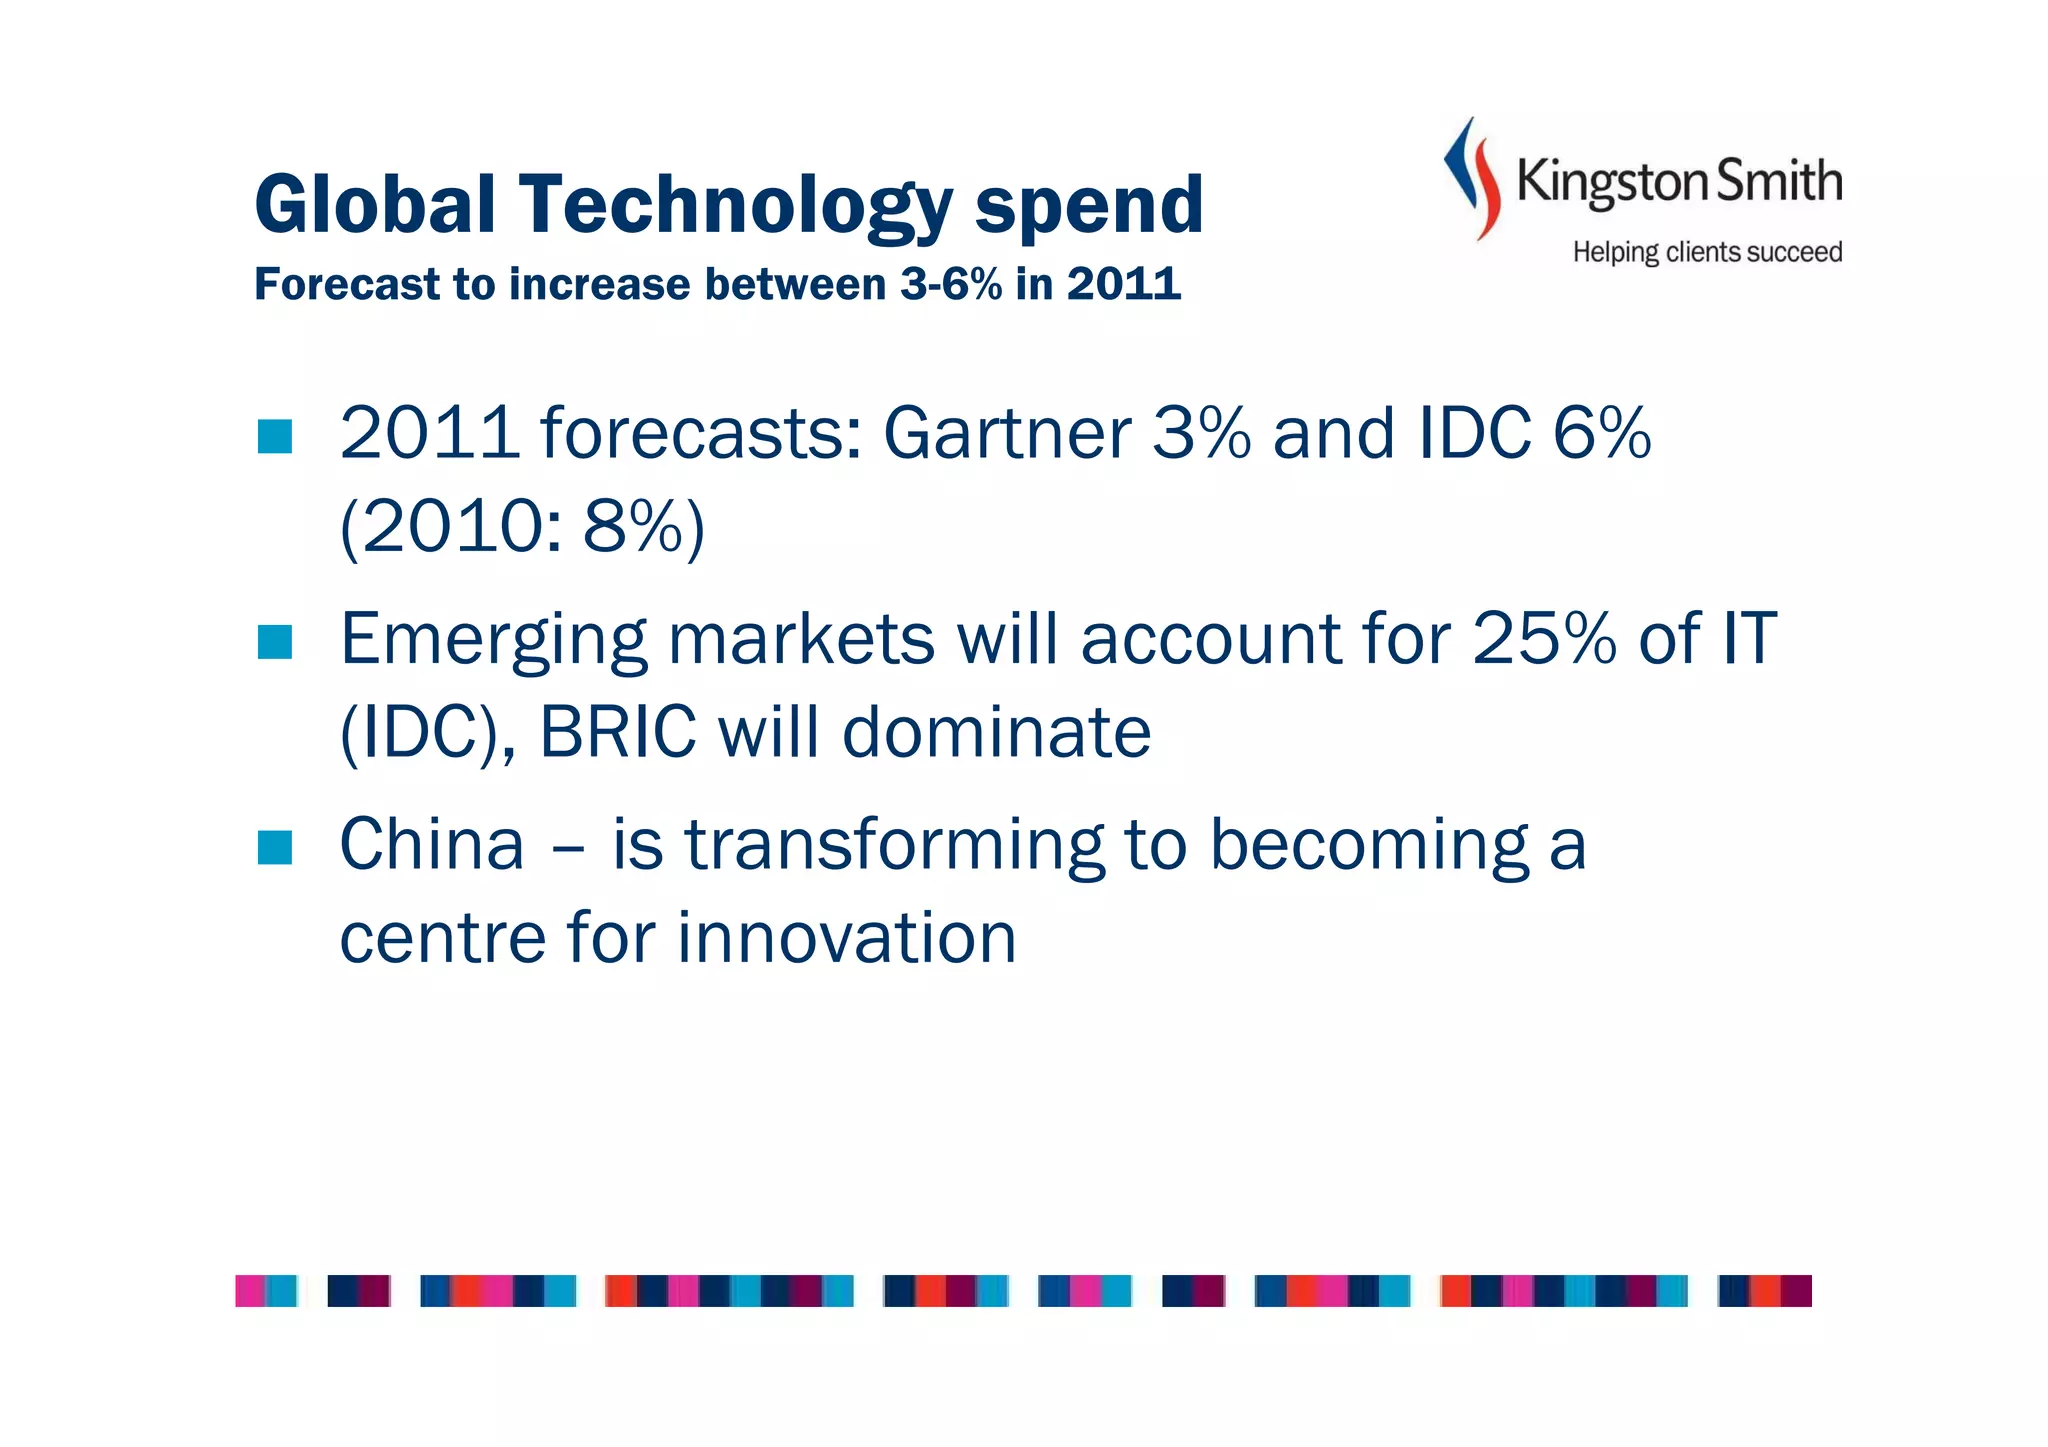
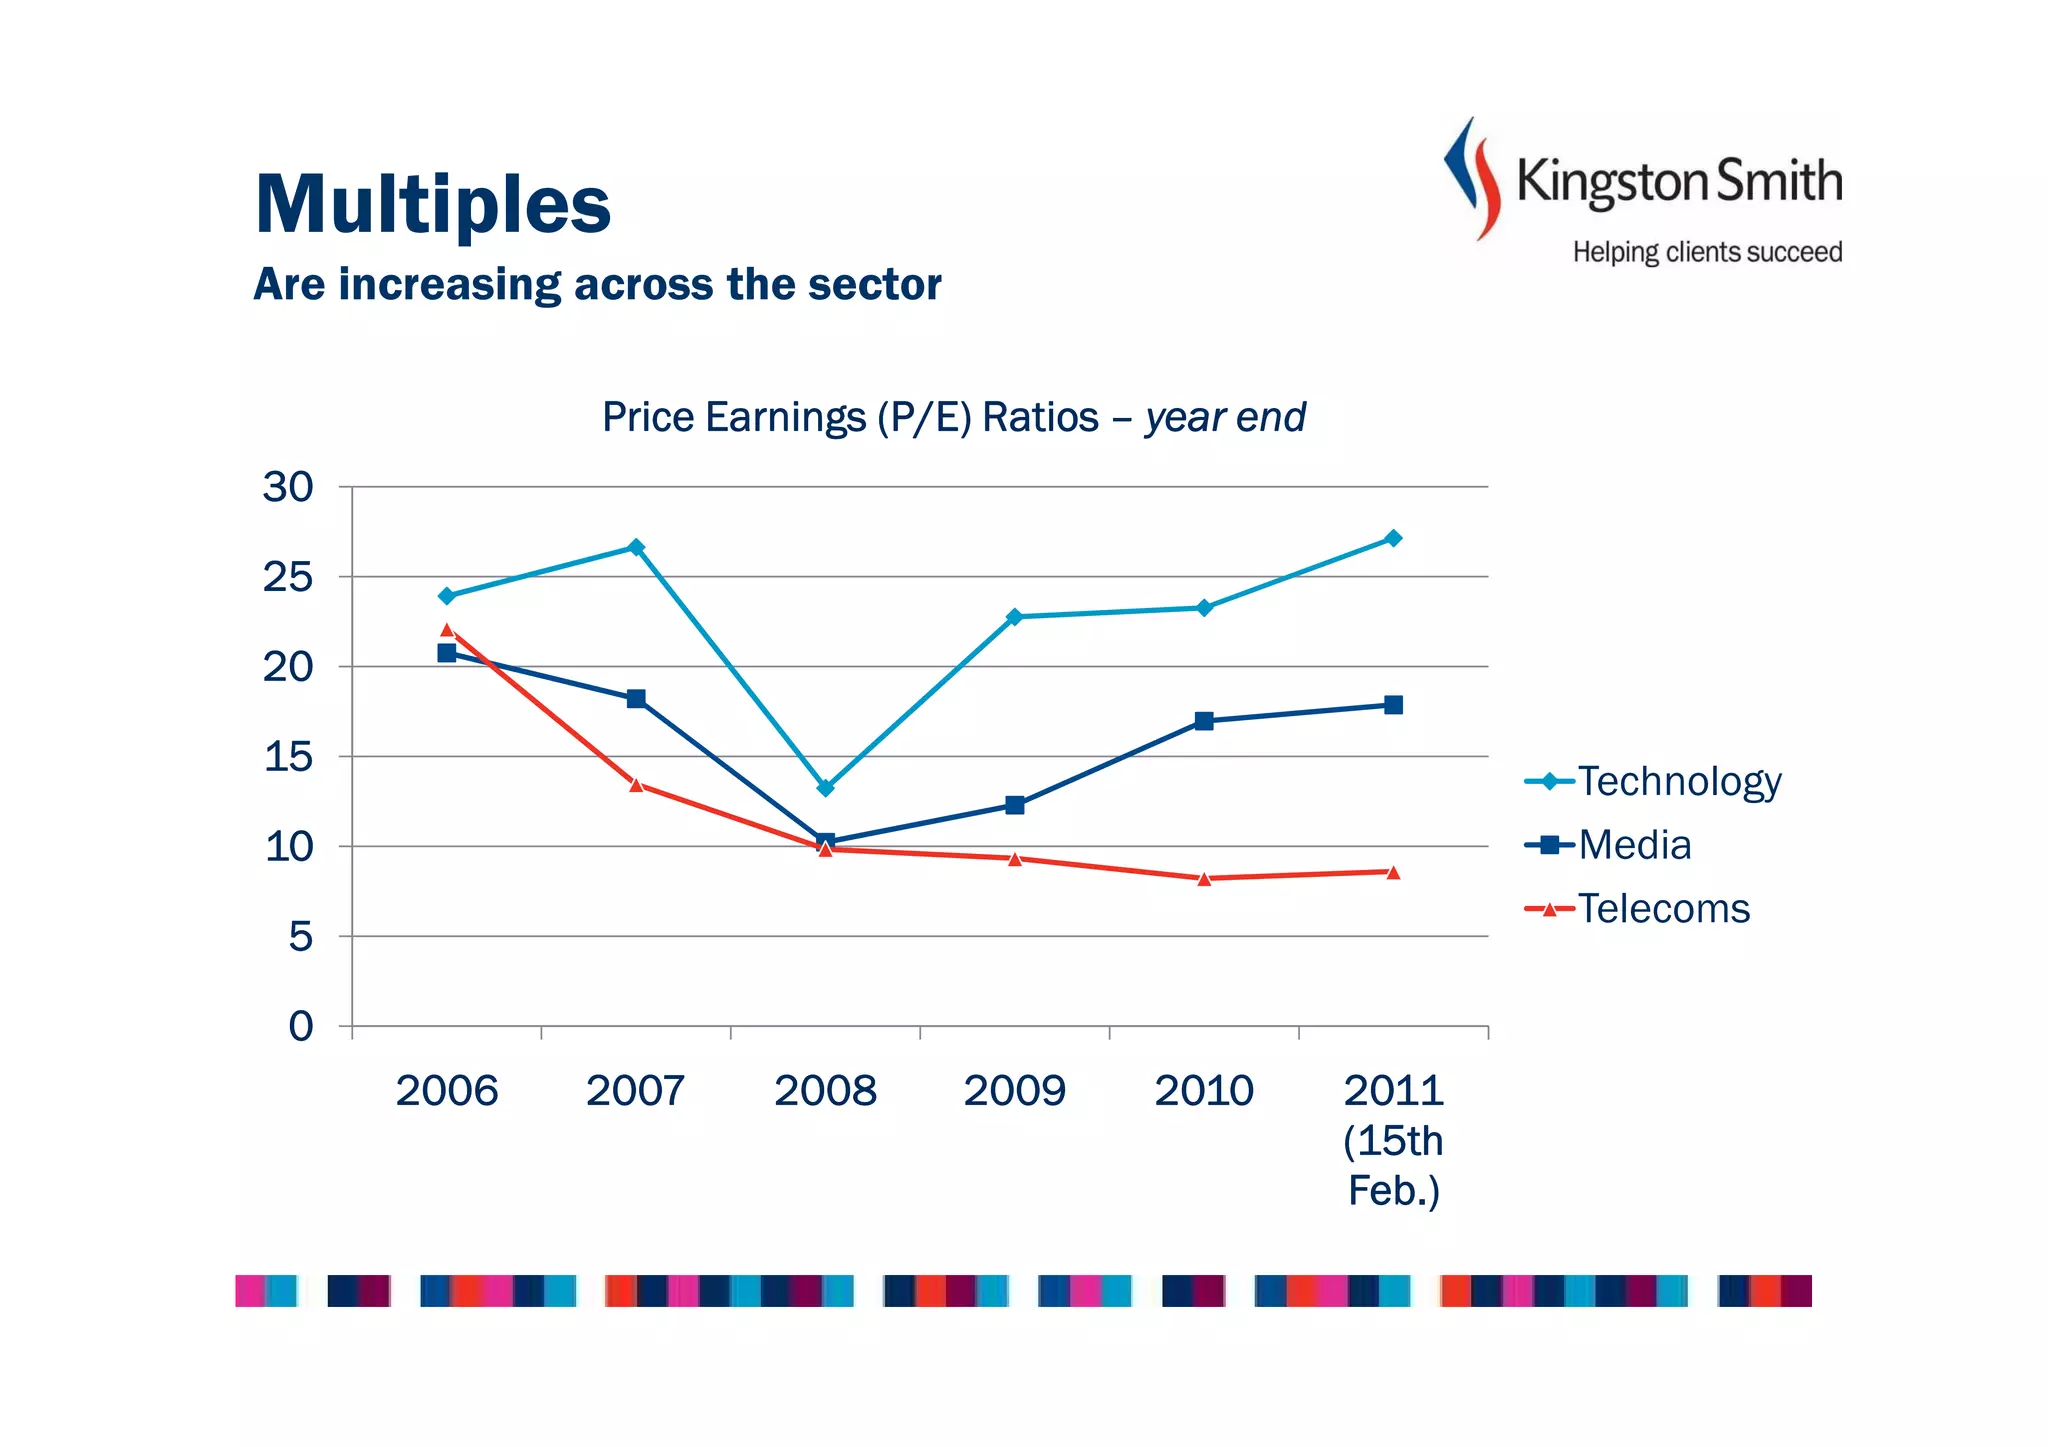
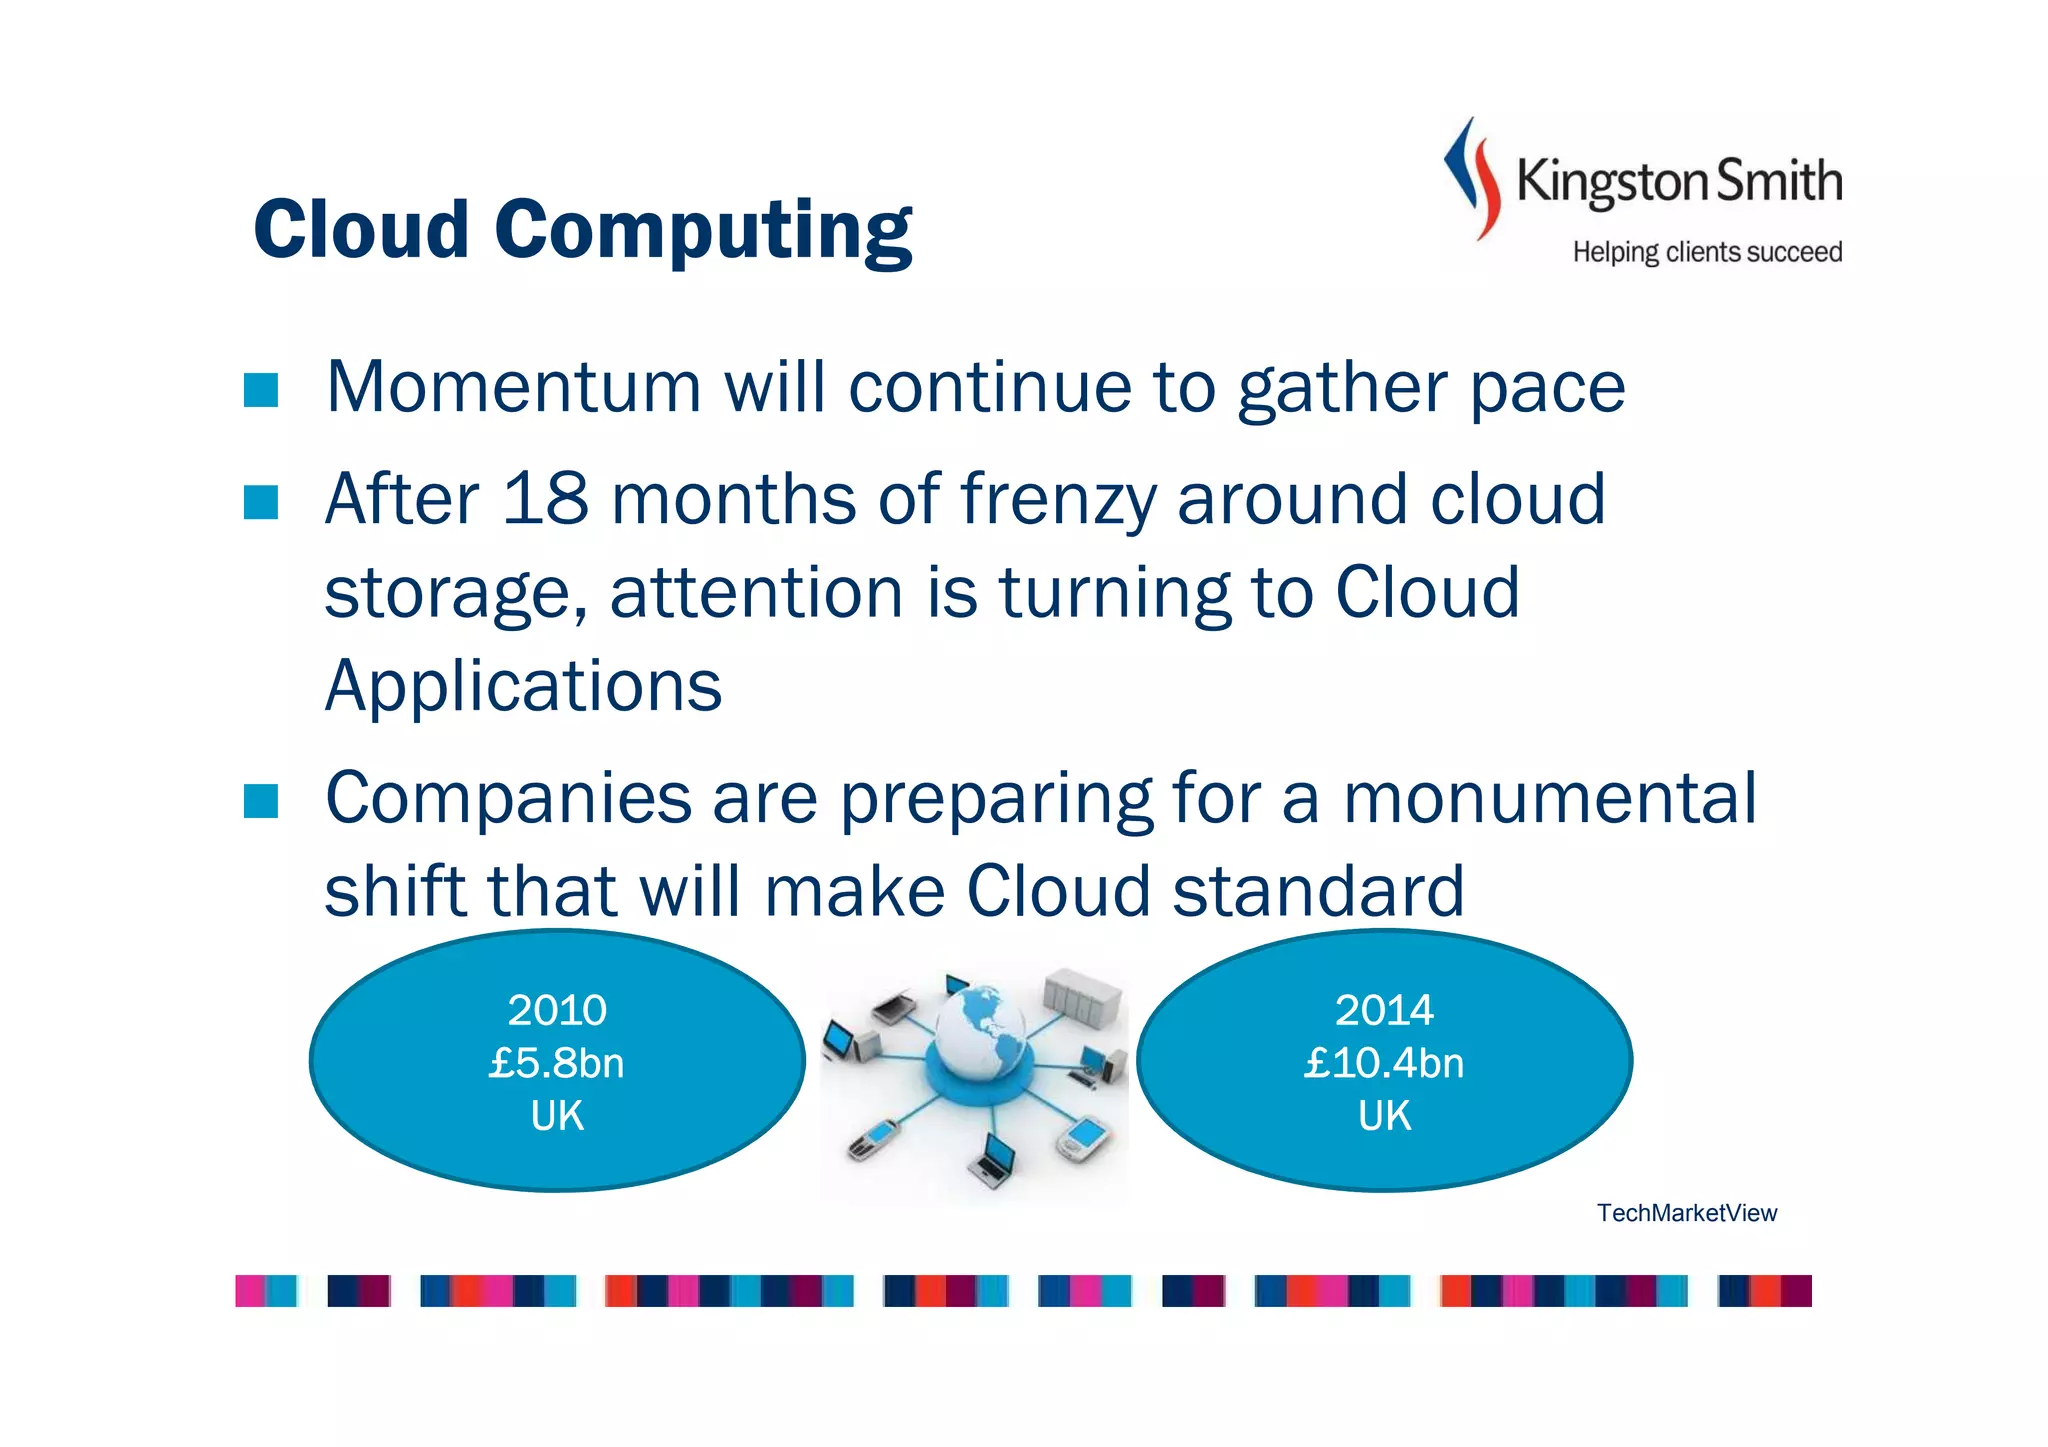
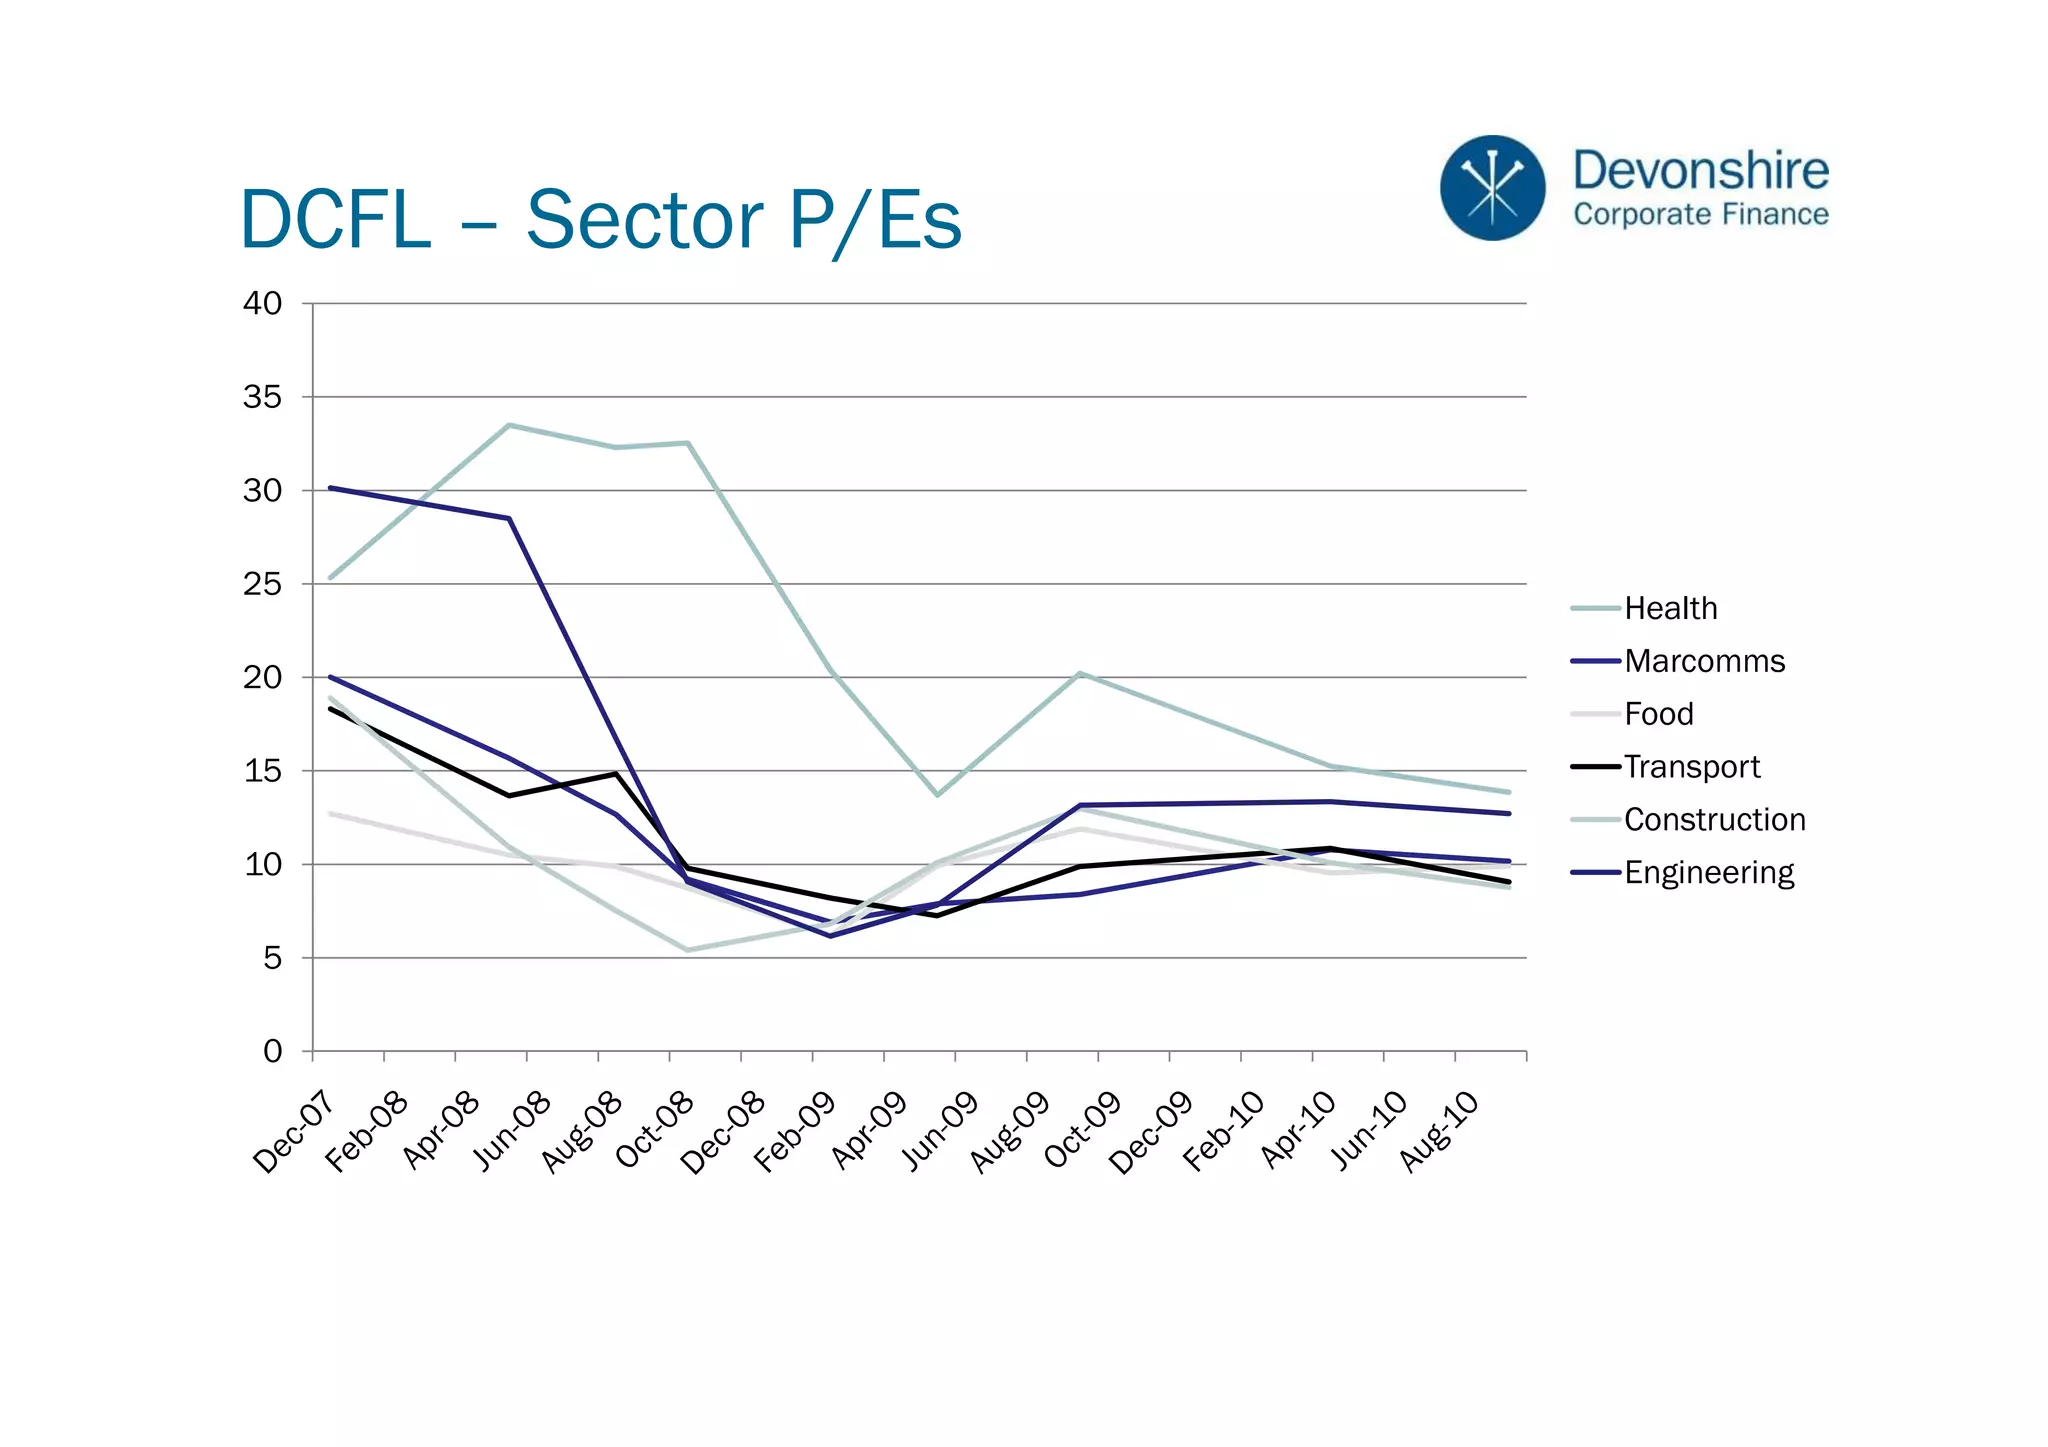
The document discusses recent trends in technology mergers and acquisitions. It notes that while the number of deals increased in 2010, volumes are still below 2005-2007 levels. Valuations are also increasing across the sector as shown by rising price-earnings ratios. Private equity funds and corporate cash reserves are driving deal activity in 2011 as buyers seek to invest funds and plug gaps in offerings. The outlook is positive for technology M&A in 2011, driven by cash availability, recovering credit markets, and a focus on fast growing areas like mobility, social networks, and cloud computing.


![Case study-S Limited - Digital agency
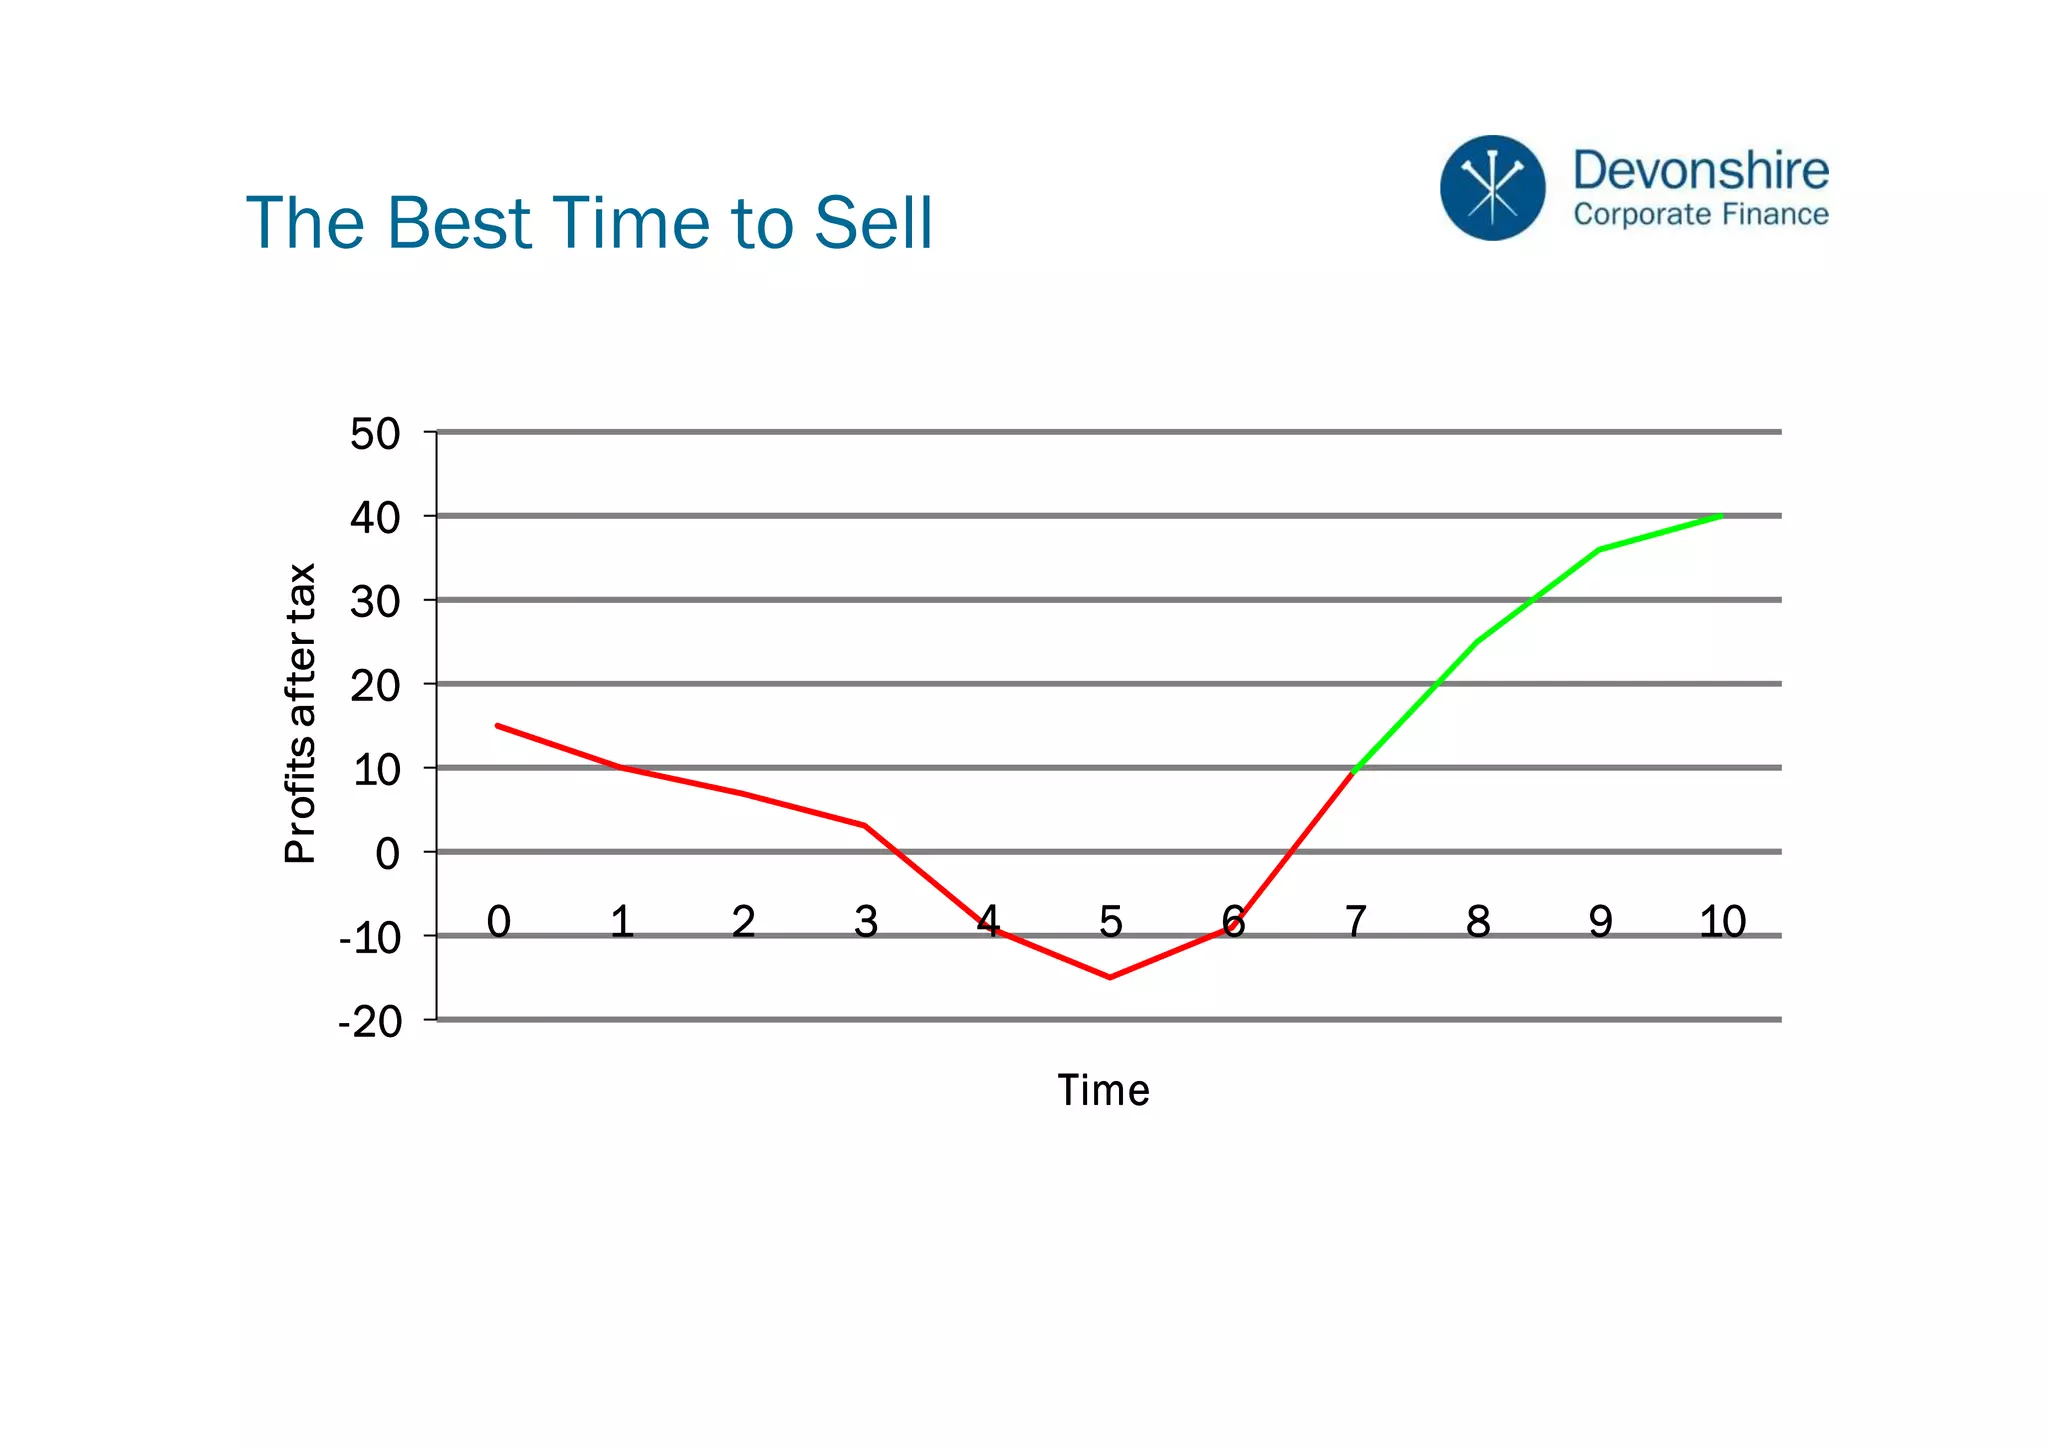
No pressure on sale – realised opportunity
Expected commitment post sale
EBIT on an upward curve
Characteristics:
◦ Geography
◦ Expertise
◦ New market entrant
◦ Growth
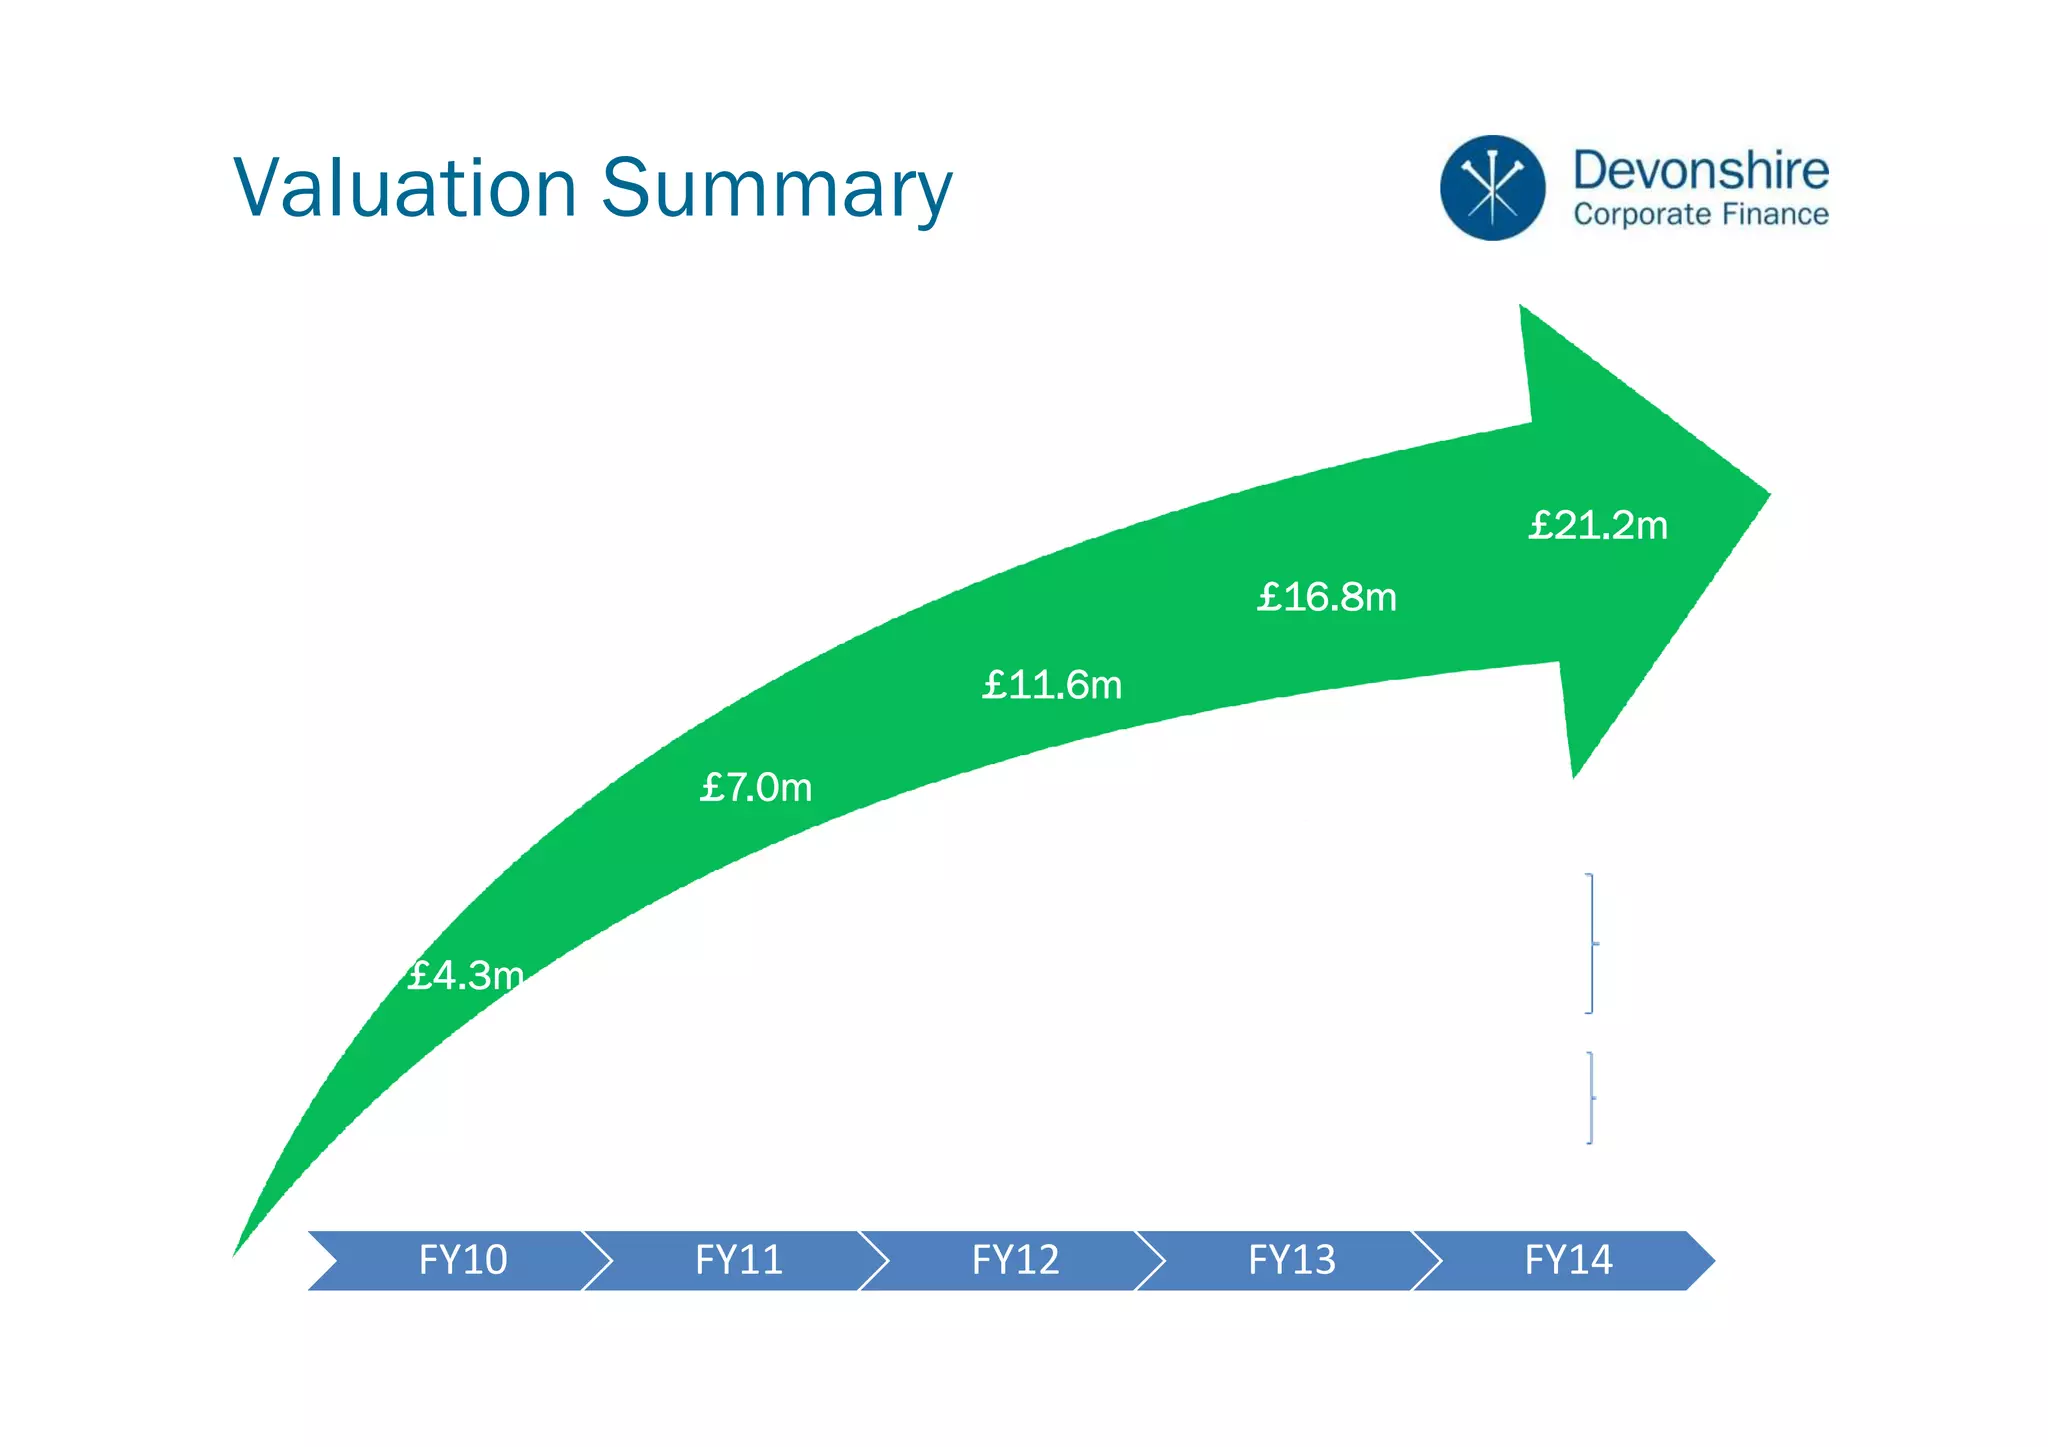
Negotiated valuation of up to £10m [30x historic 10.5x
current run rate]](https://image.slidesharecdn.com/maximisingthevalueofyourbusinesspresentation-110217111749-phpapp02/75/Maximising-the-value-of-your-business-presentation-40-2048.jpg)


![[Challenge:Future] A simple framework for better businesses](https://cdn.slidesharecdn.com/ss_thumbnails/challengefuture-a-simple-framework-for-better-businesses1520-130228014335-phpapp01-thumbnail.jpg?width=640&height=640&fit=bounds)


