This document discusses MATLAB commands for plotting graphs and formatting text output. It introduces:
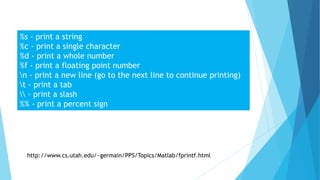
1) Format specifiers like %s, %c, %d, %f for printing strings, characters, integers, and floating point numbers.
2) Commands like \n, \t for new lines and tabs when printing.
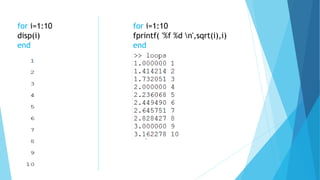
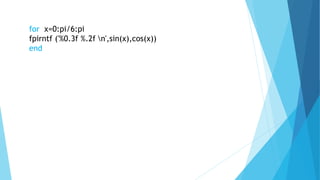
3) A for loop example to print the square root and integer of numbers from 1 to 10.
4) Plotting sin and cos graphs in 2D using different colors and line styles.
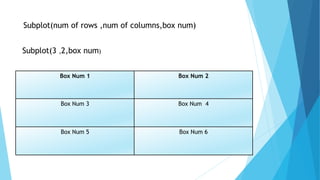
5) Using subplot to display multiple graphs in a figure.
6) Creating 3D line and mesh plots with labels and titles.
![x=[0:pi/60:2*pi]
y=sin(x)
z=cos(x)
plot(x,y,'green .')
>Colour
Black
blue
cyan
green …
>Style
Single sign
pulse sign
circle
square
dianmond
+,>,.,-,--
,o,d,p,x,h](https://image.slidesharecdn.com/matlablec2-201023155226/85/Matlab-introduction-5-320.jpg)
![Ex:2
x=[0:pi/60:2*pi]
y=sin(x)
z=cos(x)
plot(x,y,'green -')
hold
plot(x,z,'blue -')
x=[0:pi/60:2*pi]y=sin(x)
z=cos(x)
plot(x,y,'green -',x,z,'blue -')](https://image.slidesharecdn.com/matlablec2-201023155226/85/Matlab-introduction-6-320.jpg)
![x=[0:pi/60:2*pi]
y=sin(x)
z=cos(x)
plot(x,y,'green -',x,z,'blue -')
legend('sing(x)','cos(x)')
grid on
xlabel('X Axis')
ylabel('Y Axis')
title('Graph test 2D')](https://image.slidesharecdn.com/matlablec2-201023155226/85/Matlab-introduction-7-320.jpg)
![x=[0:pi/60:2*pi];
y=sin(x);
z=cos(x);
subplot(3,2,1);
plot(x,y,'green -')
grid
subplot(3,2,4);
plot(x,z,'blue -')
grid](https://image.slidesharecdn.com/matlablec2-201023155226/85/Matlab-introduction-9-320.jpg)
![x=[-8:0.05:8]
y=x
r=sqrt(x.^2+y.^2);
z=sin(r)./r;
plot3(x,y,z,'m -');
title('3D Line Graph')
xlabel('X axis')
ylabel('Y axis')
zlabel('Z axis')](https://image.slidesharecdn.com/matlablec2-201023155226/85/Matlab-introduction-10-320.jpg)
![x=[-8:0.05:8]
y=x
[x,y]=meshgrid(x,y)
r=sqrt(x.^2+y.^2);
z=sin(r)./r;
mesh(x,y,z);
title('3D graph')
xlabel('X axis')
ylabel('Y axis')
zlabel('Z axis')](https://image.slidesharecdn.com/matlablec2-201023155226/85/Matlab-introduction-11-320.jpg)