Download to read offline


![Graph
Chart 3
90000000
67500000
]
45000000
22500000
0 Year
0 50 100 150 200
Prediction-2,980,0
83](https://image.slidesharecdn.com/mathproject-110604131913-phpapp02/85/Math-project-9-320.jpg)


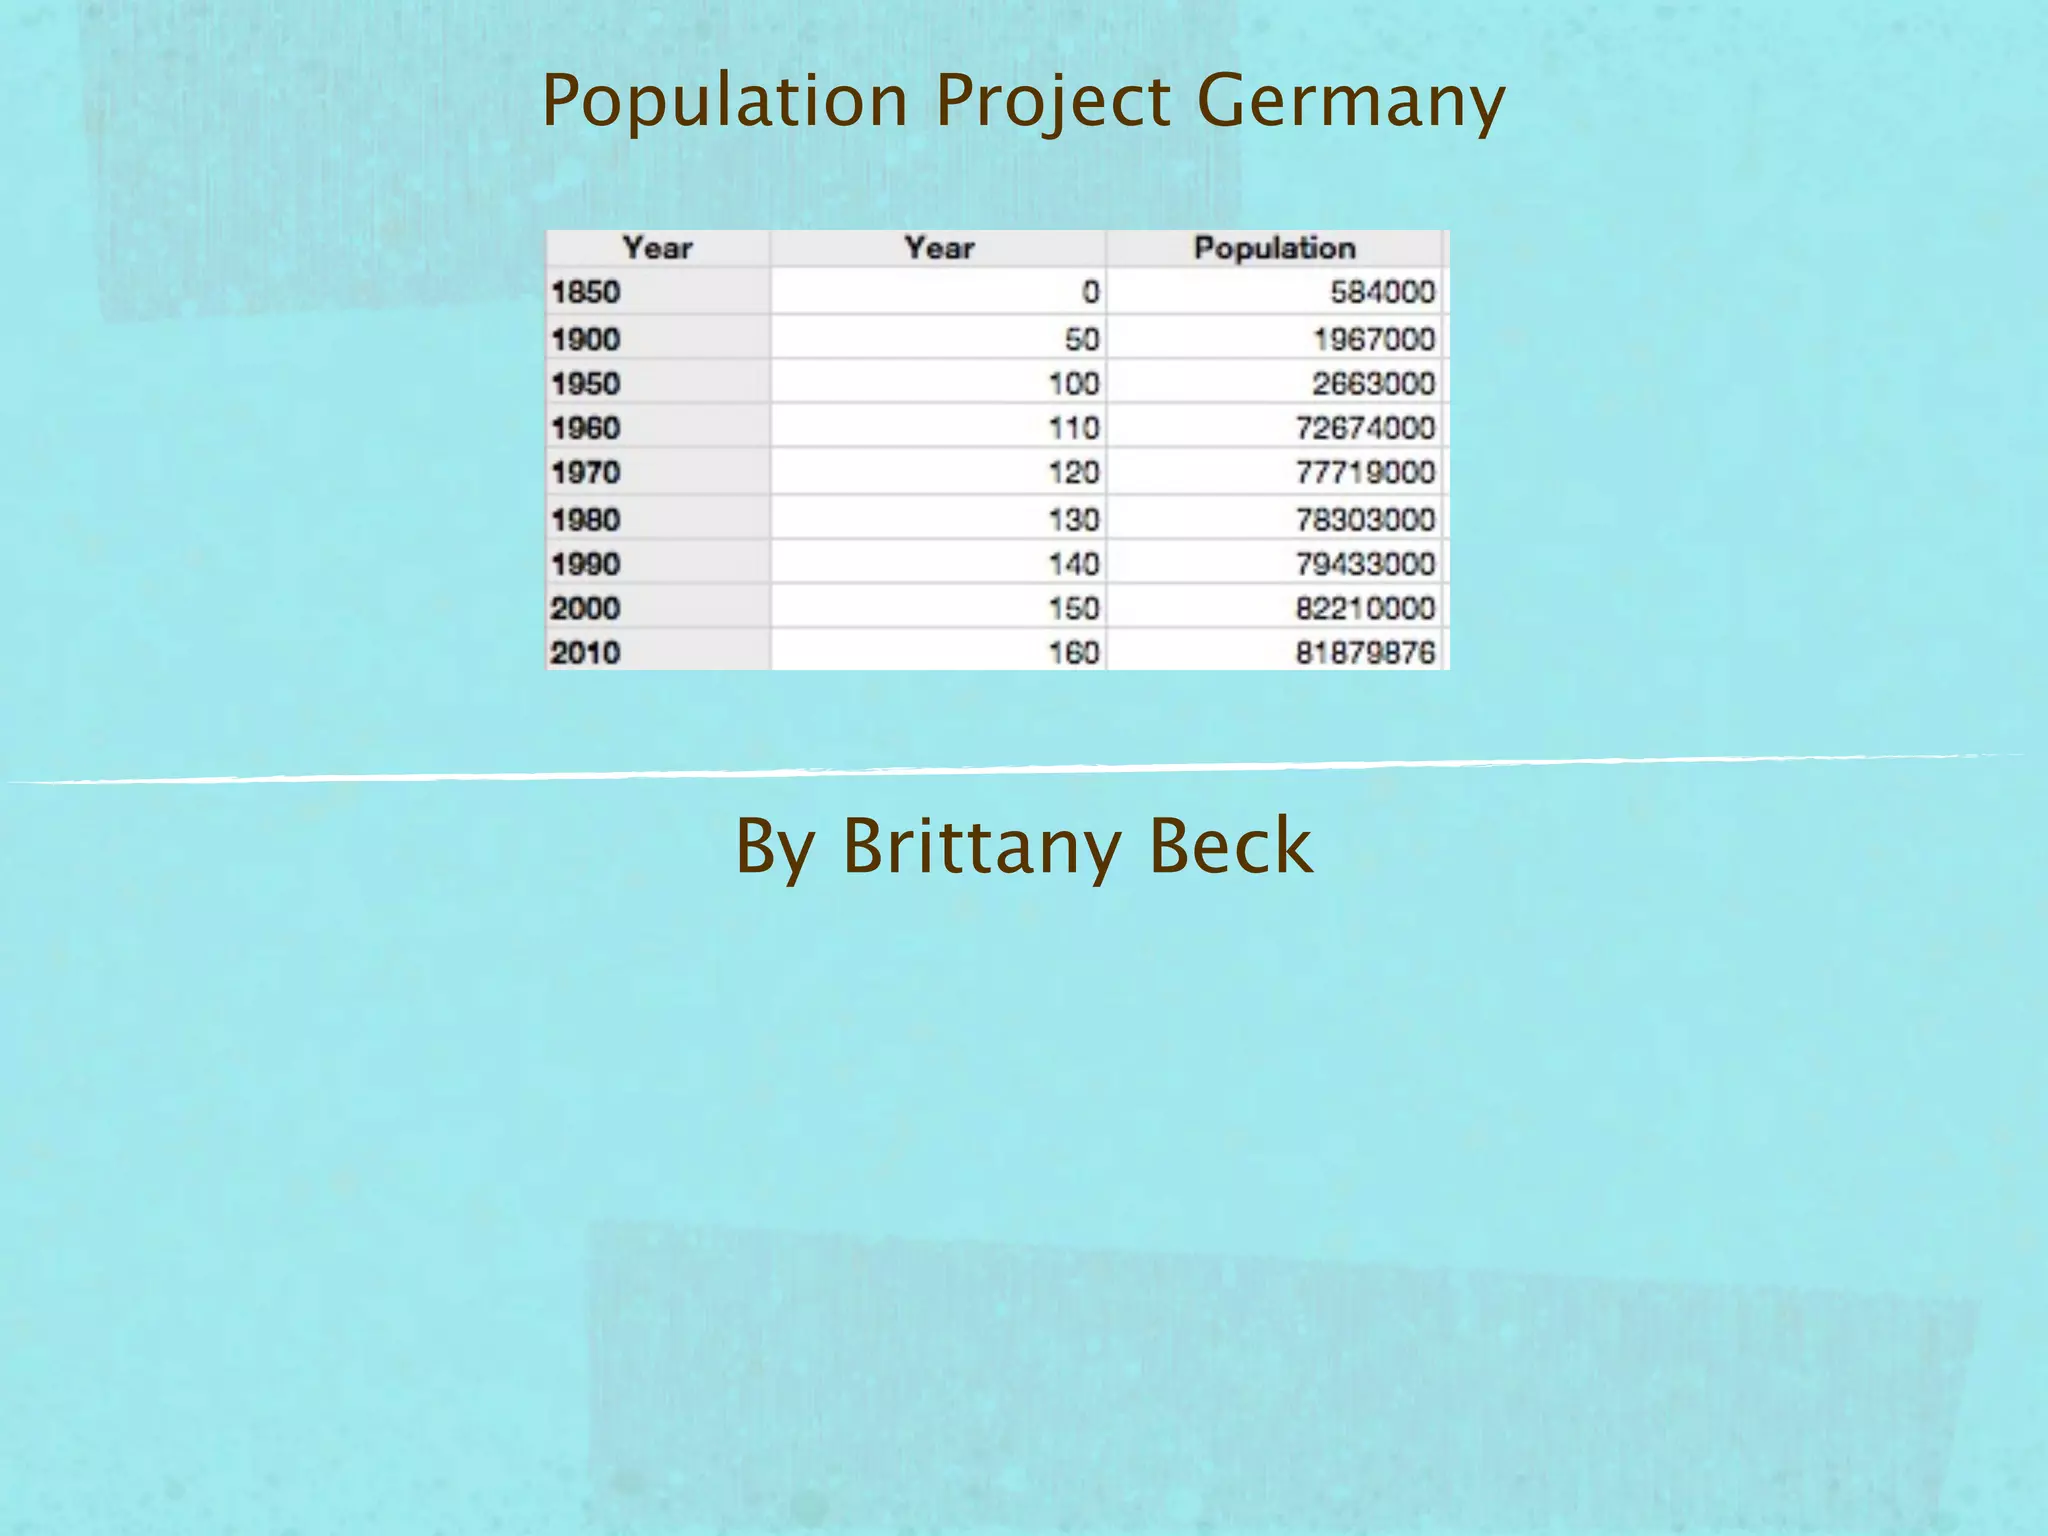
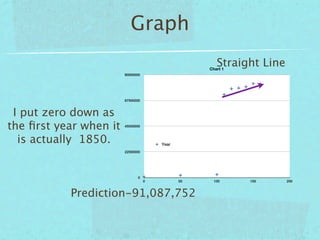
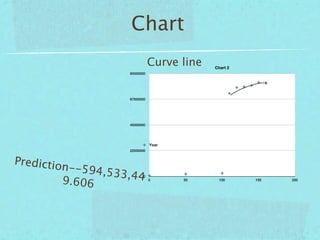
The document discusses population projections for Germany using different mathematical models: 1) A linear equation is used to project a population of 91,087,752 people in the year 2000 based on population data from 1850 to 1950. 2) A quadratic equation fits the data better and projects a population of 594,533,449.606 people in 2000. 3) A logarithmic equation provides an even better fit to the data and projects a population of 2,980,083 people in 2000. Each model provides a different prediction because different equations model population growth in different ways.