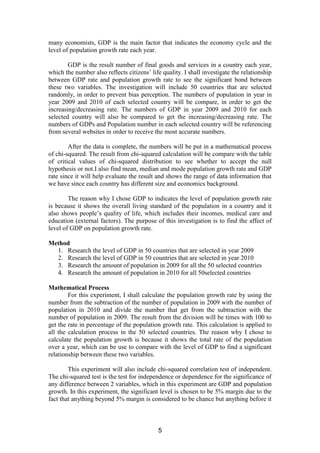
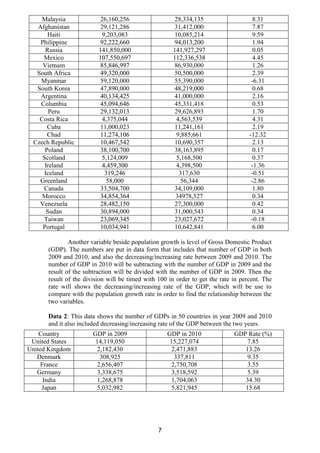
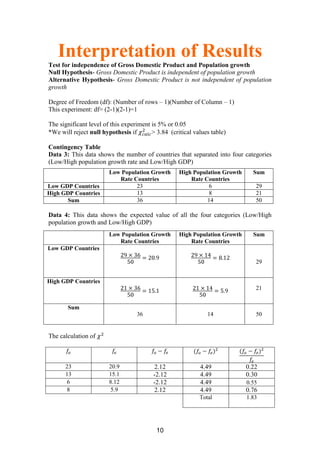
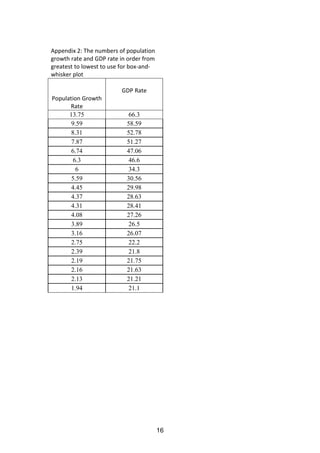
Population Growth
An investigation on population growth by external factor,
  which in this case is Gross Domestic Product (GDP)


                     IB Math Studies


           School: International School Bangkok
                Word Counts: 2251 words


                            3
Contents


 Introduction, Methods and Mathematical Processes- … Page 3


Mathematical Processes and Data 1- ........................... Page 4


Data 2- ........................................................................ Page 5-6


Interpretation of Results- ............................................... Page 8


Overall Conclusion ........................................................ Page 12


Bibliography- ................................................................ Page 13


Appendix- ..................................................................... Page 14


Introduction

       Population growth rate in each country is hardly predicted each year due to
several unpredictableexternal factors may impact population numbers, for example,
diseases, natural disasters, migrations and Gross Domestic Product (GDP). Based on


                                           4
many economists, GDP is the main factor that indicates the economy cycle and the
level of population growth rate each year.

        GDP is the result number of final goods and services in a country each year,
which the number also reflects citizens’ life quality. I shall investigate the relationship
between GDP rate and population growth rate to see the significant bond between
these two variables. The investigation will include 50 countries that are selected
randomly, in order to prevent bias perception. The numbers of population in year in
year 2009 and 2010 of each selected country will be compare, in order to get the
increasing/decreasing rate. The numbers of GDP in year 2009 and 2010 for each
selected country will also be compared to get the increasing/decreasing rate. The
numbers of GDPs and Population number in each selected country will be referencing
from several websites in order to receive the most accurate numbers.

        After the data is complete, the numbers will be put in a mathematical process
of chi-squared. The result from chi-squared calculation will be compare with the table
of critical values of chi-squared distribution to see whether to accept the null
hypothesis or not.I also find mean, median and mode population growth rate and GDP
rate since it will help evaluate the result and shows the range of data information that
we have since each country has different size and economics background.

        The reason why I chose GDP to indicates the level of population growth rate
is because it shows the overall living standard of the population in a country and it
also shows people’s quality of life, which includes their incomes, medical care and
education (external factors). The purpose of this investigation is to find the affect of
level of GDP on population growth rate.

Method
  1. Research the level of GDP in 50 countries that are selected in year 2009
  2. Research the level of GDP in 50 countries that are selected in year 2010
  3. Research the amount of population in 2009 for all the 50 selected countries
  4. Research the amount of population in 2010 for all 50selected countries

Mathematical Process
        For this experiment, I shall calculate the population growth rate by using the
number from the subtraction of the number of population in 2009 with the number of
population in 2010 and divide the number that get from the subtraction with the
number of population in 2009. The result from the division will be times with 100 to
get the rate in percentage of the population growth rate. This calculation is applied to
all the calculation process in the 50 selected countries. The reason why I chose to
calculate the population growth is because it shows the total rate of the population
over a year, which can be use to compare with the level of GDP to find a significant
relationship between these two variables.

        This experiment will also include chi-squared correlation test of independent.
The chi-squared test is the test for independence or dependence for the significance of
any difference between 2 variables, which in this experiment are GDP and population
growth. In this experiment, the significant level is chosen to be 5% margin due to the
fact that anything beyond 5% margin is considered to be chance but anything before it


                                            5
is determined by cause. The reason why I chose to use this correlation test it gives a
     clear conclusion of the affects of GDP on the population growth.

     The numbers of population in 2009 and 2010 of each 50 countries are recorded on a
     data. The data also includes numbers of population growth rate (%). The numbers
     from both years are use to calculate the numbers of population growth rate (%) that
     are shown on the data through the math process that mentioned above.

     Data 1: The numbers of population in 2009 and 2010, and the number of calculated
     population growth rate in 50 selected countries

   Country        Amount of Population in     Amount of Population in       Population Growth
                           2009                        2010                     Rate (%)
 United States        310,232,863                 312,311,000                      0.67
United Kingdom         61,284,806                  62,435,709                      1.88
   Denmark              5,515,575                   5,564,219                      0.88
     France            64,057,792                  65,821,885                      2.75
   Germany             82,282,988                  81,751,602                     -0.65
      India          1,173,108,018               1,210,193,422                     3.16
     Japan            126,804,433                 127,950,000                      0.90
     China           1,330,141,295               1,339,724,852                     0.72
     Egypt             77,683,333                  79,089,650                      1.77
    Thailand           66,404,688                  67,041,000                      0.96
      Italy            58,090,681                  60,626,442                      4.37
   Australia           21,515,754                  22,718,381                      5.59
     Greece            10,749,943                  10,787,690                      0.35
       Iraq            29,671,605                  31,672,000                      6.74
 New Zealand            4,252,277                   4,417,600                      3.89
     Spain             40,548,753                  46,125,154                     13.75
     Brazil           201,103,330                 190,732,694                     -5.16
    Nigeria           152,217,341                 158,423,000                      4.08
    Norway              4,676,305                   4,971,100                      6.30
    Vietnam            89,571,130                  87,375,000                     -2.45
     Kenya             40,046,566                  38,610,097                     -3.59
   Indonesia          242,968,342                 237,556,363                     -2.23


                                               6
Malaysia              26,160,256                  28,334,135                     8.31
  Afghanistan             29,121,286                  31,412,000                     7.87
      Haiti                9,203,083                  10,085,214                     9.59
   Philippine             92,222,660                  94,013,200                     1.94
     Russia              141,850,000                 141,927,297                     0.05
    Mexico               107,550,697                 112,336,538                     4.45
    Vietnam               85,846,997                  86,930,000                     1.26
  South Africa            49,320,000                  50,500,000                     2.39
   Myanmar                59,120,000                  55,390,000                    -6.31
  South Korea             47,890,000                  48,219,000                     0.68
   Argentina              40,134,425                  41,000,000                     2.16
   Columbia               45,094,646                  45,331,418                     0.53
       Peru               29,132,013                  29,626,893                     1.70
   Costa Rica              4,375,044                   4,563,539                     4.31
      Cuba                11,000,023                  11,241,161                     2.19
      Chad                11,274,106                   9,885,661                   -12.32
 Czech Republic           10,467,542                  10,690,357                     2.13
     Poland               38,100,700                  38,163,895                     0.17
    Scotland               5,124,009                   5,168,500                     0.37
     Ireland               4,459,300                   4,398,500                    -1.36
     Iceland                319,246                     317,630                     -0.51
   Greenland                 58,000                      56,344                     -2.86
    Canada                33,504,700                  34,109,000                     1.80
    Morocco               34,854,364                  34978,527                      0.34
   Venezuela              28,482,150                  27,300,000                     0.42
      Sudan               30,894,000                  31,000,543                     0.34
    Taiwan                23,069,345                  23,027,672                    -0.18
    Portugal              10,034,941                  10,642,841                     6.00

              Another variable beside population growth is level of Gross Domestic Product
      (GDP). The numbers are put in data form that includes that number of GDP in both
      2009 and 2010, and also the decreasing/increasing rate between 2009 and 2010. The
      number of GDP in 2010 will be subtracting with the number of GDP in 2009 and the
      result of the subtraction will be divided with the number of GDP in 2009. Then the
      result of the division will be timed with 100 in order to get the rate in percent. The
      rate will shows the decreasing/increasing rate of the GDP, which will be use to
      compare with the population growth rate in order to find the relationship between the
      two variables.

      Data 2: This data shows the number of GDPs in 50 countries in year 2009 and 2010
      and it also included decreasing/increasing rate of the GDP between the two years.
    Country            GDP in 2009                  GDP in 2010              GDP Rate (%)
 United States          14,119,050                   15,227,074                  7.85
United Kingdom           2,182,430                    2,471,883                 13.26
   Denmark                308,925                      337,811                   9.35
     France              2,656,407                    2,750,708                  3.55
   Germany               3,338,675                    3,518,592                  5.39
      India              1,268,878                    1,704,063                 34.30
     Japan               5,032,982                    5,821,945                 15.68


                                                7
China               4,990,528                    6,515,861                    30.56
     Egypt                188,608                      218,466                     13.67
   Thailand               263,711                      332,470                     26.07
      Italy              2,116,637                    2,181,362                     3.06
   Australia              987,813                     1,448,154                    46.60
    Greece                327,331                      310,365                     -5.18
      Iraq                 65,193                      108,418                     66.30
 New Zealand              117,900                      153,252                     29.98
     Spain               1,467,889                    1,484,708                    1.146
     Brazil              1,600,841                    2,421,637                    51.27
   Nigeria                168,846                      267,779                     58.59
   Norway                 378,614                      478,964                     26.50
   Vietnam                 93,169                      118,567                     27.26
    Kenya                  29,394                       35,787                     21.75
  Indonesia               538,457                      822,631                     52.78
   Malaysia               192,955                      247,781                     28.41
 Afghanistan               12,466                       18,332                     47.06
     Haiti                  6,634                        7,724                     16.43
  Philippine              168,333                      199,589                     18.57
    Russia               1,221,991                    1,479,819                    21.10
   Mexico                 882,786                     1,039,661                    17.77
   Vietnam                 97,146                      103,571                      6.61
 South Africa             282,754                      363,703                      28.63
  Myanmar                  24,223                       23,631                     -2.44
 South Korea              834,060                     1,014,483                     21.63
  Argentina               307,081                      368,711                      20.07
  Columbia                235,836                      288,188                      22.20
      Peru                126,923                      153,844                      21.21
  Costa Rica               29,239                       34,564                      18.21
     Cuba                  16,993                       17,432                      2.52
     Chad                   6,838                        7,588                      10.97
Czech Republic            190,204                      192,151                       1.02
    Poland                430,645                      468,585                       8.81
   Scotland               234,771                      243,985             3.92
    Ireland               221,778                      203,892                      -8.06
    Iceland                12,094                       12,593                       4.13
  Greenland                 1,267                        1,543                      21.8
   Canada                1,336,068                    1,574,052                     17.8
   Morocco                 91,374                       91,196             -0.19
  Venezuela               326,132                      387,851                       18.9
     Sudan                 54,633                       62,045                       13.6
   Taiwan                  93,756                       94,665                      0.97
   Portugal               201,445                      209,556                      4.03

     According to chi-squared experiment, the countries will be separated into two
     categories for each variable (population growth and GDP), which are countries that
     have high population growth rate and countries that have low population growth rate,
     and also countries that have high GDP and countries that have low GDP. The reason
     why the variables are separated into high and low categories is because the result will
     show whether the level of GDP is an independent variable to the population growth or
     not, which will explains the relationship between the variables.


                                               8
50 countries that are selected will be separated into 2 ranges base on their population
growth rate (%): high population growth rateand low population growth rate. In this
experiment, a country that has population growth rate of 3% or more is consider as a
country that has high population growth rate. On the other hand, a country that has
below 3% on its population growth rate is considered as a country that has low
population growth rate.

50 countries that are selected will also be separated into two groups, based on their
GDP rate, which are high GDP rate countries and low GDP rate countries. In this
experiment, a country that has 20% or higher rate of GDP is considered as high GDP
country. On the other hand, a country that has lower than 20% rate of GDP is
considered as low GDP country.

After the countries are separated into four main categories, which are high population
growth rate, low population growth rate, high GDP rate and low GDP rate. Numbers
in Data 3 will count based on the 4 categories that mentioned above. For example,
United States has 0.67% of population growth, which considered as a low population
growth rate and it has 7.85%, which consider as low GDP rate. Based on this
information, United States will be located on the low population growth column along
with low GDP row.


                                          9
Interpretation of Results
Test for independence of Gross Domestic Product and Population growth
Null Hypothesis- Gross Domestic Product is independent of population growth
Alternative Hypothesis- Gross Domestic Product is not independent of population
growth

Degree of Freedom (df): (Number of rows – 1)(Number of Column – 1)
This experiment: df= (2-1)(2-1)=1

The significant level of this experiment is 5% or 0.05
*We will reject null hypothesis if       > 3.84 (critical values table)

Contingency Table
Data 3: This data shows the number of countries that separated into four categories
(Low/High population growth rate and Low/High GDP)
                        Low Population Growth       High Population Growth     Sum
                           Rate Countries               Rate Countries
Low GDP Countries                23                           6                 29
High GDP Countries               13                           8                 21
      Sum                        36                           14                50

Data 4: This data shows the expected value of all the four categories (Low/High
population growth and Low/High GDP)
                        Low Population Growth       High Population Growth     Sum
                           Rate Countries               Rate Countries
Low GDP Countries

                                                                                29


High GDP Countries
                                                                                21


       Sum
                                   36                          14               50


The calculation of


      23                20.9              2.12              4.49             0.22
      13                15.1              -2.12             4.49             0.30
       6                8.12              -2.12             4.49             0.55
       8                5.9               2.12              4.49             0.76
                                                            Total            1.83


                                           10
1.83

This therefore accepts null hypothesis because 1.83 is less than 3.84. This also
indicates that GDP is independent to population growth

From the data analysis above, the concluded data can be seen on the table below

           Independence Test                               Conclude Results
       GDP and Population Growth                             Independent

Data 5: This data shows the numbers of mean, median and mode for population
growth rate of 50 selected countries and also for GDP rates of 50 selected countries.
    Variables                Mean                  Median                 Mode

Population Growth         80.14                     1.26                No Mode
      Rate                      =1.60
                           50


    GDP Rate             925.42                     17.8                No Mode
                                =18.51
                           50


Graph 1: This graph shows the mean and median numbers of population growth rate
and GDP of 50 selected countries

      Level of Mean and Median for Population growth rate and GDP Rate of 50 selected
              20
              18
              16
              14
              12
                                                                                Mean
              10
               8                                                                Median
               6
               4
               2
               0
                   Population Growth Rate          GDP rate


Standard Deviation is another mathematical process that is use in this investigation
because it shows the correlation of population growth rate and GDP rate in order to
see the relationship level of these two variables.
X: Population Growth Rate
Y: GDP Rate


                                            11
After calculate         åx ,åy
                             2        2
                                          and   å xy (Appendix 1) the numbers can be calculate in
Standard Deviation formula

Sxy =
      å xy - xy = 2015.8 - 29.62 =10.7
       n            50


Sx =
             åx   2
                        2
                      -x =
                                 966.8
                                       - 2.56 = 4.09
             n                    50


Sy =
             åy   2
                        2
                      -y =
                                 30924.46
                                          - 342.62 =16.61
             n                      50

       Sxy      10.7
r=         =             = 0.16
      Sx Sy (4.09)(16.6)

Graph 2: The graph shows the relationship between Population Growth Rate and
GDP Rate of 50 selected countries

                      Correlation Coefficient of Population Growth Rate and GDP
                                                  80
                                                  70
                                                  60
                                                  50
                                                  40
  GDP Rate


                                                  30
                                                  20
                                                  10
                                                   0
     -15               -10            -5         -10 0          5          10        15        20

                                                 -20
                                                  Population Growth Rate


Therefore, correlation coefficient of this investigation is 0.16, which is closer to 0
than 1. The result (r) shows that there is almost no relationship between population
growth rate and GDP rate between 50 selected countries.

Box-and-whisker plot is another method to help show the visual display of some of
the descriptive statistic of a data set. Box-and-whisker plot requires 5 sets of number,
which are the minimum number of the set, median of lower half number, median,
median of upper half number and maximum number of the set


                                                         12
5-numbers summary         Population Growth Rate                    GDP Rate

       Min                          -12.3                              -8.06
     Q1 (25%)                        0.05                               9.35
    Median (Q2)                      1.26                               17.8
     Q3 (75%)                        3.16                               27.3
       Max                          13.75                               66.3


Conclusion
        In mathematical processes that were already mentioned earlier gave numerical
figures to work with and help me to overcome the investigation of the relationship
between population growth rate and Gross Domestic Product (GDP) with a
conclusion. The investigation shows that population growth rate does not depend on
GDP. The method was carried through chi-square process,which gave the result of
1.83. Since this experiment uses the significant level 5% for this experiment, 1.83 is
less than the number of 5% significant or 3.84. The result shows that there is no direct
relationship between these two variables.

        Also, based on correlation coefficient graph and calculation, it also shows
weak relationship between population growth rate and GDP rate. Correlation
coefficient or (r) in this experiment is 0.16. When the result number is closer to 0 in
0-1 scale (1 indicated strong relationship and 0 indicates no relationship). The result
also according with chi-square result since both results conveys that population
growth rate and GDP rate are both independent to one another.

        There is a couple of factors that might affect the result of this study. Due to the
fact that these countries are selected at random pattern, in order to prevent bias
information, the countries that are selected might mostly are the countries that has
lower population numbers than others. Based on the median number of population
growth rate in the experiment, 1.26 is a fairly low number of population growth rate
compare to the rest of the world. This shows that most of the countries that are
selected in this study are the countries that already have low population. Also, there
are only 50 countries in this experiment, which create a limited database for the study.
If there are more countries, the result might be more accurate.


                                            13
Bibliography

Appendix 1: Numbersthat use to calculate Correlation Coefficient
and Standard Deviation
     X           Y           XY             X2            Y2
   0.67         7.85       5.2595        0.4489        61.6225
   1.88        13.26      24.9288        3.5344       175.8276
   0.88         9.35        8.228        0.7744        87.4225
   2.75         3.55       9.7625        7.5625        12.6025
   -0.65        5.39      -3.5035        0.4225        29.0521
   3.16         34.3      108.388        9.9856        1176.49
    0.9        15.68       14.112          0.81       245.8624
   0.72        30.56      22.0032        0.5184       933.9136
   1.77        13.67      24.1959        3.1329       186.8689
   0.96        26.07      25.0272        0.9216       679.6449
   4.37         3.06      13.3722       19.0969         9.3636
   5.59         46.6      260.494       31.2481        2171.56
   0.35        -5.18       -1.813        0.1225        26.8324
   6.74         66.3      446.862       45.4276        4395.69
   3.89        29.98     116.6222       15.1321       898.8004
  13.75        1.146      15.7575      189.0625       1.313316
   -5.16       51.27    -264.5532       26.6256      2628.6129
   4.08        58.59     239.0472       16.6464      3432.7881
    6.3         26.5       166.95         39.69         702.25
   -2.45       27.26      -66.787        6.0025       743.1076
   -3.59       21.75     -78.0825       12.8881       473.0625
   -2.23       52.78    -117.6994        4.9729      2785.7284
   8.31        28.41     236.0871       69.0561       807.1281
   7.87        47.06     370.3622       61.9369      2214.6436
   9.59        16.43     157.5637       91.9681       269.9449
   1.94        18.57      36.0258        3.7636       344.8449
   0.05         21.1        1.055        0.0025         445.21
   4.45        17.77      79.0765       19.8025       315.7729


                                       14
1.26      6.61      8.3286      1.5876     43.6921
 2.39     28.63     68.4257      5.7121    819.6769
 -6.31    -2.44     15.3964     39.8161      5.9536
 0.68     21.63     14.7084      0.4624    467.8569
 2.16     20.07     43.3512      4.6656    402.8049
 0.53      22.2      11.766      0.2809      492.84
  1.7     21.21      36.057       2.89     449.8641
 4.31     18.21     78.4851     18.5761    331.6041
 2.19      2.52      5.5188      4.7961      6.3504
-12.32    10.97    -135.1504   151.7824    120.3409
 2.13      1.02      2.1726      4.5369      1.0404
 0.17      8.81      1.4977      0.0289     77.6161
 0.37      3.92      1.4504      0.1369     15.3664
 -1.36    -8.06     10.9616      1.8496     64.9636
 -0.51     4.13     -2.1063      0.2601     17.0569
 -2.86     21.8     -62.348      8.1796      475.24
  1.8      17.8       32.04       3.24       316.84
 0.34     -0.19     -0.0646      0.1156      0.0361
 0.42      18.9       7.938      0.1764      357.21
 0.34      13.6       4.624      0.1156      184.96
 -0.18     0.97     -0.1746      0.0324      0.9409
   6       4.03       24.18        36       16.2409
                       Total
80.14    925.416   2015.7995   966.7974   30924.45582


                               15
Appendix 2: The numbers of population
growth rate and GDP rate in order from
greatest to lowest to use for box-and-
whisker plot

                         GDP Rate
Population Growth
      Rate
      13.75                 66.3
       9.59                58.59
       8.31                52.78
       7.87                51.27
       6.74                47.06
        6.3                 46.6
         6                  34.3
       5.59                30.56
       4.45                29.98
       4.37                28.63
       4.31                28.41
       4.08                27.26
       3.89                 26.5
       3.16                26.07
       2.75                 22.2
       2.39                 21.8
       2.19                21.75
       2.16                21.63
       2.13                21.21
       1.94                 21.1


                                         16

Math ia

  • 1.
    Population Growth An investigationon population growth by external factor, which in this case is Gross Domestic Product (GDP) IB Math Studies School: International School Bangkok Word Counts: 2251 words 3
  • 2.
    Contents Introduction, Methodsand Mathematical Processes- … Page 3 Mathematical Processes and Data 1- ........................... Page 4 Data 2- ........................................................................ Page 5-6 Interpretation of Results- ............................................... Page 8 Overall Conclusion ........................................................ Page 12 Bibliography- ................................................................ Page 13 Appendix- ..................................................................... Page 14 Introduction Population growth rate in each country is hardly predicted each year due to several unpredictableexternal factors may impact population numbers, for example, diseases, natural disasters, migrations and Gross Domestic Product (GDP). Based on 4
  • 3.
    many economists, GDPis the main factor that indicates the economy cycle and the level of population growth rate each year. GDP is the result number of final goods and services in a country each year, which the number also reflects citizens’ life quality. I shall investigate the relationship between GDP rate and population growth rate to see the significant bond between these two variables. The investigation will include 50 countries that are selected randomly, in order to prevent bias perception. The numbers of population in year in year 2009 and 2010 of each selected country will be compare, in order to get the increasing/decreasing rate. The numbers of GDP in year 2009 and 2010 for each selected country will also be compared to get the increasing/decreasing rate. The numbers of GDPs and Population number in each selected country will be referencing from several websites in order to receive the most accurate numbers. After the data is complete, the numbers will be put in a mathematical process of chi-squared. The result from chi-squared calculation will be compare with the table of critical values of chi-squared distribution to see whether to accept the null hypothesis or not.I also find mean, median and mode population growth rate and GDP rate since it will help evaluate the result and shows the range of data information that we have since each country has different size and economics background. The reason why I chose GDP to indicates the level of population growth rate is because it shows the overall living standard of the population in a country and it also shows people’s quality of life, which includes their incomes, medical care and education (external factors). The purpose of this investigation is to find the affect of level of GDP on population growth rate. Method 1. Research the level of GDP in 50 countries that are selected in year 2009 2. Research the level of GDP in 50 countries that are selected in year 2010 3. Research the amount of population in 2009 for all the 50 selected countries 4. Research the amount of population in 2010 for all 50selected countries Mathematical Process For this experiment, I shall calculate the population growth rate by using the number from the subtraction of the number of population in 2009 with the number of population in 2010 and divide the number that get from the subtraction with the number of population in 2009. The result from the division will be times with 100 to get the rate in percentage of the population growth rate. This calculation is applied to all the calculation process in the 50 selected countries. The reason why I chose to calculate the population growth is because it shows the total rate of the population over a year, which can be use to compare with the level of GDP to find a significant relationship between these two variables. This experiment will also include chi-squared correlation test of independent. The chi-squared test is the test for independence or dependence for the significance of any difference between 2 variables, which in this experiment are GDP and population growth. In this experiment, the significant level is chosen to be 5% margin due to the fact that anything beyond 5% margin is considered to be chance but anything before it 5
  • 4.
    is determined bycause. The reason why I chose to use this correlation test it gives a clear conclusion of the affects of GDP on the population growth. The numbers of population in 2009 and 2010 of each 50 countries are recorded on a data. The data also includes numbers of population growth rate (%). The numbers from both years are use to calculate the numbers of population growth rate (%) that are shown on the data through the math process that mentioned above. Data 1: The numbers of population in 2009 and 2010, and the number of calculated population growth rate in 50 selected countries Country Amount of Population in Amount of Population in Population Growth 2009 2010 Rate (%) United States 310,232,863 312,311,000 0.67 United Kingdom 61,284,806 62,435,709 1.88 Denmark 5,515,575 5,564,219 0.88 France 64,057,792 65,821,885 2.75 Germany 82,282,988 81,751,602 -0.65 India 1,173,108,018 1,210,193,422 3.16 Japan 126,804,433 127,950,000 0.90 China 1,330,141,295 1,339,724,852 0.72 Egypt 77,683,333 79,089,650 1.77 Thailand 66,404,688 67,041,000 0.96 Italy 58,090,681 60,626,442 4.37 Australia 21,515,754 22,718,381 5.59 Greece 10,749,943 10,787,690 0.35 Iraq 29,671,605 31,672,000 6.74 New Zealand 4,252,277 4,417,600 3.89 Spain 40,548,753 46,125,154 13.75 Brazil 201,103,330 190,732,694 -5.16 Nigeria 152,217,341 158,423,000 4.08 Norway 4,676,305 4,971,100 6.30 Vietnam 89,571,130 87,375,000 -2.45 Kenya 40,046,566 38,610,097 -3.59 Indonesia 242,968,342 237,556,363 -2.23 6
  • 5.
    Malaysia 26,160,256 28,334,135 8.31 Afghanistan 29,121,286 31,412,000 7.87 Haiti 9,203,083 10,085,214 9.59 Philippine 92,222,660 94,013,200 1.94 Russia 141,850,000 141,927,297 0.05 Mexico 107,550,697 112,336,538 4.45 Vietnam 85,846,997 86,930,000 1.26 South Africa 49,320,000 50,500,000 2.39 Myanmar 59,120,000 55,390,000 -6.31 South Korea 47,890,000 48,219,000 0.68 Argentina 40,134,425 41,000,000 2.16 Columbia 45,094,646 45,331,418 0.53 Peru 29,132,013 29,626,893 1.70 Costa Rica 4,375,044 4,563,539 4.31 Cuba 11,000,023 11,241,161 2.19 Chad 11,274,106 9,885,661 -12.32 Czech Republic 10,467,542 10,690,357 2.13 Poland 38,100,700 38,163,895 0.17 Scotland 5,124,009 5,168,500 0.37 Ireland 4,459,300 4,398,500 -1.36 Iceland 319,246 317,630 -0.51 Greenland 58,000 56,344 -2.86 Canada 33,504,700 34,109,000 1.80 Morocco 34,854,364 34978,527 0.34 Venezuela 28,482,150 27,300,000 0.42 Sudan 30,894,000 31,000,543 0.34 Taiwan 23,069,345 23,027,672 -0.18 Portugal 10,034,941 10,642,841 6.00 Another variable beside population growth is level of Gross Domestic Product (GDP). The numbers are put in data form that includes that number of GDP in both 2009 and 2010, and also the decreasing/increasing rate between 2009 and 2010. The number of GDP in 2010 will be subtracting with the number of GDP in 2009 and the result of the subtraction will be divided with the number of GDP in 2009. Then the result of the division will be timed with 100 in order to get the rate in percent. The rate will shows the decreasing/increasing rate of the GDP, which will be use to compare with the population growth rate in order to find the relationship between the two variables. Data 2: This data shows the number of GDPs in 50 countries in year 2009 and 2010 and it also included decreasing/increasing rate of the GDP between the two years. Country GDP in 2009 GDP in 2010 GDP Rate (%) United States 14,119,050 15,227,074 7.85 United Kingdom 2,182,430 2,471,883 13.26 Denmark 308,925 337,811 9.35 France 2,656,407 2,750,708 3.55 Germany 3,338,675 3,518,592 5.39 India 1,268,878 1,704,063 34.30 Japan 5,032,982 5,821,945 15.68 7
  • 6.
    China 4,990,528 6,515,861 30.56 Egypt 188,608 218,466 13.67 Thailand 263,711 332,470 26.07 Italy 2,116,637 2,181,362 3.06 Australia 987,813 1,448,154 46.60 Greece 327,331 310,365 -5.18 Iraq 65,193 108,418 66.30 New Zealand 117,900 153,252 29.98 Spain 1,467,889 1,484,708 1.146 Brazil 1,600,841 2,421,637 51.27 Nigeria 168,846 267,779 58.59 Norway 378,614 478,964 26.50 Vietnam 93,169 118,567 27.26 Kenya 29,394 35,787 21.75 Indonesia 538,457 822,631 52.78 Malaysia 192,955 247,781 28.41 Afghanistan 12,466 18,332 47.06 Haiti 6,634 7,724 16.43 Philippine 168,333 199,589 18.57 Russia 1,221,991 1,479,819 21.10 Mexico 882,786 1,039,661 17.77 Vietnam 97,146 103,571 6.61 South Africa 282,754 363,703 28.63 Myanmar 24,223 23,631 -2.44 South Korea 834,060 1,014,483 21.63 Argentina 307,081 368,711 20.07 Columbia 235,836 288,188 22.20 Peru 126,923 153,844 21.21 Costa Rica 29,239 34,564 18.21 Cuba 16,993 17,432 2.52 Chad 6,838 7,588 10.97 Czech Republic 190,204 192,151 1.02 Poland 430,645 468,585 8.81 Scotland 234,771 243,985 3.92 Ireland 221,778 203,892 -8.06 Iceland 12,094 12,593 4.13 Greenland 1,267 1,543 21.8 Canada 1,336,068 1,574,052 17.8 Morocco 91,374 91,196 -0.19 Venezuela 326,132 387,851 18.9 Sudan 54,633 62,045 13.6 Taiwan 93,756 94,665 0.97 Portugal 201,445 209,556 4.03 According to chi-squared experiment, the countries will be separated into two categories for each variable (population growth and GDP), which are countries that have high population growth rate and countries that have low population growth rate, and also countries that have high GDP and countries that have low GDP. The reason why the variables are separated into high and low categories is because the result will show whether the level of GDP is an independent variable to the population growth or not, which will explains the relationship between the variables. 8
  • 7.
    50 countries thatare selected will be separated into 2 ranges base on their population growth rate (%): high population growth rateand low population growth rate. In this experiment, a country that has population growth rate of 3% or more is consider as a country that has high population growth rate. On the other hand, a country that has below 3% on its population growth rate is considered as a country that has low population growth rate. 50 countries that are selected will also be separated into two groups, based on their GDP rate, which are high GDP rate countries and low GDP rate countries. In this experiment, a country that has 20% or higher rate of GDP is considered as high GDP country. On the other hand, a country that has lower than 20% rate of GDP is considered as low GDP country. After the countries are separated into four main categories, which are high population growth rate, low population growth rate, high GDP rate and low GDP rate. Numbers in Data 3 will count based on the 4 categories that mentioned above. For example, United States has 0.67% of population growth, which considered as a low population growth rate and it has 7.85%, which consider as low GDP rate. Based on this information, United States will be located on the low population growth column along with low GDP row. 9
  • 8.
    Interpretation of Results Testfor independence of Gross Domestic Product and Population growth Null Hypothesis- Gross Domestic Product is independent of population growth Alternative Hypothesis- Gross Domestic Product is not independent of population growth Degree of Freedom (df): (Number of rows – 1)(Number of Column – 1) This experiment: df= (2-1)(2-1)=1 The significant level of this experiment is 5% or 0.05 *We will reject null hypothesis if > 3.84 (critical values table) Contingency Table Data 3: This data shows the number of countries that separated into four categories (Low/High population growth rate and Low/High GDP) Low Population Growth High Population Growth Sum Rate Countries Rate Countries Low GDP Countries 23 6 29 High GDP Countries 13 8 21 Sum 36 14 50 Data 4: This data shows the expected value of all the four categories (Low/High population growth and Low/High GDP) Low Population Growth High Population Growth Sum Rate Countries Rate Countries Low GDP Countries 29 High GDP Countries 21 Sum 36 14 50 The calculation of 23 20.9 2.12 4.49 0.22 13 15.1 -2.12 4.49 0.30 6 8.12 -2.12 4.49 0.55 8 5.9 2.12 4.49 0.76 Total 1.83 10
  • 9.
    1.83 This therefore acceptsnull hypothesis because 1.83 is less than 3.84. This also indicates that GDP is independent to population growth From the data analysis above, the concluded data can be seen on the table below Independence Test Conclude Results GDP and Population Growth Independent Data 5: This data shows the numbers of mean, median and mode for population growth rate of 50 selected countries and also for GDP rates of 50 selected countries. Variables Mean Median Mode Population Growth 80.14 1.26 No Mode Rate =1.60 50 GDP Rate 925.42 17.8 No Mode =18.51 50 Graph 1: This graph shows the mean and median numbers of population growth rate and GDP of 50 selected countries Level of Mean and Median for Population growth rate and GDP Rate of 50 selected 20 18 16 14 12 Mean 10 8 Median 6 4 2 0 Population Growth Rate GDP rate Standard Deviation is another mathematical process that is use in this investigation because it shows the correlation of population growth rate and GDP rate in order to see the relationship level of these two variables. X: Population Growth Rate Y: GDP Rate 11
  • 10.
    After calculate åx ,åy 2 2 and å xy (Appendix 1) the numbers can be calculate in Standard Deviation formula Sxy = å xy - xy = 2015.8 - 29.62 =10.7 n 50 Sx = åx 2 2 -x = 966.8 - 2.56 = 4.09 n 50 Sy = åy 2 2 -y = 30924.46 - 342.62 =16.61 n 50 Sxy 10.7 r= = = 0.16 Sx Sy (4.09)(16.6) Graph 2: The graph shows the relationship between Population Growth Rate and GDP Rate of 50 selected countries Correlation Coefficient of Population Growth Rate and GDP 80 70 60 50 40 GDP Rate 30 20 10 0 -15 -10 -5 -10 0 5 10 15 20 -20 Population Growth Rate Therefore, correlation coefficient of this investigation is 0.16, which is closer to 0 than 1. The result (r) shows that there is almost no relationship between population growth rate and GDP rate between 50 selected countries. Box-and-whisker plot is another method to help show the visual display of some of the descriptive statistic of a data set. Box-and-whisker plot requires 5 sets of number, which are the minimum number of the set, median of lower half number, median, median of upper half number and maximum number of the set 12
  • 11.
    5-numbers summary Population Growth Rate GDP Rate Min -12.3 -8.06 Q1 (25%) 0.05 9.35 Median (Q2) 1.26 17.8 Q3 (75%) 3.16 27.3 Max 13.75 66.3 Conclusion In mathematical processes that were already mentioned earlier gave numerical figures to work with and help me to overcome the investigation of the relationship between population growth rate and Gross Domestic Product (GDP) with a conclusion. The investigation shows that population growth rate does not depend on GDP. The method was carried through chi-square process,which gave the result of 1.83. Since this experiment uses the significant level 5% for this experiment, 1.83 is less than the number of 5% significant or 3.84. The result shows that there is no direct relationship between these two variables. Also, based on correlation coefficient graph and calculation, it also shows weak relationship between population growth rate and GDP rate. Correlation coefficient or (r) in this experiment is 0.16. When the result number is closer to 0 in 0-1 scale (1 indicated strong relationship and 0 indicates no relationship). The result also according with chi-square result since both results conveys that population growth rate and GDP rate are both independent to one another. There is a couple of factors that might affect the result of this study. Due to the fact that these countries are selected at random pattern, in order to prevent bias information, the countries that are selected might mostly are the countries that has lower population numbers than others. Based on the median number of population growth rate in the experiment, 1.26 is a fairly low number of population growth rate compare to the rest of the world. This shows that most of the countries that are selected in this study are the countries that already have low population. Also, there are only 50 countries in this experiment, which create a limited database for the study. If there are more countries, the result might be more accurate. 13
  • 12.
    Bibliography Appendix 1: Numbersthatuse to calculate Correlation Coefficient and Standard Deviation X Y XY X2 Y2 0.67 7.85 5.2595 0.4489 61.6225 1.88 13.26 24.9288 3.5344 175.8276 0.88 9.35 8.228 0.7744 87.4225 2.75 3.55 9.7625 7.5625 12.6025 -0.65 5.39 -3.5035 0.4225 29.0521 3.16 34.3 108.388 9.9856 1176.49 0.9 15.68 14.112 0.81 245.8624 0.72 30.56 22.0032 0.5184 933.9136 1.77 13.67 24.1959 3.1329 186.8689 0.96 26.07 25.0272 0.9216 679.6449 4.37 3.06 13.3722 19.0969 9.3636 5.59 46.6 260.494 31.2481 2171.56 0.35 -5.18 -1.813 0.1225 26.8324 6.74 66.3 446.862 45.4276 4395.69 3.89 29.98 116.6222 15.1321 898.8004 13.75 1.146 15.7575 189.0625 1.313316 -5.16 51.27 -264.5532 26.6256 2628.6129 4.08 58.59 239.0472 16.6464 3432.7881 6.3 26.5 166.95 39.69 702.25 -2.45 27.26 -66.787 6.0025 743.1076 -3.59 21.75 -78.0825 12.8881 473.0625 -2.23 52.78 -117.6994 4.9729 2785.7284 8.31 28.41 236.0871 69.0561 807.1281 7.87 47.06 370.3622 61.9369 2214.6436 9.59 16.43 157.5637 91.9681 269.9449 1.94 18.57 36.0258 3.7636 344.8449 0.05 21.1 1.055 0.0025 445.21 4.45 17.77 79.0765 19.8025 315.7729 14
  • 13.
    1.26 6.61 8.3286 1.5876 43.6921 2.39 28.63 68.4257 5.7121 819.6769 -6.31 -2.44 15.3964 39.8161 5.9536 0.68 21.63 14.7084 0.4624 467.8569 2.16 20.07 43.3512 4.6656 402.8049 0.53 22.2 11.766 0.2809 492.84 1.7 21.21 36.057 2.89 449.8641 4.31 18.21 78.4851 18.5761 331.6041 2.19 2.52 5.5188 4.7961 6.3504 -12.32 10.97 -135.1504 151.7824 120.3409 2.13 1.02 2.1726 4.5369 1.0404 0.17 8.81 1.4977 0.0289 77.6161 0.37 3.92 1.4504 0.1369 15.3664 -1.36 -8.06 10.9616 1.8496 64.9636 -0.51 4.13 -2.1063 0.2601 17.0569 -2.86 21.8 -62.348 8.1796 475.24 1.8 17.8 32.04 3.24 316.84 0.34 -0.19 -0.0646 0.1156 0.0361 0.42 18.9 7.938 0.1764 357.21 0.34 13.6 4.624 0.1156 184.96 -0.18 0.97 -0.1746 0.0324 0.9409 6 4.03 24.18 36 16.2409 Total 80.14 925.416 2015.7995 966.7974 30924.45582 15
  • 14.
    Appendix 2: Thenumbers of population growth rate and GDP rate in order from greatest to lowest to use for box-and- whisker plot GDP Rate Population Growth Rate 13.75 66.3 9.59 58.59 8.31 52.78 7.87 51.27 6.74 47.06 6.3 46.6 6 34.3 5.59 30.56 4.45 29.98 4.37 28.63 4.31 28.41 4.08 27.26 3.89 26.5 3.16 26.07 2.75 22.2 2.39 21.8 2.19 21.75 2.16 21.63 2.13 21.21 1.94 21.1 16