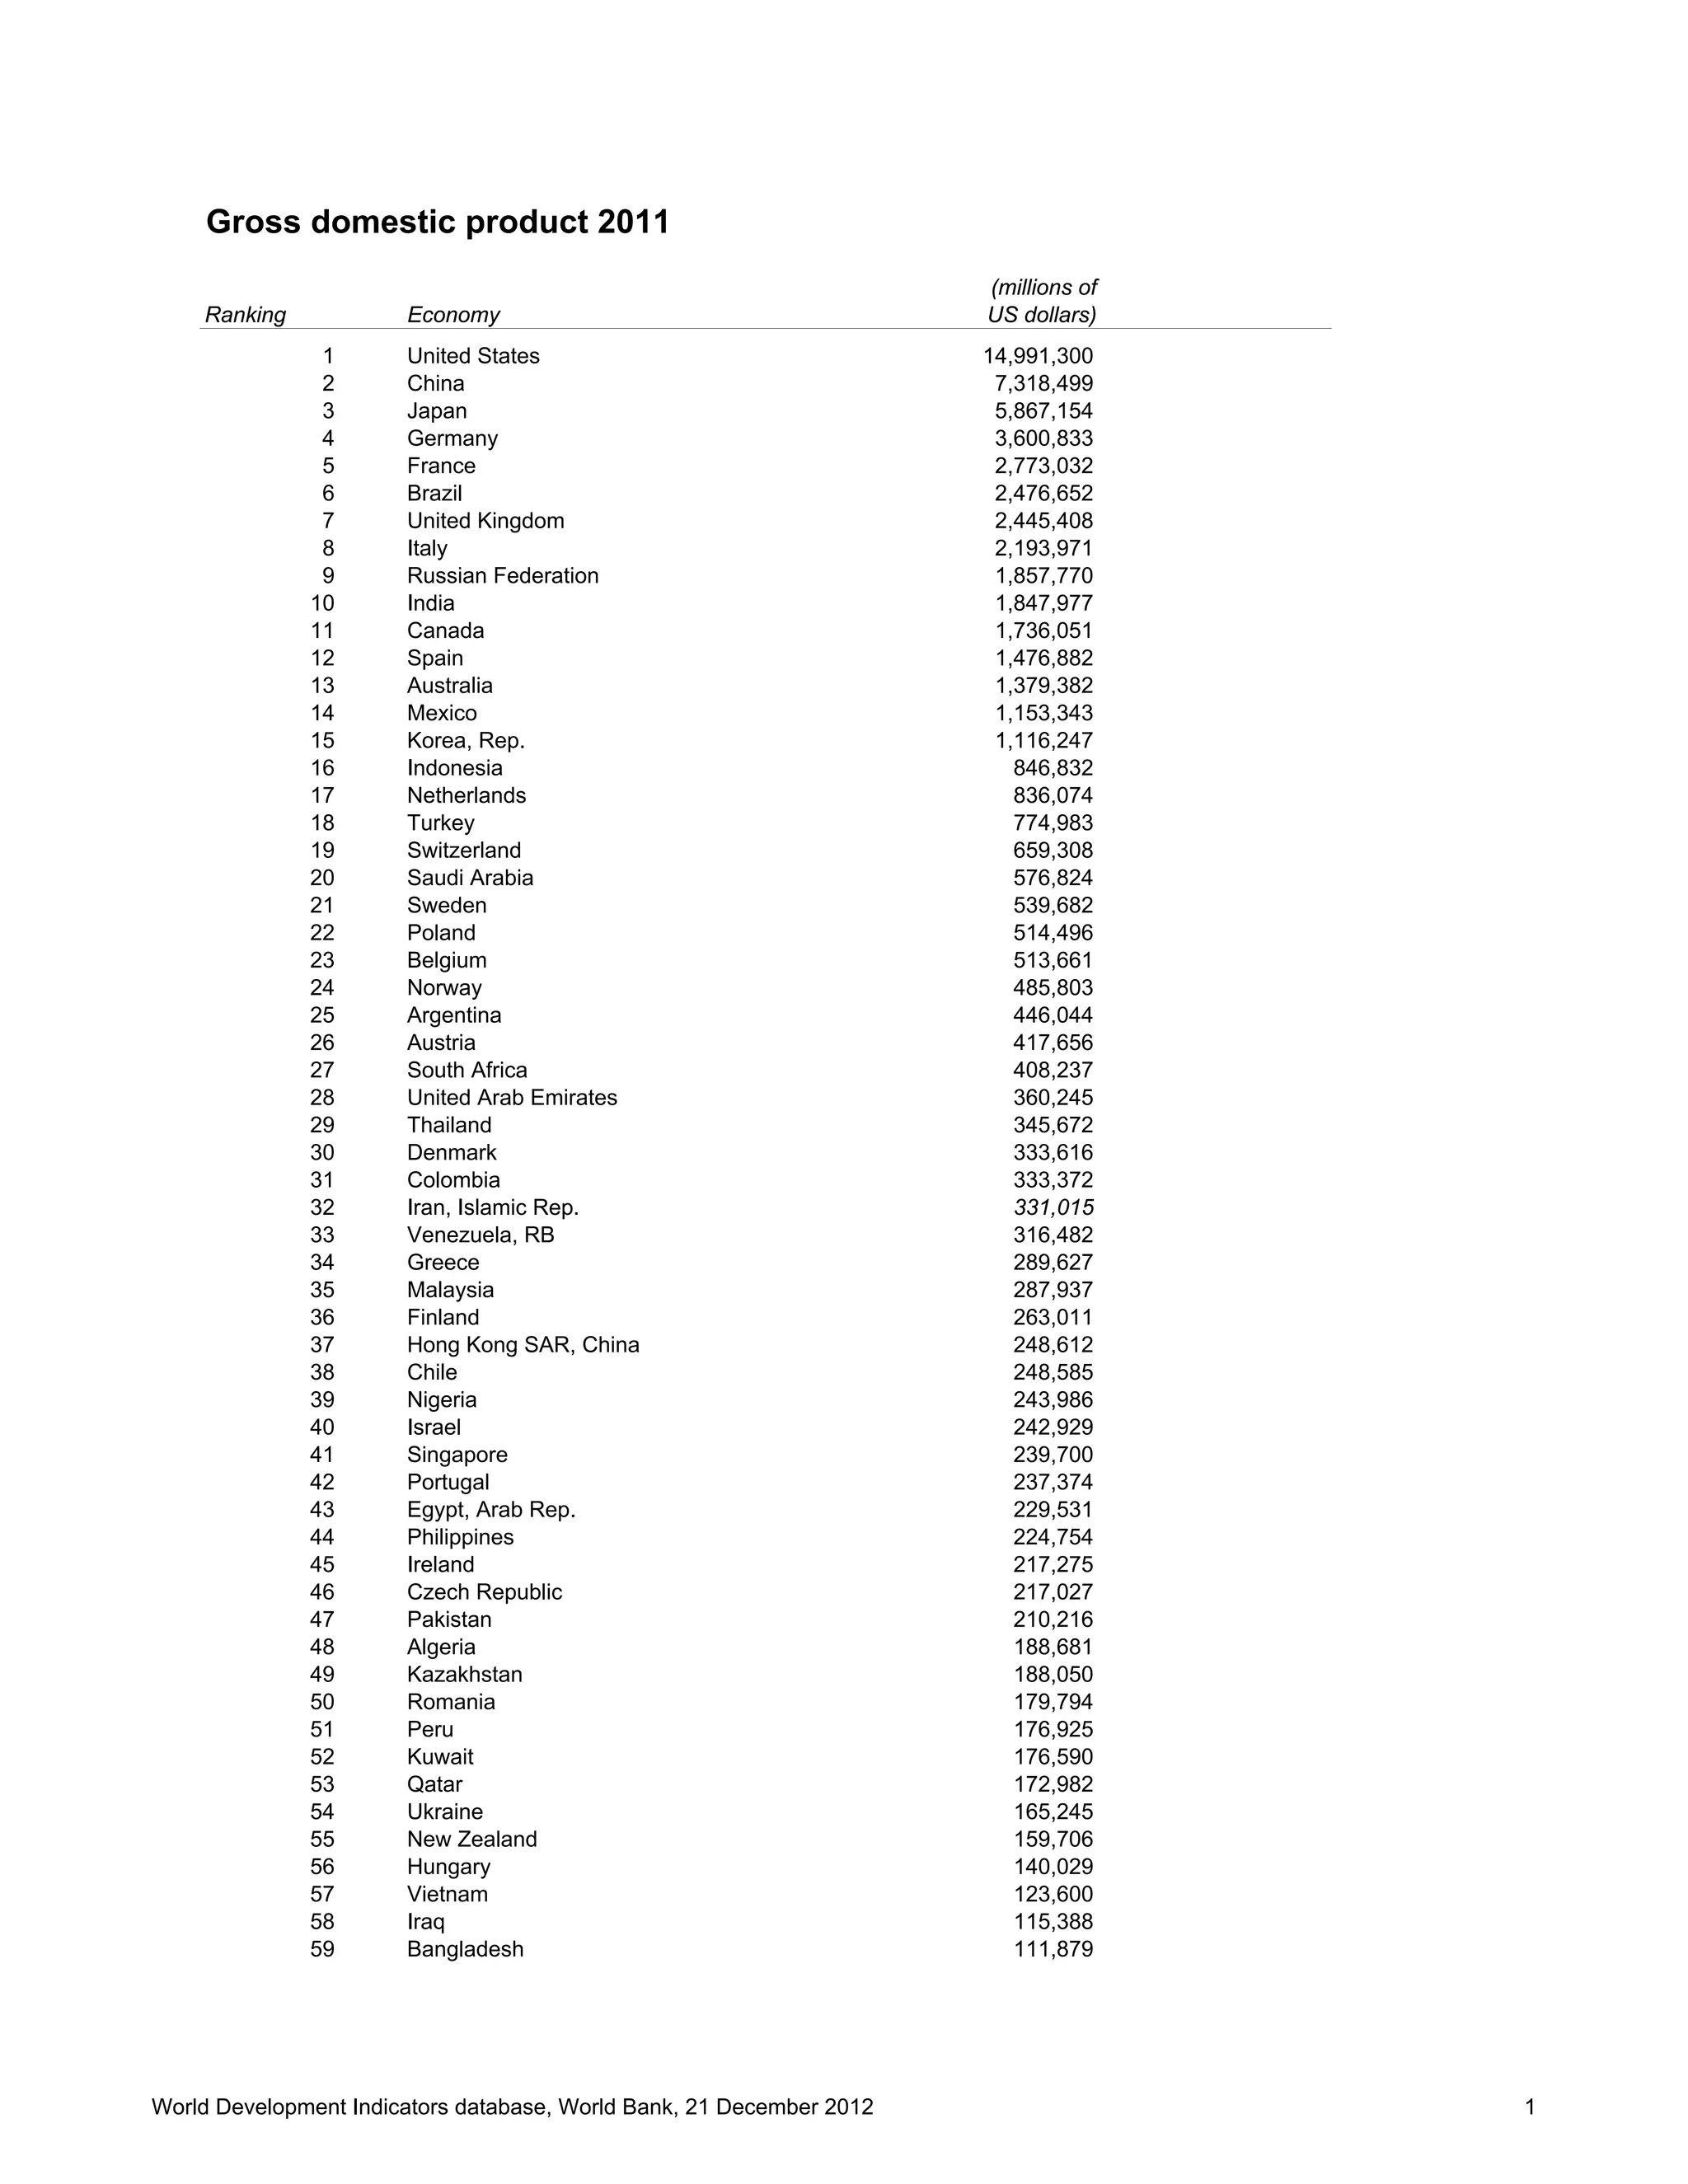
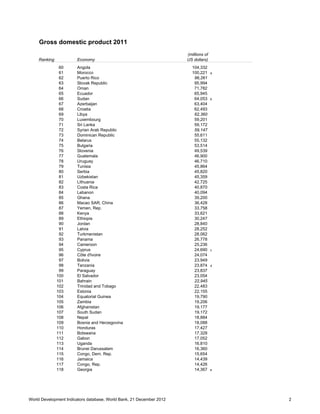
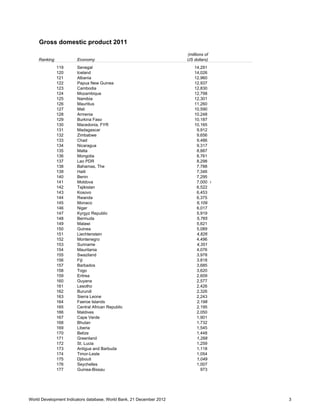
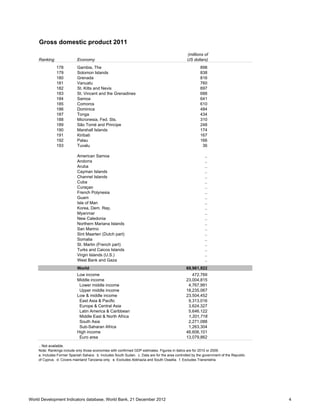
1. The document lists the gross domestic product (GDP) in millions of US dollars for 192 economies in 2011.
2. The United States had the highest GDP at $14,991,300 million, followed by China at $7,318,499 million and Japan at $5,867,154 million.
3. World GDP in 2011 was $69,981,922 million.
1. The document lists the gross domestic product (GDP) in 2011 at purchasing power parity (PPP) in millions of international dollars for 181 economies worldwide.
2. The United States had the highest GDP at $14,991,300 million, followed by China at $11,290,911 million and India at $4,503,069 million.
3. The World Bank database provides GDP at PPP figures to compare the relative size of economies globally based on their domestic purchasing power.
CSI.SP: Introduction to São Paulo by Roberto Rocco (11 Feb 2009)Jasper Moelker
The first official lecture will introduce São Paulo in a way that people who have never been there get a brief overview of the historic dynamics that help shaping the megacity of today and well acquainted participants hear a refreshing story about the ‘city of contrasts’.
This document provides information about mail-in ballots received from Mexican citizens living abroad for the 2012 election. It includes tables reporting the number of ballots received by date, country of residence, and Mexican state and electoral district. A total of 40,961 mail-in ballots were received from citizens in 92 different countries by the election deadline. The United States, Spain, Canada, and France were the countries with the largest numbers of ballots received.
An investigation analyzed the relationship between population growth rates and GDP rates in 50 randomly selected countries from 2009 to 2010. Population and GDP data from 2009 and 2010 was collected and used to calculate growth rates for each country. A chi-squared test was performed to determine if there was a statistically significant relationship between population growth and GDP rates at the 5% significance level. The results of the chi-squared test were then compared to critical values to determine if the null hypothesis could be rejected or not.
EyeforTravel conducted a global survey amongst key travel executives in January to February 2011 with the aim of investigating distribution and marketing performance and perspectives for the quarter.
1. New international student enrollment in the U.S. increased 15.8% in 2008/09 to over 200,000 students.
2. Total international student enrollment in the U.S. reached a record high of over 671,000 in 2008/09, a 7.7% increase from the previous year.
3. The top places of origin for international students were India, China, South Korea, Canada, and Japan, comprising over 50% of all international students.
This document summarizes key trends in internet and mobile usage from a presentation given on May 30, 2012. It finds that while internet and mobile adoption continues to grow rapidly globally, mobile monetization faces challenges. Specifically, mobile advertising rates and revenues per user are significantly lower than desktop levels, constraining revenue growth for companies like Google and Facebook as mobile usage increases. However, mobile traffic and app revenues are also growing quickly, suggesting substantial monetization potential if these gaps can be closed.
The document discusses trends in internet and mobile device usage from 2012. It notes that global internet users grew by 8% in 2011 to over 2 billion, with most growth occurring in emerging markets like China and India. Mobile adoption was also rising rapidly, with over 1 billion global 3G subscribers by late 2011, though this still only represented 18% of mobile users. The iPad saw much faster adoption than the iPod or iPhone, shipping over 70 million units within its first 8 quarters. Android phone adoption was even more rapid than the iPhone.
The document discusses trends in internet and mobile device usage from 2012. It notes that global internet users grew by 8% in 2011 to over 2 billion, with most growth occurring in emerging markets like China and India. Mobile adoption is also growing rapidly, with over 1 billion global 3G subscribers by late 2011, though this still only represents 18% of mobile users. The iPad saw much faster adoption than the iPod or iPhone, shipping over 70 million units in its first 8 quarters. Android phone adoption has also ramped up faster than the iPhone.
This document summarizes key trends in internet and mobile usage from a presentation given on May 30, 2012. It finds that while internet and mobile adoption continues to grow rapidly globally, mobile monetization faces challenges. Specifically, mobile advertising rates and revenues per user are significantly lower than desktop levels, constraining revenue growth despite rising user numbers. This gap represents a major opportunity if mobile advertising models can be improved.
Basic Stats – Internet Growth Remains Robust, Rapid Mobile Adoption Still in Early Stages
2) Re-Imagination – of Nearly Everything
3) Economy – Mixed Trends, With Negative Bias
4) ‘USA, Inc.’ – A Lot to be Excited About in Tech, A Lot to be Worried about in Other Areas
5) Bubble – or Not?
This document summarizes key trends in internet and mobile usage from a presentation given on May 30, 2012. It finds that while internet and mobile adoption continues to grow rapidly globally, mobile monetization faces challenges. Specifically, mobile advertising rates and revenues per user are significantly lower than desktop levels, constraining revenue growth for companies even as user engagement shifts to mobile. However, the document also notes that the mobile market still has significant room for monetization growth over time.
Kleiner Perkins Mary Meeker Internet Trends 2012TedOBrien
This document summarizes key trends in internet and mobile usage from a presentation given on May 30, 2012. It finds that while internet and mobile adoption continues to grow rapidly globally, mobile monetization faces challenges. Specifically, mobile advertising rates and revenues per user are significantly lower than desktop levels, constraining revenue growth despite rising user numbers. This gap represents a major opportunity for the mobile industry to develop new monetization models.
Project activity: Create a small business of our class. The pupils created a business plan and presented their business.
Bridges over Times and Cultures 2012 - 2014
Bridges are structures built to span obstacles like bodies of water, valleys, and roads in order to allow continuous travel over them. Bridges can be made of various materials like wood, stone, iron, or steel, and take different forms such as suspension bridges, drawbridges, and covered bridges. Some key bridges mentioned are the Golden Gate Bridge spanning the San Francisco Bay, the Ponte Vecchio bridge over the Arno River in Florence, and London's Tower Bridge which has a drawbridge over the Thames River.
This document discusses different types of bridges. It defines a bridge as a structure built over a road, railway, river, or other passageway to allow people or vehicles to cross between two locations. Some of the bridge types discussed include suspension bridges, which are made of cables; arch bridges, often built over rivers; covered bridges, which protect the passageway from weather; and moon bridges, small bridges situated in parks or gardens for pedestrians. Pictures are provided to illustrate the different bridge designs.
This document discusses delivering clinical knowledge and guidance directly into healthcare workflows through clinical decision support (CDS). CDS aims to provide clinicians and patients with intelligently filtered, situation-specific information to enhance patient care. The goal is to repurpose existing clinical content from various sources and deliver the most precise and useful information for each workflow and information need. Physician information needs were analyzed from query data to develop an ontology of needs. Content is curated, indexed as discrete facts, and tailored for specific situations by matching it to patient data, workflows, and information needs. Knowledge delivery aims to integrate actionable tools and options directly into clinical systems like EHRs.
"Bridges" is a PowerPoint for primary and secondary students that provides an overview of the different types of bridges and their uses. It also highlights careers in infrastructure development specific to bridge building and maintenance. Additionally, this lesson can be paired with a "Bridge Building" activity.
The document provides data on gross national income per capita in 2009 for various countries and economies according to the Atlas methodology and purchasing power parity estimates. Using the Atlas methodology, Monaco had the highest GNI per capita at $203,900, while Sudan had the lowest at $1,230. Purchasing power parity estimates found Luxembourg had the highest GNI per capita of $57,640, while Tanzania had the lowest of $1,350. The data is ranked from highest to lowest GNI per capita for both the Atlas methodology and purchasing power parity estimates.
1. Monaco had the highest gross national income per capita in 2009 according to the Atlas methodology, at $203,900, followed by Liechtenstein at $113,210.
2. When measured using purchasing power parity, Luxembourg had the highest income at $57,640, followed by Kuwait at $53,590.
3. The rankings show variations between countries' incomes when measured using market exchange rates versus purchasing power parity.
This document lists the land area in square kilometers of various countries and territories around the world. The largest by far is Russia at 16,995,800 sq km, followed by Canada at 9,093,507 sq km and the United States at 9,161,923 sq km. Many smaller island nations and territories have land areas under 1000 sq km.
The document provides information about countries in three categories: size, population, and wealth. It ranks the largest 20 countries by area, from Russia as the largest to Chad. It also ranks the smallest 20 countries by area, from Vatican City as the smallest to Tonga. Additionally, it ranks the most populated countries, led by China, as well as the wealthiest and poorest countries based on GDP per capita.
The document provides mobile usage statistics for September for various countries around the world. It lists the unique reach and impressions for the top 20 countries, as well as worldwide totals. The top 5 countries by unique reach were Indonesia, Egypt, Mexico, India, and the United Kingdom.
The document is a table summarizing consolidated cross-border claims and local claims in foreign currency reported by banks on an immediate borrower basis by country, maturity, and sector as of September 2011. The table shows total foreign claims on all countries were $31.9 trillion with $23.8 trillion on developed countries, including $14.9 trillion in Europe. Claims were concentrated in banks and public sectors.
The document analyzes trade data between Miami and other countries/regions from 1992-2008. It shows that:
- Miami's share of total US trade has remained relatively steady at around 2.5-3% over this period.
- In 2008, Miami ran its largest trade deficit with China and its largest trade surpluses with Brazil, Venezuela, and Colombia.
- Between 1992-2008, Miami's total trade increased significantly with its top trade partners growing on average over 200%.
Argentina produces approximately 44,800 tons of raisins annually, with 95% grown in the province of San Juan and the remainder in neighboring provinces. Raisins are grown on alluvial soils under flood or drip irrigation supplied by snowmelt water from the Andes mountains. Common varieties include Flame Seedless, Fiesta, Thompson Seedless, and Arizul. Grapes are trucked to drying yards with mesh trays and dried for 10-20 days before export, primarily to Brazil, the US, and EU countries.
This document shows the ranking of countries in 2006 by their Gross National Income (GNI) per capita according to the Atlas method and by Purchasing Power Parity (PPP). The top country by the Atlas method was Luxembourg with a GNI per capita of $76,040, while the top country by PPP was also Luxembourg with $59,560. Many Western European countries and North American countries had high rankings in both measures.
U 21 talent development compared to population - siggi eyjolfsson (1)Robin.Russell
The document analyzes which countries outperform relative to their population in producing top Under-21 football talent according to UEFA rankings from 2007-2011. It finds that smaller countries like Wales, Iceland, Serbia, and Montenegro tend to outperform larger countries. The countries that most overachieve relative to their population are Wales, Iceland, Serbia, and Northern Ireland, while underachievers include larger countries like Germany, France, and Turkey.
The document provides statistics from Google Analytics in 2011 about user traffic on Megaupload and Megavideo websites. It includes data on the top 20 European and non-European countries by unique users, page impressions, and other metrics. The statistics are broken down by country and month. It also includes brief descriptions of Megaupload and Megavideo's services and compares their age demographics to Netflix and Hulu.
This document provides population and geographical data for 122 countries. It lists each country's name, population, land area in square kilometers, population density per square kilometer, and population per square kilometer. The countries are ranked from most populous to least populous based on population size.
The document provides an overview of the global precious metals market in 2009. It summarizes that gold prices averaged $973 per ounce in 2009, up 12% from 2008. China became the largest gold producer in 2007 and 2008. Global gold production in 2009 was estimated at 2,488 metric tons, up 3% from 2008. India was the largest consumer of gold in 2008 at 578 metric tons. The document also provides tables of historical gold production, consumption, prices, and reserves by country. It concludes by noting expected rising gold demand from resurgent Southeast Asian economies and India.
This document summarizes exports from India to various countries in 2016-17, listing the quantity in metric tons and value in rupees lacs for each country. The top three export destinations by value were the USA, UK, and Germany. A total of 22,086.11 metric tons of exports valued at 54,873.96 rupees lacs are reported across 111 different countries.
The document presents statistics on mobile messenger usage and impressions in September. It shows the number of users and impressions for various mobile messengers, lite messengers, and iPhone apps in different countries worldwide. The largest number of mobile messenger users was in Indonesia, while the highest impressions were in the United States. The data is from eBuddy, a global leader in web and mobile messaging.
The document discusses import trends for fresh fruits and vegetables in Indonesia from 2002-2006. It found that imports of grapes, mangoes, onions, and chillies all significantly increased in value and quantity during this period, with the major exporting countries being Australia, Thailand, the Philippines, and Singapore. However, tomato imports decreased substantially in both value and volume. The document then provides detailed import data and analysis for each of these crops to examine the leading exporters and growth trends over the five-year period.
This document discusses the need for nations to develop their own science, technology and innovation (STI) capacity for economic growth and development. It notes that investing in STI is necessary, not a luxury, for poorer countries to become richer. The document presents rankings from the Global Competitiveness Report that show Nigeria lagging behind other nations in measures of competitiveness, highlighting the need to strengthen STI infrastructure and capabilities. It advocates developing engineering infrastructure and small-scale manufacturing to add value to natural resources and drive economic development in Ekiti State.
This document provides information about the geography, population, and political divisions of Europe. It discusses the various landforms and waterforms that make up Europe's physical geography. Tables are included that list European countries and territories, their areas, populations, population densities, and capital cities. The population information is from 2010 estimates. In total, the document outlines key details about the physical features and demographic makeup of the continent.
This document shows Indonesian natural rubber exports by destination country from 1995 to 2011. The top three export destinations in 2011 were the United States, Japan, and China. Exports to the United States, Japan, and China have generally increased over time, while exports to some other countries like Singapore and South Korea have fluctuated. The data is sourced from Gapkindo and Indonesia's central statistics agency.
This document contains economic and emissions data for 26 countries including GDP per capita, CO2 emissions per capita, life expectancy, fossil fuel consumption and non-fossil fuel consumption. The data includes values for variables such as GDPPC, CO2PC, LPC_1000, KPC, FFPC, NFFPC and lambda.
4. Gross domestic product 2011
(millions of
Ranking Economy US dollars)
178 Gambia, The 898
179 Solomon Islands 838
180 Grenada 816
181 Vanuatu 760
182 St. Kitts and Nevis 697
183 St. Vincent and the Grenadines 688
184 Samoa 641
185 Comoros 610
186 Dominica 484
187 Tonga 434
188 Micronesia, Fed. Sts. 310
189 São Tomé and Principe 248
190 Marshall Islands 174
191 Kiribati 167
192 Palau 166
193 Tuvalu 36
American Samoa ..
Andorra ..
Aruba ..
Cayman Islands ..
Channel Islands ..
Cuba ..
Curaçao ..
French Polynesia ..
Guam ..
Isle of Man ..
Korea, Dem. Rep. ..
Myanmar ..
New Caledonia ..
Northern Mariana Islands ..
San Marino ..
Sint Maarten (Dutch part) ..
Somalia ..
St. Martin (French part) ..
Turks and Caicos Islands ..
Virgin Islands (U.S.) ..
West Bank and Gaza ..
World 69,981,922
Low income 472,769
Middle income 23,004,815
Lower middle income 4,767,991
Upper middle income 18,235,067
Low & middle income 23,504,452
East Asia & Pacific 9,313,016
Europe & Central Asia 3,624,327
Latin America & Caribbean 5,646,122
Middle East & North Africa 1,201,718
South Asia 2,271,088
Sub-Saharan Africa 1,263,304
High income 46,606,101
Euro area 13,079,862
.. Not available.
Note: Rankings include only those economies with confirmed GDP estimates. Figures in italics are for 2010 or 2009.
a. Includes Former Spanish Sahara. b. Includes South Sudan. c. Data are for the area controlled by the government of the Republic
of Cyprus. d. Covers mainland Tanzania only. e. Excludes Abkhazia and South Ossetia. f. Excludes Transnistria.
World Development Indicators database, World Bank, 21 December 2012 4