SlideShare a Scribd company logo
South Florida Market Share of U.S. Trade, 1992-2008


            Year U.S. (Trillions) Miami (Billions) Share
             2008           $3.40            $90.24 2.65%
             2007           $3.12            $79.05 2.53%
             2006           $2.89            $72.10 2.49%
             2005           $2.58            $65.90 2.55%
             2004           $2.29            $58.88 2.57%
             2003           $1.98            $52.17 2.63%
             2002           $1.85            $49.60 2.67%
             2001           $1.87            $53.37 2.85%
             2000           $2.00            $55.82 2.79%
             1999           $1.72            $51.07 2.97%
             1998           $1.59            $50.42 3.16%
             1997           $1.56            $47.42 3.04%
             1996           $1.42            $39.57 2.79%
             1995           $1.33            $36.07 2.72%
             1994           $1.18            $31.10 2.65%
             1993           $1.05            $27.86 2.66%
             1992           $0.98            $25.69 2.62%


Source: WorldCity analysis of U.S. Census data. For more information, visit
                         www.worldcityweb.com
Miami's Top 50 Deficit Partners, 2008

  Ranking    Deficit                     2008 1 Yr Change
Change 2008 World Total         19,586,639,924 7,713,384,377
       0   1 China              -4,144,615,320 -722,188,183
       0   2 France             -1,522,092,091    17,155,148
       7   3 Japan                -725,969,772 -369,867,166
       4   4 Netherlands          -687,889,454 -267,399,231
      -1   5 Italy                -644,393,157   305,441,822
      -3   6 United Kingdom       -584,896,862   496,455,197
      -2   7 South Korea          -454,067,136   178,631,929
      -1   8 Taiwan               -408,226,380    14,468,849
       0   9 Canada               -396,039,585   -35,092,110
       1  10 Thailand             -284,857,401    21,461,980
       3  11 Indonesia            -251,074,146   -59,670,436
       0  12 Malaysia             -206,842,689    46,097,479
       2  13 India                -165,371,663    16,357,142
      -1  14 Nicaragua            -151,464,538    79,765,793
       6  15 Vietnam              -149,236,389   -32,140,126
      16  16 Belarus              -148,030,484 -116,478,947
      31  17 Mexico               -114,739,737 -110,243,348
       1  18 Austria              -113,435,333    27,062,883
       5  19 Norway               -100,505,884   -24,913,316
       3  20 Israel                -81,268,425      5,468,964
      -3  21 Sweden                -71,731,466    71,281,133
      -5  22 Turkey                -71,589,325    94,066,452
       4  23 Denmark               -71,586,824   -23,936,743
    174   24 Lithuania             -60,931,018   -78,903,703
      -9  25 Haiti                 -59,591,870   108,216,755
      -4  26 Russia                -56,374,511    48,534,967
       3  27 Bangladesh            -48,544,947   -11,741,897
       3  28 Portugal              -39,383,814     -7,763,007
    166   29 Bermuda               -38,469,250   -50,872,113
      -4  30 Philippines           -38,222,852    15,155,719
     -11  31 Spain                 -36,146,121    96,561,367
      -3  32 Australia             -35,497,324      8,668,888
      -5  33 Pakistan              -33,221,522    11,664,168
       2  34 Bulgaria              -22,622,074     -3,261,544
      -1  35 New Zealand           -20,551,753        435,852
     -30  36 Germany               -16,713,412   409,570,604
      -4  37 Hungary               -12,257,028    13,704,600
      -1  38 Cambodia               -9,796,202        948,296
      -1  39 Chad                   -9,654,063       -100,123
       3  40 Morocco                -7,519,616       -613,745
       3  41 Slovenia               -7,227,778     -1,859,992
       0  42 Kenya                  -4,779,982      2,953,277
       4  43 Macao                  -4,038,373        625,258
       7  44 Fiji                   -3,169,519        401,276
    128   45 Algeria                -2,557,927     -4,739,663
      76  46 Ethiopia               -2,225,252     -2,407,997
      -7  47 Czech Republic         -1,934,901      7,198,386
    102   48 Tunisia                -1,509,742     -2,401,673
      -3  49 Sri Lanka              -1,501,582      3,430,495
       0  50 Monaco                 -1,474,162      2,658,627


      Source: WorldCity analysis of U.S. Census data. For more information, visit www.worldcityweb.com
Miami's Top 50 Surplus Partners, 2008

  Ranking    Surplus                                      2008 1-Year Change
Change 2008 World Total                          19,586,639,924 7,713,384,377
       0   1 Brazil                               8,047,193,151 1,956,956,928
       0   2 Venezuela                            3,890,709,611    928,841,324
       1   3 Colombia                             1,969,263,334    585,774,486
      -1   4 Argentina                            1,868,645,966    254,438,815
       0   5 Costa Rica                           1,571,066,656    420,909,987
       1   6 Chile                                1,552,410,443    492,113,520
      -1   7 Paraguay                             1,342,811,973    233,401,810
       0   8 Panama                               1,269,222,230    257,499,600
       0   9 Peru                                 1,190,737,818    298,549,118
      12  10 Switzerland                          1,074,277,483    926,352,827
       0  11 Dominican Republic                     880,546,742    217,378,819
       1  12 Ecuador                                854,890,119    267,284,421
      -3  13 Bahamas                                703,206,999   -173,194,865
      -2  14 Trinidad and Tobago                    613,205,698      2,987,762
       0  15 Guatemala                              556,865,783    111,551,748
      -2  16 Jamaica                                513,187,633    -66,245,398
      -1  17 Netherlands Antilles                   481,760,977    125,196,747
      -1  18 Cayman Islands                         335,658,169     14,262,310
       2  19 Uruguay                                312,243,620    112,552,806
      -1  20 Barbados                               259,188,100     15,865,026
      -1  21 Turks and Caicos Islands               228,819,764     15,566,814
       7  22 United Arab Emirates                   157,675,584     84,956,240
       4  23 Finland                                143,316,472     62,236,072
      -6  24 El Salvador                            133,639,327   -160,587,251
      11  25 Bolivia                                114,017,555     70,467,667
      11  26 Honduras                               113,226,259     73,724,365
      -4  27 Antigua and Barbuda                    100,282,905     -4,993,783
       6  28 Cuba                                    89,835,816     33,841,987
      -1  29 British Virgin Islands                  87,095,300      9,028,511
       1  30 Suriname                                85,799,925     16,153,708
      -5  31 St Lucia                                85,323,408      1,746,806
      -2  32 Guyana                                  80,023,915      8,838,383
       0  33 Belize                                  77,175,653     19,622,592
       1  34 Dominica                                56,064,430        760,405
      14  35 Lebanon                                 53,661,671     39,764,643
      -4  36 Anguilla                                50,093,005    -11,710,454
    173   37 Singapore                               47,321,104     68,066,987
       3  38 Aruba                                   47,316,205     15,473,301
     -14  39 Hong Kong                               45,062,703    -38,633,082
       0  40 St Vincent and the Grenadines           41,548,472      9,687,892
      10  41 South Africa                            40,783,315     29,245,739
      29  42 Cyprus                                  39,222,613     36,960,455
      -4  43 St Kitts and Nevis                      36,547,527      3,782,666
       0  44 Angola                                  34,254,927     12,102,131
      -7  45 Grenada                                 32,626,503     -1,766,385
      13  46 Greece                                  30,084,531     24,523,154
      -4  47 Nigeria                                 29,912,818      7,316,903
    144   48 Slovakia                                28,096,969     30,220,790
      14  49 Poland                                  24,299,908     20,580,007
      -5  50 Martinique                              21,578,039       -317,114


       Source: WorldCity analysis of U.S. Census data. For more information, visit www.worldcityweb.com
Miami's Top 50 Import Partners, 2008

  Ranking    Total Imports                       2008 1-Year % Change 16-Year % Change
Change 2008 World Total               $35,329,090,974             5.19%         266.05%
       0   1 China                     $4,398,813,122            17.91%        1107.90%
       0   2 Brazil                    $2,559,165,749             9.72%         269.72%
       1   3 Honduras                  $1,945,478,896             2.54%         355.69%
       2   4 Colombia                  $1,834,918,361             5.57%         157.26%
      -2   5 Dominican Republic        $1,830,045,494            -3.75%         121.23%
      -1   6 France                    $1,763,693,479            -2.20%         320.26%
       3   7 Venezuela                 $1,246,814,125             3.58%         150.84%
       0   8 Costa Rica                $1,197,982,451            -5.60%         116.92%
       5   9 Netherlands               $1,125,408,064            35.48%        1024.45%
      -3  10 United Kingdom            $1,119,712,966           -24.41%         325.35%
       5  11 Japan                     $1,102,684,470            46.25%         116.07%
      -3  12 Italy                     $1,050,044,376           -14.81%         187.70%
       0  13 Chile                      $876,730,666              3.78%         618.74%
       1  14 Mexico                     $876,365,819              9.49%         594.60%
      -3  15 Guatemala                  $859,568,013             -0.54%         107.07%
       2  16 El Salvador                $813,314,040             16.33%         314.48%
      -6  17 Germany                    $678,549,641            -24.21%         179.70%
       1  18 Nicaragua                  $664,744,328             11.15%        2227.94%
       1  19 Peru                       $654,309,911             33.04%         483.36%
      -3  20 South Korea                $566,246,710            -20.79%         208.71%
       1  21 Taiwan                     $502,609,871              5.37%           30.44%
       4  22 Switzerland                $492,693,953             30.88%         624.64%
       2  23 Canada                     $477,299,580             20.91%         472.41%
      -1  24 Spain                      $463,824,738             -0.75%         182.86%
      -4  25 Ecuador                    $431,696,455            -10.20%         175.03%
      -2  26 Haiti                      $425,945,802             -7.46%         478.83%
       0  27 Thailand                   $330,788,440             -3.21%         256.96%
       2  28 Indonesia                  $291,560,212             36.14%         880.06%
      10  29 Belgium                    $245,502,646             78.86%        1275.86%
       6  30 Bahamas                    $240,305,943             36.71%         231.95%
       0  31 Argentina                  $239,694,577             17.10%         422.34%
      -4  32 Malaysia                   $233,809,968            -17.72%         102.97%
      15  33 Trinidad and Tobago        $225,123,655           145.95%         1094.59%
      -5  34 India                      $223,864,140             -4.43%         410.70%
      -1  35 Hong Kong                  $204,610,833             11.08%           61.15%
       1  36 Panama                     $183,566,979              9.92%         106.36%
      10  37 Jamaica                    $179,328,901             90.86%          -17.64%
       3  38 Vietnam                    $174,954,445             32.54%     2242905.71%
      21  39 Belarus                    $148,182,575           366.44%        55897.41%
       6  40 Norway                     $147,480,645             47.60%         870.44%
      -8  41 Turkey                     $139,567,592            -25.13%         860.32%
      -7  42 Russia                     $132,810,761            -25.16%        9066.08%
      -5  43 Austria                    $125,018,904            -17.37%         325.63%
     -12  44 Sweden                     $124,792,376            -33.10%         282.78%
      -5  45 Aruba                      $121,241,656             -9.19%        8619.90%
      -1  46 Bolivia                    $119,366,150             11.34%         135.67%
      -5  47 Australia                  $108,323,195             -8.60%         199.80%
      -5  48 Israel                     $108,233,126             -4.16%           87.86%
       0  49 Denmark                    $108,159,612             20.67%         208.06%
      28  50 Lithuania                    $84,009,873          679.80% NA


      Source: WorldCity analysis of U.S. Census data. For more information, visit www.worldcityweb.com
Miami's Top 50 Export Partners, 2008

  Ranking    Total Exports                             2008 1-Year % Change 16-Year % Change
Change 2008 World Total                     $54,915,730,898            20.80%         242.34%
       0   1 Brazil                         $10,606,358,900            25.93%         797.93%
       0   2 Venezuela                       $5,137,523,736            23.33%         107.17%
       0   3 Colombia                        $3,804,181,695            21.87%         166.18%
       1   4 Costa Rica                      $2,769,049,107            14.46%         326.89%
      -1   5 Dominican Republic              $2,710,592,236             5.69%         182.89%
       1   6 Chile                           $2,429,141,109            27.51%         257.28%
       1   7 Argentina                       $2,108,340,543            15.91%           94.59%
      -2   8 Honduras                        $2,058,705,155             6.30%         431.57%
       0   9 Peru                            $1,845,047,729            33.31%         423.55%
       9  10 Switzerland                     $1,566,971,436          198.82%         3942.47%
       0  11 Panama                          $1,452,789,209            23.25%         169.39%
      -2  12 Guatemala                       $1,416,433,796             8.16%         178.56%
      -1  13 Paraguay                        $1,351,020,906            20.99%         346.04%
      -1  14 Ecuador                         $1,286,586,574            20.43%         196.65%
       0  15 El Salvador                      $946,953,367             -4.68%         229.20%
      -2  16 Bahamas                          $943,512,942            -10.33%           97.18%
       0  17 Trinidad and Tobago              $838,329,353             19.46%         443.84%
      -2  18 Mexico                           $761,626,082             -4.31%         129.37%
      -1  19 Jamaica                          $692,516,534              2.84%           58.62%
       0  20 Germany                          $661,836,229             41.10%         155.30%
       2  21 United Kingdom                   $534,816,104             33.72%         148.47%
      -1  22 Netherlands Antilles             $526,346,931             26.98%           93.96%
       2  23 Nicaragua                        $513,279,790             39.92%         421.39%
      -2  24 Netherlands                      $437,518,610              6.66%         348.78%
       2  25 Spain                            $427,678,617             27.82%           69.96%
       4  26 Italy                            $405,651,219             43.50%         113.81%
      -3  27 Japan                            $376,714,698             -5.32%         392.57%
       1  28 Haiti                            $366,353,932             25.26%         269.90%
       4  29 Uruguay                          $358,471,672             39.13%         268.40%
      -4  30 Cayman Islands                   $345,694,601              3.25%         382.06%
       3  31 Barbados                         $273,547,668              6.33%         327.42%
     20   32 Belgium                          $260,049,453           265.18%          496.29%
      -5  33 China                            $254,197,802            -17.51%        4284.78%
      -3  34 Hong Kong                        $249,673,536             -6.80%        2414.56%
      -3  35 France                           $241,601,388             -8.53%          -11.14%
      -1  36 Turks and Caicos Islands         $238,483,708              7.38%        1091.09%
       0  37 Bolivia                          $233,383,705             54.81%         205.75%
       3  38 United Arab Emirates             $178,438,328             74.26%        1614.76%
      -3  39 Aruba                            $168,557,861              1.94%           22.41%
      -1  40 Finland                          $164,343,820             49.18%        1317.36%
       1  41 Guyana                           $133,978,337             33.84%           68.74%
       2  42 Belize                           $112,235,619             26.53%           58.62%
       4  43 South Korea                      $112,179,574             36.59%        1386.18%
       1  44 Suriname                         $110,177,678             24.72%           83.48%
      -2  45 Singapore                        $107,176,384             19.16%         198.24%
      -6  46 Antigua and Barbuda              $102,679,916             -5.47%         176.04%
     10   47 Taiwan                             $94,383,491            73.80%         984.43%
       2  48 South Africa                       $93,429,144            26.71%         395.77%
       6  49 Cuba                               $89,859,816            59.90%        7541.53%
      -2  50 British Virgin Islands             $87,720,791            10.28%         533.09%


       Source: WorldCity analysis of U.S. Census data. For more information, visit www.worldcityweb.com
South Florida's Top 50 Trade Partners, 2008

          Ranking            Total Trade                               2008 1-Year % Change 16-Year % Change
Change    2008 2007     1992 World Total                    $90,244,821,872            14.17%         251.25%
      0      1     1       3 Brazil                         $13,165,524,649            22.41%         602.77%
      0      2     2       1 Venezuela                       $6,384,337,861            18.91%         114.46%
      0      3     3       2 Colombia                        $5,639,100,056            16.04%         163.22%
      1      4     5      24 China                           $4,653,010,924            15.21%        1157.69%
     -1      5     4       4 Dominican Republic              $4,540,637,730             1.67%         154.32%
      0      6     6       8 Honduras                        $4,004,184,051             4.44%         391.78%
      0      7     7       5 Costa Rica                      $3,967,031,558             7.56%         230.33%
      0      8     8       9 Chile                           $3,305,871,775            20.22%         312.27%
      4      9    13      20 Peru                            $2,499,357,640            33.24%         437.99%
      1     10    11       6 Argentina                       $2,348,035,120            16.03%         107.90%
     -2     11     9       7 Guatemala                       $2,276,001,809             4.71%         146.42%
    13      12    25      39 Switzerland                     $2,059,665,389          128.64%         1829.36%
     -3     13    10      10 France                          $2,005,294,867            -3.01%         189.97%
      0     14    14      18 El Salvador                     $1,760,267,407             4.00%         263.78%
      1     15    16      13 Ecuador                         $1,718,283,029            10.92%         190.91%
     -4     16    12      19 United Kingdom                  $1,654,529,070           -12.05%         245.78%
     -2     17    15      21 Mexico                          $1,637,991,901             2.61%         257.46%
      1     18    19      12 Panama                          $1,636,356,188            21.60%         160.46%
      1     19    20      27 Netherlands                     $1,562,926,674            25.95%         691.05%
      2     20    22      14 Japan                           $1,479,399,168            28.44%         152.11%
     -4     21    17      15 Italy                           $1,455,695,595            -3.93%         162.43%
      1     22    23      26 Paraguay                        $1,359,229,839            20.95%         344.60%
     -5     23    18      17 Germany                         $1,340,385,870            -1.76%         167.10%
     -3     24    21      16 Bahamas                         $1,183,818,885            -3.59%         114.89%
     -1     25    24      35 Nicaragua                       $1,178,024,118            22.09%         827.58%
      2     26    28      29 Trinidad and Tobago             $1,063,453,008            34.06%         514.73%
     -1     27    26      22 Spain                             $891,503,355            11.17%         114.51%
      1     28    29      11 Jamaica                           $871,845,435            13.62%          33.24%
      1     29    30      30 Haiti                             $792,299,734             5.25%         358.96%
     -3     30    27      28 South Korea                       $678,426,284           -14.87%         255.25%
      0     31    31      23 Taiwan                            $596,993,362            12.36%          51.51%
      0     32    32      25 Netherlands Antilles              $570,932,885            20.84%          77.77%
      1     33    34      31 Canada                            $558,559,575            30.34%         265.82%
    13      34    47      47 Belgium                           $505,552,099          142.50%          722.64%
     -2     35    33      33 Hong Kong                         $454,284,369             0.49%         231.84%
      1     36    37      37 Uruguay                           $404,699,724            28.22%         228.27%
     -2     37    35      40 Thailand                          $376,719,479            -0.13%         294.91%
     -2     38    36      44 Cayman Islands                    $355,731,033             2.16%         378.37%
      3     39    42      36 Bolivia                           $352,749,855            36.74%         177.80%
      4     40    44      59 Indonesia                         $332,046,278            40.14%         939.28%
     -2     41    39      32 Aruba                             $289,799,517            -3.03%         108.36%
     -1     42    41      45 Barbados                          $287,907,236             6.17%         307.47%
     -3     43    40      52 India                             $282,356,617            -1.54%         480.73%
     -6     44    38      34 Malaysia                          $260,777,247           -17.32%          97.78%
      0     45    45      64 Turks and Caicos Islands          $248,147,652             7.45%         855.52%
     -3     46    43      78 Russia                            $209,247,011           -16.31%        1908.89%
      1     47    48      55 Turkey                            $207,545,859             0.18%         397.45%
      4     48    52     190 Vietnam                           $200,672,501            36.60%     2572624.37%
      7     49    56      69 United Arab Emirates              $199,201,072            50.82%        1132.85%
    10      50    60      63 Norway                            $194,455,406            56.50%         634.51%


          Source: WorldCity analysis of U.S. Census data. For more information, visit www.worldcityweb.com

More Related Content

What's hot

Web personas
 Web personas Web personas
Web personas
normaisabel2016
 
Avance de crédito infonavit al 29 jul-12
Avance de crédito infonavit al 29 jul-12Avance de crédito infonavit al 29 jul-12
Avance de crédito infonavit al 29 jul-12
Sergio Velazco
 
GNI- purchasing power parity
GNI- purchasing power parityGNI- purchasing power parity
GNI- purchasing power parity
Yatendra Kumar
 
Avance de subsidios al 24 jun 2012
Avance de subsidios al 24 jun 2012Avance de subsidios al 24 jun 2012
Avance de subsidios al 24 jun 2012
Sergio Velazco
 
Avance crediticio al 22 julio 2012
Avance crediticio al 22 julio 2012Avance crediticio al 22 julio 2012
Avance crediticio al 22 julio 2012
Sergio Velazco
 
Avance crediticio al 03 jun 12
Avance crediticio al 03 jun 12Avance crediticio al 03 jun 12
Avance crediticio al 03 jun 12
Sergio Velazco
 
Avance de Crédito Infonavit al 27 may 12
Avance de Crédito Infonavit al 27 may 12Avance de Crédito Infonavit al 27 may 12
Avance de Crédito Infonavit al 27 may 12Sergio Velazco
 
Avance crediticio al 24 junio 2012
Avance crediticio al 24 junio 2012Avance crediticio al 24 junio 2012
Avance crediticio al 24 junio 2012
Sergio Velazco
 
Avance de Crédito Infonavit al 08 julio 2012
Avance de Crédito Infonavit al 08 julio 2012Avance de Crédito Infonavit al 08 julio 2012
Avance de Crédito Infonavit al 08 julio 2012
Sergio Velazco
 
Lanareiknir verdtryggd overdtryggd samanburdur og raungreidslur 20101208
Lanareiknir verdtryggd overdtryggd samanburdur og raungreidslur 20101208Lanareiknir verdtryggd overdtryggd samanburdur og raungreidslur 20101208
Lanareiknir verdtryggd overdtryggd samanburdur og raungreidslur 20101208
Mar Wolfgang Mixa
 
Bnm analisis financiero banca comercial peru - dic 2001
Bnm   analisis financiero banca comercial peru - dic 2001Bnm   analisis financiero banca comercial peru - dic 2001
Bnm analisis financiero banca comercial peru - dic 2001gonzaloromani
 
FIFA World Ranking
FIFA World RankingFIFA World Ranking
FIFA World Ranking
Olivia Taylor
 
Banco Nuevo Mundo - Activos Rentables - Sistema banca comercial Perú - dec 2001
Banco Nuevo Mundo - Activos Rentables - Sistema banca comercial Perú - dec 2001Banco Nuevo Mundo - Activos Rentables - Sistema banca comercial Perú - dec 2001
Banco Nuevo Mundo - Activos Rentables - Sistema banca comercial Perú - dec 2001gonzaloromani
 
Table 8, mdg 8 partnership for development, low- & middle- income countries
Table 8, mdg 8  partnership for development, low- & middle- income countriesTable 8, mdg 8  partnership for development, low- & middle- income countries
Table 8, mdg 8 partnership for development, low- & middle- income countriesBread for the World
 
Wine Production In Depth
Wine Production In DepthWine Production In Depth
Wine Production In DepthMGM Sommelier
 
Bnm analisis financiero banca comercial peru - dic 2000
Bnm   analisis financiero banca comercial peru - dic 2000Bnm   analisis financiero banca comercial peru - dic 2000
Bnm analisis financiero banca comercial peru - dic 2000gonzaloromani
 
Bnm condicion financiera bajo administracion SBS
Bnm   condicion financiera bajo administracion SBSBnm   condicion financiera bajo administracion SBS
Bnm condicion financiera bajo administracion SBSgonzaloromani
 
Banco Nuevo Mundo - Activos Rentables del Sistema Banca Comercial Peru Nov 2000
Banco Nuevo Mundo - Activos Rentables del Sistema Banca Comercial Peru Nov 2000Banco Nuevo Mundo - Activos Rentables del Sistema Banca Comercial Peru Nov 2000
Banco Nuevo Mundo - Activos Rentables del Sistema Banca Comercial Peru Nov 2000gonzaloromani
 
U 21 talent development compared to population - siggi eyjolfsson (1)
U 21 talent development compared to population - siggi eyjolfsson (1)U 21 talent development compared to population - siggi eyjolfsson (1)
U 21 talent development compared to population - siggi eyjolfsson (1)Robin.Russell
 

What's hot (20)

Web personas
 Web personas Web personas
Web personas
 
Avance de crédito infonavit al 29 jul-12
Avance de crédito infonavit al 29 jul-12Avance de crédito infonavit al 29 jul-12
Avance de crédito infonavit al 29 jul-12
 
GNI- purchasing power parity
GNI- purchasing power parityGNI- purchasing power parity
GNI- purchasing power parity
 
Avance de subsidios al 24 jun 2012
Avance de subsidios al 24 jun 2012Avance de subsidios al 24 jun 2012
Avance de subsidios al 24 jun 2012
 
Avance crediticio al 22 julio 2012
Avance crediticio al 22 julio 2012Avance crediticio al 22 julio 2012
Avance crediticio al 22 julio 2012
 
Avance crediticio al 03 jun 12
Avance crediticio al 03 jun 12Avance crediticio al 03 jun 12
Avance crediticio al 03 jun 12
 
Avance de Crédito Infonavit al 27 may 12
Avance de Crédito Infonavit al 27 may 12Avance de Crédito Infonavit al 27 may 12
Avance de Crédito Infonavit al 27 may 12
 
Avance crediticio al 24 junio 2012
Avance crediticio al 24 junio 2012Avance crediticio al 24 junio 2012
Avance crediticio al 24 junio 2012
 
Avance de Crédito Infonavit al 08 julio 2012
Avance de Crédito Infonavit al 08 julio 2012Avance de Crédito Infonavit al 08 julio 2012
Avance de Crédito Infonavit al 08 julio 2012
 
Lanareiknir verdtryggd overdtryggd samanburdur og raungreidslur 20101208
Lanareiknir verdtryggd overdtryggd samanburdur og raungreidslur 20101208Lanareiknir verdtryggd overdtryggd samanburdur og raungreidslur 20101208
Lanareiknir verdtryggd overdtryggd samanburdur og raungreidslur 20101208
 
Bnm analisis financiero banca comercial peru - dic 2001
Bnm   analisis financiero banca comercial peru - dic 2001Bnm   analisis financiero banca comercial peru - dic 2001
Bnm analisis financiero banca comercial peru - dic 2001
 
FIFA World Ranking
FIFA World RankingFIFA World Ranking
FIFA World Ranking
 
Banco Nuevo Mundo - Activos Rentables - Sistema banca comercial Perú - dec 2001
Banco Nuevo Mundo - Activos Rentables - Sistema banca comercial Perú - dec 2001Banco Nuevo Mundo - Activos Rentables - Sistema banca comercial Perú - dec 2001
Banco Nuevo Mundo - Activos Rentables - Sistema banca comercial Perú - dec 2001
 
Table 8, mdg 8 partnership for development, low- & middle- income countries
Table 8, mdg 8  partnership for development, low- & middle- income countriesTable 8, mdg 8  partnership for development, low- & middle- income countries
Table 8, mdg 8 partnership for development, low- & middle- income countries
 
Wine Production In Depth
Wine Production In DepthWine Production In Depth
Wine Production In Depth
 
Bnm analisis financiero banca comercial peru - dic 2000
Bnm   analisis financiero banca comercial peru - dic 2000Bnm   analisis financiero banca comercial peru - dic 2000
Bnm analisis financiero banca comercial peru - dic 2000
 
Bnm condicion financiera bajo administracion SBS
Bnm   condicion financiera bajo administracion SBSBnm   condicion financiera bajo administracion SBS
Bnm condicion financiera bajo administracion SBS
 
Banco Nuevo Mundo - Activos Rentables del Sistema Banca Comercial Peru Nov 2000
Banco Nuevo Mundo - Activos Rentables del Sistema Banca Comercial Peru Nov 2000Banco Nuevo Mundo - Activos Rentables del Sistema Banca Comercial Peru Nov 2000
Banco Nuevo Mundo - Activos Rentables del Sistema Banca Comercial Peru Nov 2000
 
European mapping project
European mapping projectEuropean mapping project
European mapping project
 
U 21 talent development compared to population - siggi eyjolfsson (1)
U 21 talent development compared to population - siggi eyjolfsson (1)U 21 talent development compared to population - siggi eyjolfsson (1)
U 21 talent development compared to population - siggi eyjolfsson (1)
 

Viewers also liked

The Boston Pledge 2010 conference program
The Boston Pledge 2010 conference programThe Boston Pledge 2010 conference program
The Boston Pledge 2010 conference program
Sanjay Mazumder
 
2009 Resort Overview Brochure
2009 Resort Overview Brochure2009 Resort Overview Brochure
2009 Resort Overview Brochurekeith408
 
Presentation Elearning
Presentation ElearningPresentation Elearning
Presentation Elearningmanda_mendy
 
NEGATIVE IMPACT OF ONLINE IDENTITY PLAY AND IMPERSONATION
NEGATIVE IMPACT OF ONLINE IDENTITY PLAY AND IMPERSONATIONNEGATIVE IMPACT OF ONLINE IDENTITY PLAY AND IMPERSONATION
NEGATIVE IMPACT OF ONLINE IDENTITY PLAY AND IMPERSONATIONmanda_mendy
 
Despre Mine
Despre MineDespre Mine
Despre Mineadamarry
 
Presentation Elearning 1
Presentation Elearning 1Presentation Elearning 1
Presentation Elearning 1manda_mendy
 
Presentasi Trans Tv
Presentasi Trans TvPresentasi Trans Tv
Presentasi Trans Tvmanda_mendy
 
Nemacolin Woodlands Show
Nemacolin Woodlands ShowNemacolin Woodlands Show
Nemacolin Woodlands Showkeith408
 
Google Docs
Google DocsGoogle Docs
Google Docs
Nicky De Proost
 
Glo 2016 hr trends
Glo 2016 hr trendsGlo 2016 hr trends
Glo 2016 hr trends
Peter Buytaert
 
Freedom House Presentation
Freedom House PresentationFreedom House Presentation
Freedom House Presentation
mrlebendig
 
High availability and fault tolerance of openstack
High availability and fault tolerance of openstackHigh availability and fault tolerance of openstack
High availability and fault tolerance of openstack
Deepak Mane
 
Manuela Preoteasa, La Nouvelle Identité De L’Approche éConomique
Manuela Preoteasa, La Nouvelle Identité De L’Approche éConomiqueManuela Preoteasa, La Nouvelle Identité De L’Approche éConomique
Manuela Preoteasa, La Nouvelle Identité De L’Approche éConomiqueSFSIC Association
 
Les agences media et leurs sites internet
Les agences media et leurs sites internetLes agences media et leurs sites internet
Les agences media et leurs sites internetThomas Postclic
 
Cours pour le CAPEPS par J Gleyse
Cours pour le CAPEPS par J GleyseCours pour le CAPEPS par J Gleyse
Cours pour le CAPEPS par J GleyseSantesih
 
Catalogue pour les municipalités 2013
Catalogue pour les municipalités   2013Catalogue pour les municipalités   2013
Catalogue pour les municipalités 2013
Julien Voyez
 
Atelier 1 Photo PicMonkey
Atelier 1 Photo PicMonkeyAtelier 1 Photo PicMonkey
Créer un site internet efficace aujourd'hui !
Créer un site internet efficace aujourd'hui !Créer un site internet efficace aujourd'hui !
Créer un site internet efficace aujourd'hui !
Odomia
 

Viewers also liked (20)

Ctlc Presentasi
Ctlc PresentasiCtlc Presentasi
Ctlc Presentasi
 
The Boston Pledge 2010 conference program
The Boston Pledge 2010 conference programThe Boston Pledge 2010 conference program
The Boston Pledge 2010 conference program
 
2009 Resort Overview Brochure
2009 Resort Overview Brochure2009 Resort Overview Brochure
2009 Resort Overview Brochure
 
Presentation Elearning
Presentation ElearningPresentation Elearning
Presentation Elearning
 
NEGATIVE IMPACT OF ONLINE IDENTITY PLAY AND IMPERSONATION
NEGATIVE IMPACT OF ONLINE IDENTITY PLAY AND IMPERSONATIONNEGATIVE IMPACT OF ONLINE IDENTITY PLAY AND IMPERSONATION
NEGATIVE IMPACT OF ONLINE IDENTITY PLAY AND IMPERSONATION
 
Despre Mine
Despre MineDespre Mine
Despre Mine
 
Presentation Elearning 1
Presentation Elearning 1Presentation Elearning 1
Presentation Elearning 1
 
Presentasi Trans Tv
Presentasi Trans TvPresentasi Trans Tv
Presentasi Trans Tv
 
Nemacolin Woodlands Show
Nemacolin Woodlands ShowNemacolin Woodlands Show
Nemacolin Woodlands Show
 
Cv roxy
Cv roxyCv roxy
Cv roxy
 
Google Docs
Google DocsGoogle Docs
Google Docs
 
Glo 2016 hr trends
Glo 2016 hr trendsGlo 2016 hr trends
Glo 2016 hr trends
 
Freedom House Presentation
Freedom House PresentationFreedom House Presentation
Freedom House Presentation
 
High availability and fault tolerance of openstack
High availability and fault tolerance of openstackHigh availability and fault tolerance of openstack
High availability and fault tolerance of openstack
 
Manuela Preoteasa, La Nouvelle Identité De L’Approche éConomique
Manuela Preoteasa, La Nouvelle Identité De L’Approche éConomiqueManuela Preoteasa, La Nouvelle Identité De L’Approche éConomique
Manuela Preoteasa, La Nouvelle Identité De L’Approche éConomique
 
Les agences media et leurs sites internet
Les agences media et leurs sites internetLes agences media et leurs sites internet
Les agences media et leurs sites internet
 
Cours pour le CAPEPS par J Gleyse
Cours pour le CAPEPS par J GleyseCours pour le CAPEPS par J Gleyse
Cours pour le CAPEPS par J Gleyse
 
Catalogue pour les municipalités 2013
Catalogue pour les municipalités   2013Catalogue pour les municipalités   2013
Catalogue pour les municipalités 2013
 
Atelier 1 Photo PicMonkey
Atelier 1 Photo PicMonkeyAtelier 1 Photo PicMonkey
Atelier 1 Photo PicMonkey
 
Créer un site internet efficace aujourd'hui !
Créer un site internet efficace aujourd'hui !Créer un site internet efficace aujourd'hui !
Créer un site internet efficace aujourd'hui !
 

Similar to Linked In Slideshow

Argentina raisin overview, 2012
Argentina raisin overview, 2012Argentina raisin overview, 2012
Argentina raisin overview, 2012
Matthew Fidelibus
 
Avance de subsidios infonavit al 01 julio 2012
Avance de subsidios infonavit al 01 julio 2012Avance de subsidios infonavit al 01 julio 2012
Avance de subsidios infonavit al 01 julio 2012
Sergio Velazco
 
Avance de subsidios infonavit al 01 julio 2012
Avance de subsidios infonavit al 01 julio 2012Avance de subsidios infonavit al 01 julio 2012
Avance de subsidios infonavit al 01 julio 2012
Sergio Velazco
 
Gdp
GdpGdp
1. 2016 17
1. 2016 171. 2016 17
1. 2016 17
dobhalshiv
 
Megaworld Media Kit
Megaworld Media KitMegaworld Media Kit
Megaworld Media Kit
Shendi Bri
 
January - October 2015 - Export Statistics of Turkish Citrus
January - October 2015 - Export Statistics of Turkish CitrusJanuary - October 2015 - Export Statistics of Turkish Citrus
January - October 2015 - Export Statistics of Turkish Citrus
Turkish Citrus Promotion Group
 
Cambodia tourism statistics - May 2012
Cambodia tourism statistics - May 2012Cambodia tourism statistics - May 2012
Cambodia tourism statistics - May 2012
Chau Duong
 
October 2015 - Export Statistics of Turkish Citrus
October 2015 - Export Statistics of Turkish CitrusOctober 2015 - Export Statistics of Turkish Citrus
October 2015 - Export Statistics of Turkish Citrus
Turkish Citrus Promotion Group
 
Border patrol statistics 5 20-2011
Border patrol statistics 5 20-2011Border patrol statistics 5 20-2011
Border patrol statistics 5 20-2011Jacob Sapochnick
 
2008- Useche’s Course - 2001 Impact Ven. Agrarian Reform
2008- Useche’s Course - 2001 Impact Ven. Agrarian Reform2008- Useche’s Course - 2001 Impact Ven. Agrarian Reform
2008- Useche’s Course - 2001 Impact Ven. Agrarian Reform
Alfonso Sintjago
 
October 2016 - Export Statistics of Turkish Citrus
October 2016 - Export Statistics of Turkish CitrusOctober 2016 - Export Statistics of Turkish Citrus
October 2016 - Export Statistics of Turkish Citrus
Turkish Citrus Promotion Group
 
January - November 2015 - Export Statistics of Turkish Citrus
January - November 2015 - Export Statistics of Turkish CitrusJanuary - November 2015 - Export Statistics of Turkish Citrus
January - November 2015 - Export Statistics of Turkish Citrus
Turkish Citrus Promotion Group
 
Top 100 Countries with the highest internet penetration rate
Top 100 Countries with the highest internet penetration rateTop 100 Countries with the highest internet penetration rate
Top 100 Countries with the highest internet penetration rate
Getcongnghe
 
Số liệu khách quốc tế đến Việt Nam năm 2008
Số liệu khách quốc tế đến Việt Nam năm 2008Số liệu khách quốc tế đến Việt Nam năm 2008
Số liệu khách quốc tế đến Việt Nam năm 2008
Chau Duong
 
PoblacióN Cert 2004 Dane
PoblacióN Cert 2004 DanePoblacióN Cert 2004 Dane
PoblacióN Cert 2004 DaneJOSESANCHEZ22
 
Fondo Federal Solidario Abril 2009 - Mayo 2015
Fondo Federal Solidario Abril 2009 - Mayo 2015Fondo Federal Solidario Abril 2009 - Mayo 2015
Fondo Federal Solidario Abril 2009 - Mayo 2015
Eduardo Nelson German
 
Coronavirus a nivel Mundial 14 nov
Coronavirus a nivel Mundial 14 nov Coronavirus a nivel Mundial 14 nov
Coronavirus a nivel Mundial 14 nov
LaCarpetaPurpura
 

Similar to Linked In Slideshow (20)

Argentina raisin overview, 2012
Argentina raisin overview, 2012Argentina raisin overview, 2012
Argentina raisin overview, 2012
 
Math ia
Math iaMath ia
Math ia
 
Avance de subsidios infonavit al 01 julio 2012
Avance de subsidios infonavit al 01 julio 2012Avance de subsidios infonavit al 01 julio 2012
Avance de subsidios infonavit al 01 julio 2012
 
Avance de subsidios infonavit al 01 julio 2012
Avance de subsidios infonavit al 01 julio 2012Avance de subsidios infonavit al 01 julio 2012
Avance de subsidios infonavit al 01 julio 2012
 
Gdp
GdpGdp
Gdp
 
1. 2016 17
1. 2016 171. 2016 17
1. 2016 17
 
Megaworld Media Kit
Megaworld Media KitMegaworld Media Kit
Megaworld Media Kit
 
January - October 2015 - Export Statistics of Turkish Citrus
January - October 2015 - Export Statistics of Turkish CitrusJanuary - October 2015 - Export Statistics of Turkish Citrus
January - October 2015 - Export Statistics of Turkish Citrus
 
Cambodia tourism statistics - May 2012
Cambodia tourism statistics - May 2012Cambodia tourism statistics - May 2012
Cambodia tourism statistics - May 2012
 
October 2015 - Export Statistics of Turkish Citrus
October 2015 - Export Statistics of Turkish CitrusOctober 2015 - Export Statistics of Turkish Citrus
October 2015 - Export Statistics of Turkish Citrus
 
Border patrol statistics 5 20-2011
Border patrol statistics 5 20-2011Border patrol statistics 5 20-2011
Border patrol statistics 5 20-2011
 
2008- Useche’s Course - 2001 Impact Ven. Agrarian Reform
2008- Useche’s Course - 2001 Impact Ven. Agrarian Reform2008- Useche’s Course - 2001 Impact Ven. Agrarian Reform
2008- Useche’s Course - 2001 Impact Ven. Agrarian Reform
 
October 2016 - Export Statistics of Turkish Citrus
October 2016 - Export Statistics of Turkish CitrusOctober 2016 - Export Statistics of Turkish Citrus
October 2016 - Export Statistics of Turkish Citrus
 
January - November 2015 - Export Statistics of Turkish Citrus
January - November 2015 - Export Statistics of Turkish CitrusJanuary - November 2015 - Export Statistics of Turkish Citrus
January - November 2015 - Export Statistics of Turkish Citrus
 
Top 100 Countries with the highest internet penetration rate
Top 100 Countries with the highest internet penetration rateTop 100 Countries with the highest internet penetration rate
Top 100 Countries with the highest internet penetration rate
 
Số liệu khách quốc tế đến Việt Nam năm 2008
Số liệu khách quốc tế đến Việt Nam năm 2008Số liệu khách quốc tế đến Việt Nam năm 2008
Số liệu khách quốc tế đến Việt Nam năm 2008
 
PoblacióN Cert 2004 Dane
PoblacióN Cert 2004 DanePoblacióN Cert 2004 Dane
PoblacióN Cert 2004 Dane
 
Indionesia
IndionesiaIndionesia
Indionesia
 
Fondo Federal Solidario Abril 2009 - Mayo 2015
Fondo Federal Solidario Abril 2009 - Mayo 2015Fondo Federal Solidario Abril 2009 - Mayo 2015
Fondo Federal Solidario Abril 2009 - Mayo 2015
 
Coronavirus a nivel Mundial 14 nov
Coronavirus a nivel Mundial 14 nov Coronavirus a nivel Mundial 14 nov
Coronavirus a nivel Mundial 14 nov
 

Linked In Slideshow

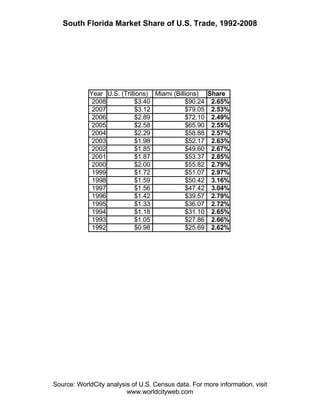
  • 1. South Florida Market Share of U.S. Trade, 1992-2008 Year U.S. (Trillions) Miami (Billions) Share 2008 $3.40 $90.24 2.65% 2007 $3.12 $79.05 2.53% 2006 $2.89 $72.10 2.49% 2005 $2.58 $65.90 2.55% 2004 $2.29 $58.88 2.57% 2003 $1.98 $52.17 2.63% 2002 $1.85 $49.60 2.67% 2001 $1.87 $53.37 2.85% 2000 $2.00 $55.82 2.79% 1999 $1.72 $51.07 2.97% 1998 $1.59 $50.42 3.16% 1997 $1.56 $47.42 3.04% 1996 $1.42 $39.57 2.79% 1995 $1.33 $36.07 2.72% 1994 $1.18 $31.10 2.65% 1993 $1.05 $27.86 2.66% 1992 $0.98 $25.69 2.62% Source: WorldCity analysis of U.S. Census data. For more information, visit www.worldcityweb.com
  • 2. Miami's Top 50 Deficit Partners, 2008 Ranking Deficit 2008 1 Yr Change Change 2008 World Total 19,586,639,924 7,713,384,377 0 1 China -4,144,615,320 -722,188,183 0 2 France -1,522,092,091 17,155,148 7 3 Japan -725,969,772 -369,867,166 4 4 Netherlands -687,889,454 -267,399,231 -1 5 Italy -644,393,157 305,441,822 -3 6 United Kingdom -584,896,862 496,455,197 -2 7 South Korea -454,067,136 178,631,929 -1 8 Taiwan -408,226,380 14,468,849 0 9 Canada -396,039,585 -35,092,110 1 10 Thailand -284,857,401 21,461,980 3 11 Indonesia -251,074,146 -59,670,436 0 12 Malaysia -206,842,689 46,097,479 2 13 India -165,371,663 16,357,142 -1 14 Nicaragua -151,464,538 79,765,793 6 15 Vietnam -149,236,389 -32,140,126 16 16 Belarus -148,030,484 -116,478,947 31 17 Mexico -114,739,737 -110,243,348 1 18 Austria -113,435,333 27,062,883 5 19 Norway -100,505,884 -24,913,316 3 20 Israel -81,268,425 5,468,964 -3 21 Sweden -71,731,466 71,281,133 -5 22 Turkey -71,589,325 94,066,452 4 23 Denmark -71,586,824 -23,936,743 174 24 Lithuania -60,931,018 -78,903,703 -9 25 Haiti -59,591,870 108,216,755 -4 26 Russia -56,374,511 48,534,967 3 27 Bangladesh -48,544,947 -11,741,897 3 28 Portugal -39,383,814 -7,763,007 166 29 Bermuda -38,469,250 -50,872,113 -4 30 Philippines -38,222,852 15,155,719 -11 31 Spain -36,146,121 96,561,367 -3 32 Australia -35,497,324 8,668,888 -5 33 Pakistan -33,221,522 11,664,168 2 34 Bulgaria -22,622,074 -3,261,544 -1 35 New Zealand -20,551,753 435,852 -30 36 Germany -16,713,412 409,570,604 -4 37 Hungary -12,257,028 13,704,600 -1 38 Cambodia -9,796,202 948,296 -1 39 Chad -9,654,063 -100,123 3 40 Morocco -7,519,616 -613,745 3 41 Slovenia -7,227,778 -1,859,992 0 42 Kenya -4,779,982 2,953,277 4 43 Macao -4,038,373 625,258 7 44 Fiji -3,169,519 401,276 128 45 Algeria -2,557,927 -4,739,663 76 46 Ethiopia -2,225,252 -2,407,997 -7 47 Czech Republic -1,934,901 7,198,386 102 48 Tunisia -1,509,742 -2,401,673 -3 49 Sri Lanka -1,501,582 3,430,495 0 50 Monaco -1,474,162 2,658,627 Source: WorldCity analysis of U.S. Census data. For more information, visit www.worldcityweb.com
  • 3. Miami's Top 50 Surplus Partners, 2008 Ranking Surplus 2008 1-Year Change Change 2008 World Total 19,586,639,924 7,713,384,377 0 1 Brazil 8,047,193,151 1,956,956,928 0 2 Venezuela 3,890,709,611 928,841,324 1 3 Colombia 1,969,263,334 585,774,486 -1 4 Argentina 1,868,645,966 254,438,815 0 5 Costa Rica 1,571,066,656 420,909,987 1 6 Chile 1,552,410,443 492,113,520 -1 7 Paraguay 1,342,811,973 233,401,810 0 8 Panama 1,269,222,230 257,499,600 0 9 Peru 1,190,737,818 298,549,118 12 10 Switzerland 1,074,277,483 926,352,827 0 11 Dominican Republic 880,546,742 217,378,819 1 12 Ecuador 854,890,119 267,284,421 -3 13 Bahamas 703,206,999 -173,194,865 -2 14 Trinidad and Tobago 613,205,698 2,987,762 0 15 Guatemala 556,865,783 111,551,748 -2 16 Jamaica 513,187,633 -66,245,398 -1 17 Netherlands Antilles 481,760,977 125,196,747 -1 18 Cayman Islands 335,658,169 14,262,310 2 19 Uruguay 312,243,620 112,552,806 -1 20 Barbados 259,188,100 15,865,026 -1 21 Turks and Caicos Islands 228,819,764 15,566,814 7 22 United Arab Emirates 157,675,584 84,956,240 4 23 Finland 143,316,472 62,236,072 -6 24 El Salvador 133,639,327 -160,587,251 11 25 Bolivia 114,017,555 70,467,667 11 26 Honduras 113,226,259 73,724,365 -4 27 Antigua and Barbuda 100,282,905 -4,993,783 6 28 Cuba 89,835,816 33,841,987 -1 29 British Virgin Islands 87,095,300 9,028,511 1 30 Suriname 85,799,925 16,153,708 -5 31 St Lucia 85,323,408 1,746,806 -2 32 Guyana 80,023,915 8,838,383 0 33 Belize 77,175,653 19,622,592 1 34 Dominica 56,064,430 760,405 14 35 Lebanon 53,661,671 39,764,643 -4 36 Anguilla 50,093,005 -11,710,454 173 37 Singapore 47,321,104 68,066,987 3 38 Aruba 47,316,205 15,473,301 -14 39 Hong Kong 45,062,703 -38,633,082 0 40 St Vincent and the Grenadines 41,548,472 9,687,892 10 41 South Africa 40,783,315 29,245,739 29 42 Cyprus 39,222,613 36,960,455 -4 43 St Kitts and Nevis 36,547,527 3,782,666 0 44 Angola 34,254,927 12,102,131 -7 45 Grenada 32,626,503 -1,766,385 13 46 Greece 30,084,531 24,523,154 -4 47 Nigeria 29,912,818 7,316,903 144 48 Slovakia 28,096,969 30,220,790 14 49 Poland 24,299,908 20,580,007 -5 50 Martinique 21,578,039 -317,114 Source: WorldCity analysis of U.S. Census data. For more information, visit www.worldcityweb.com
  • 4. Miami's Top 50 Import Partners, 2008 Ranking Total Imports 2008 1-Year % Change 16-Year % Change Change 2008 World Total $35,329,090,974 5.19% 266.05% 0 1 China $4,398,813,122 17.91% 1107.90% 0 2 Brazil $2,559,165,749 9.72% 269.72% 1 3 Honduras $1,945,478,896 2.54% 355.69% 2 4 Colombia $1,834,918,361 5.57% 157.26% -2 5 Dominican Republic $1,830,045,494 -3.75% 121.23% -1 6 France $1,763,693,479 -2.20% 320.26% 3 7 Venezuela $1,246,814,125 3.58% 150.84% 0 8 Costa Rica $1,197,982,451 -5.60% 116.92% 5 9 Netherlands $1,125,408,064 35.48% 1024.45% -3 10 United Kingdom $1,119,712,966 -24.41% 325.35% 5 11 Japan $1,102,684,470 46.25% 116.07% -3 12 Italy $1,050,044,376 -14.81% 187.70% 0 13 Chile $876,730,666 3.78% 618.74% 1 14 Mexico $876,365,819 9.49% 594.60% -3 15 Guatemala $859,568,013 -0.54% 107.07% 2 16 El Salvador $813,314,040 16.33% 314.48% -6 17 Germany $678,549,641 -24.21% 179.70% 1 18 Nicaragua $664,744,328 11.15% 2227.94% 1 19 Peru $654,309,911 33.04% 483.36% -3 20 South Korea $566,246,710 -20.79% 208.71% 1 21 Taiwan $502,609,871 5.37% 30.44% 4 22 Switzerland $492,693,953 30.88% 624.64% 2 23 Canada $477,299,580 20.91% 472.41% -1 24 Spain $463,824,738 -0.75% 182.86% -4 25 Ecuador $431,696,455 -10.20% 175.03% -2 26 Haiti $425,945,802 -7.46% 478.83% 0 27 Thailand $330,788,440 -3.21% 256.96% 2 28 Indonesia $291,560,212 36.14% 880.06% 10 29 Belgium $245,502,646 78.86% 1275.86% 6 30 Bahamas $240,305,943 36.71% 231.95% 0 31 Argentina $239,694,577 17.10% 422.34% -4 32 Malaysia $233,809,968 -17.72% 102.97% 15 33 Trinidad and Tobago $225,123,655 145.95% 1094.59% -5 34 India $223,864,140 -4.43% 410.70% -1 35 Hong Kong $204,610,833 11.08% 61.15% 1 36 Panama $183,566,979 9.92% 106.36% 10 37 Jamaica $179,328,901 90.86% -17.64% 3 38 Vietnam $174,954,445 32.54% 2242905.71% 21 39 Belarus $148,182,575 366.44% 55897.41% 6 40 Norway $147,480,645 47.60% 870.44% -8 41 Turkey $139,567,592 -25.13% 860.32% -7 42 Russia $132,810,761 -25.16% 9066.08% -5 43 Austria $125,018,904 -17.37% 325.63% -12 44 Sweden $124,792,376 -33.10% 282.78% -5 45 Aruba $121,241,656 -9.19% 8619.90% -1 46 Bolivia $119,366,150 11.34% 135.67% -5 47 Australia $108,323,195 -8.60% 199.80% -5 48 Israel $108,233,126 -4.16% 87.86% 0 49 Denmark $108,159,612 20.67% 208.06% 28 50 Lithuania $84,009,873 679.80% NA Source: WorldCity analysis of U.S. Census data. For more information, visit www.worldcityweb.com
  • 5. Miami's Top 50 Export Partners, 2008 Ranking Total Exports 2008 1-Year % Change 16-Year % Change Change 2008 World Total $54,915,730,898 20.80% 242.34% 0 1 Brazil $10,606,358,900 25.93% 797.93% 0 2 Venezuela $5,137,523,736 23.33% 107.17% 0 3 Colombia $3,804,181,695 21.87% 166.18% 1 4 Costa Rica $2,769,049,107 14.46% 326.89% -1 5 Dominican Republic $2,710,592,236 5.69% 182.89% 1 6 Chile $2,429,141,109 27.51% 257.28% 1 7 Argentina $2,108,340,543 15.91% 94.59% -2 8 Honduras $2,058,705,155 6.30% 431.57% 0 9 Peru $1,845,047,729 33.31% 423.55% 9 10 Switzerland $1,566,971,436 198.82% 3942.47% 0 11 Panama $1,452,789,209 23.25% 169.39% -2 12 Guatemala $1,416,433,796 8.16% 178.56% -1 13 Paraguay $1,351,020,906 20.99% 346.04% -1 14 Ecuador $1,286,586,574 20.43% 196.65% 0 15 El Salvador $946,953,367 -4.68% 229.20% -2 16 Bahamas $943,512,942 -10.33% 97.18% 0 17 Trinidad and Tobago $838,329,353 19.46% 443.84% -2 18 Mexico $761,626,082 -4.31% 129.37% -1 19 Jamaica $692,516,534 2.84% 58.62% 0 20 Germany $661,836,229 41.10% 155.30% 2 21 United Kingdom $534,816,104 33.72% 148.47% -1 22 Netherlands Antilles $526,346,931 26.98% 93.96% 2 23 Nicaragua $513,279,790 39.92% 421.39% -2 24 Netherlands $437,518,610 6.66% 348.78% 2 25 Spain $427,678,617 27.82% 69.96% 4 26 Italy $405,651,219 43.50% 113.81% -3 27 Japan $376,714,698 -5.32% 392.57% 1 28 Haiti $366,353,932 25.26% 269.90% 4 29 Uruguay $358,471,672 39.13% 268.40% -4 30 Cayman Islands $345,694,601 3.25% 382.06% 3 31 Barbados $273,547,668 6.33% 327.42% 20 32 Belgium $260,049,453 265.18% 496.29% -5 33 China $254,197,802 -17.51% 4284.78% -3 34 Hong Kong $249,673,536 -6.80% 2414.56% -3 35 France $241,601,388 -8.53% -11.14% -1 36 Turks and Caicos Islands $238,483,708 7.38% 1091.09% 0 37 Bolivia $233,383,705 54.81% 205.75% 3 38 United Arab Emirates $178,438,328 74.26% 1614.76% -3 39 Aruba $168,557,861 1.94% 22.41% -1 40 Finland $164,343,820 49.18% 1317.36% 1 41 Guyana $133,978,337 33.84% 68.74% 2 42 Belize $112,235,619 26.53% 58.62% 4 43 South Korea $112,179,574 36.59% 1386.18% 1 44 Suriname $110,177,678 24.72% 83.48% -2 45 Singapore $107,176,384 19.16% 198.24% -6 46 Antigua and Barbuda $102,679,916 -5.47% 176.04% 10 47 Taiwan $94,383,491 73.80% 984.43% 2 48 South Africa $93,429,144 26.71% 395.77% 6 49 Cuba $89,859,816 59.90% 7541.53% -2 50 British Virgin Islands $87,720,791 10.28% 533.09% Source: WorldCity analysis of U.S. Census data. For more information, visit www.worldcityweb.com
  • 6. South Florida's Top 50 Trade Partners, 2008 Ranking Total Trade 2008 1-Year % Change 16-Year % Change Change 2008 2007 1992 World Total $90,244,821,872 14.17% 251.25% 0 1 1 3 Brazil $13,165,524,649 22.41% 602.77% 0 2 2 1 Venezuela $6,384,337,861 18.91% 114.46% 0 3 3 2 Colombia $5,639,100,056 16.04% 163.22% 1 4 5 24 China $4,653,010,924 15.21% 1157.69% -1 5 4 4 Dominican Republic $4,540,637,730 1.67% 154.32% 0 6 6 8 Honduras $4,004,184,051 4.44% 391.78% 0 7 7 5 Costa Rica $3,967,031,558 7.56% 230.33% 0 8 8 9 Chile $3,305,871,775 20.22% 312.27% 4 9 13 20 Peru $2,499,357,640 33.24% 437.99% 1 10 11 6 Argentina $2,348,035,120 16.03% 107.90% -2 11 9 7 Guatemala $2,276,001,809 4.71% 146.42% 13 12 25 39 Switzerland $2,059,665,389 128.64% 1829.36% -3 13 10 10 France $2,005,294,867 -3.01% 189.97% 0 14 14 18 El Salvador $1,760,267,407 4.00% 263.78% 1 15 16 13 Ecuador $1,718,283,029 10.92% 190.91% -4 16 12 19 United Kingdom $1,654,529,070 -12.05% 245.78% -2 17 15 21 Mexico $1,637,991,901 2.61% 257.46% 1 18 19 12 Panama $1,636,356,188 21.60% 160.46% 1 19 20 27 Netherlands $1,562,926,674 25.95% 691.05% 2 20 22 14 Japan $1,479,399,168 28.44% 152.11% -4 21 17 15 Italy $1,455,695,595 -3.93% 162.43% 1 22 23 26 Paraguay $1,359,229,839 20.95% 344.60% -5 23 18 17 Germany $1,340,385,870 -1.76% 167.10% -3 24 21 16 Bahamas $1,183,818,885 -3.59% 114.89% -1 25 24 35 Nicaragua $1,178,024,118 22.09% 827.58% 2 26 28 29 Trinidad and Tobago $1,063,453,008 34.06% 514.73% -1 27 26 22 Spain $891,503,355 11.17% 114.51% 1 28 29 11 Jamaica $871,845,435 13.62% 33.24% 1 29 30 30 Haiti $792,299,734 5.25% 358.96% -3 30 27 28 South Korea $678,426,284 -14.87% 255.25% 0 31 31 23 Taiwan $596,993,362 12.36% 51.51% 0 32 32 25 Netherlands Antilles $570,932,885 20.84% 77.77% 1 33 34 31 Canada $558,559,575 30.34% 265.82% 13 34 47 47 Belgium $505,552,099 142.50% 722.64% -2 35 33 33 Hong Kong $454,284,369 0.49% 231.84% 1 36 37 37 Uruguay $404,699,724 28.22% 228.27% -2 37 35 40 Thailand $376,719,479 -0.13% 294.91% -2 38 36 44 Cayman Islands $355,731,033 2.16% 378.37% 3 39 42 36 Bolivia $352,749,855 36.74% 177.80% 4 40 44 59 Indonesia $332,046,278 40.14% 939.28% -2 41 39 32 Aruba $289,799,517 -3.03% 108.36% -1 42 41 45 Barbados $287,907,236 6.17% 307.47% -3 43 40 52 India $282,356,617 -1.54% 480.73% -6 44 38 34 Malaysia $260,777,247 -17.32% 97.78% 0 45 45 64 Turks and Caicos Islands $248,147,652 7.45% 855.52% -3 46 43 78 Russia $209,247,011 -16.31% 1908.89% 1 47 48 55 Turkey $207,545,859 0.18% 397.45% 4 48 52 190 Vietnam $200,672,501 36.60% 2572624.37% 7 49 56 69 United Arab Emirates $199,201,072 50.82% 1132.85% 10 50 60 63 Norway $194,455,406 56.50% 634.51% Source: WorldCity analysis of U.S. Census data. For more information, visit www.worldcityweb.com