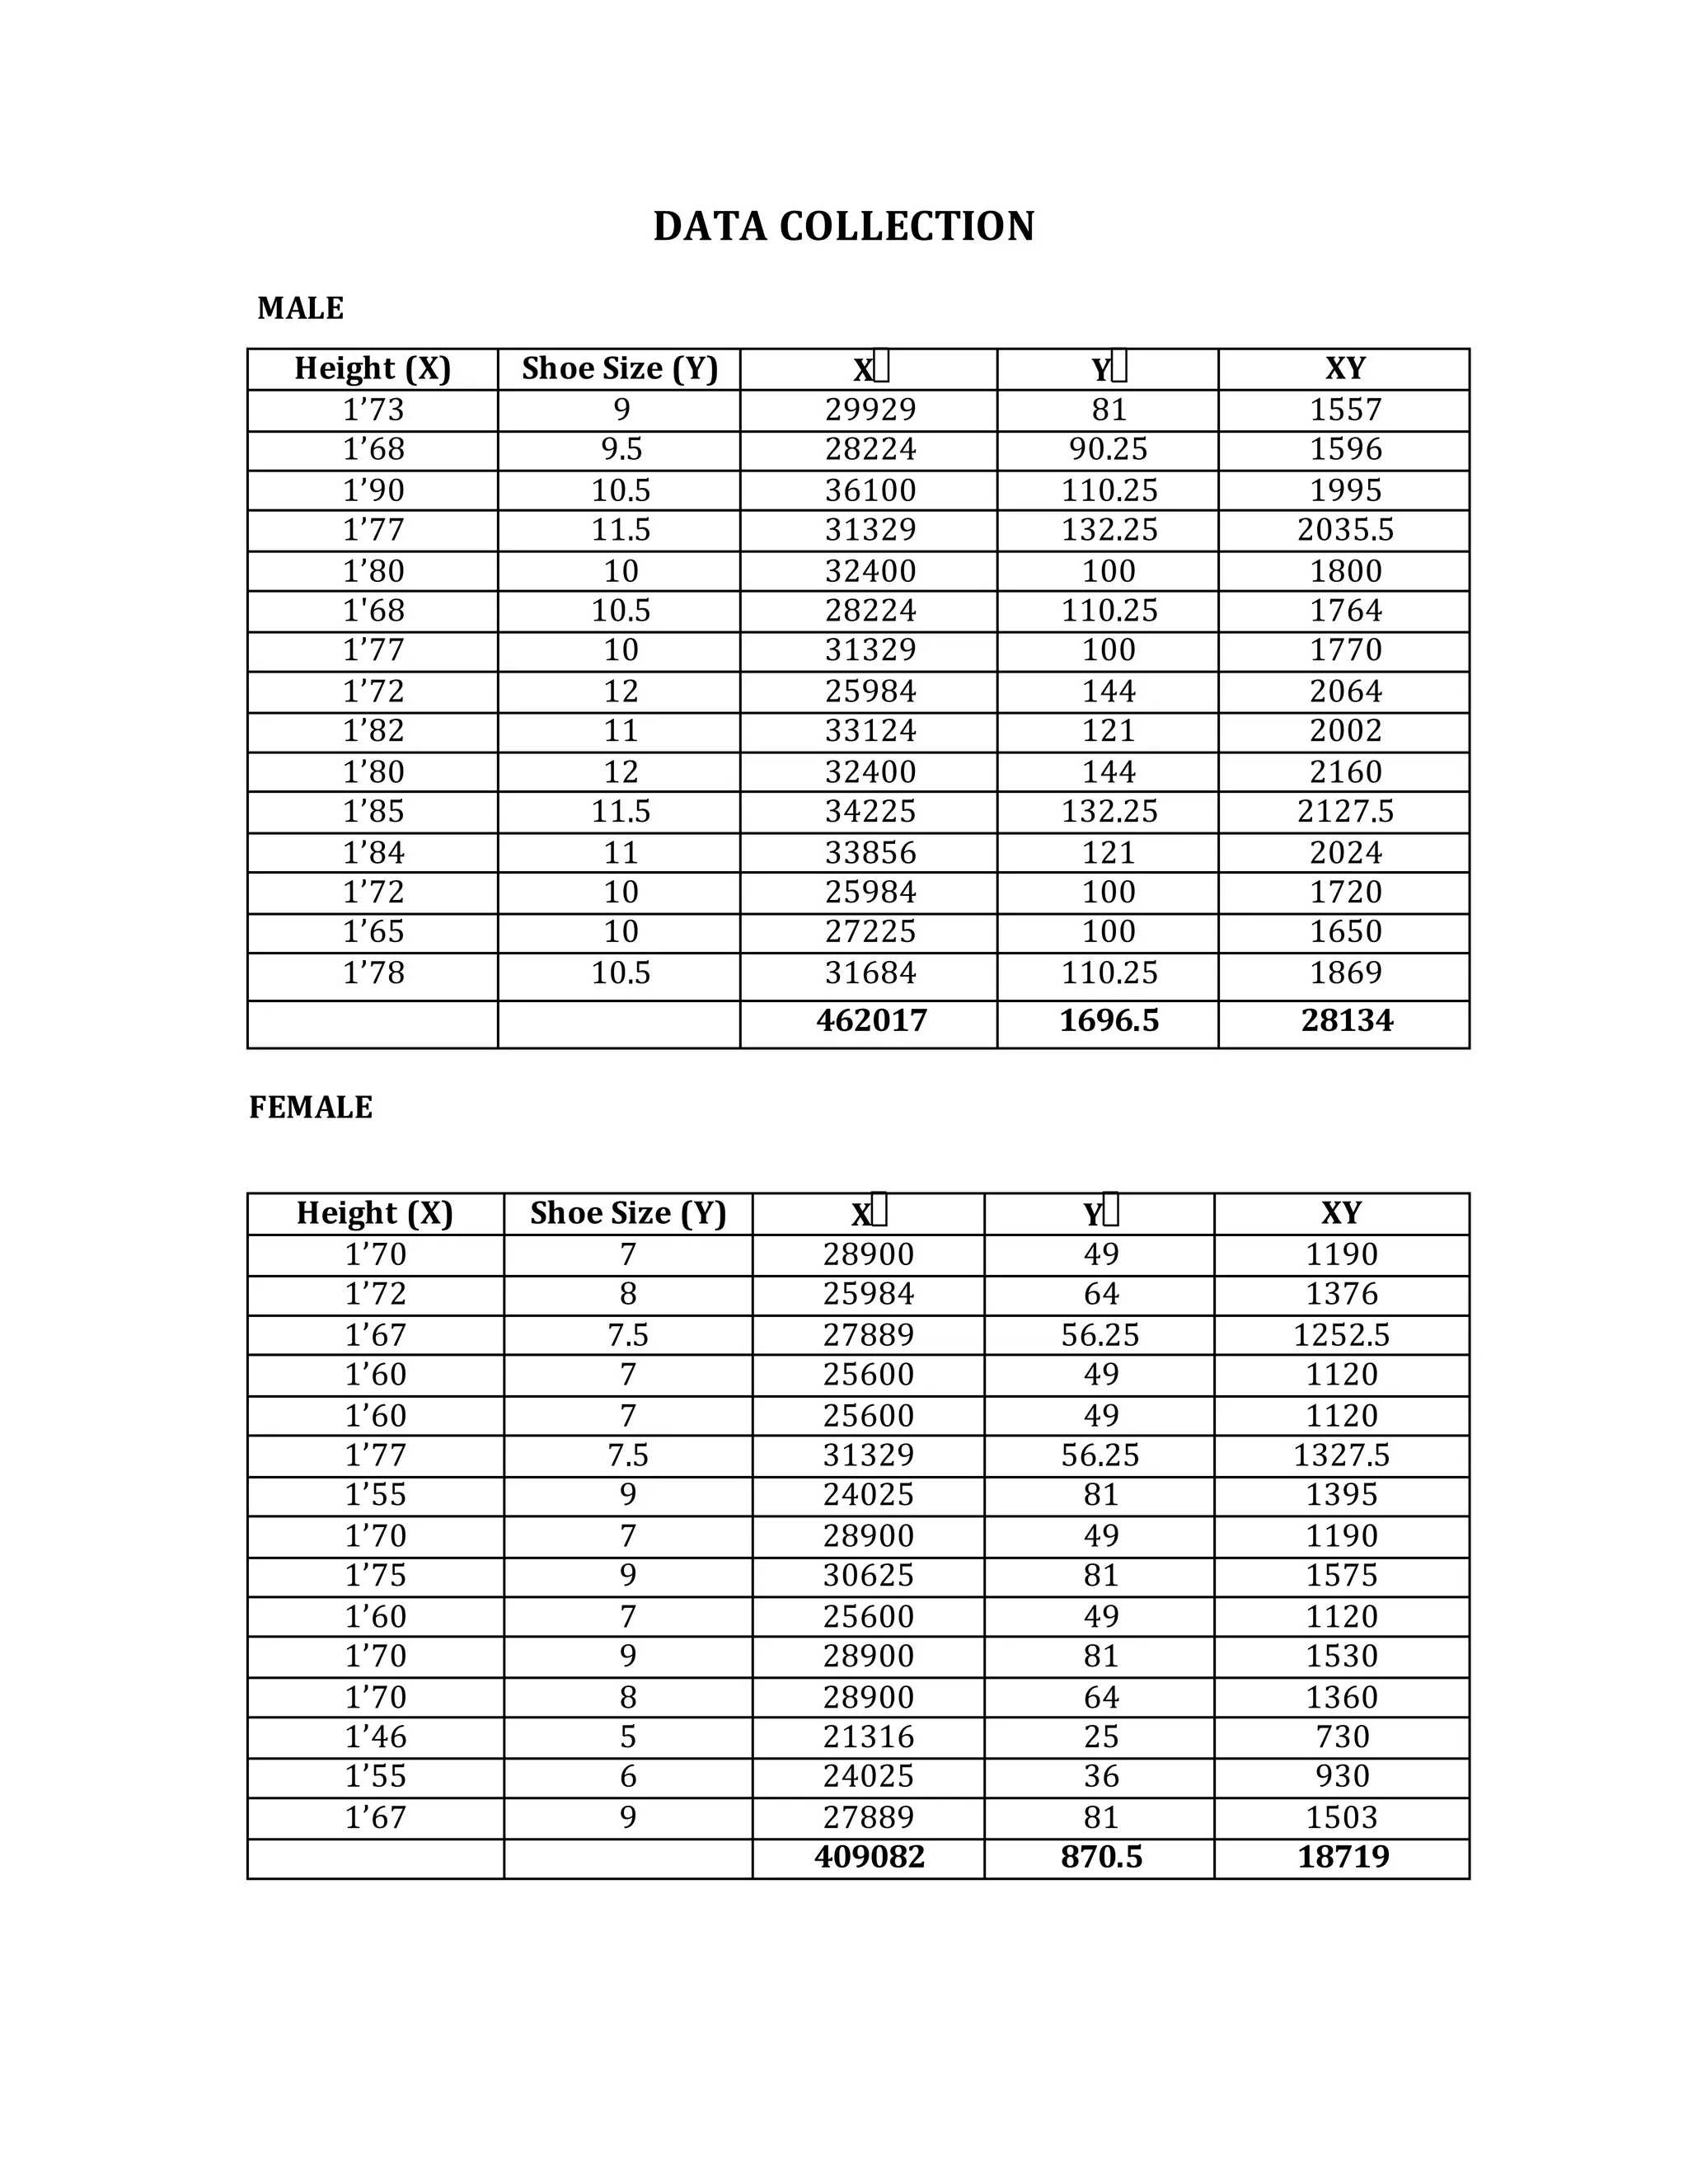
1) The document analyzes the relationship between shoe size and height using data collected from 15 males and 15 females aged 17-18.
2) Correlation coefficients were calculated, showing a moderate positive correlation between height and shoe size.
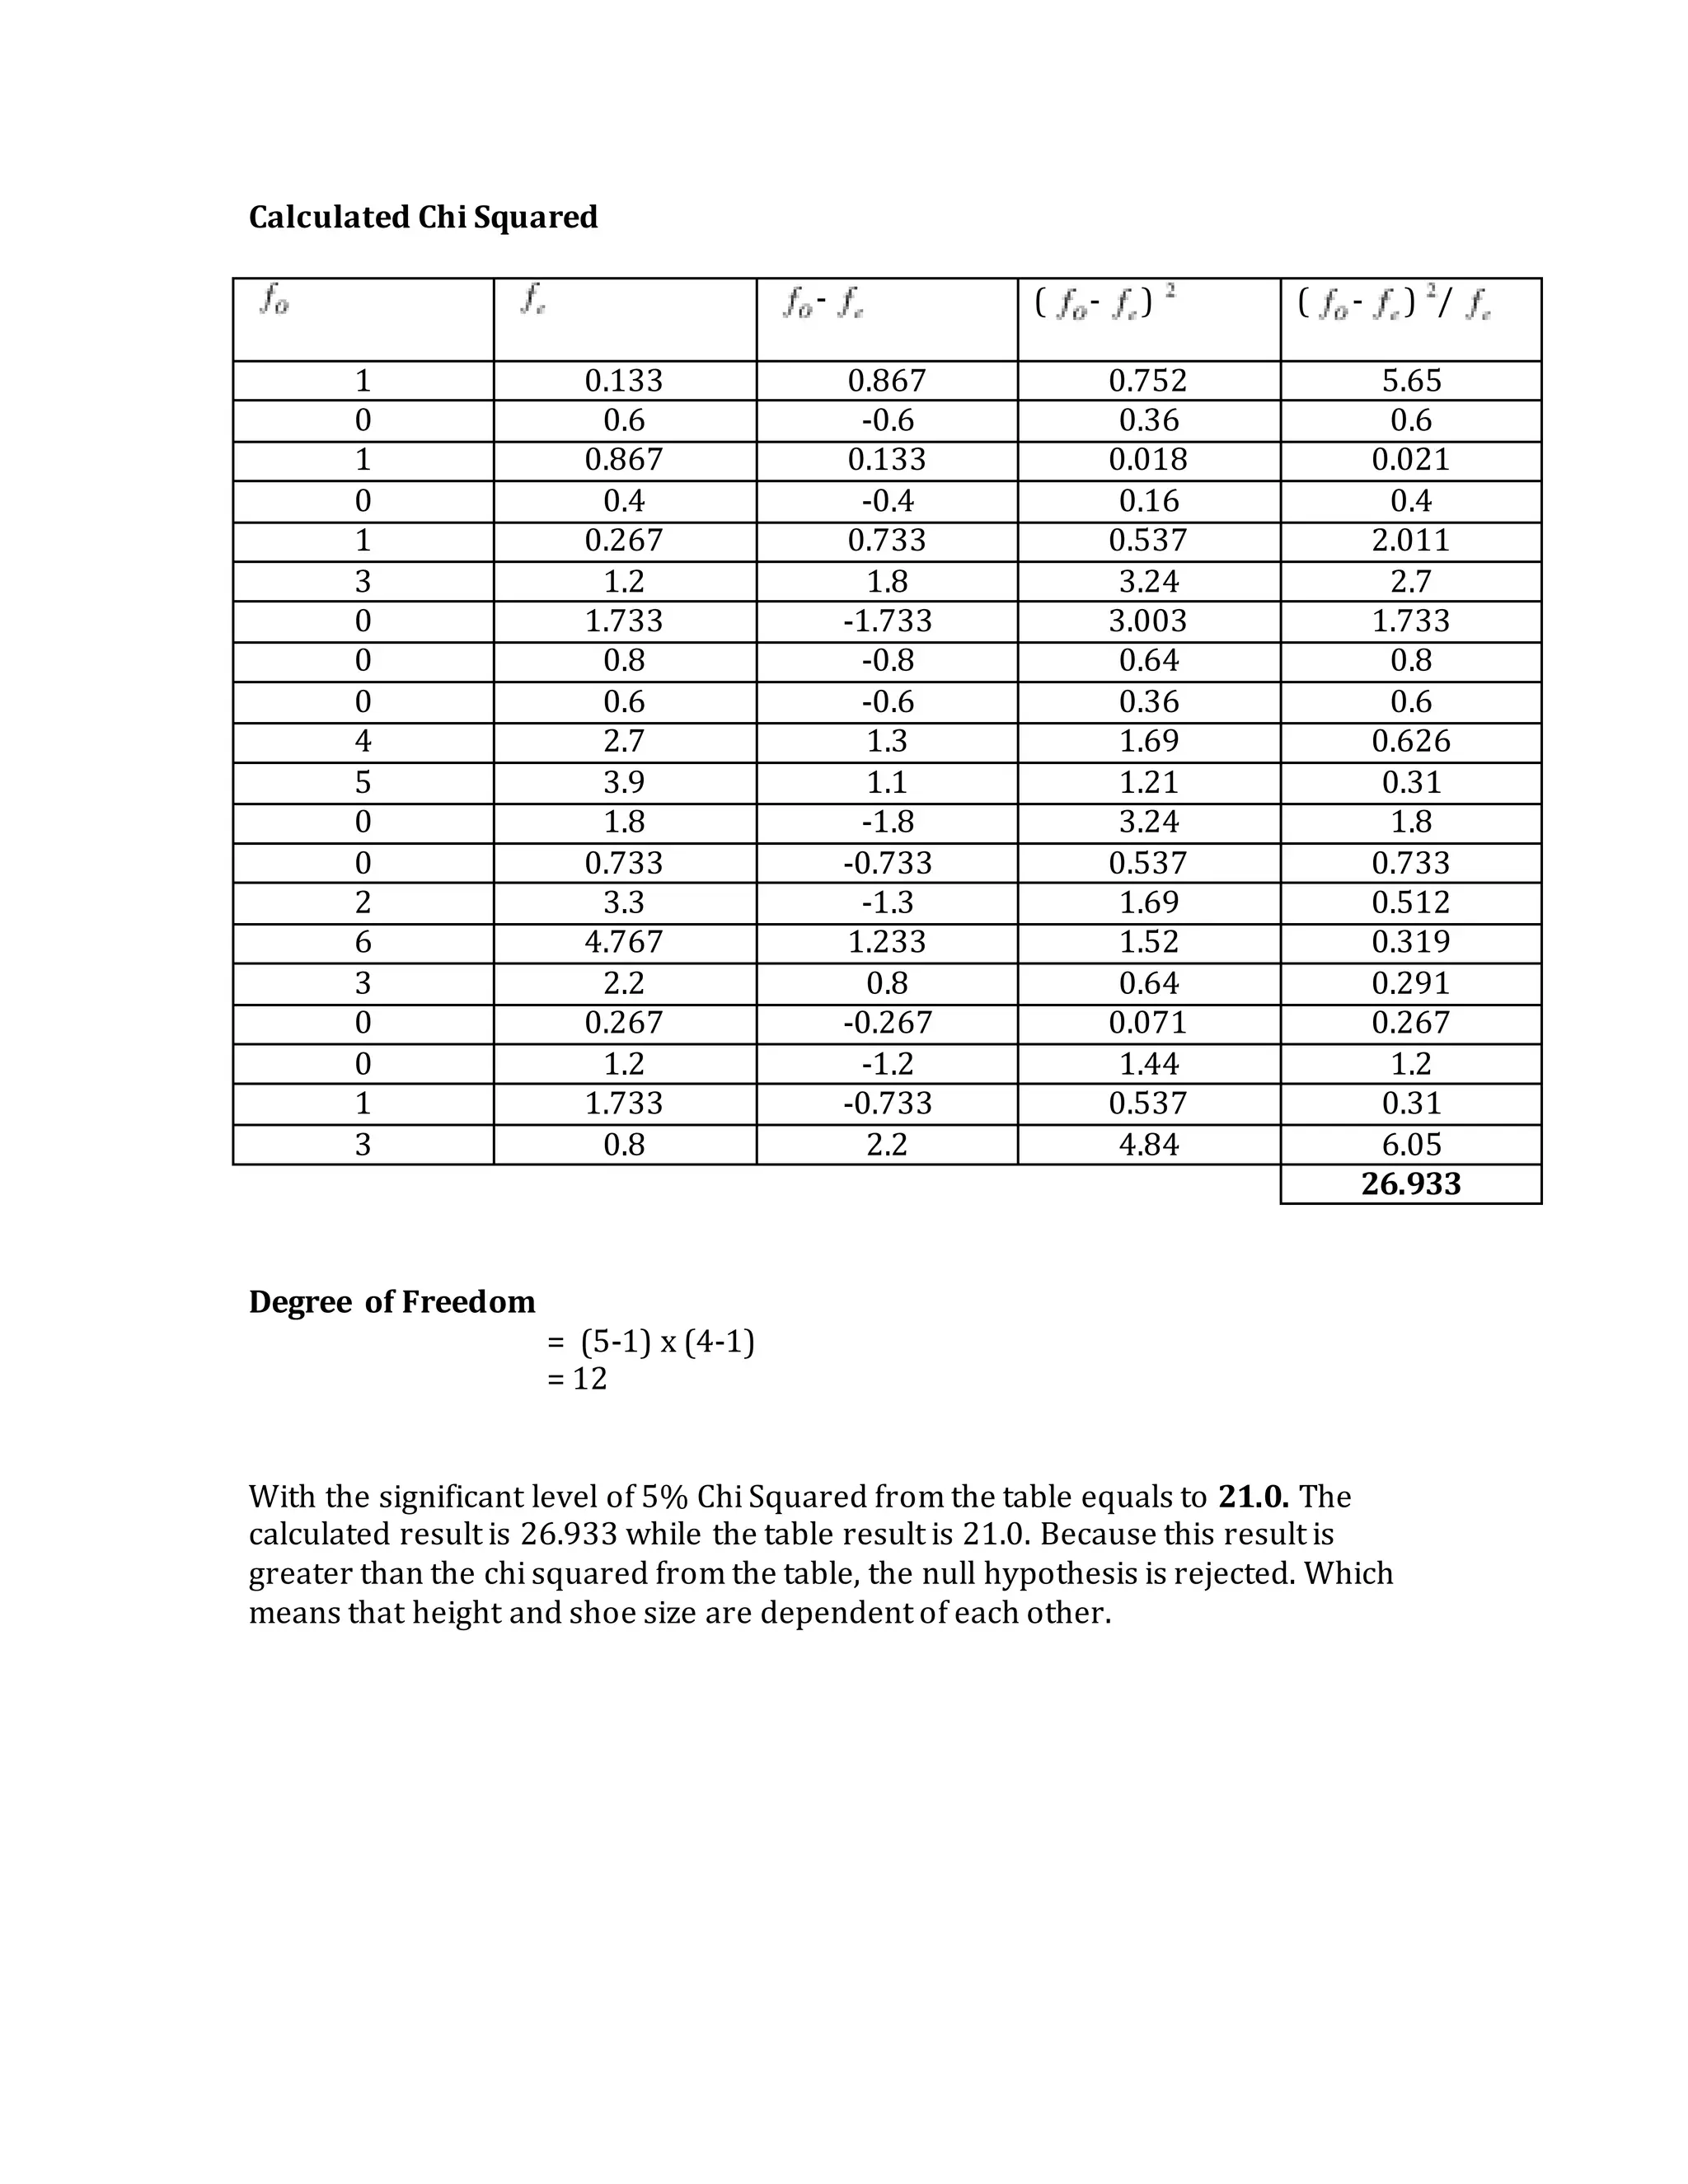
3) Chi-squared tests found the relationship to be independent for males and females individually, but dependent when combining both genders.
This is an analysis to see if height and shoe sizes are correlated among people. To see if whether the bigger feet you have the taller you will be or otherwise.
Spark-ITS: Indexing for Large-Scale Time Series Data on Spark with Liang ZhangDatabricks
Massive amounts of time series data continuously generated and collected calls for the development of distributed large scale time series data processing platforms. Indexing plays a critical role in speeding up time series similarity queries on which most of these systems rely. However, the state-of-the-art techniques, including the widely adopted iSAX-based indexes, fall short in leveraging the parallel power of modern distributed systems to efficiently construct an index over billions of time series data (TBs of data).
We propose an indexing framework based on Apache Spark, which is composed by a novel index tree, and the related new signature, to index and query billion-scale time series. This framework is composed of a global centralized index and local distributed indexes. This new index not only reduces the depth and the size of the index tree significantly, but also maintains the similarity relationship more effectively compared to existing techniques. We conducted extensive experiments on both synthetic and real-world datasets.
Evaluation results demonstrate that over a 1.0 Billion time series dataset, the construction of un-clustered index is about 60% faster than the state-of-the-art systems, whereas the construction of clustered index is 83% faster than the state-of-the-art systems.
Moreover, the average response time of Exact-Match queries is decreased by 50%, and the accuracy of the kNN-Approximate queries has increased from 3% to 40% compared to existing techniques.
Method for determination of shear strength of soil (Badarpur Sand) with a maximum particle size of 4.75 mm in drained conditions using Direct Shear Test apparatus.
It is a Floating Box type test in which upper half box is floating due to application of vertical loading resulting in lateral confinement thus generating sufficient friction which holds the upper half of shear box.
In the shear box test, the specimen is not failing along its weakest plane but along a predetermined or induced failure plane i.e. horizontal plane separating the two halves of the shear box. This is the main drawback of this test.
Moreover, during loading, the state of stress cannot be evaluated. It can be evaluated only at failure condition. Also, failure is progressive.
The angle of shearing resistance of sands depends on state of compaction, coarseness of grains, particle shape and roughness of grain surface and grading. It varies between 28° (uniformly graded sands with round grains in very loose state) to 46° (well graded sand with angular grains in dense state).
Direct shear test is simple and faster to operate. As thinner specimens are used in shear box, they facilitate drainage of pore water from a saturated sample in less time. This test is also useful to study friction between two materials – one material in lower half of box and another material in the upper half of box.
In general, loose sands expand and dense sands contract in volume on shearing. There is a void ratio at which either expansion contraction in volume takes place. This void ratio is called critical void ratio. Expansion or contraction can be inferred from the movement of vertical dial gauge during shearing.
Method for determination of shear strength of soil (Badarpur Sand) with a maximum particle size of 4.75 mm in drained conditions using Direct Shear Test apparatus.
It is a Floating Box type test in which upper half box is floating due to application of vertical loading resulting in lateral confinement thus generating sufficient friction which holds the upper half of shear box.
In the shear box test, the specimen is not failing along its weakest plane but along a predetermined or induced failure plane i.e. horizontal plane separating the two halves of the shear box. This is the main drawback of this test.
Moreover, during loading, the state of stress cannot be evaluated. It can be evaluated only at failure condition. Also, failure is progressive.
1. IB Math Studies Internal Assessment:
Shoe Size and Height
School Name: International School of Bangkok
Date: November 2010
Course: IB Math Studies
2. Statement and Plan of Task:
In this assessment I will investigate the relationship between shoe size and height.
For this topic I have collected data from students in my age group, which is 17 to 18
years old. I collected fifteen shoe sizes and height for each gender. My task to is to
find patterns, which reveal how they are correlated, and the chi-squared test will
prove how significant the correlation is. In the end I will compare female and male
results to see how the correlation results differ or if they are exactly the same.
Hypothesis:
I believe that the relationship between shoe size and height is significant. The larger
shoe size is the taller a person will be.
The Measurements:
I have converted all the height measurements to centimeters and collected all shoe
sizes in by American standards.
11. CHI SQUARED TEST
MALE
Null Hypothesis- Height and shoe size are independent of each other.
Alternative Hypothesis- Shoe size is dependent of height.
Observed Frequency ( ):
Height (cm) 9-9.5 10-10.5 11-11.5 12-12.5 Total
161-170 1 2 0 0 3
171- 180 1 4 1 2 8
181-190 0 1 3 0 4
Total 2 7 4 2 15
Expected FREQUENCY ( ):
Height (cm) 9-9.5 10-10.5 11-11.5 12-12.5 Total
161-170 (2 x 3)/15=
.4
(7 x 3)/15=
1.4
(4 x 3)/15=
.8
(2 x 3)/15=
.4
3
171-180 (2 x 8)/15=
1.067
(7 x 8)/15=
3.733
(4 x 8)/15=
2.133
(2 x 8)/15=
1.067
8
181-190 (2 x 4)/15=
.533
(7 x 4)/15=
1.867
(4 x 4)/15=
1.066
(2 x 4)/15=
.533
4
Total 2 7 4 2 15
12. Calculated Chi Squared
- ( - ) ( - ) /
1 .4 .6 0.36 0.9
2 1.4 .6 0.36 0.9
0 .8 -.8 0.64 0.8
0 .4 -.4 0.16 0.4
1 1.067 0.067 0.0045 0.0042
4 3.733 .267 0.0713 0.0191
1 2.133 -1.133 1.284 0.602
2 1.067 .933 0.870 0.815
0 .533 -.533 0.284 0.533
1 1.867 -.867 0.752 0.4027
3 1.067 1.933 3.736 3.501
0 .533 -0.533 0.284 0.533
9.41
Degree of Freedom = (row -1) x (column -1)
= (3-1) x (4-1)
= 6
With the significant level of 5% Chi Squared from the table equals to 12.59. The
calculated result is 9.41 while the table result is 12.59. This means that the null
hypothesis is accepted, meaning that height and shoe size are independent of each
other.
13. FEMALE:
Null Hypothesis- Height and shoe size are independent of each other.
Alternative Hypothesis- Shoe size is dependent of height.
Observed Frequency ( ):
Height
(cm)
5-5.5 6-6.5 7-7.5 8-8.5 9-9.5 Total
141-150 1 0 0 0 1 2
151-160 0 1 3 0 0 4
161-170 0 0 3 1 2 6
171-180 0 0 1 1 1 3
Total 1 1 7 2 4 15
Expected FREQUENCY ( ):
Height
(cm)
5-5.5 6-6.5 7-7.5 8-8.5 9-9.5 Total
141-150 0.133 0.133 0.933 0.267 0.533 2
151-160 0.267 0.267 1.867 0.533 1.067 4
161-170 0.4 0.4 2.8 0.8 1.6 6
171-180 0.2 0.2 1.4 0.4 0.8 3
Total 1 1 7 2 4 15
14. Calculated Chi Squared
- ( - ) ( - ) /
1 0.133 0.867 0.752 5.65
0 0.133 -0.133 0.017 0.127
0 0.933 -0.933 0.87 0.932
0 0.267 -0.267 0.071 0.265
1 0.533 0.467 0.218 0.409
0 0.267 -0.267 0.071 0.265
1 0.267 0.733 0.537 2.01
3 1.867 1.133 1.283 0.687
0 0.533 -0.533 0.284 0.532
0 1.067 -1.067 0.284 0.266
0 0.4 -0.4 1.138 1.067
0 0.4 -0.533 0.16 0.4
3 2.8 0.2 0.284 0.101
1 0.8 0.2 0.04 0.05
2 1.6 0.4 0.16 0.1
0 0.2 -0.2 0.04 0.2
0 0.2 -0.2 0.04 0.2
1 1.4 -0.4 0.16 0.114
1 0.4 0.6 0.36 0.9
1 0.8 0.2 0.04 0.05
14.325
Degree of Freedom
= (4-1) x (5-1)
= 12
With the significant level of 5% Chi Squared from the table equals to 21.0. The
calculated result is 14.325 while the table result is 21.0. This means that the null
hypothesis is accepted, meaning that height and shoe size are independent of each
other.
15. BOTH:
Null Hypothesis- Height and shoe size are independent of each other.
Alternative Hypothesis- Shoe size is dependent of height.
Observed Frequency ( ):
Height
(cm)
5-6.5 7-8.5 9-10.5 11-12.5 Total
141-150 1 0 1 0 2
151-160 1 3 0 0 4
161-170 0 4 5 0 9
171-180 0 2 6 3 11
181-190 0 0 1 3 4
Total 2 9 13 6 30
Expected FREQUENCY ( ):
Height
(cm)
5-6.5 7-8.5 9-10.5 11-12.5 Total
141-150 0.133 0.6 0.867 0.4 2
151-160 0.267 1.2 1.733 0.8 4
161-170 0.6 2.7 3.9 1.8 9
171-180 0.733 3.3 4.767 2.2 11
181-190 0.267 1.2 1.733 0.8 4
Total 2 9 13 6 30
16. Calculated Chi Squared
- ( - ) ( - ) /
1 0.133 0.867 0.752 5.65
0 0.6 -0.6 0.36 0.6
1 0.867 0.133 0.018 0.021
0 0.4 -0.4 0.16 0.4
1 0.267 0.733 0.537 2.011
3 1.2 1.8 3.24 2.7
0 1.733 -1.733 3.003 1.733
0 0.8 -0.8 0.64 0.8
0 0.6 -0.6 0.36 0.6
4 2.7 1.3 1.69 0.626
5 3.9 1.1 1.21 0.31
0 1.8 -1.8 3.24 1.8
0 0.733 -0.733 0.537 0.733
2 3.3 -1.3 1.69 0.512
6 4.767 1.233 1.52 0.319
3 2.2 0.8 0.64 0.291
0 0.267 -0.267 0.071 0.267
0 1.2 -1.2 1.44 1.2
1 1.733 -0.733 0.537 0.31
3 0.8 2.2 4.84 6.05
26.933
Degree of Freedom
= (5-1) x (4-1)
= 12
With the significant level of 5% Chi Squared from the table equals to 21.0. The
calculated result is 26.933 while the table result is 21.0. Because this result is
greater than the chi squared from the table, the null hypothesis is rejected. Which
means that height and shoe size are dependent of each other.
17. Conclusion
After analyzing the gathered date and finding the R values and Chi squared
test it can be concluded that height and shoe size are correlated. It is not a very
strong correlation but with results of 0.38 for male, 0.33 for female and 0.577 for
both the correlation is shown. In the graphs it is also very visible to see the
correlation and because the point are not extremely spread out the it is shown that
the correlation is somewhat strong. Chi squared showed us that the null hypothesis
was accepted for both male and female but when it came to testing both, the null
hypothesis was rejected.