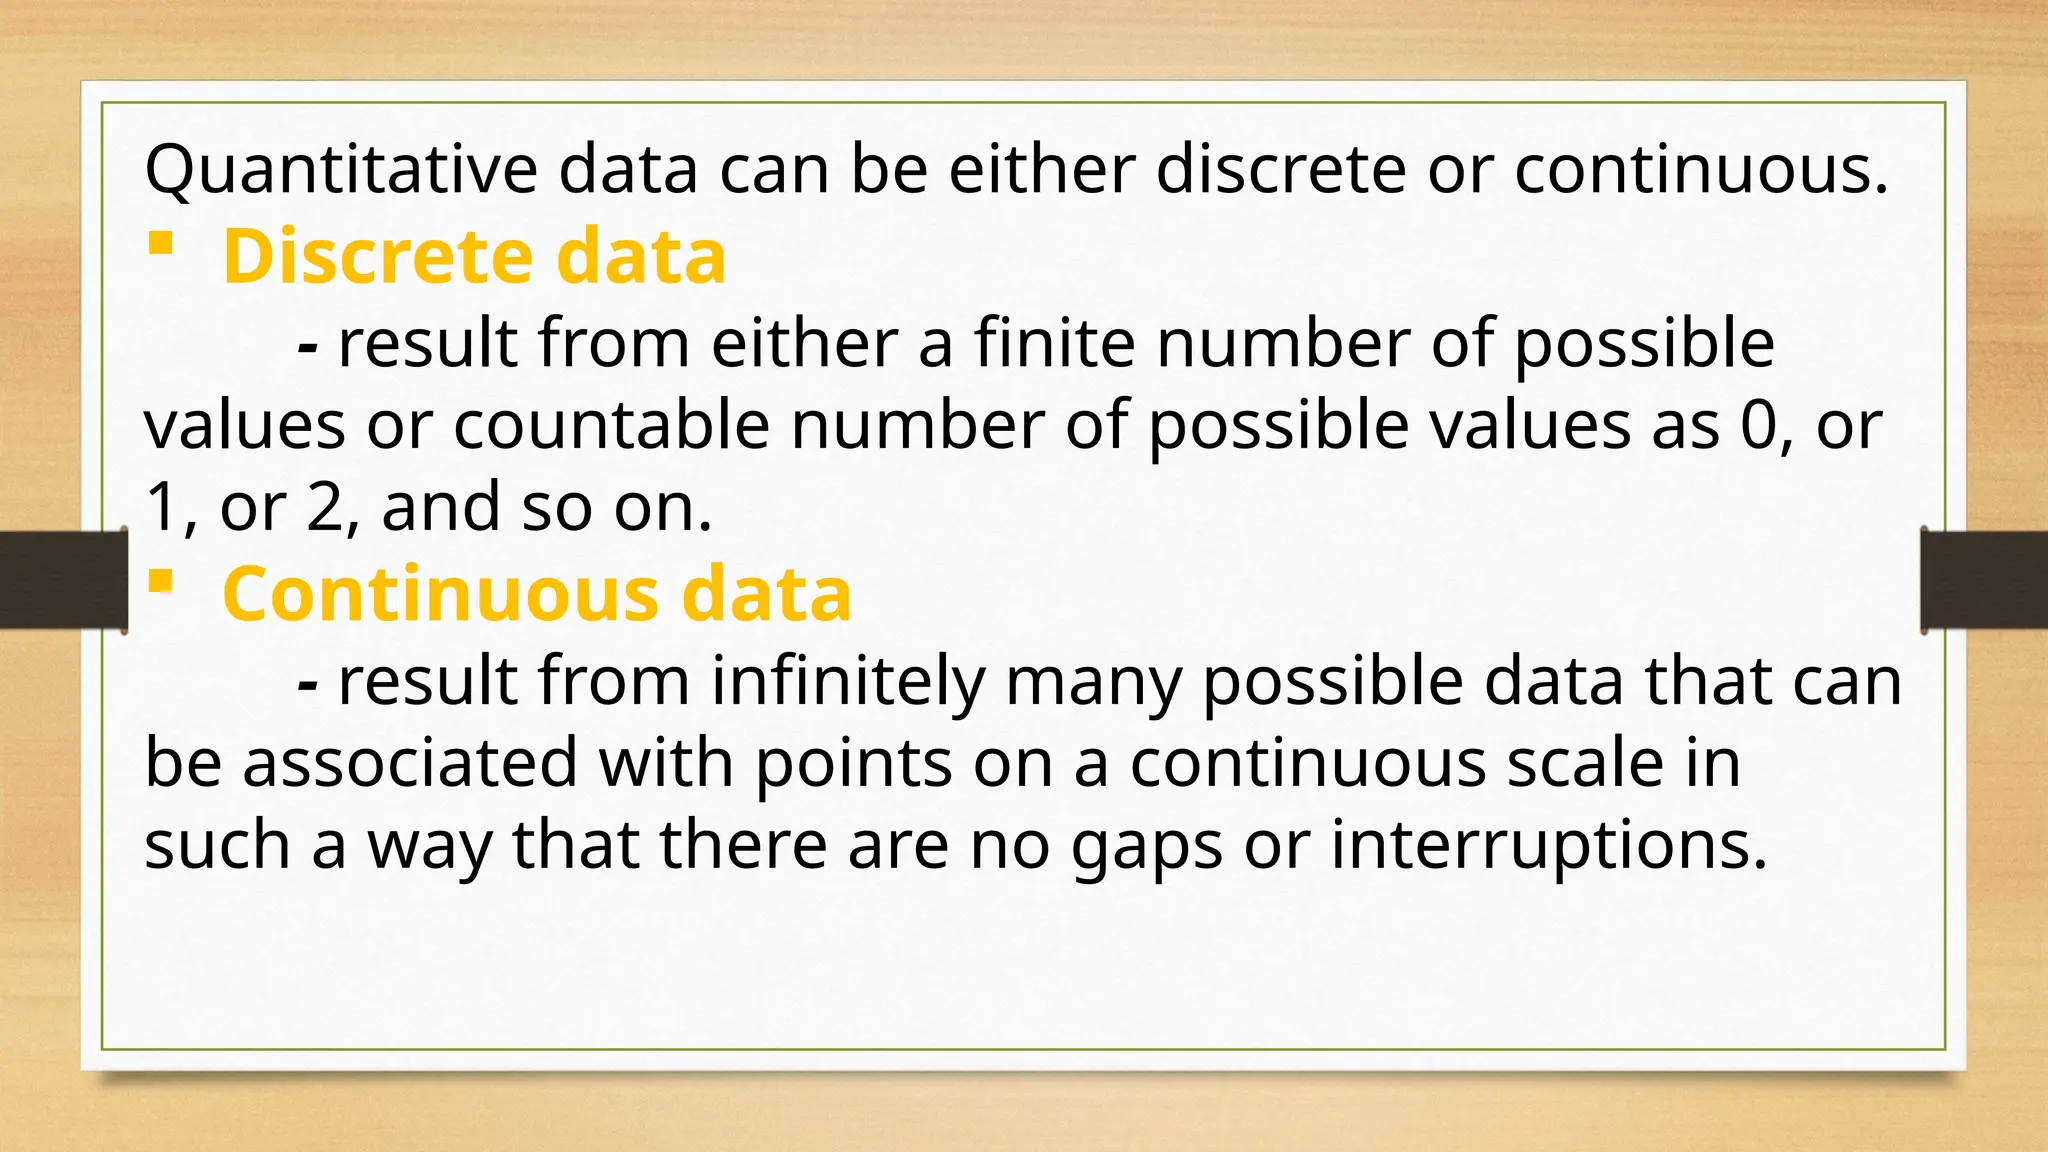
MATH 7
Simple Statistical Instruments
The Nature of Data
Data
- is a collection of facts or set of information
or observation under study.
2 Types of Data
1. Quantitative data
- consist of numbers representing counts or
measurements, such as weights.
2. Qualitative data
-can be separated into different categories that
are distinguished by some nonnumeric characteristics.
Examples of qualitative variables are:
gender, major classification, political party affiliation,
religious, marital status and others.
Example 1
Classify the following as quantitative or
qualitative.
a. Opinion on health issue
Solution: Opinion is not a form of measurement but rather a
classification, such as for or against: therefore, it is qualitative.
b. Number of hospitals that have a nuclear
center
Solution: The number of hospitals that have a nuclear center
is a count variable thus, quantitative.
Quantitative data can be either discrete or continuous.
 Discrete data
- result from either a finite number of possible
values or countable number of possible values as 0, or
1, or 2, and so on.
 Continuous data
- result from infinitely many possible data that can
be associated with points on a continuous scale in
such a way that there are no gaps or interruptions.
Example 2
Classify the following as a qualitative or quantitative.
If a variable is quantitative (numerical), further classify
it as a discrete or continuous.
a.ages of congresswoman
Solution: quantitative - continuous
b. number of students in a Stadium
Solution: quantitative – discrete
c. faculty rank
Solution: qualitative
The different levels of measurement are classified into
four categories:
Nominal, Ordinal, Ratio and Interval
Nominal
The nominal level of measurement is characterized by
data that consist of names, labels, or categories only.
Ordinal
The ordinal level of measurement involves data that may
be arranged in some order but differences between data
values either cannot be determined or are meaningless.
Ratio
The interval level of measurement is like the ordinal level.
But meaningful amounts of differences between data can
be determined. It has no inherent (natural) zero starting
point (where none of the quality is present).
Interval
The ratio level of measurement is the interval level
modified to include the inherent zero starting point
(where zero indicates that none of the quality is present).
Example
Determine which of the four levels of measurements is used.
a.Average annual temperature in Baguio.
Solution: INTERVAL
b. Weights of garbage discarded by restaurants.
Solution: RATIO
c. A jury rates some presentations as “good.”
Solution: ORDINAL
d. The political party to which each Barangay Captain
belongs.
Solution: NOMINAL
Let’s Do It!
I. Classify each of the following data as quantitative or
qualitative kind of data.
1. age of students
Solution: quantitative
2. color of eye
Solution: qualitative
3. number of computers in the school
Solution: quantitative
4. school logo
Solution: qualitative
5. score in the entrance tests
Solution: quantitative
II. Identify each of the following data as continuous or
discrete data.
1. number of mangoes harvested
Answer: Discrete
2. height of a building
Answer: Continuous
3. area of a circle
Answer: Continuous
4. number of guests in a wedding
Answer: Discrete
5. dimensions of a white board
Answer: Continuous
ACTIVITY 1: LET’S PRACTICE!
Directions: Classify the following as
discrete or continuous. Write the
answer on the space provided for.
____________ 1. Air temperature
____________ 2. Number of typewriters
____________ 3. Number of mobile phones
____________ 4. Length of Rod
____________ 5. Number of DVD’s rented
ACTIVITY : KEEP PRACTICING!
Directions: Classify the following as qualitative
or quantitative. Write the answer on the space
provided for.
1. age _________________
2. cell phone number __________________
3. marital status ___________________
4. employment rate _________________
5. net income _________________
TEST YOURSELF!
Directions: Read and analyze the statement then identify the
levels of measurements used. If it is nominal, ordinal, interval
or ratio. Write the answer on the space before each number.
__________ 1. Ratings of excellent, above average, average,
below average or poor for painting exhibits.
__________ 2. Zip codes
__________ 3. Annual income of teachers
__________ 4. Final grades (A, B, C, D, E) for Mathematics
students
__________ 5. SSS
Have a Nice Day Ahead My Dear Students
May God Bless Us All!!!
MATH 7 NATURE OF DATA under the Simple Statistical Instruments.pptx

MATH 7 NATURE OF DATA under the Simple Statistical Instruments.pptx

  • 1.
  • 2.
    The Nature ofData Data - is a collection of facts or set of information or observation under study.
  • 3.
    2 Types ofData 1. Quantitative data - consist of numbers representing counts or measurements, such as weights. 2. Qualitative data -can be separated into different categories that are distinguished by some nonnumeric characteristics. Examples of qualitative variables are: gender, major classification, political party affiliation, religious, marital status and others.
  • 4.
    Example 1 Classify thefollowing as quantitative or qualitative. a. Opinion on health issue Solution: Opinion is not a form of measurement but rather a classification, such as for or against: therefore, it is qualitative. b. Number of hospitals that have a nuclear center Solution: The number of hospitals that have a nuclear center is a count variable thus, quantitative.
  • 5.
    Quantitative data canbe either discrete or continuous.  Discrete data - result from either a finite number of possible values or countable number of possible values as 0, or 1, or 2, and so on.  Continuous data - result from infinitely many possible data that can be associated with points on a continuous scale in such a way that there are no gaps or interruptions.
  • 6.
    Example 2 Classify thefollowing as a qualitative or quantitative. If a variable is quantitative (numerical), further classify it as a discrete or continuous. a.ages of congresswoman Solution: quantitative - continuous b. number of students in a Stadium Solution: quantitative – discrete c. faculty rank Solution: qualitative
  • 7.
    The different levelsof measurement are classified into four categories: Nominal, Ordinal, Ratio and Interval Nominal The nominal level of measurement is characterized by data that consist of names, labels, or categories only. Ordinal The ordinal level of measurement involves data that may be arranged in some order but differences between data values either cannot be determined or are meaningless.
  • 8.
    Ratio The interval levelof measurement is like the ordinal level. But meaningful amounts of differences between data can be determined. It has no inherent (natural) zero starting point (where none of the quality is present). Interval The ratio level of measurement is the interval level modified to include the inherent zero starting point (where zero indicates that none of the quality is present).
  • 9.
    Example Determine which ofthe four levels of measurements is used. a.Average annual temperature in Baguio. Solution: INTERVAL b. Weights of garbage discarded by restaurants. Solution: RATIO c. A jury rates some presentations as “good.” Solution: ORDINAL d. The political party to which each Barangay Captain belongs. Solution: NOMINAL
  • 10.
    Let’s Do It! I.Classify each of the following data as quantitative or qualitative kind of data. 1. age of students Solution: quantitative 2. color of eye Solution: qualitative 3. number of computers in the school Solution: quantitative 4. school logo Solution: qualitative 5. score in the entrance tests Solution: quantitative
  • 11.
    II. Identify eachof the following data as continuous or discrete data. 1. number of mangoes harvested Answer: Discrete 2. height of a building Answer: Continuous 3. area of a circle Answer: Continuous 4. number of guests in a wedding Answer: Discrete 5. dimensions of a white board Answer: Continuous
  • 12.
    ACTIVITY 1: LET’SPRACTICE! Directions: Classify the following as discrete or continuous. Write the answer on the space provided for. ____________ 1. Air temperature ____________ 2. Number of typewriters ____________ 3. Number of mobile phones ____________ 4. Length of Rod ____________ 5. Number of DVD’s rented
  • 13.
    ACTIVITY : KEEPPRACTICING! Directions: Classify the following as qualitative or quantitative. Write the answer on the space provided for. 1. age _________________ 2. cell phone number __________________ 3. marital status ___________________ 4. employment rate _________________ 5. net income _________________
  • 14.
    TEST YOURSELF! Directions: Readand analyze the statement then identify the levels of measurements used. If it is nominal, ordinal, interval or ratio. Write the answer on the space before each number. __________ 1. Ratings of excellent, above average, average, below average or poor for painting exhibits. __________ 2. Zip codes __________ 3. Annual income of teachers __________ 4. Final grades (A, B, C, D, E) for Mathematics students __________ 5. SSS
  • 15.
    Have a NiceDay Ahead My Dear Students May God Bless Us All!!!