SlideShare a Scribd company logo
1 of 12
Download to read offline
June 2018 Activity Snapshot
One-Year Change in One-Year Change in
Closed Sales Median Sales Price
2
3
4
5
6
7
8
9
10
11
12
Changes in methodology were implemented in October 2012 to provide a more accurate count of inventory and related metrics. Due to MLS purging rules, activity before 2008 cannot be updated and therefore shifts in the trendlines may occur.
Current as of July 16, 2018. Data comes from the Georgia MLS, Columbus Board of REALTORS®, Savannah MLS and Greater Augusta Association of REALTORS®. Report © 2018 ShowingTime.
Pending Sales
Closed Sales
Days on Market Until Sale
Median Sales Price
Average Sales Price
Percent of Original List Price Received
Housing markets across the nation are most assuredly active this summer, and
buyer competition is manifesting itself into several quick sales above asking
price. While the strength of the U.S. economy has helped purchase offers pile
up, the Fed recently increased the federal funds rate by 0.25 percent, marking
the second rate hike this year and seventh since late 2015. Although the 30-year
mortgage rate did not increase, buyers often react by locking in at the current
rate ahead of assumed higher rates later. When this happens, accelerated price
increases are possible, causing further strain on affordability.
New Listings increased 2.0 percent to 17,182. Pending Sales were up 7.8
percent to 12,646. Inventory levels shrank 12.3 percent to 35,485 units.
Prices continued to gain traction. The Median Sales Price increased 9.5 percent
to $229,900. Days on Market was down 13.2 percent to 46 days. Sellers were
encouraged as Months Supply of Inventory was down 17.5 percent to 3.3
months.
Inventory may be persistently lower in year-over-year comparisons, and home
prices are still more likely to rise than not, but sales and new listings may finish
the summer on the upswing. The housing supply outlook in several markets is
beginning to show an increase in new construction and a move by builders
away from overstocked rental units to new developments for sale. These are
encouraging signs in an already healthy marketplace.
Homes for Sale
A research tool provided by the Georgia Association of REALTORS®.
Residential real estate activity comprised of single-family properties,
townhomes and condominiums combined. Percent changes are
calculated using rounded figures.
Activity Overview
New Listings
Housing Affordability Index
Inventory of Homes for Sale
Months Supply of Inventory
Monthly Indicators
- 1.3% + 9.5% - 12.3%
One-Year Change in
Activity Overview
Key Metrics Historical Sparkbars 6-2017 6-2018 Percent Change YTD 2017 YTD 2018 Percent Change
Current as of July 16, 2018. Data comes from the Georgia MLS, Columbus Board of REALTORS®, Savannah MLS and Greater Augusta Association of REALTORS®. Report © 2018 ShowingTime. | 2
+ 0.8%
Housing Affordability Index 186 160 - 14.0% 196 170 - 13.3%
Pct. of Orig. Price Received 96.6% 97.4% + 0.8% 96.1% 96.9%
--
-- --
Inventory of Homes for Sale 40,478 35,485 - 12.3% -- --
Months Supply of Inventory 4.0 3.3 - 17.5% --
+ 9.3%
Average Sales Price $255,391 $279,780 + 9.5% $243,154 $262,995 + 8.2%
Median Sales Price $210,000 $229,900 + 9.5% $198,900 $217,400
+ 3.9%
Days on Market Until Sale 53 46 - 13.2% 60 53 - 11.7%
Closed Sales 13,161 12,986 - 1.3% 61,384 63,797
Key metrics by report month and for year-to-date (YTD) starting from the first of the year.
New Listings 16,852 17,182 + 2.0% 94,385 + 1.3%
Pending Sales 11,734 12,646 + 7.8% 67,028 71,152 + 6.2%
93,206
6-2015 6-2016 6-2017 6-2018
6-2015 6-2016 6-2017 6-2018
6-2015 6-2016 6-2017 6-2018
6-2015 6-2016 6-2017 6-2018
6-2015 6-2016 6-2017 6-2018
6-2015 6-2016 6-2017 6-2018
6-2015 6-2016 6-2017 6-2018
6-2015 6-2016 6-2017 6-2018
6-2015 6-2016 6-2017 6-2018
6-2015 6-2016 6-2017 6-2018
New Listings
Prior Year Percent Change
July 2017 15,044 14,418 +4.3%
August 2017 15,224 14,526 +4.8%
September 2017 12,116 13,472 -10.1%
October 2017 13,130 12,356 +6.3%
November 2017 11,101 10,137 +9.5%
December 2017 8,251 8,130 +1.5%
January 2018 12,219 12,713 -3.9%
February 2018 13,629 13,422 +1.5%
March 2018 17,072 17,567 -2.8%
April 2018 16,768 15,566 +7.7%
May 2018 17,515 17,086 +2.5%
June 2018 17,182 16,852 +2.0%
12-Month Avg 14,104 13,854 +1.8%
Historical New Listings by Month
Current as of July 16, 2018. Data comes from the Georgia MLS, Columbus Board of REALTORS®, Savannah MLS and Greater Augusta Association of REALTORS®. Report © 2018 ShowingTime. | 3
A count of the properties that have been newly listed on the market in a given month.
New Listings
16,976 16,852 17,182
2016 2017 2018
June
6,000
8,000
10,000
12,000
14,000
16,000
18,000
1-2012 1-2013 1-2014 1-2015 1-2016 1-2017 1-2018
91,774 93,206 94,385
2016 2017 2018
Year to Date
+ 1.3%- 0.7% + 2.0% + 1.6%+ 8.7% + 6.3%
Pending Sales
Prior Year Percent Change
July 2017 11,194 10,250 +9.2%
August 2017 11,112 10,274 +8.2%
September 2017 8,928 9,224 -3.2%
October 2017 10,102 8,759 +15.3%
November 2017 8,842 7,784 +13.6%
December 2017 7,339 6,815 +7.7%
January 2018 9,518 8,755 +8.7%
February 2018 10,254 9,991 +2.6%
March 2018 12,901 12,613 +2.3%
April 2018 12,961 11,699 +10.8%
May 2018 12,872 12,236 +5.2%
June 2018 12,646 11,734 +7.8%
12-Month Avg 10,722 10,011 +7.1%
Historical Pending Sales by Month
Current as of July 16, 2018. Data comes from the Georgia MLS, Columbus Board of REALTORS®, Savannah MLS and Greater Augusta Association of REALTORS®. Report © 2018 ShowingTime. | 4
A count of the properties on which offers have been accepted in a given month.
Pending Sales
11,438 11,734
12,646
2016 2017 2018
June
4,000
6,000
8,000
10,000
12,000
14,000
1-2012 1-2013 1-2014 1-2015 1-2016 1-2017 1-2018
64,193
67,028
71,152
2016 2017 2018
Year to Date
+ 6.2%+ 2.6% + 7.8% + 4.4%+ 11.5% + 12.6%
Closed Sales
Prior Year Percent Change
July 2017 11,395 11,148 +2.2%
August 2017 11,870 11,299 +5.1%
September 2017 10,142 10,091 +0.5%
October 2017 9,917 9,128 +8.6%
November 2017 9,328 8,567 +8.9%
December 2017 9,775 9,229 +5.9%
January 2018 7,109 6,615 +7.5%
February 2018 8,141 7,524 +8.2%
March 2018 11,163 11,356 -1.7%
April 2018 11,347 10,265 +10.5%
May 2018 13,051 12,463 +4.7%
June 2018 12,986 13,161 -1.3%
12-Month Avg 10,519 10,071 +4.4%
Historical Closed Sales by Month
Current as of July 16, 2018. Data comes from the Georgia MLS, Columbus Board of REALTORS®, Savannah MLS and Greater Augusta Association of REALTORS®. Report © 2018 ShowingTime. | 5
A count of the actual sales that closed in a given month.
Closed Sales
12,216
13,161 12,986
2016 2017 2018
June
4,000
6,000
8,000
10,000
12,000
14,000
1-2012 1-2013 1-2014 1-2015 1-2016 1-2017 1-2018
56,946
61,384 63,797
2016 2017 2018
Year to Date
+ 3.9%+ 7.7% - 1.3% + 7.8%+ 10.6% + 11.2%
Days on Market Until Sale
Prior Year Percent Change
July 2017 50 55 -9.1%
August 2017 51 55 -7.3%
September 2017 53 58 -8.6%
October 2017 55 59 -6.8%
November 2017 57 60 -5.0%
December 2017 61 65 -6.2%
January 2018 63 68 -7.4%
February 2018 62 72 -13.9%
March 2018 58 66 -12.1%
April 2018 52 59 -11.9%
May 2018 48 53 -9.4%
June 2018 46 53 -13.2%
12-Month Avg* 54 59 -8.5%
Historical Days on Market Until Sale by Month
Current as of July 16, 2018. Data comes from the Georgia MLS, Columbus Board of REALTORS®, Savannah MLS and Greater Augusta Association of REALTORS®. Report © 2018 ShowingTime. | 6
Average number of days between when a property is listed and when an offer is accepted in a given month.
Days on Market
* Average Days on Market of all properties from July 2017 through June 2018. This
is not the average of the individual figures above.
58
53
46
2016 2017 2018
June
40
50
60
70
80
90
100
110
1-2012 1-2013 1-2014 1-2015 1-2016 1-2017 1-2018
69
60
53
2016 2017 2018
Year to Date
- 11.7%- 8.6% - 13.2% - 13.0%- 15.9% - 11.5%
Median Sales Price
Prior Year Percent Change
July 2017 $208,500 $200,000 +4.3%
August 2017 $203,000 $190,000 +6.8%
September 2017 $199,000 $187,000 +6.4%
October 2017 $200,000 $186,252 +7.4%
November 2017 $198,900 $188,000 +5.8%
December 2017 $205,775 $188,990 +8.9%
January 2018 $196,625 $182,900 +7.5%
February 2018 $203,995 $186,500 +9.4%
March 2018 $215,000 $195,000 +10.3%
April 2018 $219,000 $200,000 +9.5%
May 2018 $224,000 $204,000 +9.8%
June 2018 $229,900 $210,000 +9.5%
12-Month Med* $210,000 $194,900 +7.7%
Historical Median Sales Price by Month
Current as of July 16, 2018. Data comes from the Georgia MLS, Columbus Board of REALTORS®, Savannah MLS and Greater Augusta Association of REALTORS®. Report © 2018 ShowingTime. | 7
Point at which half of the sales sold for more and half sold for less, not accounting for seller concessions, in a given month.
Median Sales Price
* Median Sales Price of all properties from July 2017 through June 2018. This is not
the average of the individual figures above.
$198,000
$210,000
$229,900
2016 2017 2018
June
$75,000
$100,000
$125,000
$150,000
$175,000
$200,000
$225,000
$250,000
1-2012 1-2013 1-2014 1-2015 1-2016 1-2017 1-2018
$185,000
$198,900
$217,400
2016 2017 2018
Year to Date
+ 9.3%+ 6.1% + 9.5% + 7.5%+ 5.9% + 5.7%
Average Sales Price
Prior Year Percent Change
July 2017 $256,257 $245,160 +4.5%
August 2017 $246,639 $236,454 +4.3%
September 2017 $242,225 $229,889 +5.4%
October 2017 $245,282 $232,438 +5.5%
November 2017 $245,024 $234,672 +4.4%
December 2017 $248,982 $234,221 +6.3%
January 2018 $240,541 $225,237 +6.8%
February 2018 $244,267 $225,312 +8.4%
March 2018 $259,071 $238,889 +8.4%
April 2018 $264,645 $246,846 +7.2%
May 2018 $272,120 $251,347 +8.3%
June 2018 $279,780 $255,391 +9.5%
12-Month Avg* $255,376 $239,513 +6.6%
Historical Average Sales Price by Month
Current as of July 16, 2018. Data comes from the Georgia MLS, Columbus Board of REALTORS®, Savannah MLS and Greater Augusta Association of REALTORS®. Report © 2018 ShowingTime. | 8
Average sales price for all closed sales, not accounting for seller concessions, in a given month.
Avg. Sales Price
* Avg. Sales Price of all properties from July 2017 through June 2018. This is not
the average of the individual figures above.
$242,606
$255,391
$279,780
2016 2017 2018
June
$100,000
$150,000
$200,000
$250,000
$300,000
1-2012 1-2013 1-2014 1-2015 1-2016 1-2017 1-2018
$229,809
$243,154
$262,995
2016 2017 2018
Year to Date
+ 8.2%+ 5.3% + 9.5% + 5.8%+ 2.1% + 3.9%
Percent of Original List Price Received
Prior Year Percent Change
July 2017 96.4% 96.1% +0.3%
August 2017 96.0% 95.6% +0.4%
September 2017 96.1% 95.4% +0.7%
October 2017 95.7% 95.3% +0.4%
November 2017 95.8% 95.1% +0.7%
December 2017 95.8% 94.8% +1.1%
January 2018 95.6% 95.0% +0.6%
February 2018 96.1% 95.3% +0.8%
March 2018 96.7% 95.9% +0.8%
April 2018 97.2% 96.3% +0.9%
May 2018 97.4% 96.7% +0.7%
June 2018 97.4% 96.6% +0.8%
12-Month Avg* 96.4% 95.8% +0.6%
Historical Percent of Original List Price Received by Month
Current as of July 16, 2018. Data comes from the Georgia MLS, Columbus Board of REALTORS®, Savannah MLS and Greater Augusta Association of REALTORS®. Report © 2018 ShowingTime. | 9
Percentage found when dividing a property’s sales price by its original list price, then taking the average for all properties sold
in a given month, not accounting for seller concessions.
Pct. of Orig. Price Received
* Average Pct. of Orig. Price Received for all properties from July 2017 through
June 2018. This is not the average of the individual figures above.
96.3% 96.6% 97.4%
2016 2017 2018
June
88%
90%
92%
94%
96%
98%
1-2012 1-2013 1-2014 1-2015 1-2016 1-2017 1-2018
95.5% 96.1% 96.9%
2016 2017 2018
Year to Date
+ 0.8%+ 0.3% + 0.8% + 0.6%+ 1.0% + 1.1%
Housing Affordability Index
Prior Year Percent Change
July 2017 188 202 -6.9%
August 2017 194 213 -8.9%
September 2017 198 215 -7.9%
October 2017 194 219 -11.4%
November 2017 197 206 -4.4%
December 2017 188 198 -5.1%
January 2018 191 202 -5.4%
February 2018 183 204 -10.3%
March 2018 173 194 -10.8%
April 2018 167 193 -13.5%
May 2018 163 191 -14.7%
June 2018 160 186 -14.0%
12-Month Avg 183 183 0.0%
Historical Housing Affordability Index by Month
Current as of July 16, 2018. Data comes from the Georgia MLS, Columbus Board of REALTORS®, Savannah MLS and Greater Augusta Association of REALTORS®. Report © 2018 ShowingTime. | 10
This index measures housing affordability for the region. For example, an index of 120 means the median household income is 120% of
what is necessary to qualify for the median-priced home under prevailing interest rates. A higher number means greater affordability.
Affordability Index
204
186
160
2016 2017 2018
June
100
200
300
400
500
1-2012 1-2013 1-2014 1-2015 1-2016 1-2017 1-2018
218
196
170
2016 2017 2018
Year to Date
- 13.3%- 8.8% - 14.0% - 10.1%- 3.8% - 4.0%
Inventory of Homes for Sale
Prior Year Percent Change
July 2017 40,317 44,192 -8.8%
August 2017 39,798 43,727 -9.0%
September 2017 38,738 43,235 -10.4%
October 2017 37,385 42,154 -11.3%
November 2017 35,696 40,289 -11.4%
December 2017 32,997 37,277 -11.5%
January 2018 31,481 36,448 -13.6%
February 2018 31,763 36,451 -12.9%
March 2018 32,634 37,657 -13.3%
April 2018 33,365 38,036 -12.3%
May 2018 34,636 39,162 -11.6%
June 2018 35,485 40,478 -12.3%
12-Month Avg 35,358 39,926 -11.4%
Historical Inventory of Homes for Sale by Month
Current as of July 16, 2018. Data comes from the Georgia MLS, Columbus Board of REALTORS®, Savannah MLS and Greater Augusta Association of REALTORS®. Report © 2018 ShowingTime. | 11
The number of properties available for sale in active status at the end of a given month.
Homes for Sale
44,371
40,478
35,485
2016 2017 2018
June
30,000
35,000
40,000
45,000
50,000
1-2012 1-2013 1-2014 1-2015 1-2016 1-2017 1-2018
- 8.8% - 12.3%- 7.2%
Months Supply of Inventory
Prior Year Percent Change
July 2017 4.0 4.6 -13.0%
August 2017 3.9 4.5 -13.3%
September 2017 3.8 4.5 -15.6%
October 2017 3.6 4.3 -16.3%
November 2017 3.5 4.1 -14.6%
December 2017 3.2 3.8 -15.8%
January 2018 3.0 3.7 -18.9%
February 2018 3.0 3.7 -18.9%
March 2018 3.1 3.8 -18.4%
April 2018 3.1 3.8 -18.4%
May 2018 3.3 3.9 -15.4%
June 2018 3.3 4.0 -17.5%
12-Month Avg 3.4 4.1 -17.1%
Historical Months Supply of Inventory by Month
Current as of July 16, 2018. Data comes from the Georgia MLS, Columbus Board of REALTORS®, Savannah MLS and Greater Augusta Association of REALTORS®. Report © 2018 ShowingTime. | 12
The inventory of homes for sale at the end of a given month, divided by the average monthly pending sales from the last 12 months.
Months Supply
* Months Supply for all properties from July 2017 through June 2018. This is not the
average of the individual figures above.
4.7
4.0
3.3
2016 2017 2018
June
3.0
4.0
5.0
6.0
7.0
1-2013 1-2014 1-2015 1-2016 1-2017 1-2018
- 14.9% - 17.5%- 17.5%

More Related Content

What's hot

Jan 2018 Gallatin Valley market reports
Jan 2018 Gallatin Valley market reportsJan 2018 Gallatin Valley market reports
Jan 2018 Gallatin Valley market reportsReferred Realty Group
 
Charlotte region -monthly indicators - feb 2018
Charlotte region -monthly indicators - feb 2018Charlotte region -monthly indicators - feb 2018
Charlotte region -monthly indicators - feb 2018Scott Browder
 
Charlotte, North Carolina Real Estate Update August
Charlotte, North Carolina Real Estate Update AugustCharlotte, North Carolina Real Estate Update August
Charlotte, North Carolina Real Estate Update AugustScott Browder
 
Feb 2018 Market Reports for Bozeman, Belgrade, Livingston, Big Sky
Feb 2018 Market Reports for Bozeman, Belgrade, Livingston, Big SkyFeb 2018 Market Reports for Bozeman, Belgrade, Livingston, Big Sky
Feb 2018 Market Reports for Bozeman, Belgrade, Livingston, Big SkyReferred Realty Group
 
San Francisco Market Focus Report Aug 2018
San Francisco Market Focus Report Aug 2018San Francisco Market Focus Report Aug 2018
San Francisco Market Focus Report Aug 2018Ronny Budiutama
 
San Francisco Market Focus Report July
San Francisco Market Focus Report JulySan Francisco Market Focus Report July
San Francisco Market Focus Report JulyRonny Budiutama
 
San Francisco Market Focus Report November 2018
San Francisco Market Focus Report November 2018San Francisco Market Focus Report November 2018
San Francisco Market Focus Report November 2018Ronny Budiutama
 
San Francisco Market Focus April 2018
San Francisco Market Focus April 2018San Francisco Market Focus April 2018
San Francisco Market Focus April 2018Ronny Budiutama
 
San Francisco Market Focus Report May
San Francisco Market Focus Report MaySan Francisco Market Focus Report May
San Francisco Market Focus Report MayRonny Budiutama
 
National Residential Real Estate Market - January 2019 update
National Residential Real Estate Market - January 2019 updateNational Residential Real Estate Market - January 2019 update
National Residential Real Estate Market - January 2019 updateScott Rodgers
 
Austin Real Estate Market Report May 2013
Austin Real Estate Market Report May 2013 Austin Real Estate Market Report May 2013
Austin Real Estate Market Report May 2013 austinhometeam
 
Charlotte Real Estate Market Overview
Charlotte Real Estate Market OverviewCharlotte Real Estate Market Overview
Charlotte Real Estate Market OverviewScott Browder
 
San Francisco Market Focus Report October 2018
San Francisco Market Focus Report October 2018San Francisco Market Focus Report October 2018
San Francisco Market Focus Report October 2018Ronny Budiutama
 
San Francisco Market Focus February 2018
San Francisco Market Focus February 2018San Francisco Market Focus February 2018
San Francisco Market Focus February 2018Ronny Budiutama
 
Greater Boston Association of Realtors January 2017 Monthly Indicators Report
Greater Boston Association of Realtors January 2017 Monthly Indicators ReportGreater Boston Association of Realtors January 2017 Monthly Indicators Report
Greater Boston Association of Realtors January 2017 Monthly Indicators ReportJoe Schutt
 
December 2016 Greater Boston Real Estate Market Trends
December 2016 Greater Boston Real Estate Market TrendsDecember 2016 Greater Boston Real Estate Market Trends
December 2016 Greater Boston Real Estate Market TrendsJoe Schutt
 
San Francisco Market Focus March 2018
San Francisco Market Focus March 2018San Francisco Market Focus March 2018
San Francisco Market Focus March 2018Ronny Budiutama
 
January 2018 San Francisco Market Update
January 2018 San Francisco Market UpdateJanuary 2018 San Francisco Market Update
January 2018 San Francisco Market UpdateRonny Budiutama
 
Georgia Association of Realtors Stats for December 2013
Georgia Association of Realtors Stats for December 2013Georgia Association of Realtors Stats for December 2013
Georgia Association of Realtors Stats for December 2013Sandra Watkins
 

What's hot (20)

Jan 2018 Gallatin Valley market reports
Jan 2018 Gallatin Valley market reportsJan 2018 Gallatin Valley market reports
Jan 2018 Gallatin Valley market reports
 
Charlotte region -monthly indicators - feb 2018
Charlotte region -monthly indicators - feb 2018Charlotte region -monthly indicators - feb 2018
Charlotte region -monthly indicators - feb 2018
 
Charlotte, North Carolina Real Estate Update August
Charlotte, North Carolina Real Estate Update AugustCharlotte, North Carolina Real Estate Update August
Charlotte, North Carolina Real Estate Update August
 
Feb 2018 Market Reports for Bozeman, Belgrade, Livingston, Big Sky
Feb 2018 Market Reports for Bozeman, Belgrade, Livingston, Big SkyFeb 2018 Market Reports for Bozeman, Belgrade, Livingston, Big Sky
Feb 2018 Market Reports for Bozeman, Belgrade, Livingston, Big Sky
 
San Francisco Market Focus Report Aug 2018
San Francisco Market Focus Report Aug 2018San Francisco Market Focus Report Aug 2018
San Francisco Market Focus Report Aug 2018
 
San Francisco Market Focus Report July
San Francisco Market Focus Report JulySan Francisco Market Focus Report July
San Francisco Market Focus Report July
 
San Francisco Market Focus Report November 2018
San Francisco Market Focus Report November 2018San Francisco Market Focus Report November 2018
San Francisco Market Focus Report November 2018
 
San Francisco Market Focus April 2018
San Francisco Market Focus April 2018San Francisco Market Focus April 2018
San Francisco Market Focus April 2018
 
San Francisco Market Focus Report May
San Francisco Market Focus Report MaySan Francisco Market Focus Report May
San Francisco Market Focus Report May
 
National Residential Real Estate Market - January 2019 update
National Residential Real Estate Market - January 2019 updateNational Residential Real Estate Market - January 2019 update
National Residential Real Estate Market - January 2019 update
 
Austin Real Estate Market Report May 2013
Austin Real Estate Market Report May 2013 Austin Real Estate Market Report May 2013
Austin Real Estate Market Report May 2013
 
Charlotte Real Estate Market Overview
Charlotte Real Estate Market OverviewCharlotte Real Estate Market Overview
Charlotte Real Estate Market Overview
 
San Francisco Market Focus Report October 2018
San Francisco Market Focus Report October 2018San Francisco Market Focus Report October 2018
San Francisco Market Focus Report October 2018
 
May 2018 Market Reports
May 2018 Market ReportsMay 2018 Market Reports
May 2018 Market Reports
 
San Francisco Market Focus February 2018
San Francisco Market Focus February 2018San Francisco Market Focus February 2018
San Francisco Market Focus February 2018
 
Greater Boston Association of Realtors January 2017 Monthly Indicators Report
Greater Boston Association of Realtors January 2017 Monthly Indicators ReportGreater Boston Association of Realtors January 2017 Monthly Indicators Report
Greater Boston Association of Realtors January 2017 Monthly Indicators Report
 
December 2016 Greater Boston Real Estate Market Trends
December 2016 Greater Boston Real Estate Market TrendsDecember 2016 Greater Boston Real Estate Market Trends
December 2016 Greater Boston Real Estate Market Trends
 
San Francisco Market Focus March 2018
San Francisco Market Focus March 2018San Francisco Market Focus March 2018
San Francisco Market Focus March 2018
 
January 2018 San Francisco Market Update
January 2018 San Francisco Market UpdateJanuary 2018 San Francisco Market Update
January 2018 San Francisco Market Update
 
Georgia Association of Realtors Stats for December 2013
Georgia Association of Realtors Stats for December 2013Georgia Association of Realtors Stats for December 2013
Georgia Association of Realtors Stats for December 2013
 

Similar to Georgia Housing Market Snapshot: June 2018. Courtesy of the Georgia Association Of Realtors

Georgia Housing Market Snapshot For March 2019
Georgia Housing Market Snapshot For March 2019Georgia Housing Market Snapshot For March 2019
Georgia Housing Market Snapshot For March 2019Arthur Prescott
 
San Francisco market focus report June 2018
San Francisco market focus report June 2018San Francisco market focus report June 2018
San Francisco market focus report June 2018Ronny Budiutama
 
Charlotte Region Weekly Real Estate Market Activity Report
Charlotte Region Weekly Real Estate Market Activity ReportCharlotte Region Weekly Real Estate Market Activity Report
Charlotte Region Weekly Real Estate Market Activity ReportScott Browder
 
Georgia Housing Market Snapshot For February 2019
Georgia Housing Market Snapshot For February 2019Georgia Housing Market Snapshot For February 2019
Georgia Housing Market Snapshot For February 2019Arthur Prescott
 
Greater Baton Rouge Home Sales June 2019
Greater Baton Rouge Home Sales June 2019Greater Baton Rouge Home Sales June 2019
Greater Baton Rouge Home Sales June 2019Bill Cobb, Appraiser
 
San Francisco Market Focus Report September 2018
San Francisco Market Focus Report September 2018San Francisco Market Focus Report September 2018
San Francisco Market Focus Report September 2018Ronny Budiutama
 
San Francisco Market Focus Report December 2018
San Francisco Market Focus Report December 2018San Francisco Market Focus Report December 2018
San Francisco Market Focus Report December 2018Ronny Budiutama
 
San Francisco Market Focus June 2017
San Francisco Market Focus June 2017San Francisco Market Focus June 2017
San Francisco Market Focus June 2017Ronny Budiutama
 
June 2018 Gallatin Valley Market Reports
June 2018 Gallatin Valley Market ReportsJune 2018 Gallatin Valley Market Reports
June 2018 Gallatin Valley Market ReportsReferred Realty Group
 
Real Estate Weekly Market Activity Report
Real Estate Weekly Market Activity ReportReal Estate Weekly Market Activity Report
Real Estate Weekly Market Activity ReportScott Browder
 
July 2018 Gallatin Valley Market Reports
July 2018 Gallatin Valley Market ReportsJuly 2018 Gallatin Valley Market Reports
July 2018 Gallatin Valley Market ReportsReferred Realty Group
 
San Francisco Market Focus May 2017
San Francisco Market Focus May 2017San Francisco Market Focus May 2017
San Francisco Market Focus May 2017Ronny Budiutama
 
San Francisco Market Focus March 2017
San Francisco Market Focus March 2017San Francisco Market Focus March 2017
San Francisco Market Focus March 2017Ronny Budiutama
 
San Francisco Market Focus July 2017
San Francisco Market Focus July 2017San Francisco Market Focus July 2017
San Francisco Market Focus July 2017Ronny Budiutama
 
January 2014 Greater Boston Real Estate Market Trends Report
January 2014 Greater Boston Real Estate Market Trends ReportJanuary 2014 Greater Boston Real Estate Market Trends Report
January 2014 Greater Boston Real Estate Market Trends ReportUnit Realty Group
 

Similar to Georgia Housing Market Snapshot: June 2018. Courtesy of the Georgia Association Of Realtors (15)

Georgia Housing Market Snapshot For March 2019
Georgia Housing Market Snapshot For March 2019Georgia Housing Market Snapshot For March 2019
Georgia Housing Market Snapshot For March 2019
 
San Francisco market focus report June 2018
San Francisco market focus report June 2018San Francisco market focus report June 2018
San Francisco market focus report June 2018
 
Charlotte Region Weekly Real Estate Market Activity Report
Charlotte Region Weekly Real Estate Market Activity ReportCharlotte Region Weekly Real Estate Market Activity Report
Charlotte Region Weekly Real Estate Market Activity Report
 
Georgia Housing Market Snapshot For February 2019
Georgia Housing Market Snapshot For February 2019Georgia Housing Market Snapshot For February 2019
Georgia Housing Market Snapshot For February 2019
 
Greater Baton Rouge Home Sales June 2019
Greater Baton Rouge Home Sales June 2019Greater Baton Rouge Home Sales June 2019
Greater Baton Rouge Home Sales June 2019
 
San Francisco Market Focus Report September 2018
San Francisco Market Focus Report September 2018San Francisco Market Focus Report September 2018
San Francisco Market Focus Report September 2018
 
San Francisco Market Focus Report December 2018
San Francisco Market Focus Report December 2018San Francisco Market Focus Report December 2018
San Francisco Market Focus Report December 2018
 
San Francisco Market Focus June 2017
San Francisco Market Focus June 2017San Francisco Market Focus June 2017
San Francisco Market Focus June 2017
 
June 2018 Gallatin Valley Market Reports
June 2018 Gallatin Valley Market ReportsJune 2018 Gallatin Valley Market Reports
June 2018 Gallatin Valley Market Reports
 
Real Estate Weekly Market Activity Report
Real Estate Weekly Market Activity ReportReal Estate Weekly Market Activity Report
Real Estate Weekly Market Activity Report
 
July 2018 Gallatin Valley Market Reports
July 2018 Gallatin Valley Market ReportsJuly 2018 Gallatin Valley Market Reports
July 2018 Gallatin Valley Market Reports
 
San Francisco Market Focus May 2017
San Francisco Market Focus May 2017San Francisco Market Focus May 2017
San Francisco Market Focus May 2017
 
San Francisco Market Focus March 2017
San Francisco Market Focus March 2017San Francisco Market Focus March 2017
San Francisco Market Focus March 2017
 
San Francisco Market Focus July 2017
San Francisco Market Focus July 2017San Francisco Market Focus July 2017
San Francisco Market Focus July 2017
 
January 2014 Greater Boston Real Estate Market Trends Report
January 2014 Greater Boston Real Estate Market Trends ReportJanuary 2014 Greater Boston Real Estate Market Trends Report
January 2014 Greater Boston Real Estate Market Trends Report
 

More from Arthur Prescott

Historic Sales Trend Of Lake Lanier Waterfront Homes For The Past 5 Years.pdf
Historic Sales Trend Of Lake Lanier Waterfront Homes For The Past 5 Years.pdfHistoric Sales Trend Of Lake Lanier Waterfront Homes For The Past 5 Years.pdf
Historic Sales Trend Of Lake Lanier Waterfront Homes For The Past 5 Years.pdfArthur Prescott
 
Lake Lanier Waterfront Home Sales Comparison 1st Quarter 2023
Lake Lanier Waterfront Home Sales Comparison 1st Quarter 2023 Lake Lanier Waterfront Home Sales Comparison 1st Quarter 2023
Lake Lanier Waterfront Home Sales Comparison 1st Quarter 2023 Arthur Prescott
 
Georgia Real Estate Market Trends February 2022
Georgia Real Estate Market Trends February 2022Georgia Real Estate Market Trends February 2022
Georgia Real Estate Market Trends February 2022Arthur Prescott
 
Lake Lanier Home Sales Analysis For 2021
Lake Lanier Home Sales Analysis For 2021Lake Lanier Home Sales Analysis For 2021
Lake Lanier Home Sales Analysis For 2021Arthur Prescott
 
Historic Sales Price Trend Of Lake Lanier Waterfront Homes For The Past 5 Years!
Historic Sales Price Trend Of Lake Lanier Waterfront Homes For The Past 5 Years!Historic Sales Price Trend Of Lake Lanier Waterfront Homes For The Past 5 Years!
Historic Sales Price Trend Of Lake Lanier Waterfront Homes For The Past 5 Years!Arthur Prescott
 
Sales Price vs. List Price Ratios For Lake Lanier Waterfront Homes
Sales Price vs. List Price Ratios For Lake Lanier Waterfront HomesSales Price vs. List Price Ratios For Lake Lanier Waterfront Homes
Sales Price vs. List Price Ratios For Lake Lanier Waterfront HomesArthur Prescott
 
Lake Lanier Home Sales Analysis September 2021
Lake Lanier Home Sales Analysis September 2021Lake Lanier Home Sales Analysis September 2021
Lake Lanier Home Sales Analysis September 2021Arthur Prescott
 
Lake Lanier Home Sales Analysis August 2021
Lake Lanier Home Sales Analysis August 2021Lake Lanier Home Sales Analysis August 2021
Lake Lanier Home Sales Analysis August 2021Arthur Prescott
 
Lake Lanier Home Sales Analysis June 2021
Lake Lanier Home Sales Analysis June 2021Lake Lanier Home Sales Analysis June 2021
Lake Lanier Home Sales Analysis June 2021Arthur Prescott
 
Lake Lanier Home Sales Analysis February 2021
Lake Lanier Home Sales Analysis February 2021Lake Lanier Home Sales Analysis February 2021
Lake Lanier Home Sales Analysis February 2021Arthur Prescott
 
Lake Lanier Home Sales Analysis January 2021
Lake Lanier Home Sales Analysis January 2021Lake Lanier Home Sales Analysis January 2021
Lake Lanier Home Sales Analysis January 2021Arthur Prescott
 
Lake Lanier Home Sales Analysis November 2020
Lake Lanier Home Sales Analysis November 2020Lake Lanier Home Sales Analysis November 2020
Lake Lanier Home Sales Analysis November 2020Arthur Prescott
 
Lake Lanier Waterfront Home Sales YTD 2020 Versus YTD 2019
Lake Lanier Waterfront Home Sales YTD 2020 Versus YTD 2019Lake Lanier Waterfront Home Sales YTD 2020 Versus YTD 2019
Lake Lanier Waterfront Home Sales YTD 2020 Versus YTD 2019Arthur Prescott
 
Lake Lanier Waterfront Home Sales Trends Quarter 1 2020
Lake Lanier Waterfront Home Sales Trends Quarter 1 2020Lake Lanier Waterfront Home Sales Trends Quarter 1 2020
Lake Lanier Waterfront Home Sales Trends Quarter 1 2020Arthur Prescott
 
Lake Lanier Homes Sales Analysis January 2020
Lake Lanier Homes Sales Analysis January 2020Lake Lanier Homes Sales Analysis January 2020
Lake Lanier Homes Sales Analysis January 2020Arthur Prescott
 
Lake Lanier Waterfront Home Sales By Year For The Past 10 Years
Lake Lanier Waterfront Home Sales By Year For The Past 10 YearsLake Lanier Waterfront Home Sales By Year For The Past 10 Years
Lake Lanier Waterfront Home Sales By Year For The Past 10 YearsArthur Prescott
 
Historic Average Sales Price Trend Of Lake Lanier Homes
Historic Average Sales Price Trend Of Lake Lanier HomesHistoric Average Sales Price Trend Of Lake Lanier Homes
Historic Average Sales Price Trend Of Lake Lanier HomesArthur Prescott
 
Lake Lanier Homes Sales Analysis August 2019
Lake Lanier Homes Sales Analysis August 2019Lake Lanier Homes Sales Analysis August 2019
Lake Lanier Homes Sales Analysis August 2019Arthur Prescott
 
Lake Lanier Home Sales Analysis April 2019
Lake Lanier Home Sales Analysis April 2019Lake Lanier Home Sales Analysis April 2019
Lake Lanier Home Sales Analysis April 2019Arthur Prescott
 
Lake Lanier Home Sales Analysis January 2019
Lake Lanier Home Sales Analysis January 2019Lake Lanier Home Sales Analysis January 2019
Lake Lanier Home Sales Analysis January 2019Arthur Prescott
 

More from Arthur Prescott (20)

Historic Sales Trend Of Lake Lanier Waterfront Homes For The Past 5 Years.pdf
Historic Sales Trend Of Lake Lanier Waterfront Homes For The Past 5 Years.pdfHistoric Sales Trend Of Lake Lanier Waterfront Homes For The Past 5 Years.pdf
Historic Sales Trend Of Lake Lanier Waterfront Homes For The Past 5 Years.pdf
 
Lake Lanier Waterfront Home Sales Comparison 1st Quarter 2023
Lake Lanier Waterfront Home Sales Comparison 1st Quarter 2023 Lake Lanier Waterfront Home Sales Comparison 1st Quarter 2023
Lake Lanier Waterfront Home Sales Comparison 1st Quarter 2023
 
Georgia Real Estate Market Trends February 2022
Georgia Real Estate Market Trends February 2022Georgia Real Estate Market Trends February 2022
Georgia Real Estate Market Trends February 2022
 
Lake Lanier Home Sales Analysis For 2021
Lake Lanier Home Sales Analysis For 2021Lake Lanier Home Sales Analysis For 2021
Lake Lanier Home Sales Analysis For 2021
 
Historic Sales Price Trend Of Lake Lanier Waterfront Homes For The Past 5 Years!
Historic Sales Price Trend Of Lake Lanier Waterfront Homes For The Past 5 Years!Historic Sales Price Trend Of Lake Lanier Waterfront Homes For The Past 5 Years!
Historic Sales Price Trend Of Lake Lanier Waterfront Homes For The Past 5 Years!
 
Sales Price vs. List Price Ratios For Lake Lanier Waterfront Homes
Sales Price vs. List Price Ratios For Lake Lanier Waterfront HomesSales Price vs. List Price Ratios For Lake Lanier Waterfront Homes
Sales Price vs. List Price Ratios For Lake Lanier Waterfront Homes
 
Lake Lanier Home Sales Analysis September 2021
Lake Lanier Home Sales Analysis September 2021Lake Lanier Home Sales Analysis September 2021
Lake Lanier Home Sales Analysis September 2021
 
Lake Lanier Home Sales Analysis August 2021
Lake Lanier Home Sales Analysis August 2021Lake Lanier Home Sales Analysis August 2021
Lake Lanier Home Sales Analysis August 2021
 
Lake Lanier Home Sales Analysis June 2021
Lake Lanier Home Sales Analysis June 2021Lake Lanier Home Sales Analysis June 2021
Lake Lanier Home Sales Analysis June 2021
 
Lake Lanier Home Sales Analysis February 2021
Lake Lanier Home Sales Analysis February 2021Lake Lanier Home Sales Analysis February 2021
Lake Lanier Home Sales Analysis February 2021
 
Lake Lanier Home Sales Analysis January 2021
Lake Lanier Home Sales Analysis January 2021Lake Lanier Home Sales Analysis January 2021
Lake Lanier Home Sales Analysis January 2021
 
Lake Lanier Home Sales Analysis November 2020
Lake Lanier Home Sales Analysis November 2020Lake Lanier Home Sales Analysis November 2020
Lake Lanier Home Sales Analysis November 2020
 
Lake Lanier Waterfront Home Sales YTD 2020 Versus YTD 2019
Lake Lanier Waterfront Home Sales YTD 2020 Versus YTD 2019Lake Lanier Waterfront Home Sales YTD 2020 Versus YTD 2019
Lake Lanier Waterfront Home Sales YTD 2020 Versus YTD 2019
 
Lake Lanier Waterfront Home Sales Trends Quarter 1 2020
Lake Lanier Waterfront Home Sales Trends Quarter 1 2020Lake Lanier Waterfront Home Sales Trends Quarter 1 2020
Lake Lanier Waterfront Home Sales Trends Quarter 1 2020
 
Lake Lanier Homes Sales Analysis January 2020
Lake Lanier Homes Sales Analysis January 2020Lake Lanier Homes Sales Analysis January 2020
Lake Lanier Homes Sales Analysis January 2020
 
Lake Lanier Waterfront Home Sales By Year For The Past 10 Years
Lake Lanier Waterfront Home Sales By Year For The Past 10 YearsLake Lanier Waterfront Home Sales By Year For The Past 10 Years
Lake Lanier Waterfront Home Sales By Year For The Past 10 Years
 
Historic Average Sales Price Trend Of Lake Lanier Homes
Historic Average Sales Price Trend Of Lake Lanier HomesHistoric Average Sales Price Trend Of Lake Lanier Homes
Historic Average Sales Price Trend Of Lake Lanier Homes
 
Lake Lanier Homes Sales Analysis August 2019
Lake Lanier Homes Sales Analysis August 2019Lake Lanier Homes Sales Analysis August 2019
Lake Lanier Homes Sales Analysis August 2019
 
Lake Lanier Home Sales Analysis April 2019
Lake Lanier Home Sales Analysis April 2019Lake Lanier Home Sales Analysis April 2019
Lake Lanier Home Sales Analysis April 2019
 
Lake Lanier Home Sales Analysis January 2019
Lake Lanier Home Sales Analysis January 2019Lake Lanier Home Sales Analysis January 2019
Lake Lanier Home Sales Analysis January 2019
 

Recently uploaded

Call Girl In Delhi West Patel Nagar @8447779280乂EscorT ServiCe In Delhi NCR
Call Girl In Delhi West Patel Nagar @8447779280乂EscorT ServiCe In Delhi NCRCall Girl In Delhi West Patel Nagar @8447779280乂EscorT ServiCe In Delhi NCR
Call Girl In Delhi West Patel Nagar @8447779280乂EscorT ServiCe In Delhi NCRasmaqueen5
 
Low Rate ✨➥9582086666▻✨Call Girls In Gurgaon Sector 37 (Gurgaon)
Low Rate ✨➥9582086666▻✨Call Girls In Gurgaon Sector 37 (Gurgaon)Low Rate ✨➥9582086666▻✨Call Girls In Gurgaon Sector 37 (Gurgaon)
Low Rate ✨➥9582086666▻✨Call Girls In Gurgaon Sector 37 (Gurgaon)delhi24hrs1
 
Yedi Mavi TOBB Zeytinburnu - Listing Turkey
Yedi Mavi TOBB Zeytinburnu - Listing TurkeyYedi Mavi TOBB Zeytinburnu - Listing Turkey
Yedi Mavi TOBB Zeytinburnu - Listing TurkeyListing Turkey
 
Lodha Baner Flat In Pune E-Brochure.pdf
Lodha Baner Flat In Pune  E-Brochure.pdfLodha Baner Flat In Pune  E-Brochure.pdf
Lodha Baner Flat In Pune E-Brochure.pdfManishSaxena95
 
Nyati Elite NIBM Road Pune E Brochure.pdf
Nyati Elite NIBM Road Pune E Brochure.pdfNyati Elite NIBM Road Pune E Brochure.pdf
Nyati Elite NIBM Road Pune E Brochure.pdfabbu831446
 
Ganga Platinum Kharadi Pune brochure.pdf
Ganga Platinum Kharadi Pune brochure.pdfGanga Platinum Kharadi Pune brochure.pdf
Ganga Platinum Kharadi Pune brochure.pdfsabhyara24
 
Cheap Rate ✨➥9711108085▻✨Call Girls In Connaught Place (Delhi)
Cheap Rate ✨➥9711108085▻✨Call Girls In Connaught Place (Delhi)Cheap Rate ✨➥9711108085▻✨Call Girls In Connaught Place (Delhi)
Cheap Rate ✨➥9711108085▻✨Call Girls In Connaught Place (Delhi)delhi24hrs1
 
Parksville 96 Surrey Floor Plans May 2024
Parksville 96 Surrey Floor Plans May 2024Parksville 96 Surrey Floor Plans May 2024
Parksville 96 Surrey Floor Plans May 2024VickyAulakh1
 
Rohan Harita Tathawade Pune Brochure.pdf
Rohan Harita Tathawade Pune Brochure.pdfRohan Harita Tathawade Pune Brochure.pdf
Rohan Harita Tathawade Pune Brochure.pdfabbu831446
 
Prestige Sancoale Goa Residneces Brochure.pdf
Prestige Sancoale Goa Residneces Brochure.pdfPrestige Sancoale Goa Residneces Brochure.pdf
Prestige Sancoale Goa Residneces Brochure.pdfkishor21012022
 
Best Interior Design Services in Haldwani
Best Interior Design Services in HaldwaniBest Interior Design Services in Haldwani
Best Interior Design Services in HaldwaniGeomatrix
 
Housing Price Regulation Thesis Defense by Slidesgo.pptx
Housing Price Regulation Thesis Defense by Slidesgo.pptxHousing Price Regulation Thesis Defense by Slidesgo.pptx
Housing Price Regulation Thesis Defense by Slidesgo.pptxcosmo-soil
 
The Superior Living Batisehir - Listing Turkey
The Superior Living Batisehir - Listing TurkeyThe Superior Living Batisehir - Listing Turkey
The Superior Living Batisehir - Listing TurkeyListing Turkey
 
Explore Dual Citizenship in Africa | Citizenship Benefits & Requirements
Explore Dual Citizenship in Africa | Citizenship Benefits & RequirementsExplore Dual Citizenship in Africa | Citizenship Benefits & Requirements
Explore Dual Citizenship in Africa | Citizenship Benefits & Requirementsmarketingkingdomofku
 
A Guide to NRI Investment in India for Real Estate
A Guide to NRI Investment in India for Real EstateA Guide to NRI Investment in India for Real Estate
A Guide to NRI Investment in India for Real EstateSunil Agrawal and Associates
 
Jaipur Escorts 🥰 8617370543 Call Girls Offer VIP Hot Girls
Jaipur Escorts 🥰 8617370543 Call Girls Offer VIP Hot GirlsJaipur Escorts 🥰 8617370543 Call Girls Offer VIP Hot Girls
Jaipur Escorts 🥰 8617370543 Call Girls Offer VIP Hot GirlsDeepika Singh
 
Vanam At Purva Soukhyam Guduvanchery.pdf.pdf
Vanam At Purva Soukhyam Guduvanchery.pdf.pdfVanam At Purva Soukhyam Guduvanchery.pdf.pdf
Vanam At Purva Soukhyam Guduvanchery.pdf.pdfkratirudram
 
Call Girls in Maurice Nagar (Delhi) ꧁8447779280꧂ Female Escorts Service in De...
Call Girls in Maurice Nagar (Delhi) ꧁8447779280꧂ Female Escorts Service in De...Call Girls in Maurice Nagar (Delhi) ꧁8447779280꧂ Female Escorts Service in De...
Call Girls in Maurice Nagar (Delhi) ꧁8447779280꧂ Female Escorts Service in De...asmaqueen5
 
Low Rate ✨➥9582086666▻✨Call Girls In Gurgaon Sector 23 (Gurgaon)
Low Rate ✨➥9582086666▻✨Call Girls In Gurgaon Sector 23 (Gurgaon)Low Rate ✨➥9582086666▻✨Call Girls In Gurgaon Sector 23 (Gurgaon)
Low Rate ✨➥9582086666▻✨Call Girls In Gurgaon Sector 23 (Gurgaon)delhi24hrs1
 
Call girls in Shakti Nagar Delhi~8447779280°/=@/ Short 1500 Night 6000}ESCORT...
Call girls in Shakti Nagar Delhi~8447779280°/=@/ Short 1500 Night 6000}ESCORT...Call girls in Shakti Nagar Delhi~8447779280°/=@/ Short 1500 Night 6000}ESCORT...
Call girls in Shakti Nagar Delhi~8447779280°/=@/ Short 1500 Night 6000}ESCORT...asmaqueen5
 

Recently uploaded (20)

Call Girl In Delhi West Patel Nagar @8447779280乂EscorT ServiCe In Delhi NCR
Call Girl In Delhi West Patel Nagar @8447779280乂EscorT ServiCe In Delhi NCRCall Girl In Delhi West Patel Nagar @8447779280乂EscorT ServiCe In Delhi NCR
Call Girl In Delhi West Patel Nagar @8447779280乂EscorT ServiCe In Delhi NCR
 
Low Rate ✨➥9582086666▻✨Call Girls In Gurgaon Sector 37 (Gurgaon)
Low Rate ✨➥9582086666▻✨Call Girls In Gurgaon Sector 37 (Gurgaon)Low Rate ✨➥9582086666▻✨Call Girls In Gurgaon Sector 37 (Gurgaon)
Low Rate ✨➥9582086666▻✨Call Girls In Gurgaon Sector 37 (Gurgaon)
 
Yedi Mavi TOBB Zeytinburnu - Listing Turkey
Yedi Mavi TOBB Zeytinburnu - Listing TurkeyYedi Mavi TOBB Zeytinburnu - Listing Turkey
Yedi Mavi TOBB Zeytinburnu - Listing Turkey
 
Lodha Baner Flat In Pune E-Brochure.pdf
Lodha Baner Flat In Pune  E-Brochure.pdfLodha Baner Flat In Pune  E-Brochure.pdf
Lodha Baner Flat In Pune E-Brochure.pdf
 
Nyati Elite NIBM Road Pune E Brochure.pdf
Nyati Elite NIBM Road Pune E Brochure.pdfNyati Elite NIBM Road Pune E Brochure.pdf
Nyati Elite NIBM Road Pune E Brochure.pdf
 
Ganga Platinum Kharadi Pune brochure.pdf
Ganga Platinum Kharadi Pune brochure.pdfGanga Platinum Kharadi Pune brochure.pdf
Ganga Platinum Kharadi Pune brochure.pdf
 
Cheap Rate ✨➥9711108085▻✨Call Girls In Connaught Place (Delhi)
Cheap Rate ✨➥9711108085▻✨Call Girls In Connaught Place (Delhi)Cheap Rate ✨➥9711108085▻✨Call Girls In Connaught Place (Delhi)
Cheap Rate ✨➥9711108085▻✨Call Girls In Connaught Place (Delhi)
 
Parksville 96 Surrey Floor Plans May 2024
Parksville 96 Surrey Floor Plans May 2024Parksville 96 Surrey Floor Plans May 2024
Parksville 96 Surrey Floor Plans May 2024
 
Rohan Harita Tathawade Pune Brochure.pdf
Rohan Harita Tathawade Pune Brochure.pdfRohan Harita Tathawade Pune Brochure.pdf
Rohan Harita Tathawade Pune Brochure.pdf
 
Prestige Sancoale Goa Residneces Brochure.pdf
Prestige Sancoale Goa Residneces Brochure.pdfPrestige Sancoale Goa Residneces Brochure.pdf
Prestige Sancoale Goa Residneces Brochure.pdf
 
Best Interior Design Services in Haldwani
Best Interior Design Services in HaldwaniBest Interior Design Services in Haldwani
Best Interior Design Services in Haldwani
 
Housing Price Regulation Thesis Defense by Slidesgo.pptx
Housing Price Regulation Thesis Defense by Slidesgo.pptxHousing Price Regulation Thesis Defense by Slidesgo.pptx
Housing Price Regulation Thesis Defense by Slidesgo.pptx
 
The Superior Living Batisehir - Listing Turkey
The Superior Living Batisehir - Listing TurkeyThe Superior Living Batisehir - Listing Turkey
The Superior Living Batisehir - Listing Turkey
 
Explore Dual Citizenship in Africa | Citizenship Benefits & Requirements
Explore Dual Citizenship in Africa | Citizenship Benefits & RequirementsExplore Dual Citizenship in Africa | Citizenship Benefits & Requirements
Explore Dual Citizenship in Africa | Citizenship Benefits & Requirements
 
A Guide to NRI Investment in India for Real Estate
A Guide to NRI Investment in India for Real EstateA Guide to NRI Investment in India for Real Estate
A Guide to NRI Investment in India for Real Estate
 
Jaipur Escorts 🥰 8617370543 Call Girls Offer VIP Hot Girls
Jaipur Escorts 🥰 8617370543 Call Girls Offer VIP Hot GirlsJaipur Escorts 🥰 8617370543 Call Girls Offer VIP Hot Girls
Jaipur Escorts 🥰 8617370543 Call Girls Offer VIP Hot Girls
 
Vanam At Purva Soukhyam Guduvanchery.pdf.pdf
Vanam At Purva Soukhyam Guduvanchery.pdf.pdfVanam At Purva Soukhyam Guduvanchery.pdf.pdf
Vanam At Purva Soukhyam Guduvanchery.pdf.pdf
 
Call Girls in Maurice Nagar (Delhi) ꧁8447779280꧂ Female Escorts Service in De...
Call Girls in Maurice Nagar (Delhi) ꧁8447779280꧂ Female Escorts Service in De...Call Girls in Maurice Nagar (Delhi) ꧁8447779280꧂ Female Escorts Service in De...
Call Girls in Maurice Nagar (Delhi) ꧁8447779280꧂ Female Escorts Service in De...
 
Low Rate ✨➥9582086666▻✨Call Girls In Gurgaon Sector 23 (Gurgaon)
Low Rate ✨➥9582086666▻✨Call Girls In Gurgaon Sector 23 (Gurgaon)Low Rate ✨➥9582086666▻✨Call Girls In Gurgaon Sector 23 (Gurgaon)
Low Rate ✨➥9582086666▻✨Call Girls In Gurgaon Sector 23 (Gurgaon)
 
Call girls in Shakti Nagar Delhi~8447779280°/=@/ Short 1500 Night 6000}ESCORT...
Call girls in Shakti Nagar Delhi~8447779280°/=@/ Short 1500 Night 6000}ESCORT...Call girls in Shakti Nagar Delhi~8447779280°/=@/ Short 1500 Night 6000}ESCORT...
Call girls in Shakti Nagar Delhi~8447779280°/=@/ Short 1500 Night 6000}ESCORT...
 

Georgia Housing Market Snapshot: June 2018. Courtesy of the Georgia Association Of Realtors

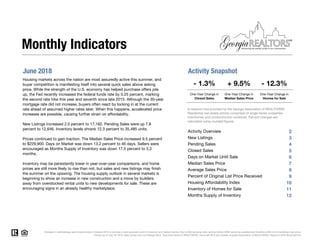
  • 1. June 2018 Activity Snapshot One-Year Change in One-Year Change in Closed Sales Median Sales Price 2 3 4 5 6 7 8 9 10 11 12 Changes in methodology were implemented in October 2012 to provide a more accurate count of inventory and related metrics. Due to MLS purging rules, activity before 2008 cannot be updated and therefore shifts in the trendlines may occur. Current as of July 16, 2018. Data comes from the Georgia MLS, Columbus Board of REALTORS®, Savannah MLS and Greater Augusta Association of REALTORS®. Report © 2018 ShowingTime. Pending Sales Closed Sales Days on Market Until Sale Median Sales Price Average Sales Price Percent of Original List Price Received Housing markets across the nation are most assuredly active this summer, and buyer competition is manifesting itself into several quick sales above asking price. While the strength of the U.S. economy has helped purchase offers pile up, the Fed recently increased the federal funds rate by 0.25 percent, marking the second rate hike this year and seventh since late 2015. Although the 30-year mortgage rate did not increase, buyers often react by locking in at the current rate ahead of assumed higher rates later. When this happens, accelerated price increases are possible, causing further strain on affordability. New Listings increased 2.0 percent to 17,182. Pending Sales were up 7.8 percent to 12,646. Inventory levels shrank 12.3 percent to 35,485 units. Prices continued to gain traction. The Median Sales Price increased 9.5 percent to $229,900. Days on Market was down 13.2 percent to 46 days. Sellers were encouraged as Months Supply of Inventory was down 17.5 percent to 3.3 months. Inventory may be persistently lower in year-over-year comparisons, and home prices are still more likely to rise than not, but sales and new listings may finish the summer on the upswing. The housing supply outlook in several markets is beginning to show an increase in new construction and a move by builders away from overstocked rental units to new developments for sale. These are encouraging signs in an already healthy marketplace. Homes for Sale A research tool provided by the Georgia Association of REALTORS®. Residential real estate activity comprised of single-family properties, townhomes and condominiums combined. Percent changes are calculated using rounded figures. Activity Overview New Listings Housing Affordability Index Inventory of Homes for Sale Months Supply of Inventory Monthly Indicators - 1.3% + 9.5% - 12.3% One-Year Change in
  • 2. Activity Overview Key Metrics Historical Sparkbars 6-2017 6-2018 Percent Change YTD 2017 YTD 2018 Percent Change Current as of July 16, 2018. Data comes from the Georgia MLS, Columbus Board of REALTORS®, Savannah MLS and Greater Augusta Association of REALTORS®. Report © 2018 ShowingTime. | 2 + 0.8% Housing Affordability Index 186 160 - 14.0% 196 170 - 13.3% Pct. of Orig. Price Received 96.6% 97.4% + 0.8% 96.1% 96.9% -- -- -- Inventory of Homes for Sale 40,478 35,485 - 12.3% -- -- Months Supply of Inventory 4.0 3.3 - 17.5% -- + 9.3% Average Sales Price $255,391 $279,780 + 9.5% $243,154 $262,995 + 8.2% Median Sales Price $210,000 $229,900 + 9.5% $198,900 $217,400 + 3.9% Days on Market Until Sale 53 46 - 13.2% 60 53 - 11.7% Closed Sales 13,161 12,986 - 1.3% 61,384 63,797 Key metrics by report month and for year-to-date (YTD) starting from the first of the year. New Listings 16,852 17,182 + 2.0% 94,385 + 1.3% Pending Sales 11,734 12,646 + 7.8% 67,028 71,152 + 6.2% 93,206 6-2015 6-2016 6-2017 6-2018 6-2015 6-2016 6-2017 6-2018 6-2015 6-2016 6-2017 6-2018 6-2015 6-2016 6-2017 6-2018 6-2015 6-2016 6-2017 6-2018 6-2015 6-2016 6-2017 6-2018 6-2015 6-2016 6-2017 6-2018 6-2015 6-2016 6-2017 6-2018 6-2015 6-2016 6-2017 6-2018 6-2015 6-2016 6-2017 6-2018
  • 3. New Listings Prior Year Percent Change July 2017 15,044 14,418 +4.3% August 2017 15,224 14,526 +4.8% September 2017 12,116 13,472 -10.1% October 2017 13,130 12,356 +6.3% November 2017 11,101 10,137 +9.5% December 2017 8,251 8,130 +1.5% January 2018 12,219 12,713 -3.9% February 2018 13,629 13,422 +1.5% March 2018 17,072 17,567 -2.8% April 2018 16,768 15,566 +7.7% May 2018 17,515 17,086 +2.5% June 2018 17,182 16,852 +2.0% 12-Month Avg 14,104 13,854 +1.8% Historical New Listings by Month Current as of July 16, 2018. Data comes from the Georgia MLS, Columbus Board of REALTORS®, Savannah MLS and Greater Augusta Association of REALTORS®. Report © 2018 ShowingTime. | 3 A count of the properties that have been newly listed on the market in a given month. New Listings 16,976 16,852 17,182 2016 2017 2018 June 6,000 8,000 10,000 12,000 14,000 16,000 18,000 1-2012 1-2013 1-2014 1-2015 1-2016 1-2017 1-2018 91,774 93,206 94,385 2016 2017 2018 Year to Date + 1.3%- 0.7% + 2.0% + 1.6%+ 8.7% + 6.3%
  • 4. Pending Sales Prior Year Percent Change July 2017 11,194 10,250 +9.2% August 2017 11,112 10,274 +8.2% September 2017 8,928 9,224 -3.2% October 2017 10,102 8,759 +15.3% November 2017 8,842 7,784 +13.6% December 2017 7,339 6,815 +7.7% January 2018 9,518 8,755 +8.7% February 2018 10,254 9,991 +2.6% March 2018 12,901 12,613 +2.3% April 2018 12,961 11,699 +10.8% May 2018 12,872 12,236 +5.2% June 2018 12,646 11,734 +7.8% 12-Month Avg 10,722 10,011 +7.1% Historical Pending Sales by Month Current as of July 16, 2018. Data comes from the Georgia MLS, Columbus Board of REALTORS®, Savannah MLS and Greater Augusta Association of REALTORS®. Report © 2018 ShowingTime. | 4 A count of the properties on which offers have been accepted in a given month. Pending Sales 11,438 11,734 12,646 2016 2017 2018 June 4,000 6,000 8,000 10,000 12,000 14,000 1-2012 1-2013 1-2014 1-2015 1-2016 1-2017 1-2018 64,193 67,028 71,152 2016 2017 2018 Year to Date + 6.2%+ 2.6% + 7.8% + 4.4%+ 11.5% + 12.6%
  • 5. Closed Sales Prior Year Percent Change July 2017 11,395 11,148 +2.2% August 2017 11,870 11,299 +5.1% September 2017 10,142 10,091 +0.5% October 2017 9,917 9,128 +8.6% November 2017 9,328 8,567 +8.9% December 2017 9,775 9,229 +5.9% January 2018 7,109 6,615 +7.5% February 2018 8,141 7,524 +8.2% March 2018 11,163 11,356 -1.7% April 2018 11,347 10,265 +10.5% May 2018 13,051 12,463 +4.7% June 2018 12,986 13,161 -1.3% 12-Month Avg 10,519 10,071 +4.4% Historical Closed Sales by Month Current as of July 16, 2018. Data comes from the Georgia MLS, Columbus Board of REALTORS®, Savannah MLS and Greater Augusta Association of REALTORS®. Report © 2018 ShowingTime. | 5 A count of the actual sales that closed in a given month. Closed Sales 12,216 13,161 12,986 2016 2017 2018 June 4,000 6,000 8,000 10,000 12,000 14,000 1-2012 1-2013 1-2014 1-2015 1-2016 1-2017 1-2018 56,946 61,384 63,797 2016 2017 2018 Year to Date + 3.9%+ 7.7% - 1.3% + 7.8%+ 10.6% + 11.2%
  • 6. Days on Market Until Sale Prior Year Percent Change July 2017 50 55 -9.1% August 2017 51 55 -7.3% September 2017 53 58 -8.6% October 2017 55 59 -6.8% November 2017 57 60 -5.0% December 2017 61 65 -6.2% January 2018 63 68 -7.4% February 2018 62 72 -13.9% March 2018 58 66 -12.1% April 2018 52 59 -11.9% May 2018 48 53 -9.4% June 2018 46 53 -13.2% 12-Month Avg* 54 59 -8.5% Historical Days on Market Until Sale by Month Current as of July 16, 2018. Data comes from the Georgia MLS, Columbus Board of REALTORS®, Savannah MLS and Greater Augusta Association of REALTORS®. Report © 2018 ShowingTime. | 6 Average number of days between when a property is listed and when an offer is accepted in a given month. Days on Market * Average Days on Market of all properties from July 2017 through June 2018. This is not the average of the individual figures above. 58 53 46 2016 2017 2018 June 40 50 60 70 80 90 100 110 1-2012 1-2013 1-2014 1-2015 1-2016 1-2017 1-2018 69 60 53 2016 2017 2018 Year to Date - 11.7%- 8.6% - 13.2% - 13.0%- 15.9% - 11.5%
  • 7. Median Sales Price Prior Year Percent Change July 2017 $208,500 $200,000 +4.3% August 2017 $203,000 $190,000 +6.8% September 2017 $199,000 $187,000 +6.4% October 2017 $200,000 $186,252 +7.4% November 2017 $198,900 $188,000 +5.8% December 2017 $205,775 $188,990 +8.9% January 2018 $196,625 $182,900 +7.5% February 2018 $203,995 $186,500 +9.4% March 2018 $215,000 $195,000 +10.3% April 2018 $219,000 $200,000 +9.5% May 2018 $224,000 $204,000 +9.8% June 2018 $229,900 $210,000 +9.5% 12-Month Med* $210,000 $194,900 +7.7% Historical Median Sales Price by Month Current as of July 16, 2018. Data comes from the Georgia MLS, Columbus Board of REALTORS®, Savannah MLS and Greater Augusta Association of REALTORS®. Report © 2018 ShowingTime. | 7 Point at which half of the sales sold for more and half sold for less, not accounting for seller concessions, in a given month. Median Sales Price * Median Sales Price of all properties from July 2017 through June 2018. This is not the average of the individual figures above. $198,000 $210,000 $229,900 2016 2017 2018 June $75,000 $100,000 $125,000 $150,000 $175,000 $200,000 $225,000 $250,000 1-2012 1-2013 1-2014 1-2015 1-2016 1-2017 1-2018 $185,000 $198,900 $217,400 2016 2017 2018 Year to Date + 9.3%+ 6.1% + 9.5% + 7.5%+ 5.9% + 5.7%
  • 8. Average Sales Price Prior Year Percent Change July 2017 $256,257 $245,160 +4.5% August 2017 $246,639 $236,454 +4.3% September 2017 $242,225 $229,889 +5.4% October 2017 $245,282 $232,438 +5.5% November 2017 $245,024 $234,672 +4.4% December 2017 $248,982 $234,221 +6.3% January 2018 $240,541 $225,237 +6.8% February 2018 $244,267 $225,312 +8.4% March 2018 $259,071 $238,889 +8.4% April 2018 $264,645 $246,846 +7.2% May 2018 $272,120 $251,347 +8.3% June 2018 $279,780 $255,391 +9.5% 12-Month Avg* $255,376 $239,513 +6.6% Historical Average Sales Price by Month Current as of July 16, 2018. Data comes from the Georgia MLS, Columbus Board of REALTORS®, Savannah MLS and Greater Augusta Association of REALTORS®. Report © 2018 ShowingTime. | 8 Average sales price for all closed sales, not accounting for seller concessions, in a given month. Avg. Sales Price * Avg. Sales Price of all properties from July 2017 through June 2018. This is not the average of the individual figures above. $242,606 $255,391 $279,780 2016 2017 2018 June $100,000 $150,000 $200,000 $250,000 $300,000 1-2012 1-2013 1-2014 1-2015 1-2016 1-2017 1-2018 $229,809 $243,154 $262,995 2016 2017 2018 Year to Date + 8.2%+ 5.3% + 9.5% + 5.8%+ 2.1% + 3.9%
  • 9. Percent of Original List Price Received Prior Year Percent Change July 2017 96.4% 96.1% +0.3% August 2017 96.0% 95.6% +0.4% September 2017 96.1% 95.4% +0.7% October 2017 95.7% 95.3% +0.4% November 2017 95.8% 95.1% +0.7% December 2017 95.8% 94.8% +1.1% January 2018 95.6% 95.0% +0.6% February 2018 96.1% 95.3% +0.8% March 2018 96.7% 95.9% +0.8% April 2018 97.2% 96.3% +0.9% May 2018 97.4% 96.7% +0.7% June 2018 97.4% 96.6% +0.8% 12-Month Avg* 96.4% 95.8% +0.6% Historical Percent of Original List Price Received by Month Current as of July 16, 2018. Data comes from the Georgia MLS, Columbus Board of REALTORS®, Savannah MLS and Greater Augusta Association of REALTORS®. Report © 2018 ShowingTime. | 9 Percentage found when dividing a property’s sales price by its original list price, then taking the average for all properties sold in a given month, not accounting for seller concessions. Pct. of Orig. Price Received * Average Pct. of Orig. Price Received for all properties from July 2017 through June 2018. This is not the average of the individual figures above. 96.3% 96.6% 97.4% 2016 2017 2018 June 88% 90% 92% 94% 96% 98% 1-2012 1-2013 1-2014 1-2015 1-2016 1-2017 1-2018 95.5% 96.1% 96.9% 2016 2017 2018 Year to Date + 0.8%+ 0.3% + 0.8% + 0.6%+ 1.0% + 1.1%
  • 10. Housing Affordability Index Prior Year Percent Change July 2017 188 202 -6.9% August 2017 194 213 -8.9% September 2017 198 215 -7.9% October 2017 194 219 -11.4% November 2017 197 206 -4.4% December 2017 188 198 -5.1% January 2018 191 202 -5.4% February 2018 183 204 -10.3% March 2018 173 194 -10.8% April 2018 167 193 -13.5% May 2018 163 191 -14.7% June 2018 160 186 -14.0% 12-Month Avg 183 183 0.0% Historical Housing Affordability Index by Month Current as of July 16, 2018. Data comes from the Georgia MLS, Columbus Board of REALTORS®, Savannah MLS and Greater Augusta Association of REALTORS®. Report © 2018 ShowingTime. | 10 This index measures housing affordability for the region. For example, an index of 120 means the median household income is 120% of what is necessary to qualify for the median-priced home under prevailing interest rates. A higher number means greater affordability. Affordability Index 204 186 160 2016 2017 2018 June 100 200 300 400 500 1-2012 1-2013 1-2014 1-2015 1-2016 1-2017 1-2018 218 196 170 2016 2017 2018 Year to Date - 13.3%- 8.8% - 14.0% - 10.1%- 3.8% - 4.0%
  • 11. Inventory of Homes for Sale Prior Year Percent Change July 2017 40,317 44,192 -8.8% August 2017 39,798 43,727 -9.0% September 2017 38,738 43,235 -10.4% October 2017 37,385 42,154 -11.3% November 2017 35,696 40,289 -11.4% December 2017 32,997 37,277 -11.5% January 2018 31,481 36,448 -13.6% February 2018 31,763 36,451 -12.9% March 2018 32,634 37,657 -13.3% April 2018 33,365 38,036 -12.3% May 2018 34,636 39,162 -11.6% June 2018 35,485 40,478 -12.3% 12-Month Avg 35,358 39,926 -11.4% Historical Inventory of Homes for Sale by Month Current as of July 16, 2018. Data comes from the Georgia MLS, Columbus Board of REALTORS®, Savannah MLS and Greater Augusta Association of REALTORS®. Report © 2018 ShowingTime. | 11 The number of properties available for sale in active status at the end of a given month. Homes for Sale 44,371 40,478 35,485 2016 2017 2018 June 30,000 35,000 40,000 45,000 50,000 1-2012 1-2013 1-2014 1-2015 1-2016 1-2017 1-2018 - 8.8% - 12.3%- 7.2%
  • 12. Months Supply of Inventory Prior Year Percent Change July 2017 4.0 4.6 -13.0% August 2017 3.9 4.5 -13.3% September 2017 3.8 4.5 -15.6% October 2017 3.6 4.3 -16.3% November 2017 3.5 4.1 -14.6% December 2017 3.2 3.8 -15.8% January 2018 3.0 3.7 -18.9% February 2018 3.0 3.7 -18.9% March 2018 3.1 3.8 -18.4% April 2018 3.1 3.8 -18.4% May 2018 3.3 3.9 -15.4% June 2018 3.3 4.0 -17.5% 12-Month Avg 3.4 4.1 -17.1% Historical Months Supply of Inventory by Month Current as of July 16, 2018. Data comes from the Georgia MLS, Columbus Board of REALTORS®, Savannah MLS and Greater Augusta Association of REALTORS®. Report © 2018 ShowingTime. | 12 The inventory of homes for sale at the end of a given month, divided by the average monthly pending sales from the last 12 months. Months Supply * Months Supply for all properties from July 2017 through June 2018. This is not the average of the individual figures above. 4.7 4.0 3.3 2016 2017 2018 June 3.0 4.0 5.0 6.0 7.0 1-2013 1-2014 1-2015 1-2016 1-2017 1-2018 - 14.9% - 17.5%- 17.5%