1. Third Quarter (Q3) Update to the
2015 Outlook: Down, Set, Hut One,
Don’t Hike
If you watch American football (the NFL), play calling has become much
more complicated in recent years with the Denver Broncos’ Peyton
Manning shouting “Omaha” and the New England Patriots’ Tom Brady
shouting “Alpha” as they adjust to the defense with last-second changes
in blocking assignments and pass routes. And so (unlike the situation with
the Canadian economy and the Bank of Canada, where “centralized” interest
rates may face more downward pressure), our friends at the U.S. Federal
Reserve (Fed) seem to be calling an “audible” each time they meet to discuss
whether to raise (hike) short-term interest rates. If their goal, as with Messrs.
Manning and Brady, is to catch the rest of us flat-footed and uncertain as to
the outcome, it surely is working. In the case of the U.S. economy and the
capital markets, however, they are all supposed to be on the same team and
uncertainty is not a formula for winning. The dilemma, reflected in volatile
equity markets, is one of deciding if continuing near-zero rates is a good
thing, borrowing costs stay low and the U.S. dollar (USD) does not continue
to strengthen, or a bad thing, projecting the view that the economy is too
weak to withstand even a smidgeon of an increase.
Yet, when we peer into the playbook containing the various indicators of economic activity in the U.S. (which we in
Canada would still envy right now), it is easy to understand the reluctance to begin the new U.S. chapter just yet.
Unemployment is down substantially, yet labor force participation stats indicate that many are either not looking for work
or are underemployed. The consumer is back to spending on big-ticket items such as autos, and housing starts are
trending up. Businesses still seem to prefer stock buybacks and dividends over spending on capital goods or investing in
new equipment, and productivity gains that soared with the advent of the internet have flattened at an anemic 1.0 percent
lately. With a strong U.S. dollar impacting foreign operations and making U.S. exports more expensive, many companies,
particularly the large multinationals that are a dominant part of the S&P 500®
Index, may see downturns in earnings.
Finally, as China’s growth slows, there are concerns that this will cause a further erosion of sales for many firms.
The good news for investors, although it doesn’t feel quite so, is that with the S&P down 6.4 percent in local terms in
Q3 2015, the U.S. stock market has gone from pretty expensive to reasonably valued. We take little solace from the
fact that in our last quarterly update to our 2015 Investment Outlook we suggested “some downdraft in equities seems
to be consistent with historic norms.”
Canada continues to wrestle with its own economic woes. A newly elected Liberal federal government could provide
some optimism that things will change, but in the absence of a major upswing in global activity, future economic vigour in
Canada may be seen as nothing more than continued “tough slugging” and can only gain a few yards at best. The Bank
of Canada has reduced interest rates several times this year, but these actions will be insufficient on their own to change
the fortunes of Canadians right now.
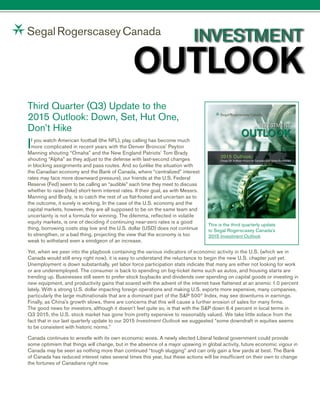
2015 Outlook:
Cheap Oil: A Mixed Picture for Canadian and Global Economies
INVESTMENT
OUTLOOK
This is the third quarterly update
to Segal Rogerscasey Canada’s
2015 Investment Outlook.
2. Q3 Update to 2015 Investment Outlook •Page 2
In Europe, quantitative easing (QE) appears to have become the norm and the European Central Bank has kept
rates hovering around zero for some time now. Despite those best efforts, gross domestic product (GDP) growth
remains around 1.5 percent in real terms, with World Bank projections showing only slight improvements over the
next several years. The substantially cheapened euro and continued low prices for imports of energy and
commodities should serve as a much needed tailwind. The Greek crisis has faded from memory, being replaced
on the front pages by the photos of fleeing residents of Syria now joining displaced people from Sudan, Nigeria
and Afghanistan. While it is difficult to assess the economic impact of this dramatic migration over the long
term, for now there is likely a price to be paid at least in terms of distraction and disruption. In southern Europe,
often the gateway for water-based escape routes, a population already reeling from austerity and high
unemployment may become even more dissatisfied with political leadership. It does somewhat amaze us that
yields on an aggregate of Spanish and Italian bonds are about 100 basis points (bps) lower than a shorter-
duration aggregate of U.S. securities. Imagine if banks were lending to homebuyers and charging higher rates
for FICO scores above 750 than for those below.
The major story in Asia has become assessing who may be the biggest losers from a slower-growth China. The
Chinese import 32 percent of the world’s integrated circuits, with nearly half of that coming from South Korea and
the rest of Asia. It imports almost 60 percent of the world’s iron ore, with more than 40 percent of that coming
from Australia and 26 percent from an already beleaguered Brazil. It bears noting, however, that the 10-plus
percent GDP growth rates from China pre the Global Financial Crisis were simply unsustainable over the long
term. Even a low projection of 6 percent growth, given that China’s $10.4 trillion economy is the second largest in
the world, provides an enormous amount of buying power — economically and politically. There is no doubt that
any quarterback/Fed member must assess where China is on the field prior to snapping the ball. China was a
major factor in the growth in the Canadian economy, and now it is moving more to the sidelines.
Japan is one of the largest exporters to China, thus China’s slowdown will not help Prime Minster Shinzo Abe’s
arrows hit their mark of a vibrant growing economy. GDP actually shrank in Q2 2015, and declining industrial
production suggests that a recession is possible. In addition, the Core Consumer Price Index (CPI) fell in August,
despite a pledge by the Bank of Japan to pierce the 2 percent level by fall of 2016. It is unclear whether recent
social reforms intended to raise the low birth rate and support elder care will have much effect. Although equities
are somewhat cheap, economic momentum appears to be slowing and Abe’s future may be less secure.
For Russia and Brazil, the approach to a return to growth begins with austerity represented by high interest rates
and a lack of government stimulus. Success requires patience, which appears in short supply in Brazil, and one
wonders how long the combination of low growth, high inflation and continued government scandals will be
tolerated by the electorate. In other emerging markets, results diverge greatly between those impacted by China
or by the decline in oil and other commodity prices. India is little affected by the former and is helped by the latter,
with the World Bank projected real GDP growth rates just shy of 8 percent in the next several years. Other
potential economic bright spots are Mexico, benefiting from the return to growth in the U.S., and Thailand,
assisted by a weakened currency and government spending on infrastructure to support an economy that had
been in decline recently.
Unlike American football, there is no 40-second clock and the Fed can hike whenever it chooses while carefully
reading the many players on the macroeconomic field. The Bank of Canada will need to watch the Fed closely, as
any move will also affect Canadian prosperity and the Canadian dollar. Perhaps the objective is simply to have us
forget about a rate increase and get on with our lives recognizing that 25 bps here or there on the federal funds
rate is just not that important anyway. After all, it is just one game and it is a long season.
3. Q3 Update to 2015 Investment Outlook •Page 3
Updated Equity, Interest Rate and Fixed-Income Graphs
Segal Rogerscasey Canada has updated many of the equity, interest rate and fixed-income graphs used to
formulate our asset class views for the 2015 Investment Outlook. Those graphs, which now include data as
of September 30, 2015, are available on the following webpage: http://www.segalgroup.ca/media/2250/
q3-outlook-update-appendix.pdf
The material contained herein is intended as a general market commentary for distribution to investment professionals
and fiduciaries only. This is not intended for retail use or distribution. It is for informational purposes only and is intended
solely for the person to whom it is delivered by Segal Rogerscasey Canada. Opinions expressed herein are those of the
Segal Rogerscasey Investment Committee as of October 2015, when this update to the 2015 Investment Outlook was
written. These opinions are subject to change and may differ from those of other Segal Rogerscasey Canada employees
and affiliates. Past performance is not a guarantee of future results. Not all investment ideas referenced are suitable for
all investors and each investor must consider their specific goals, objectives, liquidity, and risk preferences in making
decisions regarding the applicability of these ideas to their own circumstances. Additional disclosures are provided at
the bottom of the last page of this publication.
4. Q3 Update to 2015 Investment Outlook •Page 4
Summary of Outlook Views
Segal Rogerscasey Canada has updated our summary of outlook views. The tables on the following pages are
designed to provide a straightforward snapshot of our observations on key macroeconomic factors in the most
important countries driving markets and on the direction of specific asset classes. Shaded cells in the tables
indicate changes or additional information since the publication of the Q2 update to our 2015 Investment Outlook
in August 2015.
Key for Segal Rogerscasey Canada’s Outlook Views
Very Positive
Positive
Neutral, Trending Up
Neutral
Neutral, Trending Down
Negative
Very Negative
5. Global Macroeconomic Outlook Signals
Developed Markets: Canada
Q3 Update to 2015 Investment Outlook •Page 5
In this section, key macroeconomic factors are listed in green-shaded cells across the top of each table. The
arrows in these tables indicate our view of each factor’s impact on economic growth, except “Direction of Interest
Rates,” for which the arrows indicate rate movement.
Monetary Fiscal Currency Credit
Direction
of Interest
Rates
Level of
Inflation
Momentum
Market
Valuations
Canada Fair
The Canadian economy is expected to contract further as commodities continue to languish, and there is no suitable economic
sector to offset the decline in resource demand. The Canadian dollar has fallen dramatically in 2015 (almost 16 percent
against the USD year-to-date), but this does not necessarily translate to additional exports that would help sectors such
as manufacturing buoy the Canadian economy. The Bank of Canada has cut interest rates by 50 bps this year.
Canada recently held a federal election that ousted the Progressive Conservative Party (which had been in place for more
than 10 years) and has installed the Liberal Party. As part of its platform, the Liberal Party communicated that it will run
deficits and use the funds to help consumers and build infrastructure, with the idea that such investment will produce
“dividends down the road” that will balance the budget several years hence. Canada likely requires the global economy to
improve substantially to ease its economic woes, and any new political direction will not fill the vacuum, even though new
government spending could help alleviate some of the current economic stresses.
Layoffs in Canada continue, and the unemployment rate has been edging up. Canada had been highly reliant on Asia for
resource demand and on the U.S. for energy demand, but these foreign engines have become less of a positive stimulative
factor for Canadian economic growth in recent years. China’s growth has been weakening, and the U.S. has progressed
further towards energy independence.
Continued on the next page.
6. Q3 Update to 2015 Investment Outlook •Page 6
Developed Markets: U.S., Eurozone, Japan and U.K.
Monetary Fiscal Currency Credit
Direction
of Interest
Rates
Level of
Inflation
Momentum
Market
Valuations
U.S. Fair
The markets coughed loudly after a long period without so much as a cold. The Energy, Materials and Healthcare sectors
got the worst of it, but all were down somewhat. Uncertainty reigned as the Fed declined to act to “normalize” rates, the
China slowdown and market volatility raised concerns about global growth, and a stronger USD began to impact many
U.S. companies. The positives from low unemployment, strong balance sheets and a recovering housing market were
offset by those factors as well as issues with capital goods spending, labor force participation and wage growth.
Eurozone Fair
Despite lower energy and commodity costs as well as near-zero rates and substantial quantitative easing, the eurozone’s
growth remains anemic at best. The crisis in Greece, while not behind us, has abated somewhat with the population
begrudgingly supporting an austerity approach to go with a bailout. Inflation remains close to zero and unemployment,
while declining, is still above 10 percent overall. The euro has depreciated 19 percent since May 2015 versus the USD.
Japan Cheap
Arrows continue to be notched and shot by Abe and the Bank of Japan, but with limited impact. Wage growth has ticked
up slightly and unemployment is quite low. Real GDP growth looks better by some measures (year-over-year percentage
change) and appears to be shrinking by others (annualized). Regardless, growth is stubborn, despite the cheaper yen and
less expensive energy. Japan exports a substantial amount to a slowing China.
U.K. Fair
Unemployment is at a seven-year low and the employment rate, at 73.6 percent, is the highest recorded in more than
30 years. Worker earnings are rising slightly faster than expected, but with inflation near zero (and slightly below), it appears
the largely anticipated rate increase from the Bank of England may wait a while longer. After peaking at over 57 in April of
2014, the Purchasing Managers’ Index has drifted slowly down to about 51, nearing a deceleration indicator for the sector.
7. Q3 Update to 2015 Investment Outlook •Page 7
Emerging Markets
Monetary Fiscal Currency Credit
Direction
of Interest
Rates
Level of
Inflation
Momentum
Market
Valuations
China Cheap
A somewhat lower yuan, a drop in bank reserve requirements and lower policy rates seem to be the People’s Bank of
China’s answer to European Central Bank President Mario Draghi’s “anything it takes” statement. Some foreign-exchange
reserves have also been applied, but the pantry still has an enormous supply if needed. Domestic consumption is reported
to be contributing more to GDP growth, with investment taking a back seat lately. In USD terms, imports to China dropped
more than 20 percent in September 2015 from a year earlier. The Shanghai Stock Exchange is off 34 percent from its
2015 high, but is still 44 percent above levels from one year ago.
Brazil Fair
Unemployment is at five-year highs, and currency relative to the USD is at historic lows. Central bank policy rates are in the
14 percent range, and sovereign debt was downgraded in September. Inflation is soaring, while President Dilma Rousseff’s
popularity plummets. And, while the stock market has declined substantially, equities still do not appear to be cheap.
Russia
Really
Cheap
The recession has continued and worsened. The World Bank projected a decline in real GDP of 3.8 percent versus an
earlier predicted decline of 2.7 percent. Sanctions by the European Council have been extended to 2016, foreign direct
investment has largely dried up, and weakened currency is pushing up inflation. Wages and income continue to deteriorate,
but equity price-earnings (P/E) ratios are quite low relative to 10-year averages.
India High
Prime Minister Narendra Modi’s reforms seem to be working now with more rate easing paired with an improved tax policy
and approach to encouraging foreign direct investment. Manufacturing output continues to expand, and consumers are
starting to spend. GDP growth projections are in the mid-7 percent to 8 percent range. Rural versus urban management
continues to be a challenge, but the rising tide can lift many boats.
Other
Emerging
Fair
A slowing China and a stronger USD will have significantly differing impacts on the rest of the emerging market world, with
winners and losers in growth and in markets. Lower commodity prices, particularly of oil, will exacerbate these differences.
Momentum seems to be more negative in general, but GDP growth is strengthening in places like Indonesia and
Bangladesh. A very mixed bag overall.
8. Q3 Update to 2015 Investment Outlook •Page 8
Asset Class Signals
Equities Absolute Relative to U.S. Equity Comments
U.S. N/A
Volatility likely to continue. Slight bias to small caps
versus large caps. No growth/value bias.
Non-U.S. Developed
USD may strengthen more if/when rates rise — consider
approach to hedging. Support active management.
Emerging
Local currency concerns versus the USD. Support
active management.
Equities
Fixed Income
Fixed Income Absolute Relative to U.S. Core Comments
U.S. Core N/A
Short rates eventually rise slowly and modestly, but a
flat yield curve.
Non-U.S. Core Currency concerns continue. QE priced in.
Emerging Market
Debt (EMD) (Own
Local Currency)
Currency concerns. Divergence in bank policies.
Like global diversification — be active.
Local EMD
(USD Denominated)
USD stays strong — modest appreciation.
Prefer active management.
High Yield Stay higher quality.
Bank Loans As with High Yield.
Treasury Inflation-
Protected Securities
And for inflation hedge. Note: long end impacted by
rising rates.
Structured Credit/
Middle Market
Favorable on structured debt and direct lending.
Neutral on distressed — be selective.
Long Bonds
Appropriate for hedging. Rate rise impact, but cheap
protection in some equity correction environments.
Municipals
Attractive relative yields may serve as buffer if rates rise.
Spreads to 10-year yield high, but not record-breaking.
Debt service as percentage of expenditures increasing.
In this section, arrows indicate our views on the direction of the asset classes listed in the left column of each table.