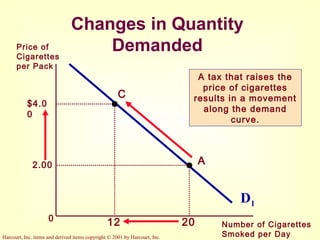
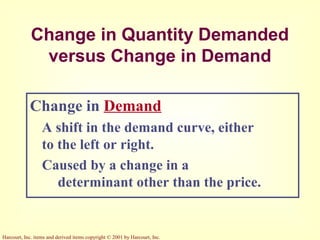
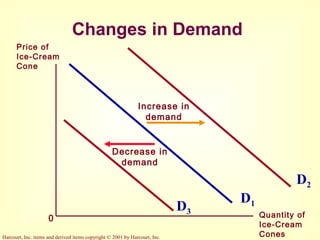
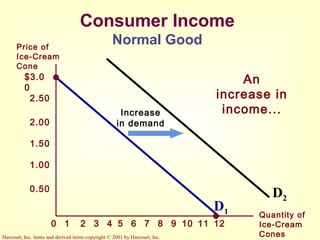
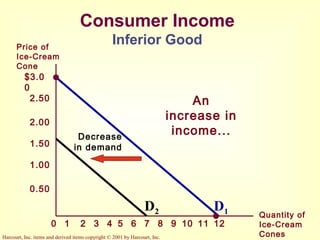
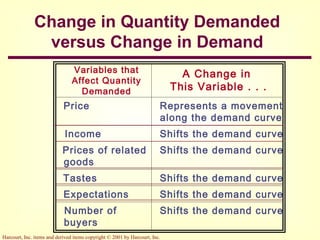
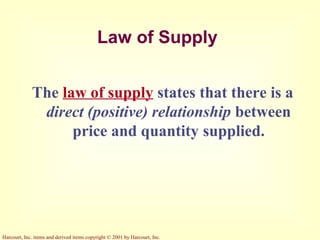
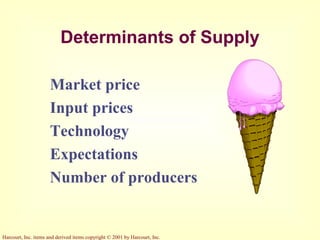
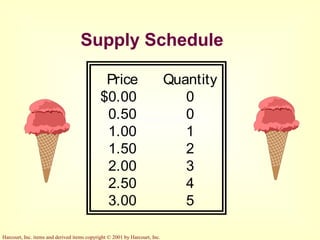
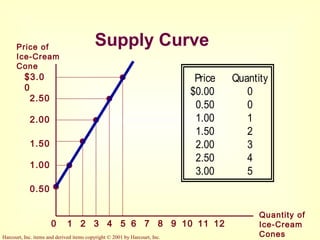
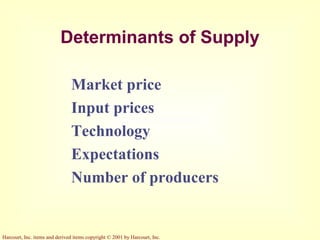
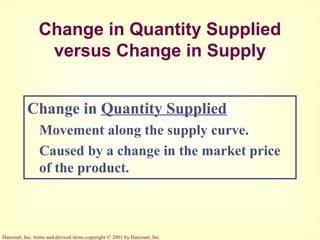
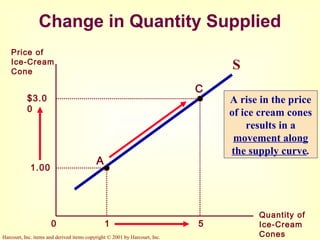
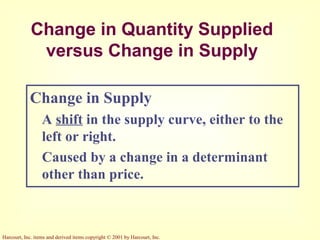
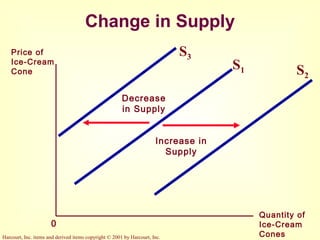
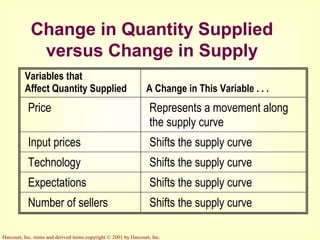
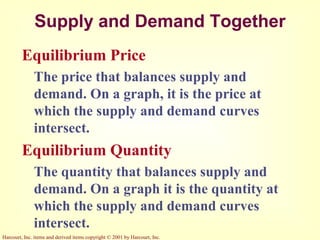
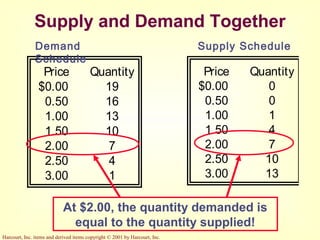
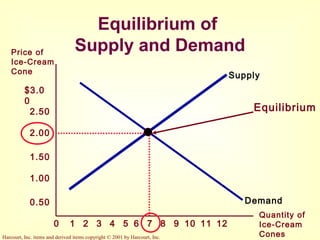
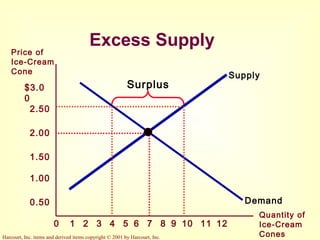
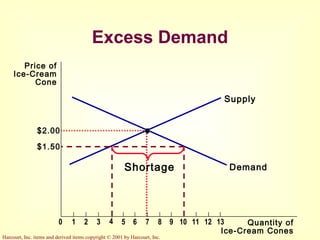
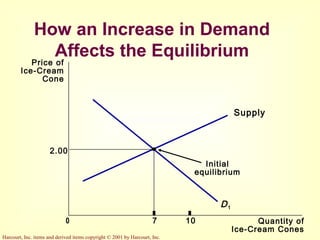
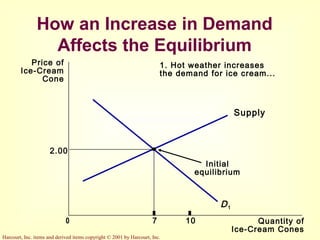
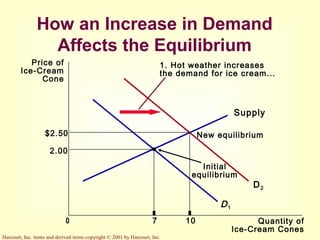
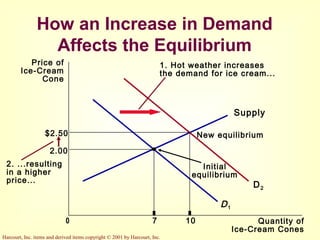
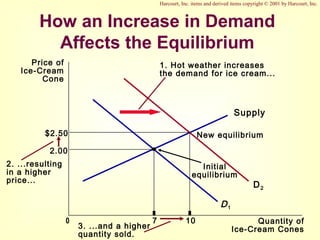
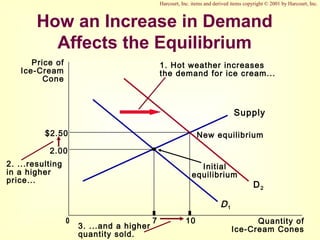
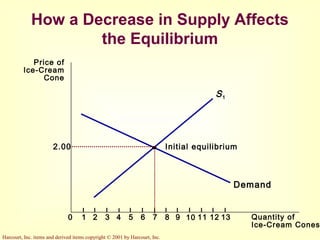
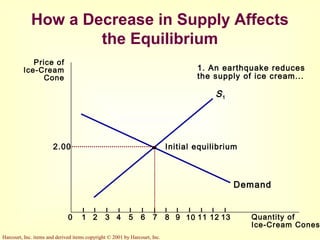
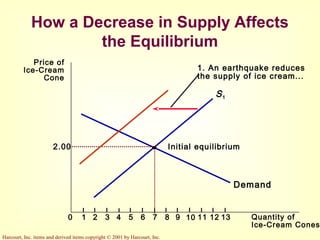
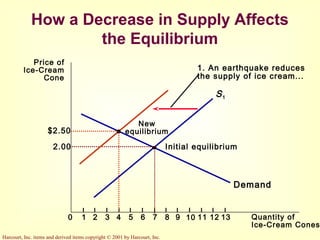
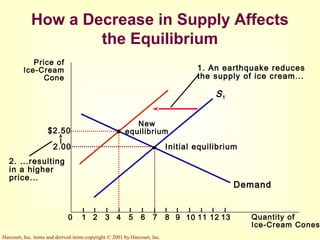
The Market Forces of
Supply and Demand
Chapter 4
Copyright © 2001 by Harcourt, Inc.
All rights reserved. Requests for permission to make copies of any part of
the
work should be mailed to:
Permissions Department, Harcourt College Publishers,
Harcourt, Inc. items and derived items copyright © 2001 by Harcourt, Inc.
The Market Forces of
Supply and Demand
Supply and demand are the two words
that economists use most often.
Supply and demand are the forces that
make market economies work.
Modern microeconomics is about
supply, demand, and market
equilibrium.
Harcourt, Inc. items and derived items copyright © 2001 by Harcourt, Inc.
Markets
A market is a group of buyers and
sellers of a particular good or service.
The terms supply and demand refer
to the behavior of people . . . as they
interact with one another in markets.
Harcourt, Inc. items and derived items copyright © 2001 by Harcourt, Inc.
Markets
Buyers determine demand.
Sellers determine supply.
Harcourt, Inc. items and derived items copyright © 2001 by Harcourt, Inc.
Market Type:
A Competitive Market
A competitive market is a market. . .
…with many buyers and sellers.
…that is not controlled by any one person.
…in which a narrow range of prices are
established that buyers and sellers act upon.
Harcourt, Inc. items and derived items copyright © 2001 by Harcourt, Inc.
Competition:
Perfect and Otherwise
Products are the same
Numerous buyers and sellers so that each
has no influence over price
Buyers and Sellers are price takers
Perfect Competition
Harcourt, Inc. items and derived items copyright © 2001 by Harcourt, Inc.
Competition:
Perfect and Otherwise
Monopoly
One seller, and seller controls price
Oligopoly
Few sellers
Not always aggressive competition
Harcourt, Inc. items and derived items copyright © 2001 by Harcourt, Inc.
Competition:
Perfect and Otherwise
Monopolistic Competition
Many sellers
Slightly differentiated products
Each seller may set price for its own
product
Harcourt, Inc. items and derived items copyright © 2001 by Harcourt, Inc.
Demand
Quantity demanded
is the amount
of a good that buyers are
willing and able
to purchase.
Harcourt, Inc. items and derived items copyright © 2001 by Harcourt, Inc.
Law of Demand
The law of demand states
that there is an inverse
relationship between price
and quantity demanded.
Harcourt, Inc. items and derived items copyright © 2001 by Harcourt, Inc.
Demand Schedule
The demand schedule is a table
that shows the relationship
between the price of the good
and the quantity demanded.
Harcourt, Inc. items and derived items copyright © 2001 by Harcourt, Inc.
Demand Schedule
Price Quantity
$0.00 12
0.50 10
1.00 8
1.50 6
2.00 4
2.50 2
3.00 0
Harcourt, Inc. items and derived items copyright © 2001 by Harcourt, Inc.
Determinants of Demand
Market price
Consumer income
Prices of related goods
Tastes
Expectations
Harcourt, Inc. items and derived items copyright © 2001 by Harcourt, Inc.
Demand Curve
The demand curve is the downward-
sloping line relating price to quantity
demanded.
Harcourt, Inc. items and derived items copyright © 2001 by Harcourt, Inc.
Demand Curve
$3.0
0
2.50
2.00
1.50
1.00
0.50
21 3 4 5 6 7 8 9 10 1211
Price of
Ice-Cream
Cone
Quantity of
Ice-Cream
Cones
0
Price Quantity
$0.00 12
0.50 10
1.00 8
1.50 6
2.00 4
2.50 2
3.00 0
Harcourt, Inc. items and derived items copyright © 2001 by Harcourt, Inc.
Ceteris Paribus
Ceteris paribus is a Latin phrase that
means all variables other than the
ones being studied are assumed to be
constant. Literally, ceteris paribus
means “other things being equal.”
The demand curve slopes downward
because, ceteris paribus, lower prices
imply a greater quantity demanded!
Harcourt, Inc. items and derived items copyright © 2001 by Harcourt, Inc.
Market Demand
Market demand refers to the sum of
all individual demands for a
particular good or service.
Graphically, individual demand
curves are summed horizontally to
obtain the market demand curve.
Harcourt, Inc. items and derived items copyright © 2001 by Harcourt, Inc.
Determinants of Demand
Market price
Consumer income
Prices of related goods
Tastes
Expectations
Harcourt, Inc. items and derived items copyright © 2001 by Harcourt, Inc.
Change in Quantity Demanded
versus Change in Demand
Change in Quantity Demanded
Movement along the demand curve.
Caused by a change in the price of
the product.
Harcourt, Inc. items and derived items copyright © 2001 by Harcourt, Inc.
Changes in Quantity
Demanded
0
D1
Price of
Cigarettes
per Pack
Number of Cigarettes
Smoked per Day
A tax that raises the
price of cigarettes
results in a movement
along the demand
curve.
A
C
20
2.00
$4.0
0
12
Harcourt, Inc. items and derived items copyright © 2001 by Harcourt, Inc.
Change in Quantity Demanded
versus Change in Demand
Change in Demand
A shift in the demand curve, either
to the left or right.
Caused by a change in a
determinant other than the price.
Harcourt, Inc. items and derived items copyright © 2001 by Harcourt, Inc.
Changes in Demand
0
D1
Price of
Ice-Cream
Cone
Quantity of
Ice-Cream
Cones
D3
D2
Increase in
demand
Decrease in
demand
Harcourt, Inc. items and derived items copyright © 2001 by Harcourt, Inc.
Consumer Income
As income increases the demand
for a normal good will increase.
As income increases the demand
for an inferior good will decrease.
Harcourt, Inc. items and derived items copyright © 2001 by Harcourt, Inc.
Consumer Income
Normal Good
$3.0
0
2.50
2.00
1.50
1.00
0.50
21 3 4 5 6 7 8 9 10 1211
Price of
Ice-Cream
Cone
Quantity of
Ice-Cream
Cones
0
Increase
in demand
An
increase in
income...
D1
D2
Harcourt, Inc. items and derived items copyright © 2001 by Harcourt, Inc.
Consumer Income
Inferior Good
$3.0
0
2.50
2.00
1.50
1.00
0.50
21 3 4 5 6 7 8 9 10 1211
Price of
Ice-Cream
Cone
Quantity of
Ice-Cream
Cones
0
Decrease
in demand
An
increase in
income...
D1D2
Harcourt, Inc. items and derived items copyright © 2001 by Harcourt, Inc.
Prices of Related Goods
Substitutes & Complements
When a fall in the price of one good
reduces the demand for another good,
the two goods are called substitutes.
When a fall in the price of one good
increases the demand for another
good, the two goods are called
complements.
Harcourt, Inc. items and derived items copyright © 2001 by Harcourt, Inc.
Change in Quantity Demanded
versus Change in Demand
Variables that
Affect Quantity
Demanded
A Change in
This Variable . . .
Price Represents a movement
along the demand curve
Income Shifts the demand curve
Prices of related
goods
Shifts the demand curve
Tastes Shifts the demand curve
Expectations Shifts the demand curve
Number of
buyers
Shifts the demand curve
Harcourt, Inc. items and derived items copyright © 2001 by Harcourt, Inc.
Supply
Quantity supplied is the amount of a
good that sellers are willing and able
to sell.
Harcourt, Inc. items and derived items copyright © 2001 by Harcourt, Inc.
Law of Supply
The law of supply states that there is a
direct (positive) relationship between
price and quantity supplied.
Harcourt, Inc. items and derived items copyright © 2001 by Harcourt, Inc.
Determinants of Supply
Market price
Input prices
Technology
Expectations
Number of producers
Harcourt, Inc. items and derived items copyright © 2001 by Harcourt, Inc.
Supply Schedule
The supply schedule is a table that
shows the relationship between the
price of the good and the quantity
supplied.
Harcourt, Inc. items and derived items copyright © 2001 by Harcourt, Inc.
Supply Schedule
Price Quantity
$0.00 0
0.50 0
1.00 1
1.50 2
2.00 3
2.50 4
3.00 5
Harcourt, Inc. items and derived items copyright © 2001 by Harcourt, Inc.
Supply Curve
The supply curve is the upward-
sloping line relating price to quantity
supplied.
Harcourt, Inc. items and derived items copyright © 2001 by Harcourt, Inc.
Supply Curve
$3.0
0
2.50
2.00
1.50
1.00
0.50
21 3 4 5 6 7 8 9 10 1211
Price of
Ice-Cream
Cone
Quantity of
Ice-Cream
Cones
0
Price Quantity
$0.00 0
0.50 0
1.00 1
1.50 2
2.00 3
2.50 4
3.00 5
Harcourt, Inc. items and derived items copyright © 2001 by Harcourt, Inc.
Market Supply
Market supply refers to the sum of
all individual supplies for all sellers
of a particular good or service.
Graphically, individual supply
curves are summed horizontally to
obtain the market supply curve.
Harcourt, Inc. items and derived items copyright © 2001 by Harcourt, Inc.
Determinants of Supply
Market price
Input prices
Technology
Expectations
Number of producers
Harcourt, Inc. items and derived items copyright © 2001 by Harcourt, Inc.
Change in Quantity Supplied
versus Change in Supply
Change in Quantity Supplied
Movement along the supply curve.
Caused by a change in the market price
of the product.
Harcourt, Inc. items and derived items copyright © 2001 by Harcourt, Inc.
Change in Quantity Supplied
1 5
Price of
Ice-Cream
Cone
Quantity of
Ice-Cream
Cones
0
S
1.00
A
C
$3.0
0
A rise in the price
of ice cream cones
results in a
movement along
the supply curve.
Harcourt, Inc. items and derived items copyright © 2001 by Harcourt, Inc.
Change in Quantity Supplied
versus Change in Supply
Change in Supply
A shift in the supply curve, either to the
left or right.
Caused by a change in a determinant
other than price.
Harcourt, Inc. items and derived items copyright © 2001 by Harcourt, Inc.
Change in Supply
Price of
Ice-Cream
Cone
Quantity of
Ice-Cream
Cones
0
S1 S2
S3
Increase in
Supply
Decrease
in Supply
Harcourt, Inc. items and derived items copyright © 2001 by Harcourt, Inc.
Change in Quantity Supplied
versus Change in Supply
Variables that
Affect Quantity Supplied A Change in This Variable . . .
Price Represents a movement along
the supply curve
Input prices Shifts the supply curve
Technology Shifts the supply curve
Expectations Shifts the supply curve
Number of sellers Shifts the supply curve
Harcourt, Inc. items and derived items copyright © 2001 by Harcourt, Inc.
Supply and Demand Together
Equilibrium Price
The price that balances supply and
demand. On a graph, it is the price at
which the supply and demand curves
intersect.
Equilibrium Quantity
The quantity that balances supply and
demand. On a graph it is the quantity at
which the supply and demand curves
intersect.
Harcourt, Inc. items and derived items copyright © 2001 by Harcourt, Inc.
Supply and Demand Together
Price Quantity
$0.00 0
0.50 0
1.00 1
1.50 4
2.00 7
2.50 10
3.00 13
Price Quantity
$0.00 19
0.50 16
1.00 13
1.50 10
2.00 7
2.50 4
3.00 1
Demand
Schedule
Supply Schedule
At $2.00, the quantity demanded is
equal to the quantity supplied!
Harcourt, Inc. items and derived items copyright © 2001 by Harcourt, Inc.
Supply
Demand
Price of
Ice-Cream
Cone
Quantity of
Ice-Cream
Cones
Equilibrium of
Supply and Demand
21 3 4 5 6 7 8 9 10 12110
$3.0
0
2.50
2.00
1.50
1.00
0.50
Equilibrium
Harcourt, Inc. items and derived items copyright © 2001 by Harcourt, Inc.
Price of
Ice-Cream
Cone
Quantity of
Ice-Cream
Cones
21 3 4 5 6 7 8 9 10 12110
$3.0
0
2.50
2.00
1.50
1.00
0.50
Supply
Demand
Surplus
Excess Supply
Harcourt, Inc. items and derived items copyright © 2001 by Harcourt, Inc.
Surplus
When the price is above the equilibrium
price, the quantity supplied exceeds the
quantity demanded. There is excess supply
or a surplus. Suppliers will lower the price
to increase sales, thereby moving toward
equilibrium.
Harcourt, Inc. items and derived items copyright © 2001 by Harcourt, Inc.
Excess Demand
Quantity of
Ice-Cream Cones
Price of
Ice-Cream
Cone
$2.00
0 1 2 3 4 5 6 7 8 9 10 11 12 13
Supply
Demand
$1.50
Shortage
Harcourt, Inc. items and derived items copyright © 2001 by Harcourt, Inc.
Shortage
When the price is below the equilibrium
price, the quantity demanded exceeds the
quantity supplied. There is excess demand
or a shortage. Suppliers will raise the price
due to too many buyers chasing too few
goods, thereby moving toward equilibrium.
Harcourt, Inc. items and derived items copyright © 2001 by Harcourt, Inc.
Three Steps To Analyzing
Changes in Equilibrium
Decide whether the event shifts the
supply or demand curve (or both).
Decide whether the curve(s) shift(s) to
the left or to the right.
Examine how the shift affects
equilibrium price and quantity.
How an Increase in Demand
Affects the Equilibrium
Price of
Ice-Cream
Cone
2.00
0 7 Quantity of
Ice-Cream Cones
Supply
Initial
equilibrium
D1
1. Hot weather increases
the demand for ice cream...
D2
2. ...resulting
in a higher
price...
$2.50
10
3. ...and a higher
quantity sold.
New equilibrium
Harcourt, Inc. items and derived items copyright © 2001 by Harcourt, Inc.
Shifts in Curves versus
Movements along Curves
A shift in the supply curve is called a
change in supply.
A movement along a fixed supply curve is
called a change in quantity supplied.
A shift in the demand curve is called a
change in demand.
A movement along a fixed demand curve is
called a change in quantity demanded.
Harcourt, Inc. items and derived items copyright © 2001 by Harcourt, Inc.
S2
How a Decrease in Supply Affects
the Equilibrium
Price of
Ice-Cream
Cone
2.00
0 1 2 3 4 7 8 9 11 12 Quantity of
Ice-Cream Cones
13
Demand
Initial equilibrium
S1
10
1. An earthquake reduces
the supply of ice cream...
New
equilibrium
2. ...resulting
in a higher
price...
$2.50
3. ...and a lower
quantity sold.
Harcourt, Inc. items and derived items copyright © 2001 by Harcourt, Inc.
What Happens to Price and Quantity
When Supply or Demand Shifts?
No Change
I n Supply
An I ncrease
I n Supply
A Decrease
I n Supply
No Change
I n Demand
P same
Q same
P down
Q up
P up
Q down
An I ncrease
I n Demand
P up
Q up
P ambiguous
Q up
P up
Q ambiguous
A Decrease
I n Demand
P down
Q down
P down
Q ambiguous
P ambiguous
Q down
Harcourt, Inc. items and derived items copyright © 2001 by Harcourt, Inc.
Summary
Economists use the model of supply
and demand to analyze competitive
markets.
The demand curve shows how the
quantity of a good depends upon the
price.
Harcourt, Inc. items and derived items copyright © 2001 by Harcourt, Inc.
Summary
According to the law of demand, as
the price of a good rises, the quantity
demanded falls.
In addition to price, other
determinants of quantity demanded
include income, tastes, expectations,
and the prices of complements and
substitutes.
Harcourt, Inc. items and derived items copyright © 2001 by Harcourt, Inc.
Summary
The supply curve shows how the
quantity of a good supplied depends
upon the price.
According to the law of supply, as
the price of a good rises, the quantity
supplied rises.
Harcourt, Inc. items and derived items copyright © 2001 by Harcourt, Inc.
Summary
In addition to price, other
determinants of quantity supplied
include input prices, technology, and
expectations.
Market equilibrium is determined
by the intersection of the supply and
demand curves.
Harcourt, Inc. items and derived items copyright © 2001 by Harcourt, Inc.
Summary
Supply and demand together
determine the prices of the
economy’s goods and services.
In market economies, prices are the
signals that guide the allocation of
resources.
Harcourt, Inc. items and derived items copyright © 2001 by Harcourt, Inc.
Graphical
Review
Harcourt, Inc. items and derived items copyright © 2001 by Harcourt, Inc.
How an Increase in Demand
Affects the EquilibriumPrice of
Ice-Cream
Cone
2.00
0 7 10 Quantity of
Ice-Cream Cones
Supply
Initial
equilibrium
D1
Harcourt, Inc. items and derived items copyright © 2001 by Harcourt, Inc.
How an Increase in Demand
Affects the Equilibrium
Price of
Ice-Cream
Cone
2.00
0 7 10 Quantity of
Ice-Cream Cones
Supply
Initial
equilibrium
D1
1. Hot weather increases
the demand for ice cream...
Harcourt, Inc. items and derived items copyright © 2001 by Harcourt, Inc.
How an Increase in Demand
Affects the Equilibrium
Price of
Ice-Cream
Cone
2.00
0 7 10 Quantity of
Ice-Cream Cones
Supply
Initial
equilibrium
D1
1. Hot weather increases
the demand for ice cream...
D2
New equilibrium$2.50
Harcourt, Inc. items and derived items copyright © 2001 by Harcourt, Inc.
How an Increase in Demand
Affects the Equilibrium
Price of
Ice-Cream
Cone
2.00
0 7 10 Quantity of
Ice-Cream Cones
Supply
Initial
equilibrium
D1
1. Hot weather increases
the demand for ice cream...
D2
New equilibrium
2. ...resulting
in a higher
price...
$2.50
How an Increase in Demand
Affects the Equilibrium
Price of
Ice-Cream
Cone
2.00
0 7 10 Quantity of
Ice-Cream Cones
Supply
Initial
equilibrium
D1
1. Hot weather increases
the demand for ice cream...
D2
New equilibrium
2. ...resulting
in a higher
price...
$2.50
3. ...and a higher
quantity sold.
Harcourt, Inc. items and derived items copyright © 2001 by Harcourt, Inc.
How an Increase in Demand
Affects the Equilibrium
Price of
Ice-Cream
Cone
2.00
0 7 10 Quantity of
Ice-Cream Cones
Supply
Initial
equilibrium
D1
1. Hot weather increases
the demand for ice cream...
D2
New equilibrium
2. ...resulting
in a higher
price...
$2.50
3. ...and a higher
quantity sold.
Harcourt, Inc. items and derived items copyright © 2001 by Harcourt, Inc.
How a Decrease in Supply Affects
the Equilibrium
Price of
Ice-Cream
Cone
2.00
0 1 2 3 4 5 6 7 8 9 11 12 Quantity of
Ice-Cream Cones
13
Demand
Initial equilibrium
S1
10
Harcourt, Inc. items and derived items copyright © 2001 by Harcourt, Inc.
How a Decrease in Supply Affects
the Equilibrium
Price of
Ice-Cream
Cone
2.00
0 1 2 3 4 5 6 7 8 9 11 12 Quantity of
Ice-Cream Cones
13
Demand
Initial equilibrium
S1
10
1. An earthquake reduces
the supply of ice cream...
Harcourt, Inc. items and derived items copyright © 2001 by Harcourt, Inc.
How a Decrease in Supply Affects
the Equilibrium
Price of
Ice-Cream
Cone
2.00
0 1 2 3 4 5 6 7 8 9 11 12 Quantity of
Ice-Cream Cones
13
Demand
Initial equilibrium
S1
10
1. An earthquake reduces
the supply of ice cream...
Harcourt, Inc. items and derived items copyright © 2001 by Harcourt, Inc.
How a Decrease in Supply Affects
the Equilibrium
Price of
Ice-Cream
Cone
2.00
0 1 2 3 4 5 6 7 8 9 11 12 Quantity of
Ice-Cream Cones
13
Demand
Initial equilibrium
S1
10
1. An earthquake reduces
the supply of ice cream...
New
equilibrium$2.50
2. ...resulting
in a higher
price...
Harcourt, Inc. items and derived items copyright © 2001 by Harcourt, Inc.
How a Decrease in Supply Affects
the Equilibrium
Price of
Ice-Cream
Cone
2.00
0 1 2 3 4 7 8 9 11 12 Quantity of
Ice-Cream Cones
13
Demand
Initial equilibrium
S1
10
1. An earthquake reduces
the supply of ice cream...
New
equilibrium$2.50
2. ...resulting
in a higher
price...
3. ...and a lower
quantity sold.

Market forces supply and demand

  • 1.
    The Market Forcesof Supply and Demand Chapter 4 Copyright © 2001 by Harcourt, Inc. All rights reserved. Requests for permission to make copies of any part of the work should be mailed to: Permissions Department, Harcourt College Publishers,
  • 2.
    Harcourt, Inc. itemsand derived items copyright © 2001 by Harcourt, Inc. The Market Forces of Supply and Demand Supply and demand are the two words that economists use most often. Supply and demand are the forces that make market economies work. Modern microeconomics is about supply, demand, and market equilibrium.
  • 3.
    Harcourt, Inc. itemsand derived items copyright © 2001 by Harcourt, Inc. Markets A market is a group of buyers and sellers of a particular good or service. The terms supply and demand refer to the behavior of people . . . as they interact with one another in markets.
  • 4.
    Harcourt, Inc. itemsand derived items copyright © 2001 by Harcourt, Inc. Markets Buyers determine demand. Sellers determine supply.
  • 5.
    Harcourt, Inc. itemsand derived items copyright © 2001 by Harcourt, Inc. Market Type: A Competitive Market A competitive market is a market. . . …with many buyers and sellers. …that is not controlled by any one person. …in which a narrow range of prices are established that buyers and sellers act upon.
  • 6.
    Harcourt, Inc. itemsand derived items copyright © 2001 by Harcourt, Inc. Competition: Perfect and Otherwise Products are the same Numerous buyers and sellers so that each has no influence over price Buyers and Sellers are price takers Perfect Competition
  • 7.
    Harcourt, Inc. itemsand derived items copyright © 2001 by Harcourt, Inc. Competition: Perfect and Otherwise Monopoly One seller, and seller controls price Oligopoly Few sellers Not always aggressive competition
  • 8.
    Harcourt, Inc. itemsand derived items copyright © 2001 by Harcourt, Inc. Competition: Perfect and Otherwise Monopolistic Competition Many sellers Slightly differentiated products Each seller may set price for its own product
  • 9.
    Harcourt, Inc. itemsand derived items copyright © 2001 by Harcourt, Inc. Demand Quantity demanded is the amount of a good that buyers are willing and able to purchase.
  • 10.
    Harcourt, Inc. itemsand derived items copyright © 2001 by Harcourt, Inc. Law of Demand The law of demand states that there is an inverse relationship between price and quantity demanded.
  • 11.
    Harcourt, Inc. itemsand derived items copyright © 2001 by Harcourt, Inc. Demand Schedule The demand schedule is a table that shows the relationship between the price of the good and the quantity demanded.
  • 12.
    Harcourt, Inc. itemsand derived items copyright © 2001 by Harcourt, Inc. Demand Schedule Price Quantity $0.00 12 0.50 10 1.00 8 1.50 6 2.00 4 2.50 2 3.00 0
  • 13.
    Harcourt, Inc. itemsand derived items copyright © 2001 by Harcourt, Inc. Determinants of Demand Market price Consumer income Prices of related goods Tastes Expectations
  • 14.
    Harcourt, Inc. itemsand derived items copyright © 2001 by Harcourt, Inc. Demand Curve The demand curve is the downward- sloping line relating price to quantity demanded.
  • 15.
    Harcourt, Inc. itemsand derived items copyright © 2001 by Harcourt, Inc. Demand Curve $3.0 0 2.50 2.00 1.50 1.00 0.50 21 3 4 5 6 7 8 9 10 1211 Price of Ice-Cream Cone Quantity of Ice-Cream Cones 0 Price Quantity $0.00 12 0.50 10 1.00 8 1.50 6 2.00 4 2.50 2 3.00 0
  • 16.
    Harcourt, Inc. itemsand derived items copyright © 2001 by Harcourt, Inc. Ceteris Paribus Ceteris paribus is a Latin phrase that means all variables other than the ones being studied are assumed to be constant. Literally, ceteris paribus means “other things being equal.” The demand curve slopes downward because, ceteris paribus, lower prices imply a greater quantity demanded!
  • 17.
    Harcourt, Inc. itemsand derived items copyright © 2001 by Harcourt, Inc. Market Demand Market demand refers to the sum of all individual demands for a particular good or service. Graphically, individual demand curves are summed horizontally to obtain the market demand curve.
  • 18.
    Harcourt, Inc. itemsand derived items copyright © 2001 by Harcourt, Inc. Determinants of Demand Market price Consumer income Prices of related goods Tastes Expectations
  • 19.
    Harcourt, Inc. itemsand derived items copyright © 2001 by Harcourt, Inc. Change in Quantity Demanded versus Change in Demand Change in Quantity Demanded Movement along the demand curve. Caused by a change in the price of the product.
  • 20.
    Harcourt, Inc. itemsand derived items copyright © 2001 by Harcourt, Inc. Changes in Quantity Demanded 0 D1 Price of Cigarettes per Pack Number of Cigarettes Smoked per Day A tax that raises the price of cigarettes results in a movement along the demand curve. A C 20 2.00 $4.0 0 12
  • 21.
    Harcourt, Inc. itemsand derived items copyright © 2001 by Harcourt, Inc. Change in Quantity Demanded versus Change in Demand Change in Demand A shift in the demand curve, either to the left or right. Caused by a change in a determinant other than the price.
  • 22.
    Harcourt, Inc. itemsand derived items copyright © 2001 by Harcourt, Inc. Changes in Demand 0 D1 Price of Ice-Cream Cone Quantity of Ice-Cream Cones D3 D2 Increase in demand Decrease in demand
  • 23.
    Harcourt, Inc. itemsand derived items copyright © 2001 by Harcourt, Inc. Consumer Income As income increases the demand for a normal good will increase. As income increases the demand for an inferior good will decrease.
  • 24.
    Harcourt, Inc. itemsand derived items copyright © 2001 by Harcourt, Inc. Consumer Income Normal Good $3.0 0 2.50 2.00 1.50 1.00 0.50 21 3 4 5 6 7 8 9 10 1211 Price of Ice-Cream Cone Quantity of Ice-Cream Cones 0 Increase in demand An increase in income... D1 D2
  • 25.
    Harcourt, Inc. itemsand derived items copyright © 2001 by Harcourt, Inc. Consumer Income Inferior Good $3.0 0 2.50 2.00 1.50 1.00 0.50 21 3 4 5 6 7 8 9 10 1211 Price of Ice-Cream Cone Quantity of Ice-Cream Cones 0 Decrease in demand An increase in income... D1D2
  • 26.
    Harcourt, Inc. itemsand derived items copyright © 2001 by Harcourt, Inc. Prices of Related Goods Substitutes & Complements When a fall in the price of one good reduces the demand for another good, the two goods are called substitutes. When a fall in the price of one good increases the demand for another good, the two goods are called complements.
  • 27.
    Harcourt, Inc. itemsand derived items copyright © 2001 by Harcourt, Inc. Change in Quantity Demanded versus Change in Demand Variables that Affect Quantity Demanded A Change in This Variable . . . Price Represents a movement along the demand curve Income Shifts the demand curve Prices of related goods Shifts the demand curve Tastes Shifts the demand curve Expectations Shifts the demand curve Number of buyers Shifts the demand curve
  • 28.
    Harcourt, Inc. itemsand derived items copyright © 2001 by Harcourt, Inc. Supply Quantity supplied is the amount of a good that sellers are willing and able to sell.
  • 29.
    Harcourt, Inc. itemsand derived items copyright © 2001 by Harcourt, Inc. Law of Supply The law of supply states that there is a direct (positive) relationship between price and quantity supplied.
  • 30.
    Harcourt, Inc. itemsand derived items copyright © 2001 by Harcourt, Inc. Determinants of Supply Market price Input prices Technology Expectations Number of producers
  • 31.
    Harcourt, Inc. itemsand derived items copyright © 2001 by Harcourt, Inc. Supply Schedule The supply schedule is a table that shows the relationship between the price of the good and the quantity supplied.
  • 32.
    Harcourt, Inc. itemsand derived items copyright © 2001 by Harcourt, Inc. Supply Schedule Price Quantity $0.00 0 0.50 0 1.00 1 1.50 2 2.00 3 2.50 4 3.00 5
  • 33.
    Harcourt, Inc. itemsand derived items copyright © 2001 by Harcourt, Inc. Supply Curve The supply curve is the upward- sloping line relating price to quantity supplied.
  • 34.
    Harcourt, Inc. itemsand derived items copyright © 2001 by Harcourt, Inc. Supply Curve $3.0 0 2.50 2.00 1.50 1.00 0.50 21 3 4 5 6 7 8 9 10 1211 Price of Ice-Cream Cone Quantity of Ice-Cream Cones 0 Price Quantity $0.00 0 0.50 0 1.00 1 1.50 2 2.00 3 2.50 4 3.00 5
  • 35.
    Harcourt, Inc. itemsand derived items copyright © 2001 by Harcourt, Inc. Market Supply Market supply refers to the sum of all individual supplies for all sellers of a particular good or service. Graphically, individual supply curves are summed horizontally to obtain the market supply curve.
  • 36.
    Harcourt, Inc. itemsand derived items copyright © 2001 by Harcourt, Inc. Determinants of Supply Market price Input prices Technology Expectations Number of producers
  • 37.
    Harcourt, Inc. itemsand derived items copyright © 2001 by Harcourt, Inc. Change in Quantity Supplied versus Change in Supply Change in Quantity Supplied Movement along the supply curve. Caused by a change in the market price of the product.
  • 38.
    Harcourt, Inc. itemsand derived items copyright © 2001 by Harcourt, Inc. Change in Quantity Supplied 1 5 Price of Ice-Cream Cone Quantity of Ice-Cream Cones 0 S 1.00 A C $3.0 0 A rise in the price of ice cream cones results in a movement along the supply curve.
  • 39.
    Harcourt, Inc. itemsand derived items copyright © 2001 by Harcourt, Inc. Change in Quantity Supplied versus Change in Supply Change in Supply A shift in the supply curve, either to the left or right. Caused by a change in a determinant other than price.
  • 40.
    Harcourt, Inc. itemsand derived items copyright © 2001 by Harcourt, Inc. Change in Supply Price of Ice-Cream Cone Quantity of Ice-Cream Cones 0 S1 S2 S3 Increase in Supply Decrease in Supply
  • 41.
    Harcourt, Inc. itemsand derived items copyright © 2001 by Harcourt, Inc. Change in Quantity Supplied versus Change in Supply Variables that Affect Quantity Supplied A Change in This Variable . . . Price Represents a movement along the supply curve Input prices Shifts the supply curve Technology Shifts the supply curve Expectations Shifts the supply curve Number of sellers Shifts the supply curve
  • 42.
    Harcourt, Inc. itemsand derived items copyright © 2001 by Harcourt, Inc. Supply and Demand Together Equilibrium Price The price that balances supply and demand. On a graph, it is the price at which the supply and demand curves intersect. Equilibrium Quantity The quantity that balances supply and demand. On a graph it is the quantity at which the supply and demand curves intersect.
  • 43.
    Harcourt, Inc. itemsand derived items copyright © 2001 by Harcourt, Inc. Supply and Demand Together Price Quantity $0.00 0 0.50 0 1.00 1 1.50 4 2.00 7 2.50 10 3.00 13 Price Quantity $0.00 19 0.50 16 1.00 13 1.50 10 2.00 7 2.50 4 3.00 1 Demand Schedule Supply Schedule At $2.00, the quantity demanded is equal to the quantity supplied!
  • 44.
    Harcourt, Inc. itemsand derived items copyright © 2001 by Harcourt, Inc. Supply Demand Price of Ice-Cream Cone Quantity of Ice-Cream Cones Equilibrium of Supply and Demand 21 3 4 5 6 7 8 9 10 12110 $3.0 0 2.50 2.00 1.50 1.00 0.50 Equilibrium
  • 45.
    Harcourt, Inc. itemsand derived items copyright © 2001 by Harcourt, Inc. Price of Ice-Cream Cone Quantity of Ice-Cream Cones 21 3 4 5 6 7 8 9 10 12110 $3.0 0 2.50 2.00 1.50 1.00 0.50 Supply Demand Surplus Excess Supply
  • 46.
    Harcourt, Inc. itemsand derived items copyright © 2001 by Harcourt, Inc. Surplus When the price is above the equilibrium price, the quantity supplied exceeds the quantity demanded. There is excess supply or a surplus. Suppliers will lower the price to increase sales, thereby moving toward equilibrium.
  • 47.
    Harcourt, Inc. itemsand derived items copyright © 2001 by Harcourt, Inc. Excess Demand Quantity of Ice-Cream Cones Price of Ice-Cream Cone $2.00 0 1 2 3 4 5 6 7 8 9 10 11 12 13 Supply Demand $1.50 Shortage
  • 48.
    Harcourt, Inc. itemsand derived items copyright © 2001 by Harcourt, Inc. Shortage When the price is below the equilibrium price, the quantity demanded exceeds the quantity supplied. There is excess demand or a shortage. Suppliers will raise the price due to too many buyers chasing too few goods, thereby moving toward equilibrium.
  • 49.
    Harcourt, Inc. itemsand derived items copyright © 2001 by Harcourt, Inc. Three Steps To Analyzing Changes in Equilibrium Decide whether the event shifts the supply or demand curve (or both). Decide whether the curve(s) shift(s) to the left or to the right. Examine how the shift affects equilibrium price and quantity.
  • 50.
    How an Increasein Demand Affects the Equilibrium Price of Ice-Cream Cone 2.00 0 7 Quantity of Ice-Cream Cones Supply Initial equilibrium D1 1. Hot weather increases the demand for ice cream... D2 2. ...resulting in a higher price... $2.50 10 3. ...and a higher quantity sold. New equilibrium Harcourt, Inc. items and derived items copyright © 2001 by Harcourt, Inc.
  • 51.
    Harcourt, Inc. itemsand derived items copyright © 2001 by Harcourt, Inc. Shifts in Curves versus Movements along Curves A shift in the supply curve is called a change in supply. A movement along a fixed supply curve is called a change in quantity supplied. A shift in the demand curve is called a change in demand. A movement along a fixed demand curve is called a change in quantity demanded.
  • 52.
    Harcourt, Inc. itemsand derived items copyright © 2001 by Harcourt, Inc. S2 How a Decrease in Supply Affects the Equilibrium Price of Ice-Cream Cone 2.00 0 1 2 3 4 7 8 9 11 12 Quantity of Ice-Cream Cones 13 Demand Initial equilibrium S1 10 1. An earthquake reduces the supply of ice cream... New equilibrium 2. ...resulting in a higher price... $2.50 3. ...and a lower quantity sold.
  • 53.
    Harcourt, Inc. itemsand derived items copyright © 2001 by Harcourt, Inc. What Happens to Price and Quantity When Supply or Demand Shifts? No Change I n Supply An I ncrease I n Supply A Decrease I n Supply No Change I n Demand P same Q same P down Q up P up Q down An I ncrease I n Demand P up Q up P ambiguous Q up P up Q ambiguous A Decrease I n Demand P down Q down P down Q ambiguous P ambiguous Q down
  • 54.
    Harcourt, Inc. itemsand derived items copyright © 2001 by Harcourt, Inc. Summary Economists use the model of supply and demand to analyze competitive markets. The demand curve shows how the quantity of a good depends upon the price.
  • 55.
    Harcourt, Inc. itemsand derived items copyright © 2001 by Harcourt, Inc. Summary According to the law of demand, as the price of a good rises, the quantity demanded falls. In addition to price, other determinants of quantity demanded include income, tastes, expectations, and the prices of complements and substitutes.
  • 56.
    Harcourt, Inc. itemsand derived items copyright © 2001 by Harcourt, Inc. Summary The supply curve shows how the quantity of a good supplied depends upon the price. According to the law of supply, as the price of a good rises, the quantity supplied rises.
  • 57.
    Harcourt, Inc. itemsand derived items copyright © 2001 by Harcourt, Inc. Summary In addition to price, other determinants of quantity supplied include input prices, technology, and expectations. Market equilibrium is determined by the intersection of the supply and demand curves.
  • 58.
    Harcourt, Inc. itemsand derived items copyright © 2001 by Harcourt, Inc. Summary Supply and demand together determine the prices of the economy’s goods and services. In market economies, prices are the signals that guide the allocation of resources.
  • 59.
    Harcourt, Inc. itemsand derived items copyright © 2001 by Harcourt, Inc. Graphical Review
  • 60.
    Harcourt, Inc. itemsand derived items copyright © 2001 by Harcourt, Inc. How an Increase in Demand Affects the EquilibriumPrice of Ice-Cream Cone 2.00 0 7 10 Quantity of Ice-Cream Cones Supply Initial equilibrium D1
  • 61.
    Harcourt, Inc. itemsand derived items copyright © 2001 by Harcourt, Inc. How an Increase in Demand Affects the Equilibrium Price of Ice-Cream Cone 2.00 0 7 10 Quantity of Ice-Cream Cones Supply Initial equilibrium D1 1. Hot weather increases the demand for ice cream...
  • 62.
    Harcourt, Inc. itemsand derived items copyright © 2001 by Harcourt, Inc. How an Increase in Demand Affects the Equilibrium Price of Ice-Cream Cone 2.00 0 7 10 Quantity of Ice-Cream Cones Supply Initial equilibrium D1 1. Hot weather increases the demand for ice cream... D2 New equilibrium$2.50
  • 63.
    Harcourt, Inc. itemsand derived items copyright © 2001 by Harcourt, Inc. How an Increase in Demand Affects the Equilibrium Price of Ice-Cream Cone 2.00 0 7 10 Quantity of Ice-Cream Cones Supply Initial equilibrium D1 1. Hot weather increases the demand for ice cream... D2 New equilibrium 2. ...resulting in a higher price... $2.50
  • 64.
    How an Increasein Demand Affects the Equilibrium Price of Ice-Cream Cone 2.00 0 7 10 Quantity of Ice-Cream Cones Supply Initial equilibrium D1 1. Hot weather increases the demand for ice cream... D2 New equilibrium 2. ...resulting in a higher price... $2.50 3. ...and a higher quantity sold. Harcourt, Inc. items and derived items copyright © 2001 by Harcourt, Inc.
  • 65.
    How an Increasein Demand Affects the Equilibrium Price of Ice-Cream Cone 2.00 0 7 10 Quantity of Ice-Cream Cones Supply Initial equilibrium D1 1. Hot weather increases the demand for ice cream... D2 New equilibrium 2. ...resulting in a higher price... $2.50 3. ...and a higher quantity sold. Harcourt, Inc. items and derived items copyright © 2001 by Harcourt, Inc.
  • 66.
    Harcourt, Inc. itemsand derived items copyright © 2001 by Harcourt, Inc. How a Decrease in Supply Affects the Equilibrium Price of Ice-Cream Cone 2.00 0 1 2 3 4 5 6 7 8 9 11 12 Quantity of Ice-Cream Cones 13 Demand Initial equilibrium S1 10
  • 67.
    Harcourt, Inc. itemsand derived items copyright © 2001 by Harcourt, Inc. How a Decrease in Supply Affects the Equilibrium Price of Ice-Cream Cone 2.00 0 1 2 3 4 5 6 7 8 9 11 12 Quantity of Ice-Cream Cones 13 Demand Initial equilibrium S1 10 1. An earthquake reduces the supply of ice cream...
  • 68.
    Harcourt, Inc. itemsand derived items copyright © 2001 by Harcourt, Inc. How a Decrease in Supply Affects the Equilibrium Price of Ice-Cream Cone 2.00 0 1 2 3 4 5 6 7 8 9 11 12 Quantity of Ice-Cream Cones 13 Demand Initial equilibrium S1 10 1. An earthquake reduces the supply of ice cream...
  • 69.
    Harcourt, Inc. itemsand derived items copyright © 2001 by Harcourt, Inc. How a Decrease in Supply Affects the Equilibrium Price of Ice-Cream Cone 2.00 0 1 2 3 4 5 6 7 8 9 11 12 Quantity of Ice-Cream Cones 13 Demand Initial equilibrium S1 10 1. An earthquake reduces the supply of ice cream... New equilibrium$2.50
  • 70.
    Harcourt, Inc. itemsand derived items copyright © 2001 by Harcourt, Inc. How a Decrease in Supply Affects the Equilibrium Price of Ice-Cream Cone 2.00 0 1 2 3 4 5 6 7 8 9 11 12 Quantity of Ice-Cream Cones 13 Demand Initial equilibrium S1 10 1. An earthquake reduces the supply of ice cream... New equilibrium$2.50 2. ...resulting in a higher price...
  • 71.
    Harcourt, Inc. itemsand derived items copyright © 2001 by Harcourt, Inc. How a Decrease in Supply Affects the Equilibrium Price of Ice-Cream Cone 2.00 0 1 2 3 4 7 8 9 11 12 Quantity of Ice-Cream Cones 13 Demand Initial equilibrium S1 10 1. An earthquake reduces the supply of ice cream... New equilibrium$2.50 2. ...resulting in a higher price... 3. ...and a lower quantity sold.