Downloaded 41 times
![Copyright 2018 Severalnines AB
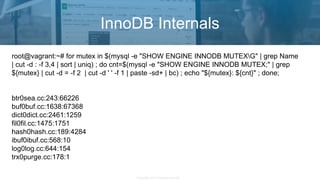
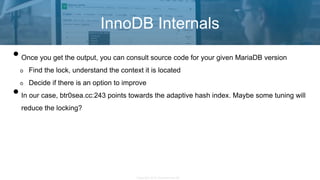
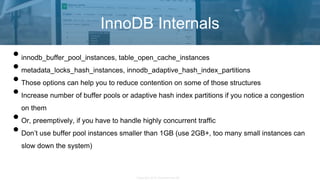
InnoDB Internals
MariaDB [(none)]> select * from performance_schema.events_waits_summary_global_by_event_name WHERE
EVENT_NAME like '%mutex%' and count_star > 0 ORDER BY SUM_TIMER_WAIT DESC LIMIT 10;
+-------------------------------------------+------------+----------------+----------------+----------------+----------------+
| EVENT_NAME | COUNT_STAR | SUM_TIMER_WAIT | MIN_TIMER_WAIT | AVG_TIMER_WAIT | MAX_TIMER_WAIT |
+-------------------------------------------+------------+----------------+----------------+----------------+----------------+
| wait/synch/mutex/sql/THD::LOCK_thd_data | 2508482 | 699876746415 | 17325 | 278740 | 129770289110 |
| wait/synch/mutex/innodb/buf_pool_mutex | 877021 | 357991729095 | 17325 | 408100 | 21343581105 |
| wait/synch/mutex/sql/THD::LOCK_thd_kill | 585288 | 255054289875 | 17325 | 435435 | 62933799005 |
| wait/synch/mutex/sql/LOCK_table_cache | 1170607 | 209109547570 | 17325 | 178255 | 24837530795 |
| wait/synch/mutex/innodb/fil_system_mutex | 625176 | 128177721980 | 17325 | 204820 | 24410468390 |
| wait/synch/mutex/innodb/srv_sys_mutex | 3095 | 32831559145 | 18480 | 10607905 | 31612420455 |
| wait/synch/mutex/innodb/dict_sys_mutex | 405 | 30690657305 | 19635 | 75779165 | 5380793495 |
| wait/synch/mutex/mysys/BITMAP::mutex | 83582 | 19281719380 | 21175 | 230615 | 6739930890 |
| wait/synch/mutex/innodb/srv_threads_mutex | 36193 | 17454819690 | 18480 | 482020 | 9705892735 |
| wait/synch/mutex/innodb/log_sys_mutex | 155877 | 13870954790 | 16170 | 88935 | 4442297475 |
+-------------------------------------------+------------+----------------+----------------+----------------+----------------+
10 rows in set (0.004 sec)
performance_schema=ON
performance-schema-instrument='%=ON'](https://image.slidesharecdn.com/mariadbperformancetuning-181113184212/85/MariaDB-Performance-Tuning-Crash-Course-26-320.jpg)


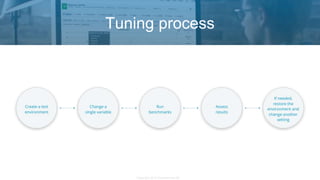
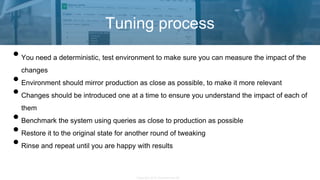
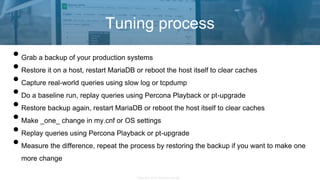
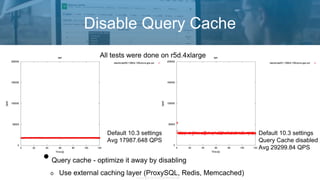
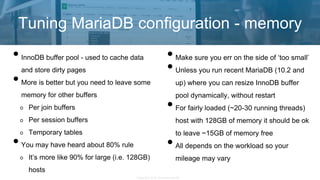
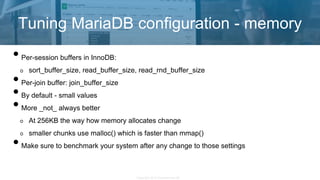
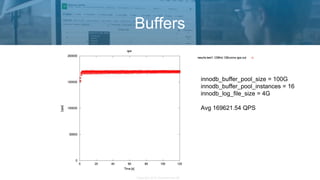
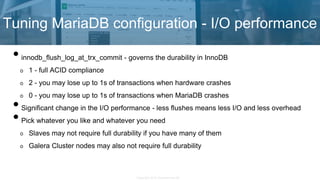
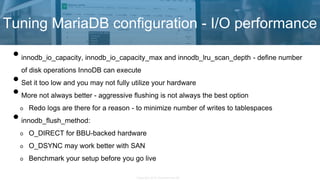
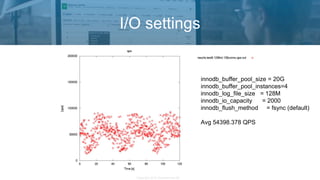
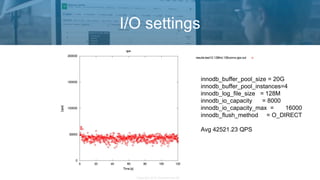
The document outlines best practices for tuning MariaDB performance, emphasizing the importance of a systematic approach tailored to specific workloads. Key topics include configuration adjustments, memory and I/O settings, and the role of Innodb internals in performance bottlenecks. The tuning process should be iterative, involving controlled changes and benchmarking to understand impacts effectively.


![[DSC Europe 25] Mikhail Rozhkov - AI Product Canvas: From Business Goals to T...](https://cdn.slidesharecdn.com/ss_thumbnails/d53doddtpgfqivmzqel6-mikhail-rozhkov-ai-product-canvas-v1-260121115910-9dd517a7-thumbnail.jpg?width=640&height=640&fit=bounds)


![[DSC Europe 25] Gordana Milutinovic Dumbelovic - From Insight to Oversight: A...](https://cdn.slidesharecdn.com/ss_thumbnails/t7dkjsfxqwwzceropjv4-gordana-milutinovicdumbelovic-from-insight-to-oversight-ai-driven-power-bi-moni-260119121559-9e0bf11b-thumbnail.jpg?width=640&height=640&fit=bounds)
![[DSC Europe 25] Milos Belcevic - Product Professional's Journey to Full-Stack...](https://cdn.slidesharecdn.com/ss_thumbnails/1zovd6fgsycdg4wvgvls-milos-belcevic-product-professionals-journey-to-full-stack-product-developer-260123083019-d993120d-thumbnail.jpg?width=640&height=640&fit=bounds)
![[DSC Europe 25] Laila Kakar - Leveraging AI for Strategic Excellence: Enhanci...](https://cdn.slidesharecdn.com/ss_thumbnails/eykmhrtsqmaaftwkexh7-dsc-lailakakar-1-260119101520-5f3b5616-thumbnail.jpg?width=640&height=640&fit=bounds)
![[DSC Europe 25] Marcos Heidemann - Beyond the Hype: Making AI Coding Assistan...](https://cdn.slidesharecdn.com/ss_thumbnails/eexkhvldrjsopspdjbur-marcos-heidemann-beyond-the-hype-getting-real-value-out-of-ai-assisted-coding-260121115910-7e9d41ec-thumbnail.jpg?width=640&height=640&fit=bounds)

![[DSC Europe 25] Borko Kozomora - Optimizing business workflows with advances ...](https://cdn.slidesharecdn.com/ss_thumbnails/hbgekyb0txw0xpo4yfml-borko-kozomora-leading-ai-transformation-260122103838-cc29ee38-thumbnail.jpg?width=640&height=640&fit=bounds)


![[DSC Europe 25] Josip Saban - Career building for data professionals.pptx](https://cdn.slidesharecdn.com/ss_thumbnails/zroflcttkm1vmli0txea-josip-saban-career-building-for-data-professionals-260123083019-587cdb8c-thumbnail.jpg?width=640&height=640&fit=bounds)
