Download to read offline


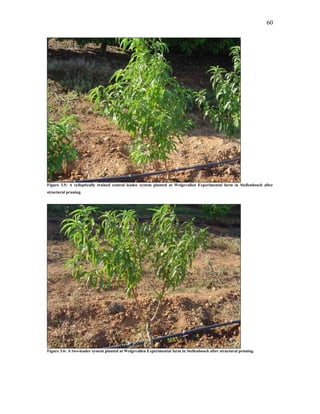
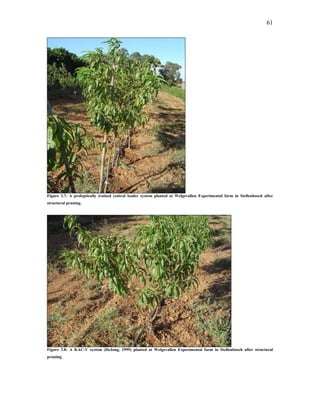
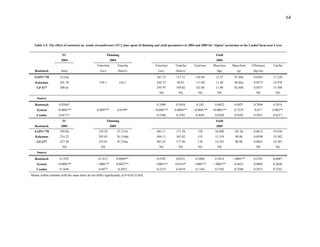
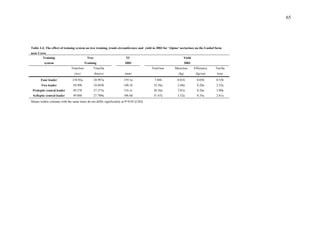
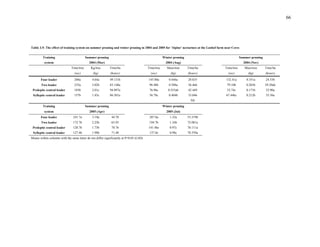
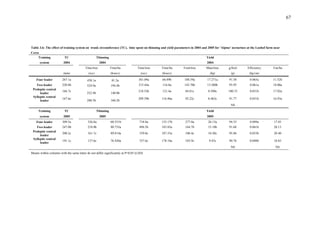
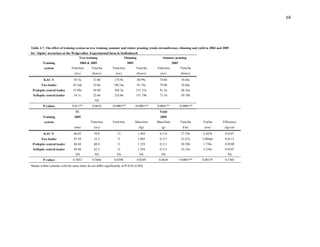
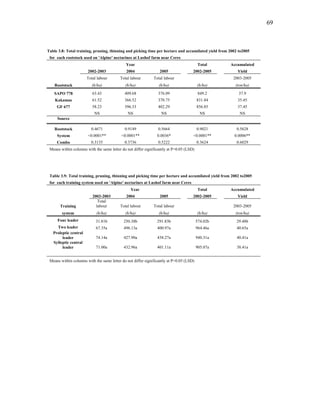
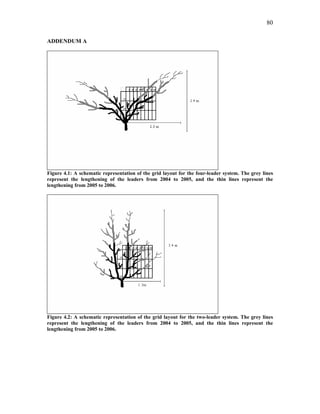
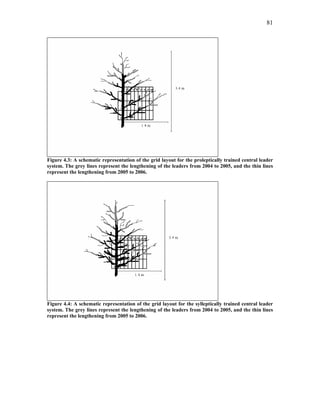
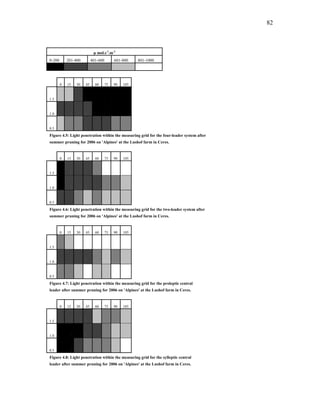
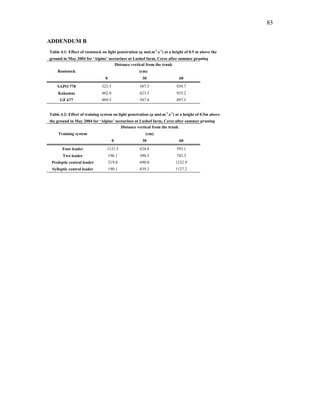

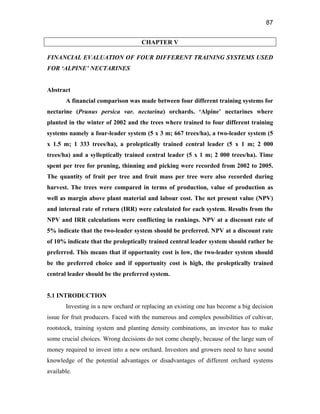


This thesis evaluates different training systems and rootstocks for 'Alpine' nectarine production in terms of production, labor requirements, and financial efficiency. 'Alpine' nectarines were planted using four training systems (four-leader, two-leader, proleptically trained central leader, and sylleptically trained central leader) on three rootstocks (GF 667, SAPO 778, and Kakamas seedling). Data on yield, fruit size, labor, and light penetration within the canopy were collected. An economic analysis found that according to the internal rate of return, the four-leader system was preferred, but the net present value calculation found the two-leader system was preferred when
![[19437714 hort technology] effects of early tree training on macadamia prod...](https://cdn.slidesharecdn.com/ss_thumbnails/19437714-horttechnologyeffectsofearlytreetrainingonmacadamiaproduction1-210914075421-thumbnail.jpg?width=640&height=640&fit=bounds)


![[19437714 hort technology] effects of early tree training on macadamia prod...](https://cdn.slidesharecdn.com/ss_thumbnails/19437714-horttechnologyeffectsofearlytreetrainingonmacadamiaproduction1-210914080218-thumbnail.jpg?width=640&height=640&fit=bounds)
![[19437714 hort technology] effects of early tree training on macadamia prod...](https://cdn.slidesharecdn.com/ss_thumbnails/19437714-horttechnologyeffectsofearlytreetrainingonmacadamiaproduction-210914080722-thumbnail.jpg?width=640&height=640&fit=bounds)


